Abstract
In recent years, coal mine methane measurement techniques in mines have been gaining importance as poor firedamp control in work can cause the interruption of production and even fatal accidents. Since there is currently a variety of methane measurement equipment with different functional characteristics and measurement principles, a study is needed to indicate which type of equipment has the highest degree of confidence. This research presents the results of a study carried out by the Official Laboratory J. M. Madariaga (LOM) of the Polytechnic University of Madrid that aims to analyze the reliability of methane detection systems used in underground mining. Therefore, a series of portable and non-portable methane detectors with different measurement principles have been selected to subject them to laboratory tests following the methods described in the applicable regulations, such as time of response, dust effect, temperature, pressure, etc. The test equipment is usually the one used in the certification and calibration of these devices, subject to the LOM quality system. The results of these tests allowed for defining a marking system that led to a ranking of the tested methane detectors in order to find the advantages and disadvantages of each type. From the performed tests, a summary of the main sources of sensor inaccuracy was reported. It was found that catalytic sensors might present significant deviations when testing high concentrations in short periods of time or low concentrations during long periods of time. On the other hand, devices with an interferometric sensor can be unreliable as the measures are very sensitive to changes in environmental conditions, and optical sensors present longer response times than catalytic sensors.
1. Introduction
At present, it is urgent to reduce carbon emissions to flatten the effect of global warming. In recent years, there has been a doubling of efforts to mitigate the human impact through the Great Agreements and government environmental policies. In order to reach the 2050 emission reduction targets, countries have been acting, especially in the field of energy [1]. The share of renewable energies in the energy mix is growing year by year, which is helping to reduce carbon emissions effectively. Unfortunately, the energy sector is heavily dependent on global geopolitics. The European Union was expected to have the largest drop in coal production with 82 million tons less, along with the largest projected reduction in coal consumption of 101 million tons, a 23% decrease, as 15 countries in the bloc signed the COP26 pledge [2]. However, coal use cannot be 100% ruled out at this stage [3].
Coal remains the world’s largest source of electricity generation, accounting for 36% of the total in 2022, according to the Global electricity review (2022) [4]. The main coal producers are China, India, the United States, Indonesia, Australia, and Russia. Coal consumption rose up to 450 million tons or around 6% over the past year globally, according to the International Energy Agency (IEA) in a report by Visual Capitalist [5]. In contrast to other countries, India will see the largest increase in production by 2024 [6], with an increase of 162 million tons, and will account for 12% of global coal production. It will lead India to become the second largest coal producer, right after China, which will produce 50% of the fuel globally [7].
The combustion and extraction of coal produce greenhouse gas emissions, mainly carbon dioxide (CO2), methane (CH4) and nitrous oxide (N2O). Coal extraction releases methane that is self-generated and stored in coal pores during mining operations [8,9]. Methane is the second most abundant anthropogenic greenhouse gas, and it is 23 times more pollutant than carbon dioxide [10]. Moreover, its flammable nature makes it the main hazard to mining operations. The flammability limits of methane are between 5 and 15%. In order to ensure safe operation in underground mining activities, the coal mine methane (CMM) must be measured, controlled and, if possible, removed [11,12]. In this context, CMM can be understood as a low-carbon and clean natural gas resource with huge reserves [13]. Hence, methane extraction from mines is essential for coal mining safety but also a necessary path for reducing methane emissions [14,15].
Currently, there are numerous inactive mines worldwide, which continue to release methane into the atmosphere. This problem has already been addressed in the previously published literature, especially regarding countries such as China [14,16,17]. In many cases, despite its advantages, methane capture is not carried out because it is not regulated. In Europe, a regulation on methane emission reduction in the energy sector has been proposed that directly addresses this problem. The proposal identifies the lack of regulation regarding “oil and fossil gas exploration and production, fossil gas gathering and processing, transmission, distribution, underground storage, and liquid fossil gas (LNG) terminals, as well as operating, closed or abandoned coal mines” and proposes specific measures [18].
Firstly, Member States are required to make publicly available an inventory of all closed and abandoned coal mines. This inventory must be updated annually with the CH4 measurements recorded in these mines. In addition, each Member State will have to draw up a CMM mitigation plan. Until 2030, venting and flaring will be allowed; however, these methods will be banned after 2030 [19].
The measuring equipment most commonly used are methanometers, which determine the methane content in the mine air. There are different types of methanometers depending on their measuring principle. Historically, the most used are catalytic combustion, infrared, and optical methanometers. In addition to these methods, there are more innovative methods [20,21], such as prediction models [22]. Nevertheless, catalytic combustion is the most widely used method, as it is reliable and economical. Accuracy is one of the most relevant parameters when selecting measuring equipment, specifically when used in explosive atmospheres [23]. Generally, measuring equipment is selected considering its accessibility and cost [24]. However, the deviation in the calibration curve is essential to ensure optimum functionality. Functionality tests can be carried out by comparing the results of different tests, the most relevant of which are flow rate, dust effect tests, time of response, calibration curve, temperature, pressure, relative humidity, air speed rate, residual effect, long term stability test and interfering gases. Such tests do not only provide information on the correct functioning of a mehtanometer but can also be used to select optimal and accurate technologies [25]. However, there are very few studies that conducted this experimentally. Experimental comparison and functionality of methane sensors in mines could contribute to an increase in safety in mining operations.
It is necessary to conduct a comparison between the main measurement principles used in methane measurement equipment (different measurement sensors), analyzing their global performance and functionality, and taking into account the different conditions of use [26].
Hence, this research focuses on comparing catalytic combustion, infrared and optical methane sensors to ease a fine selection of the best measurement principle based on the foreseeable use conditions. By means of detailed experimentation, parameters such as calibration linearity, accuracy and measurement deviations are defined for each apparatus studied in the present research. Therefore, this study focuses on the analysis of 6 non-portable and 10 portable methane devices with different types of methane sensors installed. Tests on flow rate, time of response, calibration curve, dust effect, temperature, pressure, relative humidity, air speed rate, residual effect, long-term stability test and interfering gases are carried out for each measuring device. Therefore, the aim of this research is also to experimentally establish the comparison of the level of functionality of three of the main methane measurement principles available.
2. Materials and Methods
Laboratory tests have been designed and carried out to verify properties such as drift; behavior against high concentrations; response times; heating time in air and gas; gas operation time; calibration curve; repeatability of results; and behavior in the face of variations in various magnitudes of influence such as pressure, humidity, temperature, air velocity, dust concentration, and the existence of interfering gases.
All tests were carried out following the test methods described in standard EN 60079-29-1 [24], which is one of the harmonized standards of Directive 2014/34/EU of the European Parliament and of the Council of 26 February 2014 on the harmonization of the laws of the Member States relating to equipment and protective systems for use in potentially explosive atmospheres.
2.1. Samples
Functionality tests were applied on 16 methane measurement devices; 6 are non-portable, and 10 are portable. The measuring principles used by the devices are catalytic combustion (pellistor), infrared absorption and interferometry [27].
A pellistor or catalytic sensor is a coil of platinum wire with a catalyst inserted inside that reduces the temperature at which the gas around it ignites. When a combustible gas is present, the temperature and resistance of the catalyst increase. The difference between the measure and the initial resistance allows the gas level to be measured [28].
This type of sensor can be used when several flammable gases are present because correction factors can be used to calculate the response of these gases. They are also very advantageous in areas that are difficult to access because they can be operated from a local control panel. However, this type cannot be used in low-oxygen environments, as they need oxygen for combustion. They also may lead to malfunctions when used in environments susceptible to poisoning or inhibition and when exposed to high gas concentrations. Pellistor sensors cost less than other sensors due to their technology but require more frequent replacement.
An infrared (IR) sensor is based on the principle that infrared light of a certain wavelength will be absorbed by the target gas. These sensors have two emitters; the first one generates the infrared light beam absorbed by the gas, and the second one is a reference beam that will not be absorbed. The intensity difference between the measurement and the reference beams is used to measure the concentration of the gas [29]. This type of sensor can be used in oxygen-deficient environments and does not present a risk of poisoning or inhibition. In contrast, in environments with several flammable gases, IR sensors only give a response to the target gas because they do not have a linear output, and correction factors cannot be applied. They are also susceptible to mechanical shock, thermal shock and sudden pressure changes.
A gas sensor based on an integrated optical interferometer absorbs the gas to be measured through a sensitive film, which changes its refractive index with absorption. The optical principle of the interferometer is the same as that of the infrared [30]. The phase of the interferometer is measured continuously and changes according to the refractive index of the film. In this way, the concentration of the target gas can be measured. This interferometer sensor has similar uses to the infrared sensor discussed above.
The following table (Table 1) shows the sixteen methane measurement devices tested in this research.

Table 1.
Sensors tested.
2.2. Equipment
The equipment used for the tests belongs to the Laboratory of Gas Detectors of the Laboratorio Oficial J.M. Madariaga (LOM). LOM laboratory is accredited by the Spanish National Accreditation Body (ENAC), in which certification works of conformity to standards and calibrations of devices for the detection and measurement of gas concentrations are usually carried out. This equipment is subject to the quality system of the laboratory and is, therefore, properly calibrated and maintained.
The main equipment is the system for manufacturing gas patterns using mass flow controllers, which applies the procedure described in EN-ISO 6145-7 [31] for the manufacture of gas mixtures. On the other hand, there are two climatic chambers, one for carrying out pressure tests and the other for carrying out temperature, humidity, and air speed tests.
2.3. Fucntionality Tests
All the test conditions are displayed in the Supplementary Material. Table 2 summarizes the tests carried out together with a short description and the limit established in standard EN 60079-29-1 (if applicable). This section then provides functionality tests with a complete description.
Table 2.
Functionality tests.
2.3.1. Flow Rate
The flow rate was carried out to check the data supplied by the manufacturer, as well as to verify the optimum flow rate zone. All methanometer devices had a nominal calibration flow rate or a range of flow rates supplied by the manufacturer, which is recommended for the calibration of the equipment. The test started by passing a gas flow rate of 50 mL/min with a volumetric concentration of 1.5% vol. through the sensor and waiting for the reading to stabilize. The procedure was repeated for flow rates of 250 mL/min, 500 mL/min, 750 mL/min and 1000 mL/min. Variation in flow rate was performed using mass flow controllers.
The flow rate test was required to know the possible influence of this variable on the tests and calibrations carried out in the laboratory when the gas is supplied to the sensor through a calibration mask. This is the usual method of application in the laboratory. This test was not included by the standards because it does not affect the way of measuring under real mine conditions.
2.3.2. Time of Response
Time of response was performed to determine the time it takes for the devices to reach the new stable reading in the event of a sudden change in methane concentration. The start-up was carried out in clean air. After at least twice the warm-up time, it was subjected to a sudden change from clean air to methane in 1.5% vol. concentration. The evaluation was carried out with the times t50 and t90, which are the times it takes for the reading to reach 50% and 90% of the final concentration. The EN 60079-29-1 standard establishes criteria of t50 ≤ 10 s and t90 ≤ 30 s.
Ideally, in the event of a sudden change in gas concentration, the equipment should respond instantaneously, as the delay in measurement increases the time in which a hypothetical alarm would be triggered, thus increasing danger and decreasing safety.
In the case of gas concentrations that continuously change over time, a high response time causes the measurements to have an additional error due to the delay in the reading. This occurs for different reasons, mainly due to the time it takes for the gas to diffuse to the sensor or to fill the measuring chamber.
2.3.3. Calibration Curve
The purpose of the calibration curve test is to obtain the accuracy of the readings of the methanometers. The closer the calibration curve is to the ideal straight line, the more accurate the reading of the device tested will be. The first step was the initial adjustment of the device. After the initial adjustment, the device was exposed to four volumetric concentrations of methane in the measuring range (0.5% vol.–3.5% vol.). The results were evaluated with the EN 60079-29-1 standard, which sets the largest deviation at ±0.1% vol. methane or ±5% of the indication.
When applying low concentrations, small resolution errors were detected. Those errors were heavily increased when assessing high concentrations. On the other hand, applying high concentrations led to significant errors when measuring small concentrations due to the lack of linearity. Therefore, the adjustment was carried out using 1.5 and 2.5% vol. points. The different concentrations were obtained by mixing 5% vol. bottled methane with synthetic air using the method described in EN-ISO 6145-7. The accuracy of methane and air flow rate measurements was obtained with uncertainties lower than 1% relative to the measured reading, leading to final concentration uncertainties around 1.5%.
2.3.4. Dust Effect
Coal dust suspended in the mine air sticks to the filters and the external surface of the sensor, especially near the miner in the advancing phase and after blasting in the sinking phase, making it difficult for the gas to enter the sensor. This is equivalent to a decrease in the gas inlet cross-section. The test consisted of checking how the calibration curves and response times vary when simulating the presence of dust by reducing the diffusion surface to 50%. The same procedure of these tests was followed but reduced the inlet cross-section by half. Currently, this test is not required by the EN 60079-29-1 standard, although it was in older versions.
The times are taken from the moment gas is supplied to the mask. The evaluation of the response time is carried out with the times t50 and t90 in the presence of dust and comparing them with the original values of t50 and t90. In the test, readings were taken up to five minutes, although they can be considered stable after three minutes.
2.3.5. Temperature
A temperature test was carried out to check variations in measurement due to temperature differences between calibration and use conditions. The devices were placed in a test chamber. The temperature was regulated with a heating resistor installed in a fan and controlled by a digital PID controller with a resolution of 0.1 °C. Each temperature was maintained for at least one hour. The readings were taken with dry gas to avoid variations due to relative humidity. The readings were taken at 10 °C, 25 °C and 40 °C, with approximately constant atmospheric pressure. The EN 60079-29-1 standard establishes that variations in the −20 °C to 40 °C range (compared to the measurement obtained at 20 °C) shall not exceed the greater of ±0.3% vol. or ±15% of the reading.
The importance of the temperature test lies mainly in two factors. The first is that the sensors are not always calibrated in the atmospheric conditions to which they are subjected when operating in the mine, which would imply a loss in the accuracy of the measurement that, in some cases, can be substantial. The second refers to portable devices, which are exposed to different atmospheric conditions while they are operating inside the mine, with the same consequences as in the previous case. Temperature, absolute pressure, and relative humidity are the most important environmental variables that condition the reading.
2.3.6. Pressure
The pressure test is similar to the temperature test. The sensors were tested in a pressure test chamber controlled by a back pressure regulator. The readings were taken at different pressures ranging from 800 mbar to 1200 mbar, maintaining constant temperature and relative humidity. The EN 60079-29-1 standard establishes that variations in the range of 80 kPa to 120 kPa (compared to the obtained measurement at 100 kPa) must not exceed the greatest between ±0.2% vol. and ±30% of the reading.
As mentioned in the previous test, pressure is a fundamental variable in the measurement conditions of the devices. The interest in this test is increased in the case of use in mining since every 100 m of depth increases the atmospheric pressure by approximately 1%. These variations, together with pressure variations due to weather conditions, can lead to considerable errors in some sensors.
2.3.7. Relative Humidity
The variation in the readings of the methanometers was checked when gas relative humidity (RH) was modified. The devices were placed in the test chamber at a temperature of 40 ± 1 °C and held for at least one hour before the gas was introduced. Readings were taken using dry gas (1% RH) and two humidities (40% RH and 90% RH) once the humidity of the gas had stabilized. These conditions are slightly different from those established by the standard EN 60079-29-1 (variations in the range from 20%RH to 90%RH concerning that obtained at 50%RH), as before 40%, no significant change was observed.
The test was carried out at 40 °C as at this temperature, and water vapor pressure was three times greater than at 20 °C, so the possible adverse effects of humidity can be detected.
2.3.8. Air Speed Rate
Due to the pressure waves exerted by the detonation of the explosives or the expansion of the compressed air, the air speed rate changes instantaneously for a very short period of time. The effects of variations in the air speed were determined, in the interval from 0 m/s to 6 m/s, comparing the measurement for 0 m/s with the measurements for 3 m/s and 6 m/s.
The sensitivity of the sensors to these variations in air speed rate was analyzed. They were tested in a chamber equipped with a centrifugal fan, which provides a laminar flow. Measurements were taken with clean air and 1.5% vol. methane, obtained by mixing 5 % vol. bottled methane with the ambient air of the chamber. The orientation of the sensor concerning the flow is the one established in EN 60079-29-1 standard, recommended by the manufacturer for non-portable devices and each of the three mutually perpendicular directions for portable devices. The tolerances allowed by the standard allow a maximum of ±0.1% vol. methane or ±5% of the indication.
2.3.9. Residual Effect
High methane concentrations should be avoided as they might produce explosive atmospheres, displace oxygen, produce asphyxia, and break sensors and equipment, etc.
Therefore, this test was performed to check for a possible residual effect on the sensor due to exposure to high concentrations. The equipment was subjected to a sudden change from clean air to 50% vol. methane for three minutes. The equipment was then left in clean air for 20 min, and at the end, the readings were taken again in clean air and methane in 1.5% vol. concentration. EN 60079-29-1 standard states that the variation between the beginning and the end of the test should not exceed the greatest between ±0.1% vol. methane or ±10% of the indication.
2.3.10. Long Term Stability Test
Prolonged exposure of a methanometer to a certain concentration of firedamp causes deviations in its calibration curve. First, device calibration curves were analyzed, and in order to evaluate deviations, exposures to three different test gases were carried out: methane 1.5% vol. for 6 h, methane 3.5% vol. for 1 h and methane 1–1.5% vol. for 10 days. At the end of each exposure, the response curve was measured again. The autonomy of any portable methanometer is always less than 10 days, and therefore, this test was not carried out for this type of sensor.
2.3.11. Interfering Gases
Interfering gases test was performed to evaluate how the methanometers behave when there are significant concentrations of other gases or when the amount of oxygen has changed significantly. The interfering gases tested were the following: presence of ethane (C2H6), oxygen deficiency (O2), presence of carbon dioxide (CO2), all three of which were included in the standard, as well as the presence of sulfur dioxide (SO2), chosen because it is a poison for catalytic combustion sensors. The gases common to all the mixtures were 5% vol. bottled methane and bottled synthetic air. In addition, each of the mixtures included, respectively, ethane 1.53% vol. in air, nitrogen 100% vol. (used to cause the oxygen deficiency in the air), carbon dioxide 100% vol. and sulfur dioxide 1.6% vol. in air. For the test, the detector was left in clean air for one day beforehand. The methane in 1.5% vol. concentration was then passed over it for five minutes, and the reading was recorded. Afterward, synthetic air was passed through the sensor for another five minutes, and finally, the mixture with the interfering gas was passed through the sensor for another five minutes, recording the reading given by the methanometer. The difference between the two readings gives the deviation experienced by the methanometer for that type of gas. EN 60079-29-1 standard states that the variation in the test should not exceed ±0.2% vol. methane.
3. Results
3.1. Flow Rate
Flow rate results are plotted in Figure 1, where the methane measurement (% vol.) is plotted against the gas flow (expressed in mL/min) for each sensor. The sensors that do not appear in the graphs do not have signal variation with gas flow.
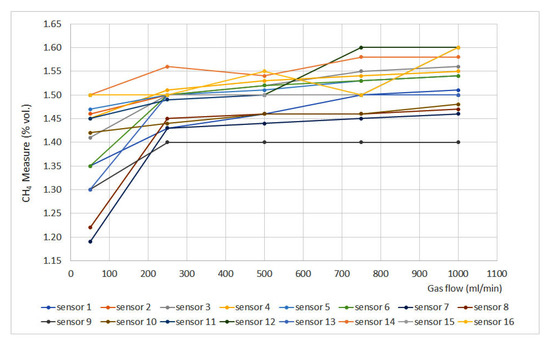
Figure 1.
Flow rate results.
It can be seen that when gas flow is lower than 250 mL/min, there is a lack of stability which is reduced when gas flow is set at 500 mL/min. After that point, most of the sensors provide stable measurements, except numbers 1, 12, 14 and 16, as their measurements show important fluctuations. Nevertheless, most of the sensors present a tendency to increase measurement as gas flow increases. Regarding sensor type, it can be noticed that it does not present an effect on the flow rate results, as similar deviations can be found when assessing catalytic, infrared and interferometer sensors. As this test was not included in the standard EN 60079-29-1, no maximum deviations were defined. Nevertheless, a significant variation would be considered if the deviation exceeded ±0.1% vol.
3.2. Time of Response
The time of response results are plotted in Figure 2 and Figure 3, where methane measurement (% vol.) is plotted versus time. Furthermore, two important parameters were defined: t50 and t90, which are the times at which 50% and 90%, respectively, of the final gas concentration, are achieved. Those parameters are shown in Table 3.
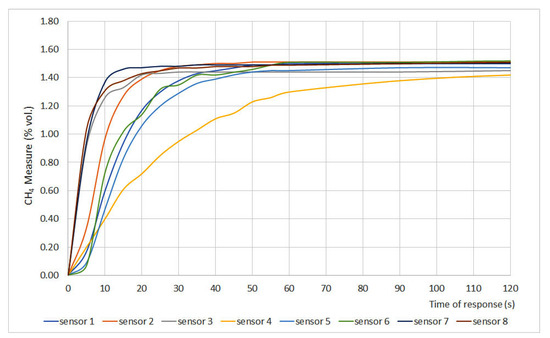
Figure 2.
Time of response for sensors 1 to 8.
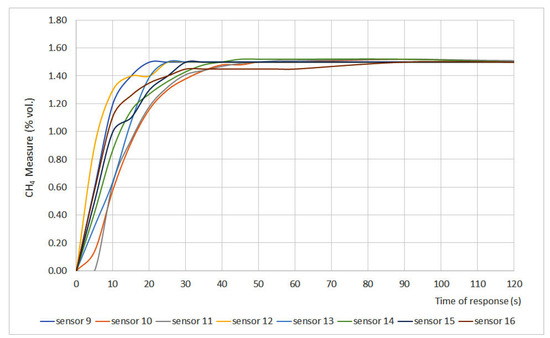
Figure 3.
Time of response for sensors 19 to 16.
Table 3.
Times at which 50% and 90%, respectively, of the final gas concentration, are achieved.
The time of response depends on different variables such as measurement principle, filters, inlet gas flow, size of the sensor, etc. However, the most important factor is the required time for the gas to present a stationary concentration inside the measurement chamber. Therefore, t50 and t90 are the most representative parameters. The EN 60079-29-1 standard establishes that sensors should present t50 ≤ 10 s and t90 ≤ 30 s. Considering those values, the studied sensors can be classified into three different categories:
- Fast sensors: sensors whose t50 and t90 values fit the range defined by the standard. Sensors 2, 3, 7, 8, 9, 12, 14 and 16 can be classified as fast sensors.
- Normal sensors: sensors whose t50 is greater than 10 s but their t90 is lower than 30 s. Sensors 1, 10, 11, 13 and 15 can be classified as normal sensors.
- Slow sensors: sensors whose t50 and t90 values do not fit the range defined by EN 60079-29-1. Sensors 4, 5 and 6 can be classified as slow sensors.
When assessing sensor type, it was noticed that both infrared (6 and 15) and interferometer (4 and 5) sensors showed the greatest times of response, which can be explained due to the measurement chamber size. The chamber volume of these sensors is greater than the one in catalytic sensors, so the gas needs more time to distribute uniformly in the chamber, which leads to greater times of response.
The differences between interferometer sensors can be explained due to the fact that sensor 4 is equipped with a gauge while sensor 5 presents a digital display. The physical characteristics of the sensor also explain why sensors 1, 10 and 11 showed t90 values close to the 30 s limit. Those values can be explained due to the presence of a protective cap for the sinter in sensor 1 and the pellistor design for sensors 10 and 11.
3.3. Calibration Curve
The results of the calibration can be seen in Table 4 and Table 5. Standard EN 60079-29-1 establishes that the maximum allowed deviations are ±0.1 methane % vol. or ±5% deviation. When calibrating at 1.5% vol., sensors 1, 2, 9, 12, 13, 14 and 15 showed values greater than the maximum allowed deviations. More specifically, the greatest deviations were found at 3.5% methane, which could be explained due to the resolution of the sensors, which is 0.1 % vol. for most of the sensors, and the noise associated with the measurements that can lead to exceeding the limit deviation.
Table 4.
Calibration curve—adjustment at 1.5% vol. CH4.
Table 5.
Calibration curve—adjustment at 2.5% vol. CH4.
On the other hand, when calibrating at 2.5% vol., better results were found, as maximum allowed deviations are only exceeded by sensors 2, 5 and 10. Moreover, the greatest deviations were produced at 3.5% vol. methane and also at 1.5% vol. methane. However, at 2.5% vol. methane concentrations, the lowest deviations were found.
3.4. Dust Effect
The dust effect has been assessed through calibration and response time tests. As the effect on calibration was not significant, the present section focuses only on the effect on response time. The results are shown in Table 6, where t50p, t90p and Δt90 (which refers to the difference between t90p and t90) are reported.
Table 6.
Dust effect results.
From the obtained results, it was noticed that the gas inlet surface does have a significant effect besides sensors 6, 9 and 15.
Older versions of standards specified that Δt90 should not exceed 10 s, which allows classifying the sensors into three different groups:
- Sensors with low dust sensibility: sensors whose Δt90 is significantly lower than 10 s. This group includes sensors 2, 3, 4, 5, 7, 8, 10, 13 and 16.
- Sensors with normal dust sensibility: sensors whose Δt90 is lower than the maximum allowed value but close to the limit. This group includes sensors 1, 11, 12 and 14.
- Sensors with high dust sensibility: sensors whose Δt90 is higher than the maximum allowed value. This group includes sensors 6, 9 and 15.
3.5. Temperature
Figure 4 and Figure 5 display the obtained results for the temperature test, plotting temperature vs. methane concentration (% vol.). Figure 4 represents the curves for 0% vol., while Figure 5 represents the curves for 1.5% vol. The sensors that do not appear in the graphs do not have signal variation with temperature, either for the 0% vol. point or for the 1.5% vol. point.
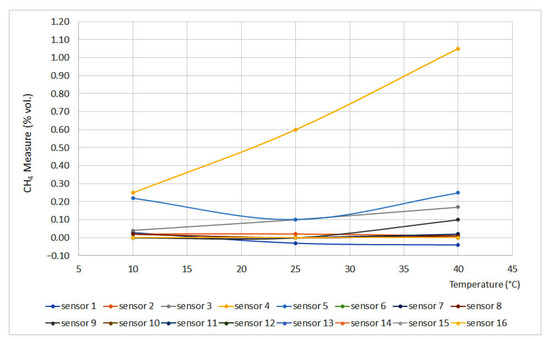
Figure 4.
Temperature curves for 0% vol. (Some measures present the same data, therefore some lines are overlapped).
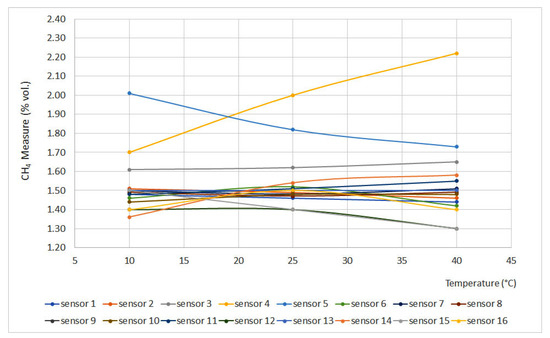
Figure 5.
Temperature curves for 1.5% vol.
From the curves, it is easy to see important deviations in sensors 4 and 5. This can be explained as a temperature increase without pressure modification leading to a density decrease, which produces great deviations when testing interferometer sensors.
On the other hand, catalytic sensors presented small deviations as the test temperature increase is not significant if compared to the temperature reached on the surface of the pellistor. Except for sensors 3 and 14, the deviation did not exceed 0.05% vol.
Infrared sensors (6 and 15), due to their measurement principle, should provide measures that would increase a line of 0.10% vol. for each 20 °C increase. However, these sensors are equipped with a temperature sensor that compensates for signal variations, providing reliable measurements.
From the results, it can be inferred that sensors 3, 4, 5 and 14 should be calibrated at temperatures similar to the operating temperatures. A similar deduction can be made for infrared sensors that are not equipped with a temperature sensor.
3.6. Pressure
Figure 6 and Figure 7 plot pressure curves depending on the methane concentration (% vol.) for 0% vol. and 1.5% vol., respectively. The sensors that do not appear in the graphs do not have signal variation with pressure, either for the 0% vol. point or for the 1.5% vol. point.
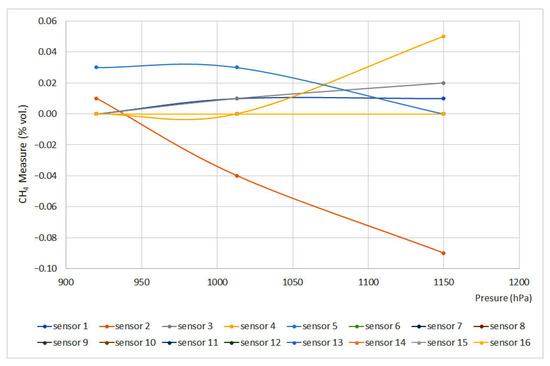
Figure 6.
Pressure curves for 0% vol. (Some measures present the same data, therefore some lines are overlapped).
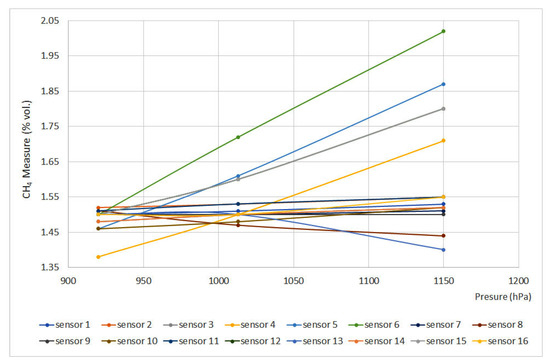
Figure 7.
Pressure curves for 1.5% vol.
The EN 60079-29-1 standard defines that deviation should not exceed ±0.2%(vol.), which means that, except for sensors 5 and 6, every sensor met the requirements. Nevertheless, sensors 12 and 15 showed important deviations. When using infrared and interferometer sensors, the provided signal is proportional to the number of molecules per volume unit or molar concentration, which are directly proportional to partial pressure and total pressure. On the other hand, as happened when testing temperature, catalytic sensors provided the slightest deviations.
3.7. Relative Humidity
Figure 8 and Figure 9 show methane concentration measurement vs. relative humidity for 0% vol. and 1.5% vol. concentrations, respectively. The sensors that do not appear in the graphs do not have signal variation with relative humidity, either for the 0% vol. point or for the 1.5% vol. point.
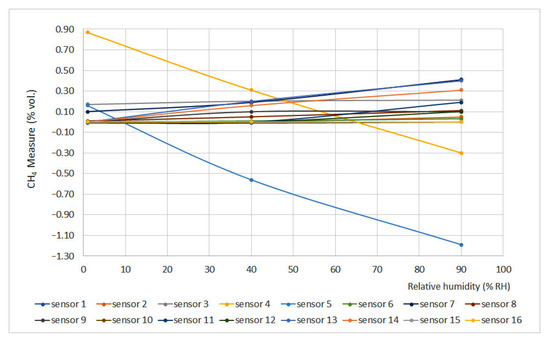
Figure 8.
Humidity curves for 0% vol.
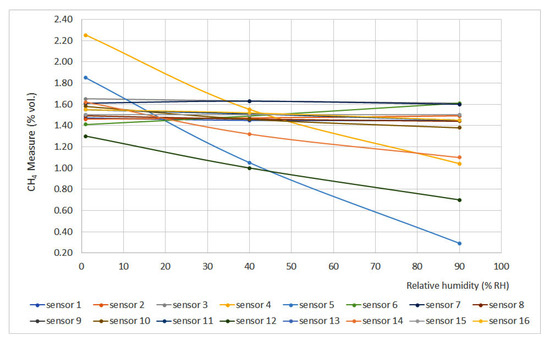
Figure 9.
Humidity curves for 1.5% vol.
Relative humidity increase produces gas dilution, which heavily affects infrared sensors as infrared light absorption is influenced by water vapor presence. On the other hand, humidity produces an important effect on interferometer sensors as the presence of water vapor modifies the refraction index if compared to air conditions.
If the limits defined by the EN 60079-29-1 standard are considered (±0.2% vol.), it can be noticed that several sensors did not meet this requirement (sensors 4, 5, 12, 13, 14 and 16), and others were too close to the limit (sensors 7 and 11). In general terms, non-portable sensors provided better results.
3.8. Air Speed Rate
Figure 10 shows methane measurement vs. air speed rate at 1.5% vol. The sensors that do not appear in the graphs do not have signal variation with air speed rate.
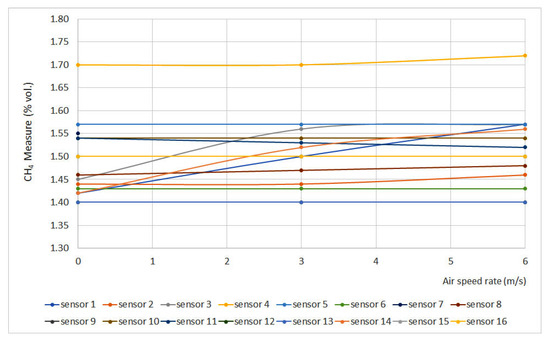
Figure 10.
Air speed rate results. (Some measures present the same data, therefore some lines are overlapped).
In general terms, it can be noticed that air speed rate does not produce a significant effect on sensor measurements, except for sensors 1, 3 and 14, which did not meet the requirements established in EN 60079-29-1 (±0.1% vol.). As those sensors are catalytic sensors, they provide measurements by combusting methane from the atmosphere, and air speed rate might induce measurement errors.
3.9. Residual Effect
Table 7 shows the results of the residual effect assessment. Besides sensor 10, every sensor provided reliable results, as maximum detected deviations were ± 0.08% vol. Optical sensors (infrared and interferometer sensors) provided lower deviations than catalytic sensors as there is no sensor aging.
Table 7.
Residual effect results.
3.10. Long Term Stability
Regarding long term stability, as mentioned before, portable sensors have autonomy for no longer than 10 days. Therefore, only sensors installed on non-portable devices were tested. Long term stability tests were carried out by exposing the sensors for 1 h, 16 h and 10 days. During expositions, similar measurements were found before and after the exposition; thus, in order to have a better understanding of the deviation-aging effect, a 10-day exposure was carried out. The results of this exposure are plotted in Figure 11.
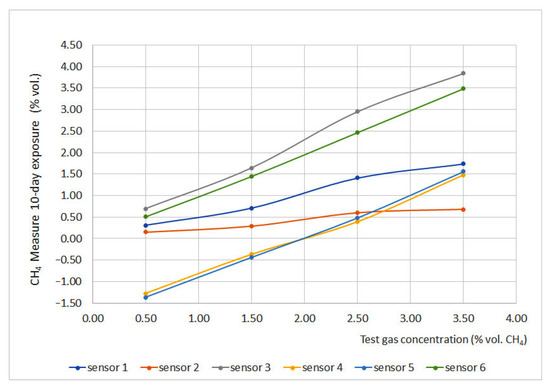
Figure 11.
Long term stability results.
Sensors 3 and 6 presented the best results, and sensor 6 deviation was very close to 0. On the other hand, sensors 1 and 2 presented the highest deviations; moreover, after the test, sensor 2 could not be fixed again to provide reliable measurements. Sensors 4 and 5 produced important deviations due to the progressive filling of the chamber, which means that this perturbation could be avoided if the zero is set at the proper value or if waiting enough time to refill the chamber with clean air.
3.11. Interfering Gases
The results for deviations produced by the presence of SO2, CO2, C2H6 and O2 default are plotted in Figure 12, Figure 13, Figure 14 and Figure 15, respectively.
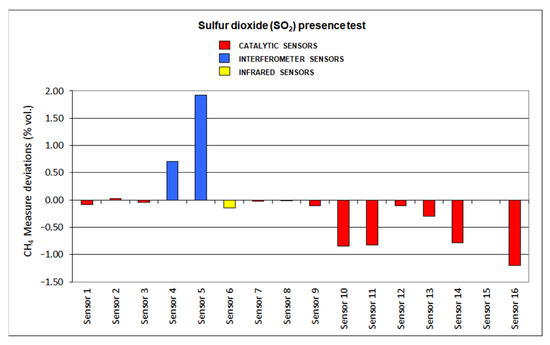
Figure 12.
Sulfur dioxide presence results.
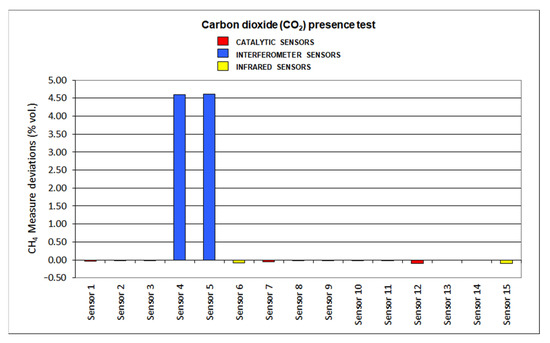
Figure 13.
Carbon dioxide presence results.
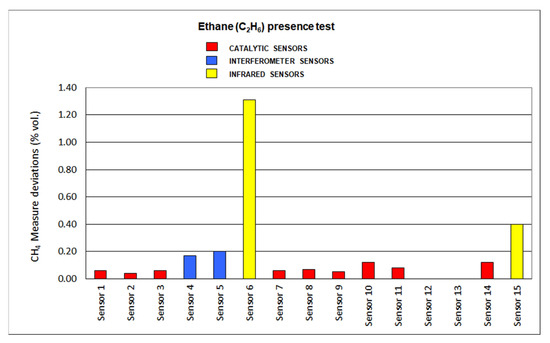
Figure 14.
Ethane dioxide presence results.
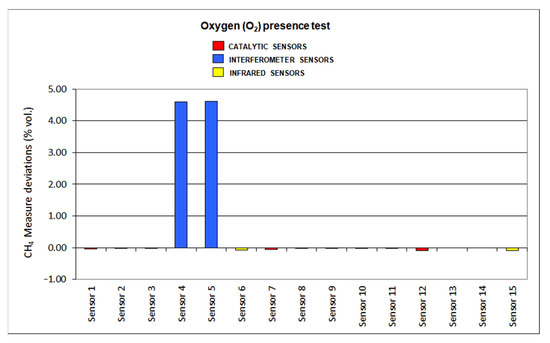
Figure 15.
Oxygen presence results.
Most of the sensors showed significant deviations when tested in the presence of sulfur dioxide. SO2 might interfere with the catalytic oxidation that is produced in the pellistor (sometimes even producing irreparable damages) of the catalytic sensors. Nevertheless, interferometer sensors also produced important deviations. Infrared sensors showed the slightest deviations as the SO2 adsorption range is not close to the methane range.
As carbon dioxide is an inert gas, no important effect was detected when testing catalytic sensors (deviations < 10%). A similar fact was noticed when infrared sensors were considered: deviations are greater than the ones found at catalytic sensors as the CO2 absorption range locates at 4.25 μm and methane at 3.32 μm. However, deviations were lower than 10%. On the other hand, interferometer sensors cannot be used in the presence of CO2 as they showed high deviations (even over 200%).
Deviations produced by ethane presence are not significant when assessing catalytic sensors, as all of them are lower than 10%. Slight increases were found in every sensor as it is a combustible gas. On the other hand, infrared sensors show important deviations when using this gas, as the absorption range of C-H locates close to the methane absorption range. Interferometer sensor deviations are greater than catalytic sensors but not as important as infrared sensors.
When reducing oxygen in the atmosphere, catalytic sensors provide negative deviations as the combustion in the pellistor is reduced, and so is the temperature increase. On the other hand, infrared sensors are not influenced by oxygen default, as those sensors presented low deviations: sensor 6 shows a 3% deviation and sensor 15 a 0% deviation. When assessing interferometer sensors, great positive deviations were found as sensor 4 shows almost 73% deviation and sensor 5 around 93% deviation.
4. Discussion
Regarding the tests, important results were obtained. When carrying out sensor calibration, it was noticed that deviations between the two adjustment points (zero and sensibility) showed slight variation regarding the adjustment gas. Nevertheless, as the sensor ages and readjustments are carried out, the calibration curve varies, and over the sensibility adjustment point, the curve might increase or reduce its inclination while the points located between the two adjustment points show less deviation.
Therefore, it is recommended to calibrate sensors at concentrations close to 2.5% vol., which is typically the average full-scale point. Nevertheless, if the sensor maintenance is frequent, it is more recommended to carry out calibration at the first alarm concentration value (typically around 1.5% vol.) so measurements close to this value will have a small error associated. Portable sensors should be calibrated at similar concentrations to the ones that are intended to measure in order to avoid deviations due to differences in the calibration gas concentrations.
Regarding the dust effect test, the results were significantly positive, as most of the sensors were classified as “sensors with low dust sensibility”.
As a general trend, it can be said that the variations in the methanometer readings with temperature are relatively small and always lower than those defined in the standards. It was expected that the effect of temperature would be small in the case of catalytic combustion sensors, and this has been confirmed by the test results. On the other hand, the variation for the interferometer sensors is almost exactly as predicted, taking into account that an increase in temperature at constant pressure implies a decrease in density. Finally, in the case of infrared sensors, without acting on the temperature sensor readings, it is essential to calibrate the devices at the temperature corresponding to the work area.
Regarding the pressure test, with the data obtained, all the equipment complies with the standard except the interferometric sensor (nº 5) and the infrared sensor (nº 6). In addition, it should be noted that sensors 15 (infrared) and 12 (pellistor) are significantly affected by the pressure variation, which is why they pass the standard criteria with difficulty. In the case of catalytic combustion sensors, the calibration pressure is less important, although it is always advisable to carry it out at the working pressure.
To a first approximation, the expected variation in response for all devices except interferometric devices should follow the dilution pattern produced by humidification. As we can see from the results, the factors involved are much more complex, given the circumstance that in the sensors with pellistor, the deviations of sensors 7, 10, 12, 13, 14 and 16 are significantly greater than in the rest. In the case of interferometrics, the presence of water vapor with a refractive index very different from that of air produces a strong variation in the response. In the case of infrared sensors, the decrease in response to increasing humidity is related to the absorption of infrared light produced by water vapor.
In general, it can be said that the sensors tested are practically insensitive to variations in air speed, except in the case of sensors 1, 3 and 14, all three of which are catalytic combustion. This is because the pellistors need to consume methane from the air to carry out the measurement, and the variation in the air speed causes differences in the diffusion of the gas through the sintered element towards the interior of the sensor in which the pellistor is housed.
Regarding the residual effect test, the sensors behaved well, except sensor 10, of the catalytic type, which exceeded the allowed deviations. In the case of interferometric and infrared sensors, the residual effect is practically nil since the aging of the sensor does not occur as in the case of catalysts, nor is the filling of the measurement chamber with high-concentration methane irreversible, emptying perfectly for the next few minutes.
Regarding the long-term stability test (10 days), it is worth noting the magnificent behavior of sensor 6 with the infrared measurement principle, which, both before and after the test, has practically zero deviations. On the contrary, the catalytic sensors nº 1, 2 and 3 present important deviations. The behavior of interferometric sensors nº 4 and 5 is peculiar since they produced high deviations due to the progressive filling of the reference chamber with methane. This disturbance can be eliminated instantly by adjusting the zero reading to the correct value.
When analyzing the results of the interfering gas test, the following aspects should be highlighted. Infrared sensors have significant deviations due to the presence of ethane since the C-H absorption band of this gas is very close to the corresponding infrared absorption band of methane, which is found at 3.32 μm. The catalytic sensors present negative deviations due to the lack of oxygen since this causes the combustion in the pellistor to decrease and, therefore, the temperature increase in it is lower. The drift caused by carbon dioxide in the interferometric sensors is the highest among all the drifts caused by the interfering gases tested in the sixteen sensors. In general, most of the sensors tested suffer significant deviations due to the presence of sulfur dioxide, with infrared sensors showing the least deviation due to their presence.
As a final summary of the analysis of the interfering gas test results, we can say that the interferometric sensors are the ones that have suffered the greatest deviations, since their measurement is significantly affected by all the gases tested in these tests and, therefore, it is the least suitable type of sensor when the presence of any of these gases is significant in the mine atmosphere at any time. Regarding the catalytic sensors, in general, it can be concluded that they suffer small deviations except in the case of sulfur dioxide, which is a poison. Lastly, infrared sensors only see their measurement significantly affected by the presence of ethane, their deviations for the rest of the interfering gases tested being less than 10%, and therefore, they are the most suitable detectors for use in atmospheres of changing mine.
Based on the results of the tests, the degree of compliance with the requirements established by the standards can be defined. Figure 16 and Figure 17 show the different test results in terms of the percentage of detectors that fulfill the requirements. From these plots, it is easily noticed that portable detectors provide better results than non-portable detectors, as most of the portable detectors meet the requirements for each test.
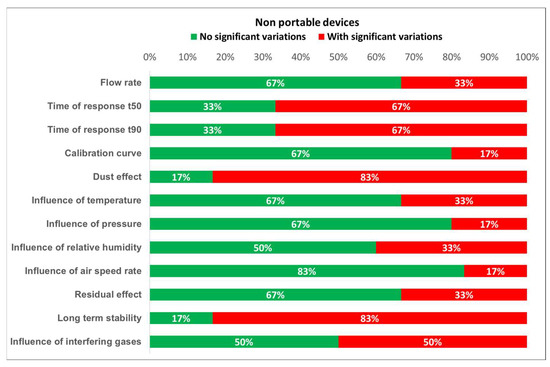
Figure 16.
Detected variations for non-portable devices.
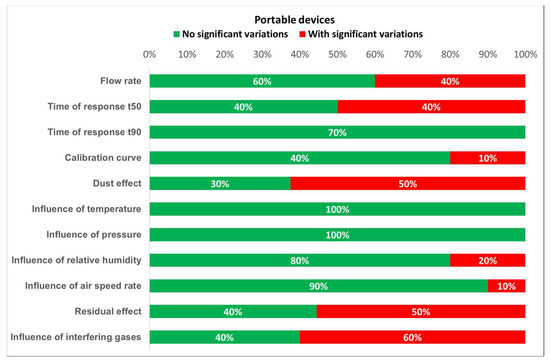
Figure 17.
Detected variations for portable devices.
Furthermore, the worst results for both portable and non-portable equipment are produced when testing time of response, relative humidity, dust effect, and interfering gases. Moreover, non-portable sensors show inadequate results for long term stability. However, the number of portable and non-portable detectors was not the same, so comparing test results percentages might induce an important error. Therefore, every single result should be properly addressed.
In order to make a final assessment of the degree of reliability of each methane sensor tested, a scoring system was created. The system assigns positive or negative points to each device, depending on the results obtained in each of the previously mentioned tests. Positive points are assigned if the devices do not have significant variations with respect to the criteria of EN 60079-29-1 or the requirements proposed in the present study. Zero points are given if the result is close to the required limit and negative points when the maximum deviations are exceeded.
The global results of the application of these criteria to the evaluation of all the tested sensors are represented in Figure 18 (where 10 is the maximum possible rate).
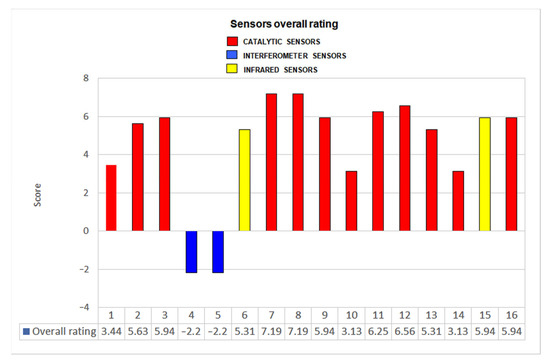
Figure 18.
Overall rating for each sensor.
5. Conclusions
It is essential to systematically verify the accuracy, using a concentration in which it is desired that the errors are minimal (1.5% vol., or another), which in the case of fixed installation devices must be carried out in situ. Routine calibration and adjustment performed in the laboratory are desirable, using various concentrations that should be at least 0.0% vol., 1.5% vol. and 2.5% vol. Given the lack of general linearity of all the measurement principles, the adjustment must be made for that concentration in which it is desired that the errors be minimal.
In general, the calibration and adjustments must be carried out in environmental conditions (pressure, temperature, and relative humidity) close to those of device operation, although in some cases, it is not necessary. In the case of interferometric sensors, it is essential to carry out an additional “zero” adjustment once it has stabilized inside the mine.
After subjecting the catalytic sensors to high concentrations (>50% vol.) for a short period of time (3 min) or too-low concentrations (1.5% vol.) for long periods (10 days for the fixed ones) in some cases, deviations greater than 1% vol. occur. for a test gas of 1.5% vol., which proves the need for periodic adjustment and calibration of these devices.
Once the adjustment has been made with the corresponding methane concentration, after being used in the operating regime in the mine, the portable and transportable devices should automatically return to the supervision system. In the event that the deviations in the reading exceed ±0.2% vol., the apparatus must be adjusted.
To ensure the correct operation of the fixed equipment, it is necessary to periodically inspect their readings, comparing them to those provided by a portable methanometer, and, in the event that the deviations are greater than ±0.1% vol., proceed to a new adjustment that improves measurement accuracy.
Devices with an interferometric sensor are unreliable since their readings are very sensitive to changes in environmental conditions (pressure, temperature, and relative humidity) and to atmospheric factors such as the presence of other interfering gases and the variation in oxygen concentration.
Most catalytic combustion sensors are reliable under normal operating conditions. This is because they are robust against climatic changes. However, exposure to high or prolonged concentrations, which is usual in underground mining work fronts, methane, and also exposure to other gases, means that, in the best of cases, the readings lose accuracy and must be adjusted.
The response times of most fixed sensors and some portable ones are excessive, although most of them comply with the more permissive criteria of EN 60079-29-1. The tested optical sensors have longer times than those obtained for the catalytic combustion sensors.
The use of infrared sensors is recommended because the variations in the reading due to changes in climatic conditions are such that they can be safely used when they are adjusted in conditions of pressure, temperature, and relative humidity close to those of operation equipment, and do not have significant interference effects with other gases.
Finally, the main sources of equipment inaccuracy can be summarized in the following table (Table 8).
Table 8.
Main sources of inaccuracy detected.
Supplementary Materials
The following supporting information can be downloaded at: https://www.mdpi.com/article/10.3390/en16052207/s1, Table S1: Detailed score results.
Author Contributions
Conceptualization, J.L.L.-B. and L.M.; methodology, J.L.L.-B.; software, D.L.; validation, J.L.L.-B., B.C. and I.A.; formal analysis, J.L.L.-B. and B.C.; investigation, B.C. and I.A.; resources, I.A. and D.L.; data curation, J.L.L.-B.; writing—original draft preparation, D.L.; writing—review and editing, B.C. and I.A.; supervision, L.M.; project administration, J.L.L.-B. and L.M. All authors have read and agreed to the published version of the manuscript.
Funding
This research received no external funding.
Data Availability Statement
Not applicable.
Conflicts of Interest
The authors declare no conflict of interest.
References
- Solano Rodriguez, B.; Drummond, P.; Ekins, P. Decarbonizing the EU energy system by 2050: An important role for BECCS. Clim. Policy 2017, 17 (Suppl. S1), S93–S110. [Google Scholar] [CrossRef]
- Jonek-Kowalska, I. Towards the reduction of CO2 emissions. Paths of pro-ecological transformation of energy mixes in European countries with an above-average share of coal in energy consumption. Resour. Policy 2022, 77, 102701. [Google Scholar] [CrossRef]
- Zafrilla, J.E. The mining industry under the thumb of politicians: The environmental consequences of the Spanish Coal Decree. J. Clean. Prod. 2014, 84, 715–722. [Google Scholar] [CrossRef]
- Zieliński, M.; Fletcher, J.; Ewen, M.; Fulghum, N.; Tunbridge, P.; Jones, D.; Lolla, A.; Candlin, A.; Worthington, B.; Moore, C.; et al. Global Electricity Review. Available online: https://ember-climate.org/insights/research/global-electricity-review-2022/#supporting-material-downloads (accessed on 22 April 2022).
- International Energy Agency. World Energy Outlook 2019; International Energy Agency (IEA): Paris, France, 2019; ISBN 978-92-64-97300-8. [Google Scholar]
- Edwards, G.A. Coal and climate change. Wiley Interdiscip. Rev. Clim. Chang. 2019, 10, e607. [Google Scholar] [CrossRef]
- Wang, D.; Nie, R.; Long, R.; Shi, R.; Zhao, Y. Scenario prediction of China’s coal production capacity based on system dynamics model. Resour. Conserv. Recycl. 2018, 129, 432–442. [Google Scholar] [CrossRef]
- Karacan, C.Ö.; Ruiz, F.A.; Cotè, M.; Phipps, S. Coal mine methane: A review of capture and utilization practices with benefits to mining safety and to greenhouse gas reduction. Int. J. Coal Geol. 2011, 86, 121–156. [Google Scholar] [CrossRef]
- Karacan, C.Ö. Modeling and analysis of gas capture from sealed sections of abandoned coal mines. Int. J. Coal Geol. 2015, 138, 30–41. [Google Scholar] [CrossRef]
- Uliasz-Misiak, B.; Misiak, J.; Lewandowska-Śmierzchalska, J.; Matuła, R. Environmental Risk Related to the Exploration and Exploitation of Coalbed Methane. Energies 2020, 13, 6537. [Google Scholar] [CrossRef]
- Krause, E.; Krzemień, K. Methane Risk Assessment in Underground Mines by Means of a Survey by the Panel of Experts (Sope). J. Sustain. Min. 2014, 13, 6–13. [Google Scholar] [CrossRef]
- Brune, J.F.; Saki, S.A. Prevention of gob ignitions and explosions in longwall mining using dynamic seals. Int. J. Min. Sci. Technol. 2017, 27, 999–1003. [Google Scholar] [CrossRef]
- Haiwen, W.; Changjiang, L. Process parameters design method of drainage gas recovery technology in gas-driven pump for coalbed methane production. J. Pet. Sci. Eng. 2021, 207, 109167. [Google Scholar] [CrossRef]
- Zheng, C.; Jiang, B.; Xue, S.; Chen, Z.; Li, H. Coalbed methane emissions and drainage methods in underground mining for mining safety and environmental benefits: A review. Process Saf. Environ. Prot. 2019, 127, 103–124. [Google Scholar] [CrossRef]
- Gatnar, K.; Tor, A. Drainage and economic utilization of methane from coal seams in the Jastrzebie mining-field. Appl. Energy 2003, 74, 331–341. [Google Scholar] [CrossRef]
- Beckmann, S.; Luk, A.W.; Gutierrez-Zamora, M.-L.; Chong, N.H.; Thomas, T.; Lee, M.; Manefield, M. Long-term succession in a coal seam microbiome during in situ biostimulation of coalbed-methane generation. ISME J. 2019, 13, 632–650. [Google Scholar] [CrossRef] [PubMed]
- Zhao, W.; Su, X.; Xia, D.; Hou, S.; Wang, Q.; Zhou, Y. Enhanced coalbed methane recovery by the modification of coal reservoir under the supercritical CO2 extraction and anaerobic digestion. Energy 2022, 259, 124914. [Google Scholar] [CrossRef]
- Sawyer, W.J.; Genina, I.; Brenneis, R.J.; Feng, H.; Li, Y.; Luo, S.-X.L. Methane emissions and global warming: Mitigation technologies, policy ambitions, and global efforts. MIT Sci. Policy Rev. 2022, 3, 73–84. [Google Scholar] [CrossRef]
- European Commission. Proposal for a Regulation of the European Parliament and of the Council on methane emissions reduction in the energy sector and amending Regulation (EU) 2019/942. Off. J. Eur. Union 2021, 423, 1–49. [Google Scholar]
- Zhang, X.; Wang, S. Design a wireless sensor network for methane monitoring system. In Proceedings of the 2008 6th IEEE International Conference on Industrial Informatics, Daejeon, Korea, 13–16 July 2008; pp. 614–618. [Google Scholar]
- Zhang, X. Automatic Calibration of Methane Monitoring Based on Wireless Sensor Network. In Proceedings of the 2008 4th International Conference on Wireless Communications, Networking and Mobile Computing, Dalian, China, 12–14 October 2008; pp. 1–4. [Google Scholar]
- Kurnia, J.C.; Sasmito, A.P.; Mujumdar, A.S. CFD simulation of methane dispersion and innovative methane management in underground mining faces. Appl. Math. Model. 2014, 38, 3467–3484. [Google Scholar] [CrossRef]
- Karpov, E.F.; Basovsky, B.I.; Sobolev, V.V. Method of Metrological Check of Stationary Methanometers in Automatic Systems of Mine Atmosphere Monitoring. IFAC Proc. Vol. 1995, 28, 315–319. [Google Scholar] [CrossRef]
- Wei, L.; Shengfei, Q.; Guoyi, H.; Yanjie, G. Accumulation of water-soluble gas by degasification: One of important mechanisms of large gas accumulations in the Xujiahe Formation, Sichuan Basin. Pet. Explor. Dev. 2011, 38, 662–670. [Google Scholar] [CrossRef]
- Xuhui, Z. Evaluation and testing of an intelligent methane detecting system. Procedia Eng. 2011, 15, 3843–3847. [Google Scholar] [CrossRef]
- Aldhafeeri, T.; Tran, M.K.; Vrolyk, R.; Pope, M.; Fowler, M. A review of methane gas detection sensors: Recent developments and future perspectives. Inventions 2020, 5, 28. [Google Scholar] [CrossRef]
- Dücso, C.; Ádám, M.; Fürjes, P.; Hirschfelder, M.; Kulinyi, S.; Bársony, I. Explosion-proof monitoring of hydrocarbons by mechanically stabilised, integrable calorimetric microsensors. Sens. Actuators B Chem. 2003, 95, 189–194. [Google Scholar] [CrossRef]
- Schierbaum, K.D.; Weimar, U.; Göpel, W.; Kowalkowski, R. Conductance, work function and catalytic activity of SnO2-based gas sensors. Sens. Actuators B Chem. 1991, 3, 205–214. [Google Scholar] [CrossRef]
- Shemshad, J.; Aminossadati, S.M.; Kizil, M.S. A review of developments in near infrared methane detection based on tunable diode laser. Sens. Actuators B Chem. 2012, 171, 77–92. [Google Scholar] [CrossRef]
- Jin, W.; Stewart, G.; Culshaw, B.; Murray, S.; Pinchbeck, D. Absorption measurement of methane gas with a broadband light source and interferometric signal processing. Opt. Lett. 1993, 18, 1364–1366. [Google Scholar] [CrossRef]
- ISO 6145-7:2018; Gas Analysis—Preparation of Calibration Gas Mixtures Using Dynamic Methods—Part 7: Thermal Mass-Flow Controllers. International Organization for Standardization: Geneva, Switzerland, 2018.


Disclaimer/Publisher’s Note: The statements, opinions and data contained in all publications are solely those of the individual author(s) and contributor(s) and not of MDPI and/or the editor(s). MDPI and/or the editor(s) disclaim responsibility for any injury to people or property resulting from any ideas, methods, instructions or products referred to in the content. |
© 2023 by the authors. Licensee MDPI, Basel, Switzerland. This article is an open access article distributed under the terms and conditions of the Creative Commons Attribution (CC BY) license (https://creativecommons.org/licenses/by/4.0/).