Abstract
Presently, hydrogen-fuel-cell medium-duty trucks utilize two or more modular proton exchange membrane fuel-cell stacks due to package space and economic concerns. The fuel-cell system of medium-duty trucks requires high power demand under a regular driving schedule. Since the high power demands produces significant heat generation within a very small packaging space, thermal management is crucial for maintaining the performance and long term durability of medium-duty trucks. This study was designed to investigate the various cooling configurations of dual stacks to understand the dual-stack response under thermal management conditions. A dynamic fuel-cell system model is developed to investigate the layout effect of the cooling system under load follow-up. Three different layouts of cooling system were investigated such as series cooling, parallel cooling, and two independent cooling modules with minimum cooling components. The results show that the series cooling system shows a minimum overshoot and undershoot by step change of the stack due to a cooling capacity. The cooling parasitic energy consumption is also minimized with the series cooling system
1. Introduction
Due to the design specifications of the logistics industry, the heavy weight of trucks requires higher power than regular passenger vehicles. It does not have to be swiftly moved. Those industrial requirements prefer to adopt a diesel powertrain system. However, the truck industry is required to employ alternative powertrain systems to cope with climate change. Since vehicular CO2 emissions are approximately one-third of global CO2 emissions and high-power sources exhaust more CO2 into the air, the power source of trucks is required to adopt an alternative powertrain with zero emission characteristics.
As an alternative power source, a hydrogen fuel cells have environmental advantages such as non-toxic exhaust gas emission and CO2-free power generation. A proton exchange membrane fuel cell is used for vehicles to secure high power and reliability under dynamic load variation. Currently, the hydrogen-fuel-cell car is the focus in the passenger car market as an alternative vehicle to accommodate climate change. Recently, climate change has motivated the adoption of the proton exchange membrane fuel cell (PEMFC) for various types of transportation [1].
As the fuel-cell system is applied to truck power generation systems, it has a competitive cruise mileage compared to current vehicles and trucks with fuel-cell systems are then zero-emissions vehicle without any CO2 emission. A fast charging time and low noise level are other advantages. Since the fuel-cell truck is driven by an electric motor, the acceleration of the truck is fast enough.
Currently, even though a high power density should be required for trucks, it is very difficult to meet the power density with a fuel-cell system due to the small package space. Fortunately, the modular structure of fuel-cell systems gives a little variation inside the package space so that the space can be re-arranged for the power source. However, it is still very difficult to achieve a reliable cooling capacity within the very tight space limit. There are two constraints, namely the packaging space and the relatively minor ram air effects. Since the vehicle’s speed is relatively slower than that of passenger vehicles, the cooling system of a fuel-cell truck should equip a high-power cooling fan to achieve the cooling capacity.
As reported in the research literature on fuel-cell passenger vehicles, the appropriate thermal management of fuel-cell systems for fuel-cell vehicles determines the optimal power as well as reasonable longevity. However, the lower operating temperature of the fuel-cell stack requires a higher cooling capacity than a conventional vehicle. Furthermore, the hydrogen-fuel-cell truck typically requires a medium to high power demand for most driving modes. Since those operating loads generated heavier heat on most operating ranges, the cooling system should be designed to cool down the hot fuel-cell system under more challenging conditions.
A system model is a tool to understand the effect of various cooling layouts for a fuel-cell system. Chavan et al. constructed a mathematical model of a fuel cell based on MATLAB/SIMULINK® and conducted a study to analyze the performance according to some input variables such as the hydrogen flow rate, hydrogen humidity, and hydrogen partial pressure [2]. Omran et al. presented mathematical modeling of a proton exchange membrane fuel-cell (PEMFC) system integrated with a resistive load and used MATLAB/Simulink® to calculate the fuel-cell current and voltage under various steady-state conditions [3]. Various modeling approaches have reported on system modeling [4,5,6] to investigate the performance variation and dominant factors. Belhaj et al. investigated various models of polymer electrolyte membrane fuel cells, and more specifically three models of nonlinear state space models, general dynamic models integrated into MATLAB/Simulink®, and equivalent RC electrical circuits [7]. Yang et al. developed a comprehensive PEMFC system model that includes stacks, membrane humidifiers, electrochemical hydrogen pumps, air compressors, and radiators to investigate the interactions between the stacks and the associated auxiliary subsystems [8]. Other researchers have also conducted various studies on modeling of fuel cells [9,10]. These studies explain very well the basic modeling of fuel cells and the characteristics of fuel cells under various loads. Even though various investigations have been conducted in the literature, the transient response of a fuel-cell stack to cooling-system dynamics is rarely reported.
Pourrahmani et al. studied thermal management and optimal design using artificial neural networks, and also conducted studies on the effects of porous media in gas-flow channels in relation to the thermal management of PEMFCs [11,12]. Hu et al. established and enhanced the temperature-control model of the PEMFC cooling system through a series of experiments at different power levels for different temperatures, and developed optimal predictive control in the driving cycle [13]. Xing et al. proposed a new hybrid-vehicle model, including simulation of the driver behavior, vehicle dynamics, vehicle control, energy control, PEMFC stack, cooling system, battery, DC/DC converter, and motor. It also provided a theoretical basis for the thermal management of PEMFC stacks through stack-model-verification experiments [14]. Xing et al. developed a cooling-system simulation model for a vehicle PEMFC stack (30 kW) to evaluate system thermal analysis and management. They conducted a theoretical study to calculate the heat-dissipation requirements of vehicles for the design of the cooling system [15].
Even though various studies have been conducted on vehicular cooling systems of a modular fuel-cell stack, cooling-system studies of fuel-cell trucks are rarely reported. Furthermore, the layouts of fuel-cell systems for hydrogen-fuel-cell trucks have yet to be reported. In this study, the cooling-system layouts of the hydrogen truck are investigated to understand the proper layout to satisfy the cooling capacity with minimum parasitic loss. A dynamic dual-stack model with a cooling system is developed under MATLAB/Simulink® environment (R2022) to understand the effect of the cooling-system layout for dual-stack thermal management. Furthermore, three different layouts of the cooling system are studied: the series cooling circuit, the parallel cooling circuit, and the individual cooling circuit of each stack. The analysis is conducted using control target-comparison criteria, ITAE (integral of time-weighted absolute error). The consumption of parasitic power is also compared for each layout.
2. Modeling of the Fuel-Cell System
Different from the conventional truck, the power-generation system of a fuel-cell medium-duty truck is composed of two fuel-cell stacks with a battery [16]. Currently, the matured technology of the fuel-cell power-generation system can be found in passenger vehicles; a single stack of the dual-stack system is from the fuel-cell stack of a passenger vehicle. However, since the operating load and driving modes of a truck are very different than a passenger vehicle, the thermal management of the dual-stack system needed to be re-designed. The reference schematic of the dual-stack system is shown in Figure 1.

Figure 1.
Schematic diagram of a fuel-cell system with an auxiliary component.
Since the performance and durability of the fuel-cell stack are very sensitive to the operating temperature, each of the dual-stack temperatures needs to be controlled individually. The fuel-cell schematic shows the basic components of the dual-stack system, which has components for the air-supply system, hydrogen-supply system, and cooling system. In this study, the cooling-system configuration is mainly simulated to investigate the performance dependency via the operating strategy of the cooling system.
2.1. Fuel-Cell Stack Model
In this study, the fuel-cell stack is a simple extension of the unit fuel cell so that the computational load can be reduced. The species conservation of gases in the anode channel and cathode channel determines the concentration of gases at the exit of both channels. The gas flow in the cathode channel is composed of three elements. The gas-flow rates inside the cathode are expressed as:
The hydrogen from the supply tank is introduced into the anode channel. Even though the hydrogen gas is introduced into the anode channel without any humidification, the recirculation of the hydrogen gas makes humid hydrogen gas at the channel inlet. On the other hand, the vapor transport from the cathode side also increases the water concentration in the anode channel. Then, species conservation in the anode side can be expressed by:
The electrochemical reaction is calculated by the thermodynamic potential reduced by actual irreversible potential losses. The thermodynamic potential of the electrochemical reaction is calculated with the Nernst equation [17].
where is the stack temperature, is the partial pressures of oxygen, and is the partial pressure of hydrogen.
The actual cell voltage is calculated by considering the potential losses by irreversibility, which consist of the activation overpotential, concentration overpotential, and Ohmic overpotential. Thus, the actual potential of a single fuel cell can be obtained with the following equation:
In addition, the activation loss, the Ohmic loss, and the concentration loss can be obtained with the following equation:
where is the voltage drop of the zero current density, is the membrane thickness, is the membrane conductivity, and is the current density that causes a sudden voltage drop. The stack voltage is then obtained by the single-cell voltage multiplied by the number of fuel cells.
The parameters of the fuel-cell stack are shown in Table 1. Since the electric conductivity of the electrolytic membrane reacts sensitively according to the water concentration inside the membrane, it is important to properly manage the water concentration inside the electrolytic membrane. Springer et al. reported the water content to explain the water concentration of the electrolytic membrane [18]. The water content is defined as the water concentration to fixed-charge concentration inside the membrane electrolyte. The water contents are experimentally determined in terms of water activity [19].
where is the actual water-vapor partial pressure of the system, is the saturated water-vapor pressure of the system operating temperature, and is the average water content of the cathode and anode.

Table 1.
Parameters of single fuel-cell stack.
The water concentration in the electrolytic membrane is determined by the balance of two driving forces, namely, water back-diffusion and electro-osmotic drag. The water back-diffusion occurs in the anode by an electro-chemical reaction that increases the water concentration of the anode and is determined by the concentration difference between the anode and cathode. The electro-osmotic force occurs due to the voltage difference between the anode and the cathode during an electro-chemical reaction. The potential difference migrates the cation of hydrogen with water molecules from the anode to the cathodes. The water-diffusion coefficient of the electrolytic membrane was proposed as follows:
The water diffusivity ) is a function of the water content (), and is calculated as follows [20].
The water back-diffusion force is then calculated by
It is assumed that the water molecular weight carried for the water content () is linear, and the electro-osmotic drag coefficient is calculated by:
The electro-osmotic drag is then calculated
The balance of Equations (16) and (19) results in the water concentration in the electrolytic membrane. The conductivity of the electrolytic membrane was calculated by applying the water content to the experimental equation from the literature.
The transient response of the stack temperature is modeled with a lumped capacitance model. The energy balance of the fuel-cell stack considers the heat generation of the electrochemical reaction, the heat rejection by the coolant, the heat transfer to the ambient, and the heat transfer to the gases. The stack temperature is then determined by the balance of those driving forces:
In addition, the generated heat is released to the coolant, the reactant gases, and the vapor through each unit cell, and the outlet temperature of the fluid is obtained by:
where and are the heat-transfer coefficients of the gas and coolant, and the heat-transfer coefficient (h) is a function of the Nusselt number and the hydraulic diameter. The hydraulic diameter was calculated for the channel of the fuel cell, and the channel was designed in the form of a parallel serpentine channel by imitating the fin shape. This can be calculated as follows:
Figure 2 shows the validation of the model with an experiment. The PEMFC stack model is validated with an experiment that is operated at 343.15 K and 3 atm conditions. The validation shows that the errors in the polarization curves from the experiment are within 3%.

Figure 2.
Polarization curve for dynamic proton exchange membrane fuel-cell model validation.
2.2. Cooling-System Model
As fuel-cell trucks operate on the road, the fuel cell produces heat and electric work. The stack model includes the dynamic variation of the stack temperature in terms of the electrochemical reaction and the coolant flow. In addition, the physical characteristics of the coolant applied in this study are shown in Table 2.
Table 2.
Physical properties related to the coolant.
The electrochemical heat of the fuel cell is regulated by the cooling system. As the electric water pump is run, the coolant delivers thermal energy of the fuel cell to the radiator. At the radiator, the thermal energy of the fuel-cell stack is then rejected to the ambient environment. This systematic absorption and rejection of electrochemical heat results in stable temperature regulation of the fuel-cell stack. To achieve proper thermal management of the fuel-cell stack, some basic components are required and they show a dynamic response during the operation. In this study, the dynamic of the cooling system is considered in the reservoir, the pump actuator, and the fan actuator. On the other hand, heat rejection through the radiator is an important parameter of thermal management design. In this study, a comprehensive radiator model is developed to investigate the thermal management strategy of fuel cells. The radiator model consists of a tube, louver fins, a core, and other components (Table 3).
Table 3.
Specifications of the radiator components.
The heat rejection of the radiator can be expressed as follows [21]:
where is the overall heat, is total heat-transfer area, are the heat-transfer coefficients for the coolant and ambient air, respectively, and is the fin’s overall surface efficiency, defined as [21]:
where is the total surface area of the air side, and is the fin efficiency.
The heat-transfer coefficient on the air side inside the radiator is calculated by the geometric shape of the louver fin. The Colburn factor () is an empirical correlation with the louver fin. Therefore, the basic form of the Colburn factor can be expressed as follows [22]:
Thus, the heat-transfer coefficient on the air side is calculated as follows:
In addition, heat exchange on the coolant side occurs when the coolant flows into the tube of the radiator. The heat-transfer coefficient of the coolant in the tube is a function of the hydraulic diameter and the Nusselt number, and is given as follows:
where the Reynolds number is calculated with respect to the flow rate of the coolant, and the coolant flow rate is . The hydraulic diameter assumes that the tube is rectangular and is expressed as follows:
Thus, the heat-transfer coefficient on the coolant side is calculated as follows:
Even though each component in the cooling system has a short response time, the response of whole cooling system takes more time. This is because the total amount of coolant in the fuel-cell system results in a sluggish response under thermal-load change. In this study, a water reservoir is modeled to describe the sluggish response of the cooling system. The total mass of the coolant is 30 kg for a single stack. The lumped capacitance model of the reservoir is:
The thermal mass of the coolant () shows expediency of the cooling mass but also describes the difficulty of sensitive control of the system temperature by the coolant.
The three-way valve is a device to splits the coolant into a bypass and a flow for the radiator. Different from the thermostat of a conventional engine, the three-way valve of the cooling system is used to control the stack temperature precisely. Since the three-way valve operates swiftly, the actuator of the three-way valve is modeled as a PI controller. The split temperature after the three-way valve is then determined using the energy conservation law. If it is assumed that the specific heat () is constant in the three-way valve, then the mixed temperature after the three-way valve (Tmix) is shown as follows [23].
The target temperatures of the fuel-cell stack and coolant-inlet temperature were set to 343.15 K and 333.15 K, respectively. The retarded response of the water pump is explained by motor inertia and pump inertia. For simplification, the motor and pump inertia are tuned to explain the response of the water pump. While a cooling pump with a three-way valve delivers a hot coolant to the radiator, the cooling fan is used to reject the heat by the radiator.
Figure 3 shows the performance curves of the cooling fan and the water pump. The performance curve of the cooling-fan model was applied to the experimental data provided in the experiment [24]. In addition, the performance curve of the water pump model was obtained through the same procedure and applied based on the data applied to Yu et al. [25]. Each performance curve was then used to determine the flow rate of air and coolant through the pressure difference with motor RPM. The water-pump motor is an actuator that regulates the water-flow rate by detecting the coolant-inlet temperature. The cooling-fan motor also detects the stack temperature and regulates cooling air-flow rate.

Figure 3.
Determination of flow rate with the performance curve: (a) the fan performance curve, (b) the water pump performance curve.
Therefore, the flow chart of the fuel-cell system and the cooling system used in this study is shown in Figure 4. First, inside the fuel-cell system subjected to an input load, the stack temperature and the reservoir temperature can be obtained through heat generation of the stack by electrochemical reaction and the circulation of coolant. The temperature data are then transferred to the water pump, the cooling fan, and the three-way valve. These cooling-system actuators are controlled to track the target temperature, and this cycle is repeated.

Figure 4.
The flow chart of the fuel-cell system and the cooling system.
2.3. Layouts of the Cooling System
Since the coolant delivers the heat of the electrochemical reaction to the radiator and the radiator fan rejects the heat of electrochemical reaction to the atmosphere, the two-fuel-cell stack generates various combinations of heat delivery and heat rejection. One typical configuration is an individual cooling system for each stack, which can easily control the stack temperature. This layout requires more space to be installed. A series cooling system or a parallel cooling system are also candidate cooling-system layouts. For the three cooling-system layouts selected in this study, we compared the cooling performance, which varies depending on the system configuration and control target. The layouts of the cooling system are shown in Figure 5.
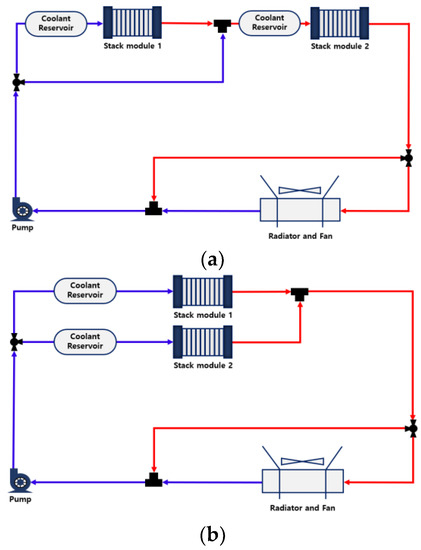

Figure 5.
Cooling-system arrangements: (a) series arrangement system, (b) parallel arrangement system, (c) individual cooling system.
When the series cooling system is applied, all of the coolant passes through the first stack, and then the coolant moves to the second stack. Since this connection can lower the stack temperature from the target value, a three-way valve has to be installed in front of first stack so that the some amount of coolant is split to the second stack without passing through the first stack. This role is important for the series cooling layout to maintain both stacks’ temperatures at the target value. The series cooling layout is shown in Figure 5a. On the other hand, when parallel cooling is applied for dual-stack systems, it is also necessary to place a three-way valve in front of the two stacks. The duty of the three-way valve is a little different, such that an exact amount of two-coolant flow should be split in the valve. Accordingly, the two stack temperatures are passively controlled by another three-way valve, cooling fan, and pump, which is shown in Figure 5b. The last layout of Figure 5c is the individual cooling system, in which two cooling systems are independent of each other.
3. Results and Discussion
3.1. Profile of Input Load and Temperature Response
The exothermal reaction of the proton exchange membrane fuel cell depends on the power demand. For safety criteria, the cooling capacity should satisfy the amount of heat generation for the rapid heat-up, and a step change is a good way to examine the performance of a cooling system. When the load demand is minimized, the stack temperature should be at equilibrium with the cooling capacity. In this study, the cooling-system performance is investigated with three different layouts under load variation. The load variation is shown in Figure 6, which shows the step-up and step-down of the electric load for 50% and 100%. Since the minimum operation of the components must be ensured, the minimum load is set to 10%. The step change of the electric load severely affects the stack temperature at the moment due to the sluggish response of the stack. The rapid rise of the load results in a high peak temperature of the stack, while a rapid drop of the load results in a low peak temperature.

Figure 6.
Profile of the current density of the simulation.
The stack temperature is controlled by the cooling pump and radiator fan. The series and parallel arrangements utilize a single pump, radiator, and fan and the individual cooling arrangement has a pump, radiator and fan for each individual stack. For the three different arrangements experiencing changes in the fuel-cell stack temperature and cooling temperature, Figure 7 shows the temperature response under load follow-up conditions. As mentioned before, the individual cooling system is a reference cooling arrangement for cooling performance. The other cooling arrangements should be compared with each other.

Figure 7.
Temperature of the stack and the coolant inlet according to arrangements (a) stack temperature, (b) coolant-inlet temperature.
Figure 7a shows the overshoot and undershoot of the fuel-cell stack temperature in three different configurations of the cooling system. A heavy load changes the results in the peak overshoot and deep undershoot. The temperature response of the first and second fuel-cell stacks have almost the same trajectory in parallel cooling and individual cooling, but individual cooling lowers the undershoot and overshoot for the same control algorithm. This is because the responses of the cooling components are faster for the individual cooling system. Even though the parallel cooling system is able to supply the same amount of coolant to each stack, a single cooling pump and radiator makes the response slow. Accordingly, parallel cooling has a more severe overshoot and undershoot. On the other hand, series cooling reduces the overshoot and undershoot of the first stack dramatically. It also shows that series cooling reduces the peak temperatures of the second stack. The total coolant flow to the second stack in the series connection is larger than the parallel and the individual cooling. This trend also changes the coolant temperature in three different configurations. Figure 7b shows the coolant-inlet temperature of the dual stack in three different cooling configurations. The coolant-inlet temperature is obtained right before the split of the coolant to the dual stack. Since the peak temperature of the coolant depends on the coolant flow rate, the peak temperature of each cooling system shows different trends. The individual cooling system shows the lowest peak temperature due to the ease of the coolant flow control. On the other hand, the parallel cooling system shows the highest peak temperature, which requires more coolant flow to each stack. The coolant temperature of the individual cooling system settles down swiftly because the inertia of the cooling pump is smaller than the parallel and series cooling system. Additionally, since the series and parallel cooling systems have the same-capacity coolant pump, the settled-down curve of the coolant-inlet temperature is in good agreement.
The cooling-pump controller observes the stack temperature, which is determined by the heat balance between the electrochemical reaction and the heat rejection. Since the load increase is a signal to increase the amount of heat generation, the cooling pump supplies more coolant to the fuel-cell stack. The patterns of coolant flow are shown in Figure 8. As mentioned, the coolant flow rate matches the profile of the electric load but a sluggish response is also observed due to inertia of the cooling pump.
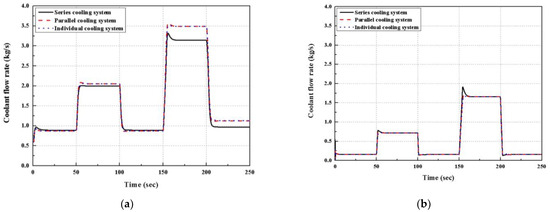

Figure 8.
Coolant flow rate supplied to the stack for three arrangements: (a) Coolant flow rate discharged from the pump, (b) Coolant flow rate supplied to stack module 1, (c) Coolant flow rate supplied to stack module 2.
Since the series cooling system is able to flow more coolant to the second stack, the total coolant flow rate from the pump is lower than the individual cooling system or the parallel cooling system. Figure 8a shows the coolant flow rate discharged from the pump and the total coolant flow rate to the dual stack. Figure 8b,c give the coolant flow rate supplied to stack module 1 and 2, respectively. As expected, the coolant flow rate to the first stacks of the three different cooling configurations has the same value except for the second peak. At the second peak, the series cooling shows more overshoot, which depends on the tuning gain of the feedback control. Except for that, the profile of the coolant flow agrees well across the various cooling systems. On the other hand, the series cooling is able to flow more coolant to the second stack, which is shown in Figure 8c. By increasing the coolant flow rate into the second stack, the temperature control of the second stack is obtained with a narrow temperature difference between the coolant inlet and the exit temperature.
3.2. Integral of Time-Weighted Absolute Error (ITAE)
In the fuel-cell system, the performance of the cooling system should be evaluated in two different categories. One is the peak undershoot and overshoot temperature during dynamic operation and the other is the variation in the stack temperature over various driving conditions. The integral of time-weighted absolute error (ITAE) is typically used in control-system design to evaluate the deviation of the output from the desired value. When the error is defined as the difference between the desired output and the actual output, the cumulative value of errors is known as the ITAE. The ITAE can quantitatively evaluate the responses of systems and effectively perform response satisfaction evaluation according to the control instructions [23]. In addition, the equation for the ITAE is as follows:
In particular, since the dramatic overshoot and undershoot of the stack temperature affects the durability of the stack, it is necessary to settle down the temperature smoothly. In this study, the ITAE was used to analyze the cumulative error of the stack temperature and the coolant-inlet temperature. The coolant-inlet temperature and coolant-outlet temperature makes the temperature distribution in the stack. When the temperature distribution is wide, it makes water management difficult. Accordingly, it is necessary to control the coolant-inlet temperature at the desired value over load changes.
Figure 9 shows the ITAE of the stack temperature. The parallel cooling system has a single pump, fan, and radiator, which creates a sluggish response over the load change. The ITAE of parallel cooling is then the highest of the three different cooling configurations. As the series cooling is applied, the coolant flow rate to the second stack is increased, which decreases the overshoot and undershoot of the stack temperature. This results in a faster temperature recovery of the serial cooling system and a better temperature control performance than other arrangements. The parallel cooling system and the individual cooling system have the same amount of coolant supplied from the water pump to each stack. Parallel cooling systems and individual cooling systems require a lot of coolant to keep each stack at 343.15 K. However, the series cooling system first supplies as much cooling water as necessary to cool stack module 1 first. Additionally, the high-temperature coolant passing at stack module 1 is mixed with the low-temperature coolant distributed by the bypass valve, which is supplied to stack module 2. Thus, the amount of coolant supplied per stack is larger than in other arrangements.

Figure 9.
ITAE of the stack temperature over three different configurations.
The coolant-inlet temperature of the individual cooling system is controlled by its own cooling fan and radiator, which allows swift control of the coolant-inlet temperature during load changes. Figure 10 shows the ITAE of the coolant-inlet temperature, which has the minimum ITAE for the individual cooling system. On the other hand, since the parallel cooling system has the largest undershoot and overshoot, the ITAE is the largest among the three different cooling configurations. As a result, it was confirmed that the control performance of the series cooling system was the best in the ITAE of the stack temperature, and the control performance of the individual cooling system was the best in the ITAE of the coolant temperature.

Figure 10.
ITAE of the coolant-inlet temperature over three different configurations.
3.3. Parasitic Energy Consumption of the Three Different Cooling Configurations
The parasitic cooling power consumption of the fuel-cell system is greater than the conventional system due to the thermal load. Parasitic energy refers to the accumulated amount of energy consumed during the operating time by integrating the power generated by the cooling system. Figure 11a,b show the parasitic power consumption of the cooling pump and fan, respectively.

Figure 11.
Parasitic energy consumption of the cooling system over three different configurations: (a) pump parasitic energy, (b) fan parasitic energy, (c) total parasitic energy.
When the pump supplies the coolant to the fuel-cell stack, the total coolant supply depends on the temperature difference between the coolant-inlet temperature and the stack temperature. As shown in Figure 8, the total coolant flow rate to the dual stack is minimized in the series cooling system, which results in the minimum parasitic energy of the cooling pump in the series cooling system. The other two cooling systems have the same amount of parasitic energy consumption for the cooling pump due to the equivalent amount of the coolant flow rate.
As explained above, the controller of the cooling fan maintains the coolant-inlet temperature at the desired set value, which implies the fan power depends on the operating conditions of the coolant-inlet temperature. Figure 11b shows the energy consumption of the cooling fan, which shows the minimum loss for the individual cooling system. It is also clear that the parallel cooling system has the most parasitic energy consumption. The total parasitic energy consumption is compared in Figure 11c. As expected, the series cooling system has the lowest energy consumption among the three systems. In particular, the parasitic energy consumption is dramatically increased at heavy-load operation due to the large heat generation. In such conditions, the series cooling system has the minimum energy consumption with a moderate gradient. Note that the enlarged coolant flow rate to the second stack decreases the parasitic energy consumption. It also accommodates the thermal management of the second stack so that the parasitic power consumption is decreased.
4. Conclusions
In this study, three different cooling configurations were investigated to evaluate the cooling performance of the dual-stack fuel-cell system for truck applications. The simulations were conducted with layouts of parallel, series, and individual cooling systems configurations. The conclusions are as follows:
- The series cooling system for a fuel-cell truck shows the most efficient and suitable arrangement for high-load and long-distance operation and satisfies the target temperature of the fuel cells in both stacks.
- The overshoot and undershoot of the stack temperature are minimized with the series cooling system and maximized with the parallel cooling system. The stack temperature ITAE of a series cooling system is 33% lower than that of an individual cooling system and 38% lower than that of a parallel cooling system.
- The parasitic energy consumption of the cooling system is also minimized for the series cooling system and maximized for the parallel cooling system. The parasitic energy consumption of a series cooling system is 12% lower than that of an individual cooling system and 18% lower than that of a parallel cooling system.
Author Contributions
J.W.: Conceptualization, Methodology, Writing—Original draft preparation. Y.K.: Resources, Writing—Original draft preparation. S.Y.: Supervision. J.W.: Writing—Reviewing and Editing. All authors have read and agreed to the published version of the manuscript.
Funding
This research was supported by the Technology Innovation Program (00144016), funded by the Ministry of Trade, Industry & Energy (MOTIE, Korea), the Korea Institute of Energy Technology Evaluation and Planning (KETEP), and the Ministry of Trade, Industry & Energy (MOTIE) of the Republic of Korea (No. 20213030030210).
Conflicts of Interest
Our paper currently is not submitted for publication at any other journal. All authors agree with the content of the paper. There are no conflicts of interest with any of the authors.
Nomenclature
| Area, | |
| Activity | |
| Specific heat, | |
| Diffusivity, | |
| Hydraulic diameter, | |
| Friction coefficient | |
| Height, | |
| Heat-transfer coefficient, | |
| Current, | |
| Current density, | |
| Colburn factor | |
| Thermal conductivity, | |
| Mass flow rate, | |
| N | motor speed, |
| Nu | Nusselt number |
| Electro-osmotic drag force, | |
| Water back-diffusion force, | |
| n | Number |
| Pressure, | |
| Prandtl number | |
| Heat transfer, | |
| Re | Reynolds number |
| Temperature, K | |
| Thickness, | |
| Overall heat, | |
| V | voltage, V |
| Width, | |
| Greek letters | |
| η | Efficiency |
| Valve ratio | |
| λ | Water content |
| Density, | |
| σ | Conductivity |
| Torque, N · m | |
| Subscripts | |
| Active losses | |
| air | Air side |
| Anode | |
| Average | |
| Cathode | |
| ch | Channel |
| conc | Concentration losses |
| cool | Coolant |
| Fuel cell | |
| f | Fin |
| Hydrogen | |
| mem | Membrane |
| Nitrogen | |
| Oxygen | |
| ohm | Ohmic losses |
| Saturate | |
| Saturate | |
| Tube | |
| Vapor | |
| Water |
References
- Yang, H.; Han, Y.J.; Yu, J.; Kim, S.; Lee, S.; Kim, G.; Lee, C. Exploring Future Promising Technologies in Hydrogen Fuel Cell Transportation. Sustainability 2022, 14, 917. [Google Scholar] [CrossRef]
- Chavan, S.L.; Talange, D.B. Modeling and performance evaluation of PEM fuel cell by controlling its input parameters. Energy 2017, 138, 437–445. [Google Scholar] [CrossRef]
- Omran, A.; Lucchesi, A.; Smith, D.; Alaswad, A.; Amiri, A.; Wilberforce, T.; Olabi, A.G. Mathematical model of a proton-exchange membrane (PEM) fuel cell. Int. J. Thermofluids 2021, 11, 100110. [Google Scholar] [CrossRef]
- Shimpalee, S.; Satjaritanun, P.; Hirano, S.; Tippayawong, N.; Weidner, J.W. Multiscale Modeling of PEMFC Using Co-Simulation Approach. J. Electrochem. Soc. 2019, 166, F534–F543. [Google Scholar] [CrossRef]
- Sui, P.-C.; Zhu, X.; Djilali, N. Modeling of PEM Fuel Cell Catalyst Layers: Status and Outlook. Electrochem. Energy Rev. 2019, 2, 428–466. [Google Scholar] [CrossRef]
- Pan, M.; Li, C.; Liao, J.; Lei, H.; Pan, C.; Meng, X.; Huang, H. Design and modeling of PEM fuel cell based on different flow fields. Energy 2020, 207, 118331. [Google Scholar] [CrossRef]
- Belhaj, F.Z.; El Fadil, H.; El Idrissi, Z.; Intidam, A.; Koundi, M.; Giri, F. New Equivalent Electrical Model of a Fuel Cell and Comparative Study of Several Existing Models with Experimental Data from the PEMFC Nexa 1200 W. Micromachines 2021, 12, 1047. [Google Scholar] [CrossRef]
- Yang, Z.; Du, Q.; Jia, Z.; Yang, C.; Jiao, K. Effects of operating conditions on water and heat management by a transient multi-dimensional PEMFC system model. Energy 2019, 183, 462–476. [Google Scholar] [CrossRef]
- Goshtasbi, A.; Pence, B.L.; Chen, J.; DeBolt, M.A.; Wang, C.; Waldecker, J.R.; Hirano, S.; Ersal, T. A Mathematical Model toward Real-Time Monitoring of Automotive PEM Fuel Cells. J. Electrochem. Soc. 2020, 167, 024518. [Google Scholar] [CrossRef]
- Mohiuddin, A.K.M.; Basran, N.; Khan, A.A. Modelling and validation of Proton exchange membrane fuel cell (PEMFC). In IOP Conference Series: Materials Science and Engineering; IOP Publishing: Bristol, UK, 2018; Volume 290. [Google Scholar]
- Pourrahmani, H.; Siavashi, M.; Moghimi, M. Design optimization and thermal management of the PEMFC using artificial neural networks. Energy 2019, 182, 443–459. [Google Scholar] [CrossRef]
- Pourrahmani, H.; Moghimi, M.; Siavashi, M. Thermal management in PEMFCs: The respective effects of porous media in the gas flow channel. Int. J. Hydrogen Energy 2019, 44, 3121–3137. [Google Scholar] [CrossRef]
- Hu, D.; Wang, Y.; Li, J.; Yang, Q.; Wang, J. Investigation of optimal operating temperature for the PEMFC and its tracking control for energy saving in vehicle applications. Energy Convers. Manag. 2021, 249, 114842. [Google Scholar] [CrossRef]
- Xing, L.; Xiang, W.; Zhu, R.; Tu, Z. Modeling and thermal management of proton exchange membrane fuel cell for fuel cell/battery hybrid automotive vehicle. Int. J. Hydrogen Energy 2022, 47, 1888–1900. [Google Scholar] [CrossRef]
- Xing, L.; Chang, H.; Zhu, R.; Wang, T.; Zou, Q.; Xiang, W.; Tu, Z. Thermal analysis and management of proton exchange membrane fuel cell stacks for automotive vehicle. Int. J. Hydrogen Energy 2021, 46, 32665–32675. [Google Scholar] [CrossRef]
- Thompson, S.T.; James, B.D.; Huya-Kouadio, J.M.; Houchins, C.; DeSantis, D.A.; Ahluwalia, R.; Wilson, A.R.; Kleen, G.; Papageorgopoulos, D. Direct hydrogen fuel cell electric vehicle cost analysis: System and high-volume manufacturing description, validation, and outlook. J. Power Sources 2018, 399, 304–313. [Google Scholar] [CrossRef]
- Woo, J.B.; Kim, Y.H.; Yu, S.S. A Study of Cooling System Control of Fuel Cell Truck. Trans. Korean Soc. Automot. Eng. 2022, 30, 9–18. [Google Scholar] [CrossRef]
- Springer, T.E.; Zawodzinski, T.A.; Gottesfeld, S. Polymer electrolyte fuel cell model. J. Electrochem. Soc. 1991, 138, 2334. [Google Scholar] [CrossRef]
- Lee, C.H.; Kim, Y.H.; Yu, S.S. Prediction of Membrane Water Content Characteristics through Dynamic Nonlinear Model. Trans. Korean Hydrog. New Energy Soc. 2021, 32, 497–505. [Google Scholar] [CrossRef]
- Mills, A.F. Basic Heat and Mass Transfer; Pearson College Division: New York, NY, USA, 1999. [Google Scholar]
- Han, J.Y.; Yu, S.S. Ram air compensation analysis of fuel cell vehicle cooling system under driving modes. Appl. Therm. Eng. 2018, 142, 530–542. [Google Scholar] [CrossRef]
- Hesselgreaves, J.E.; Law, R.; Reay, D. Compact Heat Exchangers: Selection, Design and Operation; Butterworth-Heinemann: Oxford, UK, 2016. [Google Scholar]
- Han, J.Y.; Park, J.S.; Yu, S.S. Control strategy of cooling system for the optimization of parasitic power of automotive fuel cell system. Int. J. Hydrogen Energy 2015, 40, 13549–13557. [Google Scholar] [CrossRef]
- Ap, N.S.; Guerrero, P.; Jouanny, P. Influence of Fan System Electric Power on the Heat Performance of Engine Cooling Module (No. 2003-01-0275); SAE Technical Paper; SAE: Warrendale, PA, USA, 2003. [Google Scholar]
- Yu, S.S.; Jung, D.H. A study of operation strategy of cooling module with dynamic fuel cell system model for transportation application. Renew. Energy 2010, 35, 2525–2532. [Google Scholar] [CrossRef]
Disclaimer/Publisher’s Note: The statements, opinions and data contained in all publications are solely those of the individual author(s) and contributor(s) and not of MDPI and/or the editor(s). MDPI and/or the editor(s) disclaim responsibility for any injury to people or property resulting from any ideas, methods, instructions or products referred to in the content. |
© 2023 by the authors. Licensee MDPI, Basel, Switzerland. This article is an open access article distributed under the terms and conditions of the Creative Commons Attribution (CC BY) license (https://creativecommons.org/licenses/by/4.0/).