Article

CFD Analysis of Solar Greenhouse Thermal and Humidity Environment Considering Soil–Crop–Back Wall Interactions

1
College of Mechanical and Power Engineering, China Three Gorges University, Yichang 443002, China
2
Key Laboratory of Farm Building in Structure and Intelligent Construction, Ministry of Agriculture Rural Affairs, Beijing 100125, China
3
Academy of Agricultural Planning and Engineering, Ministry of Agriculture Rural Affairs, Beijing 100125, China
4
College of Water Resources and Civil Engineering, China Agricultural University, Beijing 100083, China
*
Authors to whom correspondence should be addressed.
Energies 2023, 16(5), 2305; https://doi.org/10.3390/en16052305
Submission received: 29 January 2023 / Revised: 17 February 2023 / Accepted: 23 February 2023 / Published: 27 February 2023

Abstract

:
In the study of solar greenhouses, microclimate, soil, and back walls have an important influence on the greenhouse thermal environment because of their good heat storage and release characteristics. The transpiration of crops makes indoor humidity increase sharply, which is the main factor affecting indoor humidity distribution. Therefore, it is of great significance to grasp the microclimate change law of solar greenhouses and study the coupling effect of thermal and humidity environment. In this paper, based on computational fluid dynamics (CFD), a three-dimensional model of the thermal and humidity environment of a solar greenhouse is established, and the indoor temperature and humidity distribution under the influence of soil, crops, and back walls are considered. The CFD model initialization uses binary fitting functions to fit the temperature distribution of soil, back wall, and air. The distribution law of the temperature field and relative humidity field of the solar greenhouse under three different working conditions is simulated, that is, the insulation is uncovered and the ventilation window is closed during the day (G1), the insulation is uncovered and the ventilation window is opened during the day (G2), and the insulation is put down and the ventilation window is closed at night. (G3). The results show that the simulation results are in good agreement with the actual results under the three working conditions, and this paper can provide a reference for the improvement of the greenhouse structure and environmental regulation.

1. Introduction

As a unique form of agricultural architecture in China, solar greenhouses can provide necessary growth conditions for fruit and vegetable growth under severe cold conditions in winter [1]. According to the 2020 China National Agricultural Mechanization Statistical Annual Report, the area of solar greenhouses has exceeded 540,000 hectares, accounting for 28.9% of the country’s total facility area. Solar greenhouses have significant advantages in passive energy storage. The back wall and soil have good heat storage and thermal insulation performance, and the solar greenhouse becomes an independent, relatively closed environment with strong anti-interference ability [2,3].
As the largest heat storage body and the most controllable structural factor of the greenhouse system [4], a series of studies were carried out on the thermal performance of the back wall of the solar greenhouse. Zhang X. et al. [5] used the unsteady simulation method to study the influence of five different back wall structures on the indoor thermal environment to improve the agricultural productivity of non-arable land. Wang J. et al. [6] studied the thermal properties of three different back walls and divided the back walls into the thermal storage layer, thermal stability layer, and thermal insulation layer. The results showed that the total thermal resistance and thermal inertia index of the back wall materials affected the indoor minimum temperature. Liu X. et al. [7] analyzed the heat storage and heat-release performance of four different structural forms after heat storage, and the results showed that a reasonable surface structure was helpful to improve the heat storage capacity of the back wall. Fan Z. et al. [8] proposed a scheme to obtain the optimal external insulation quilt under a limited cost budget to optimize the reasonable allocation of the external insulation layer in solar greenhouses in high latitude and cold areas.
Soil participates in indoor thermal environment transmission, and soil temperature plays an important role in crop growth and development [9] with a time lag [10]. Soil temperature is closely related to air temperature and crops. Studies have shown that soil is the main reason for nighttime temperature increases. For passive solar greenhouses, increasing soil heat storage during the day can significantly improve the overall thermal environment of the greenhouse [11]. Bonachel-a S. et al. [12] studied the influence of three different soil surface coverings on indoor microclimate, and the results showed that black coverings significantly improved soil heat storage efficiency. Abbas Z. et al. [3] established a soil heat storage similarity model based on similarity theory and CFD technology to analyze soil heat storage and heat transfer characteristics.
Crop transpiration plays an important role in indoor humidity distribution. Transpiration is a basic physiological activity of crops, and the water vapor generated is the main source of indoor humidity. The simulation of the transpiration of crops is helpful to understand and improve the growing environment of crops [13]. Kichah A. et al. [14] constructed a crop sub-model to simulate canopy air temperature and leaf vertical temperature throughout the day and accurately estimated crop transpiration rate. Boulard T. et al. [15] developed a CFD model and used it for dynamic prediction and prediction of temperature, humidity, and CO2 distribution in a semi-closed Venlo greenhouse.
The greenhouse microclimate has the characteristics of nonlinearity, strong coupling, and variable environmental parameters, which makes it difficult to predict the distribution law of environmental parameters in the process of agricultural production, and the traditional mechanism model cannot be applied [16]. CFD has been widely used in agricultural building ventilation, climate distribution, structural optimization, etc. It can be combined with actual environmental parameters to set initial conditions to simulate the characteristics of greenhouse microclimate distribution under different conditions. However, most of the existing studies focus on the distribution of indoor air temperature and humidity, ignoring the actual temperature distribution of the soil and back wall. At present, there is an urgent need for a numerical model that comprehensively considers the indoor thermal and humidity environment under the interaction of the soil, crops, and back wall.
In this paper, the CFD method was used to establish the thermal and humidity environment model of the solar greenhouse, and the influence of soil, crops, and back wall on the indoor environment were considered. To accurately describe the indoor temperature distribution and the influence of outdoor environment changes, binary fitting functions and regression equations were constructed and loaded into the CFD model in the form of UDF. At the same time, the indoor thermal and humidity distribution under the three working conditions was studied and the reliability of the model was verified. In addition, the correlation between indoor air temperature and humidity and the temperature of the back wall and soil under the three working conditions was analyzed, and the energy transfer law of the greenhouse system was further clarified.

2. Materials and Methods

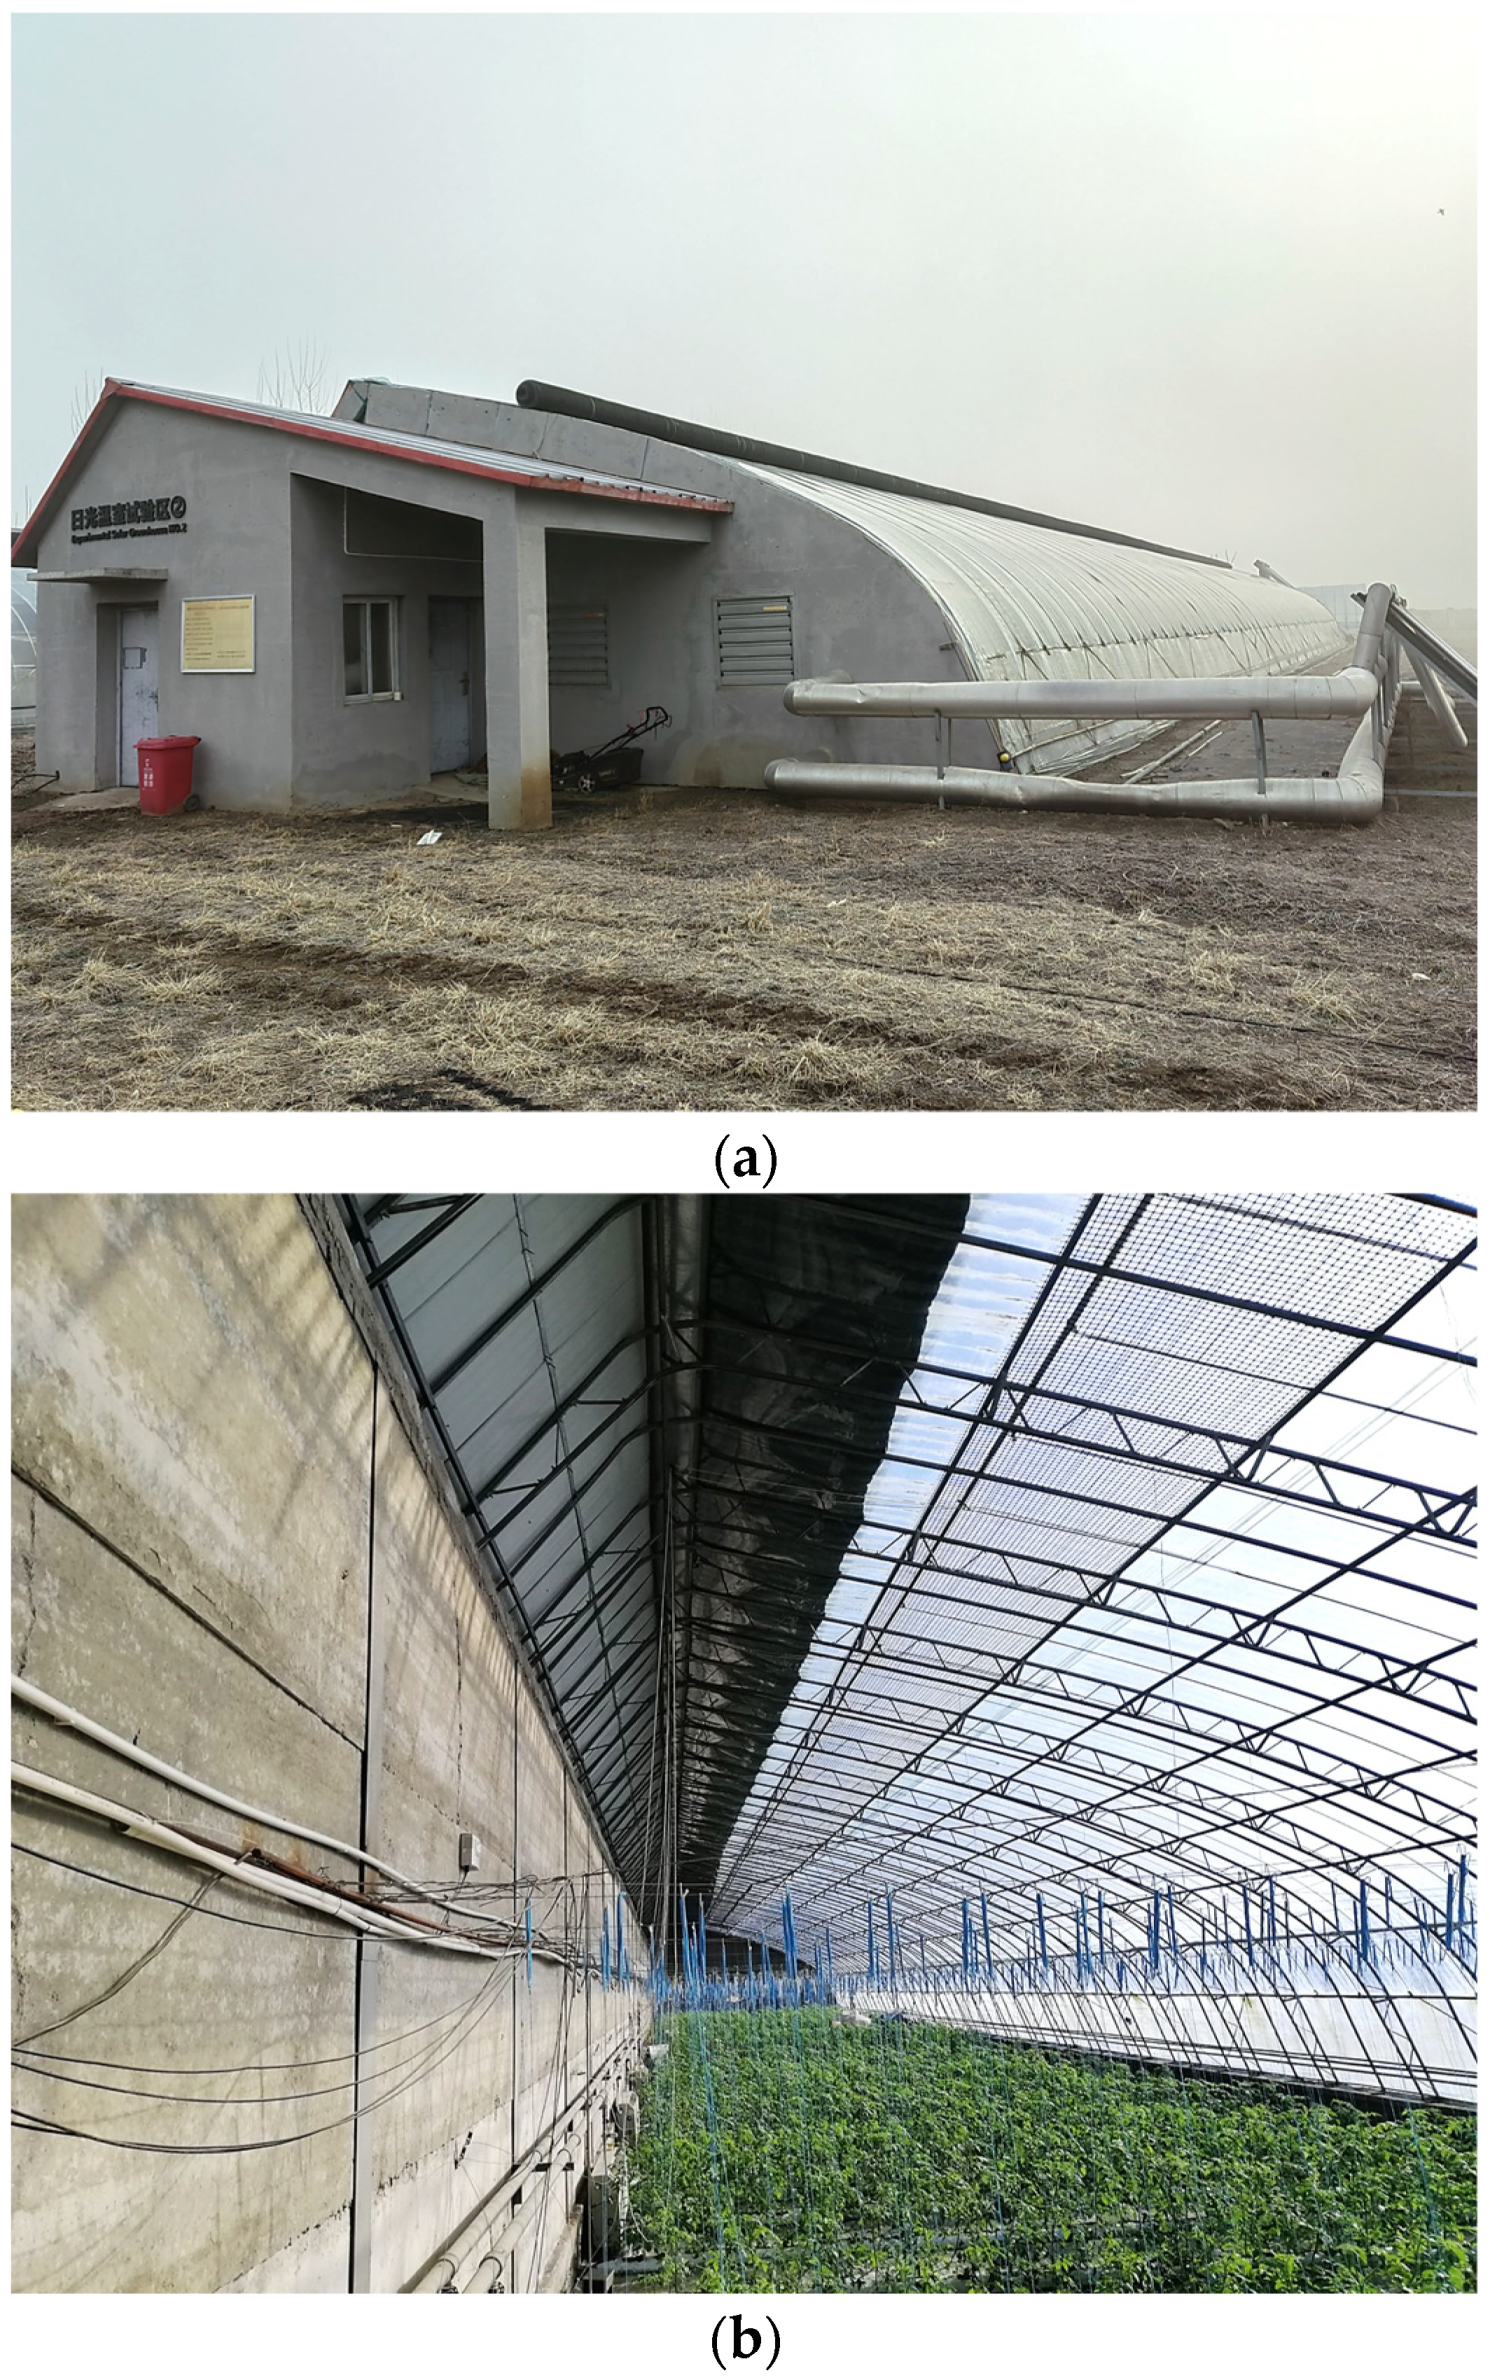
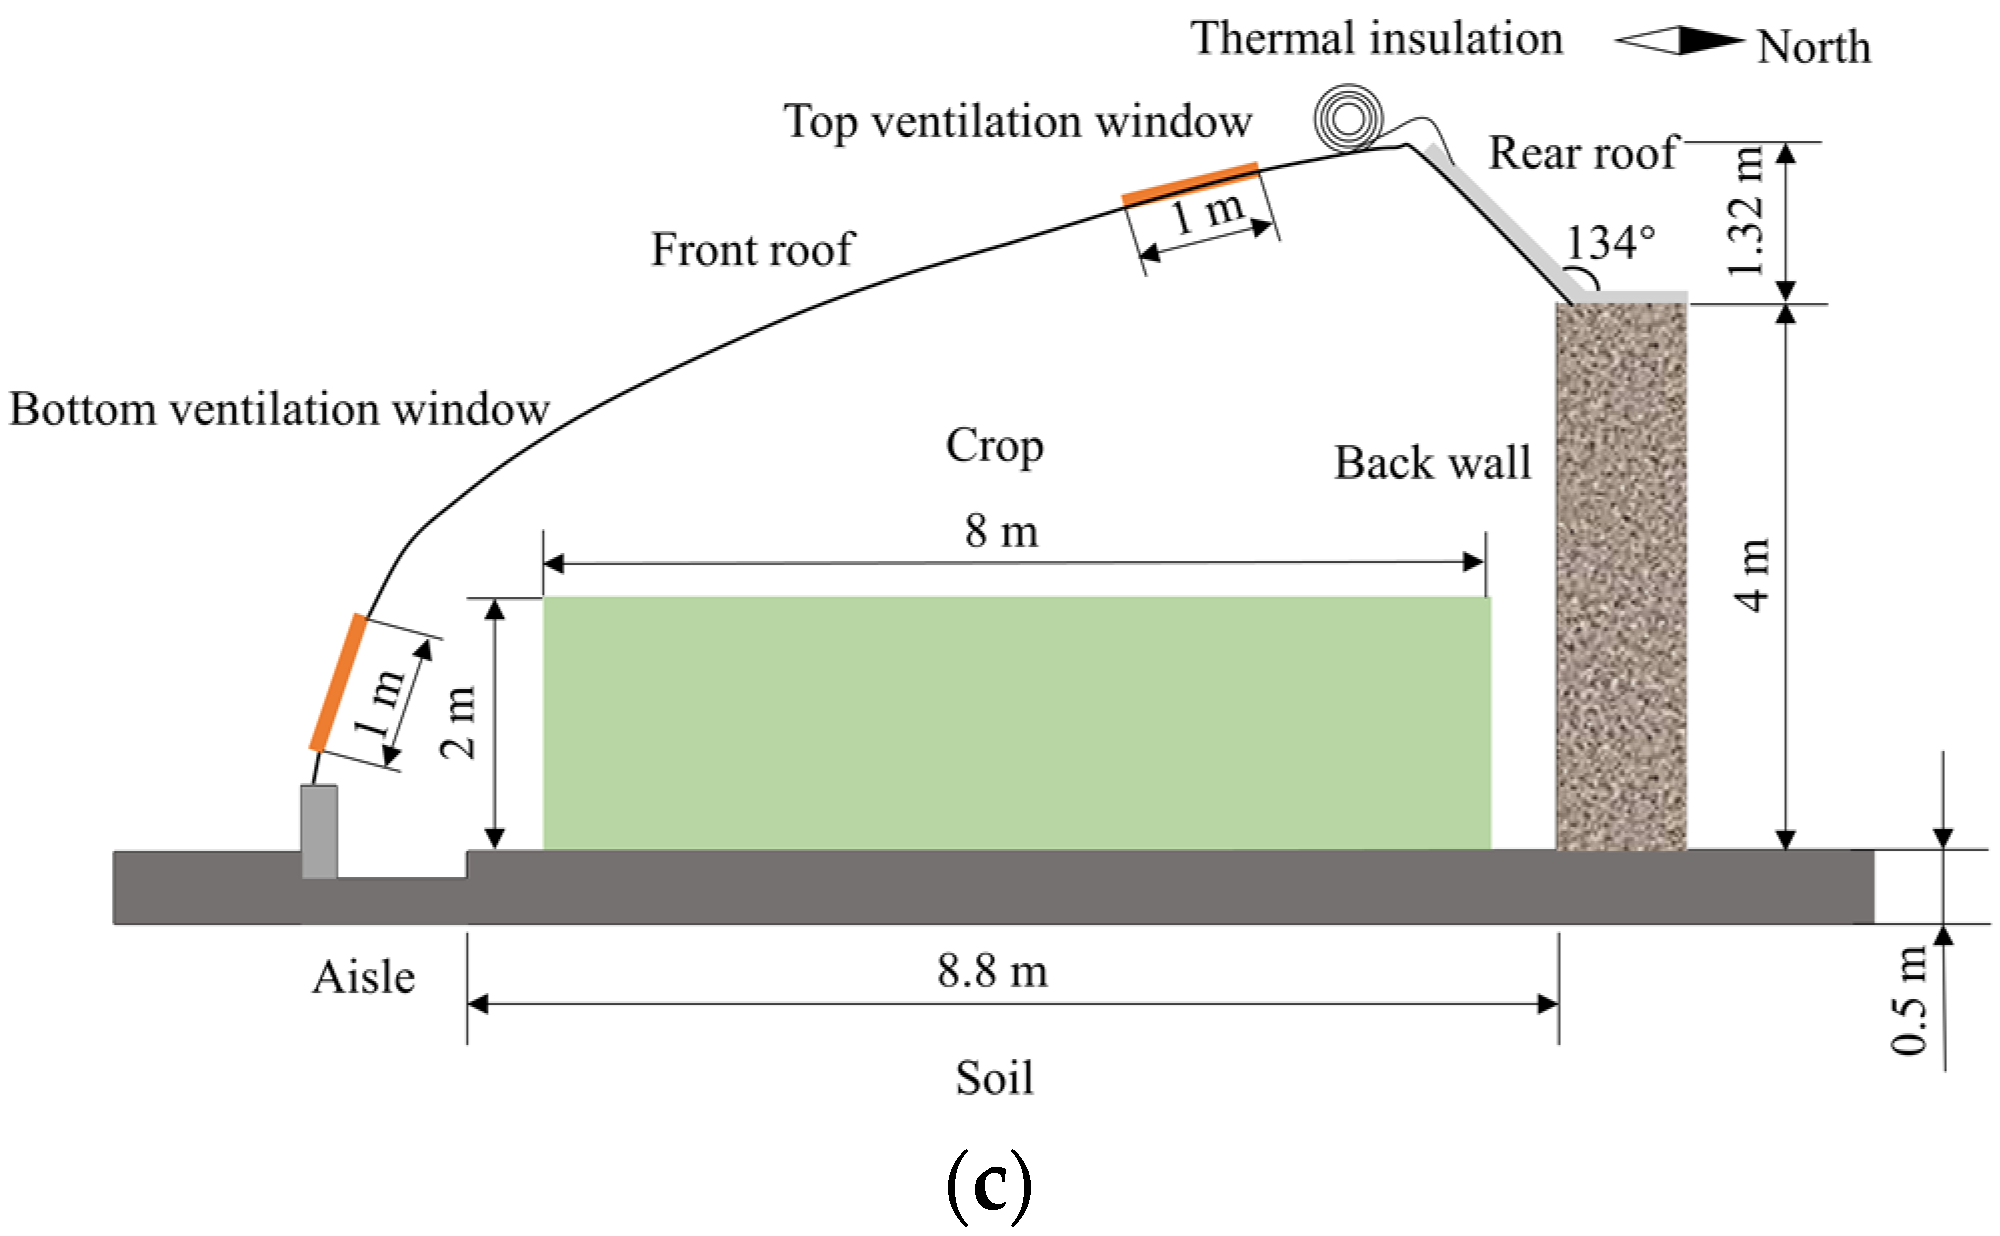
2.1. Experimental Greenhouse

The experimental solar greenhouse was located in Yongqing County, Hebei Province of China (116.49° E, 39.32° N). The greenhouse structure is shown in Figure 1. The greenhouse had a north-south span of 10 m, a length of 8 m, and a ridge height of 5.32 m. The back wall was 4.35 m-high and consisted of prefabricated walls of 820 mm steel-frame system, precast reinforced concrete panels and 100 mm extruded polystyrene boards. The front roof was covered with 0.12 mm polyolefin (PO) film and thermal insulation. The times taken for rolling up and putting down the thermal insulation were 8:30 and 16:50, respectively. The bottom and ridge of the front roof were equipped with top and bottom ventilation windows, respectively, with 32 mesh insect nets. During the test, the bottom ventilation window was closed, and the opening of the top ventilation window was controlled by an intelligent ventilation system and automatically adjusted according to the feedback of indoor air temperature. In winter, no active heating equipment was installed in the greenhouse. The planting crop was tomato, which was colonized on 25 October 2021, and was cultivated using substrate bags. The ground surface of the whole planting area was covered with black plastic cloth to reduce indoor humidity.

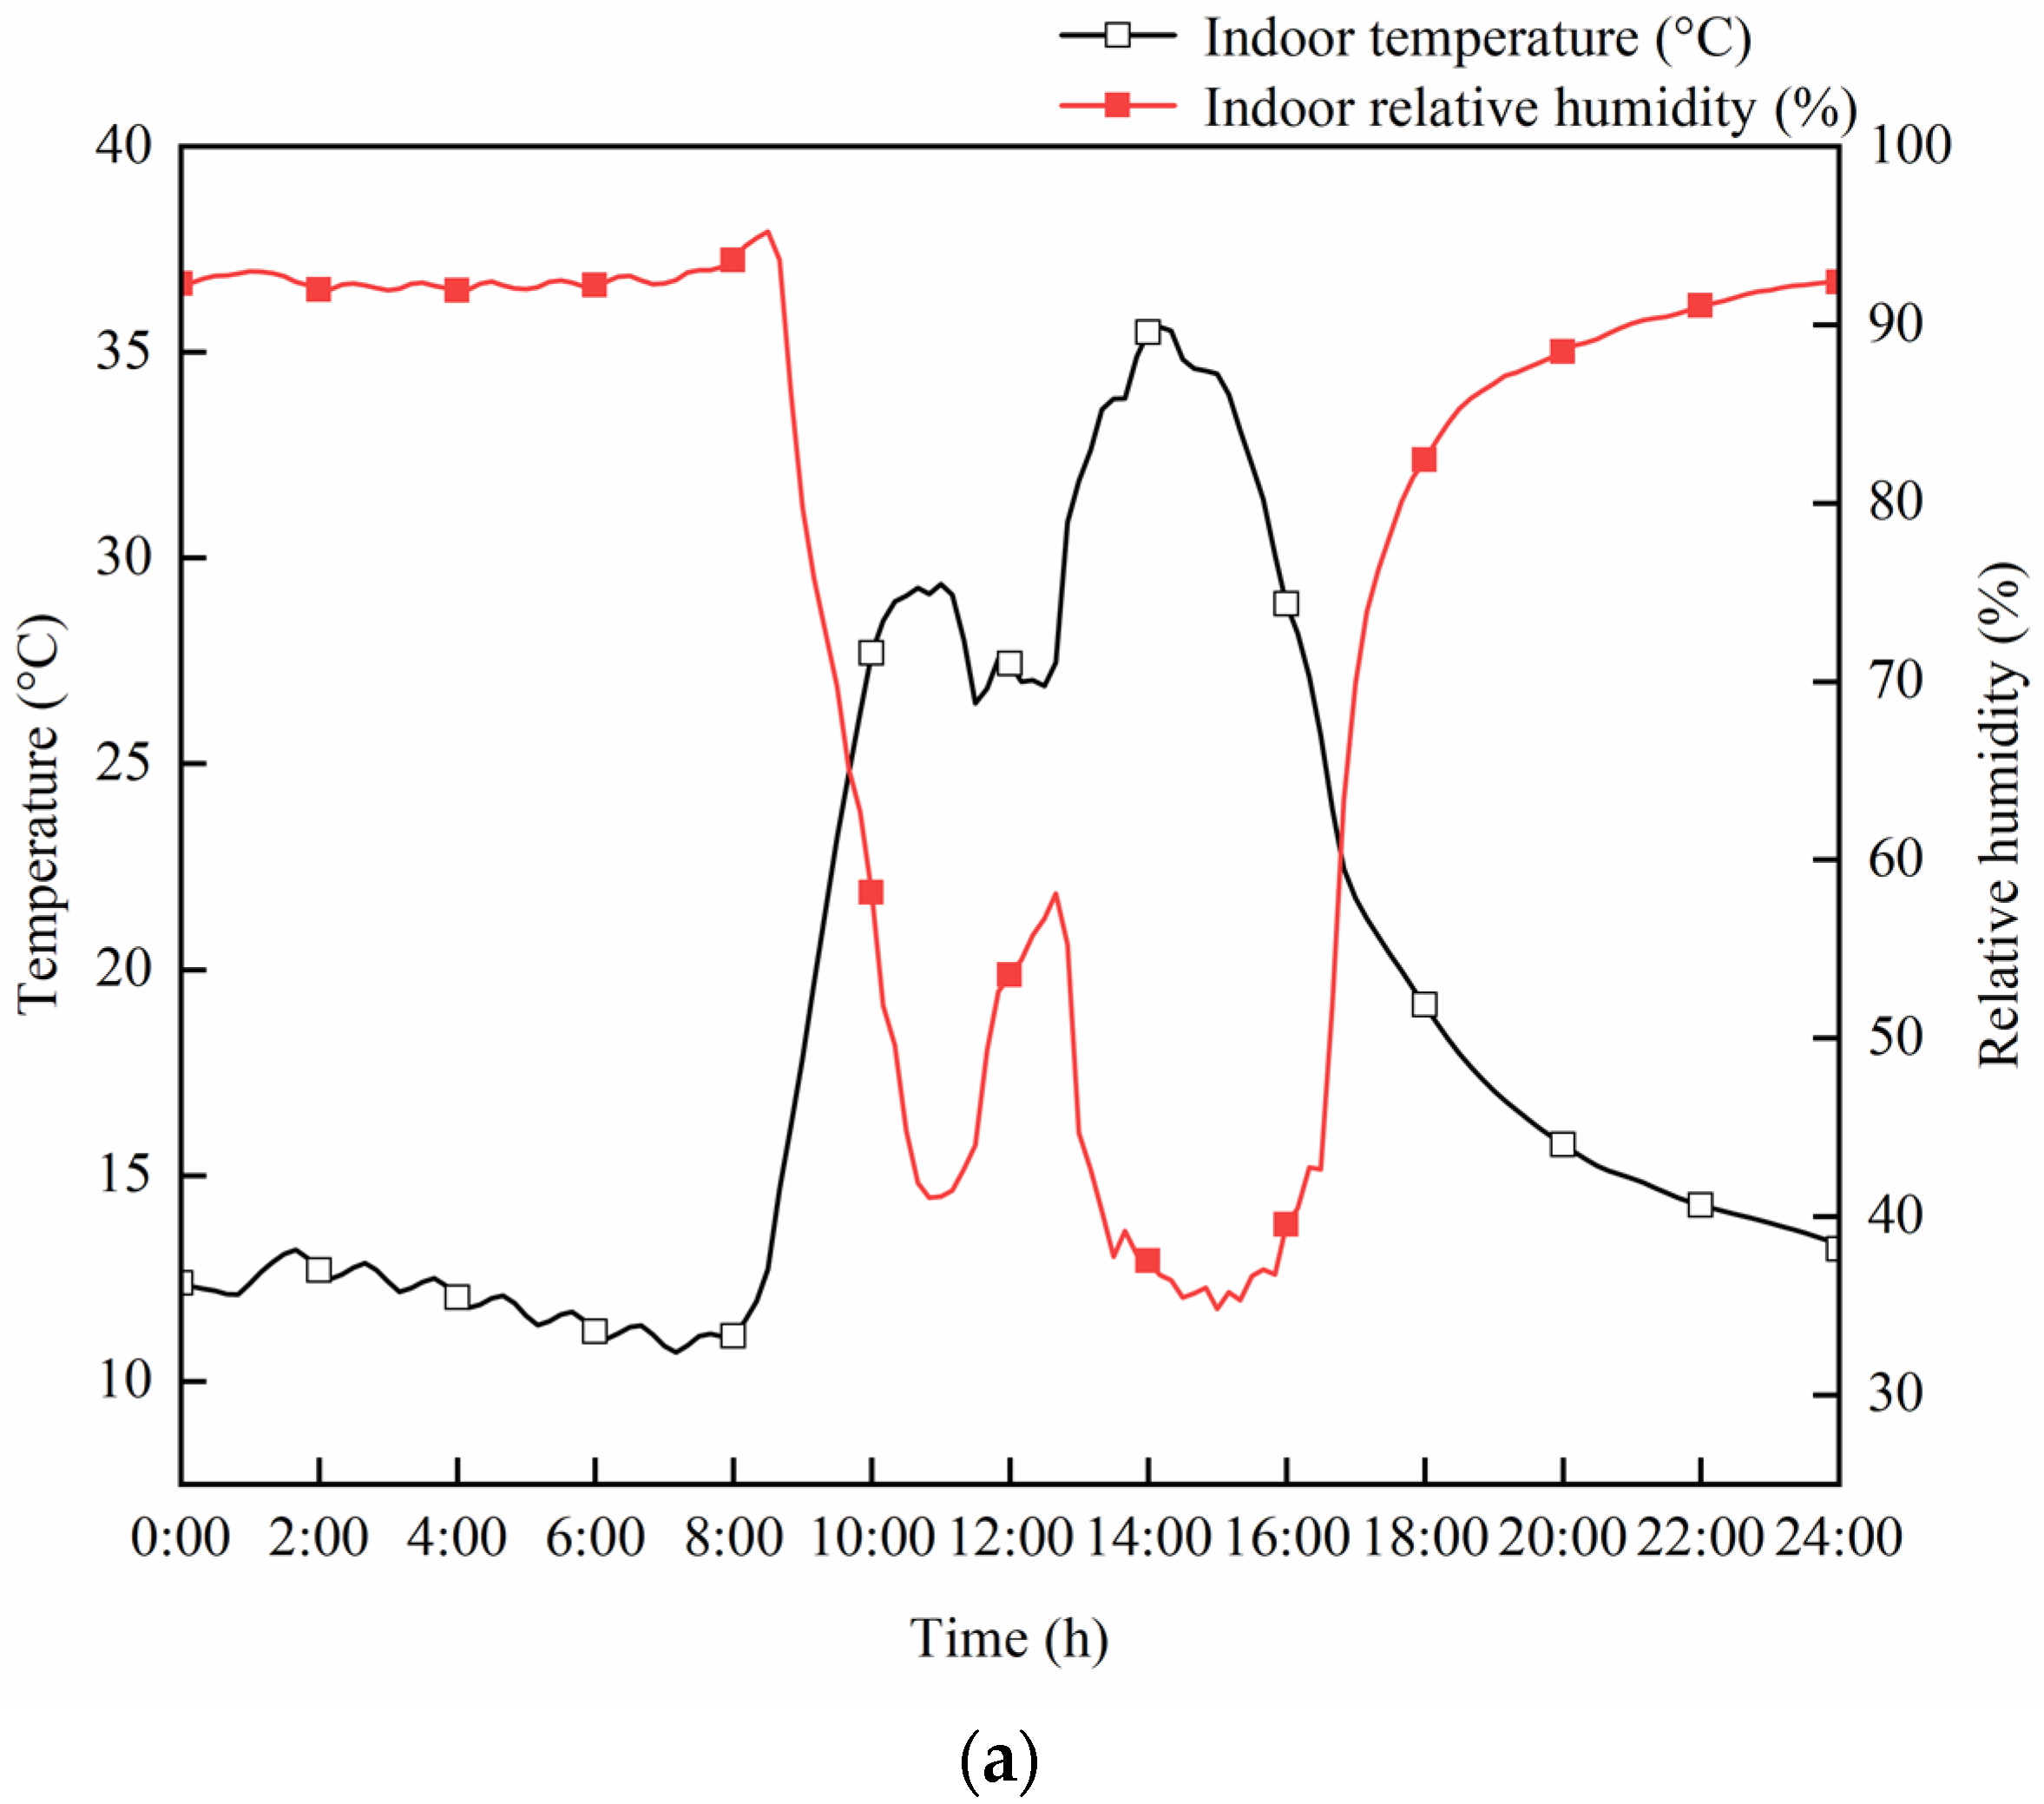
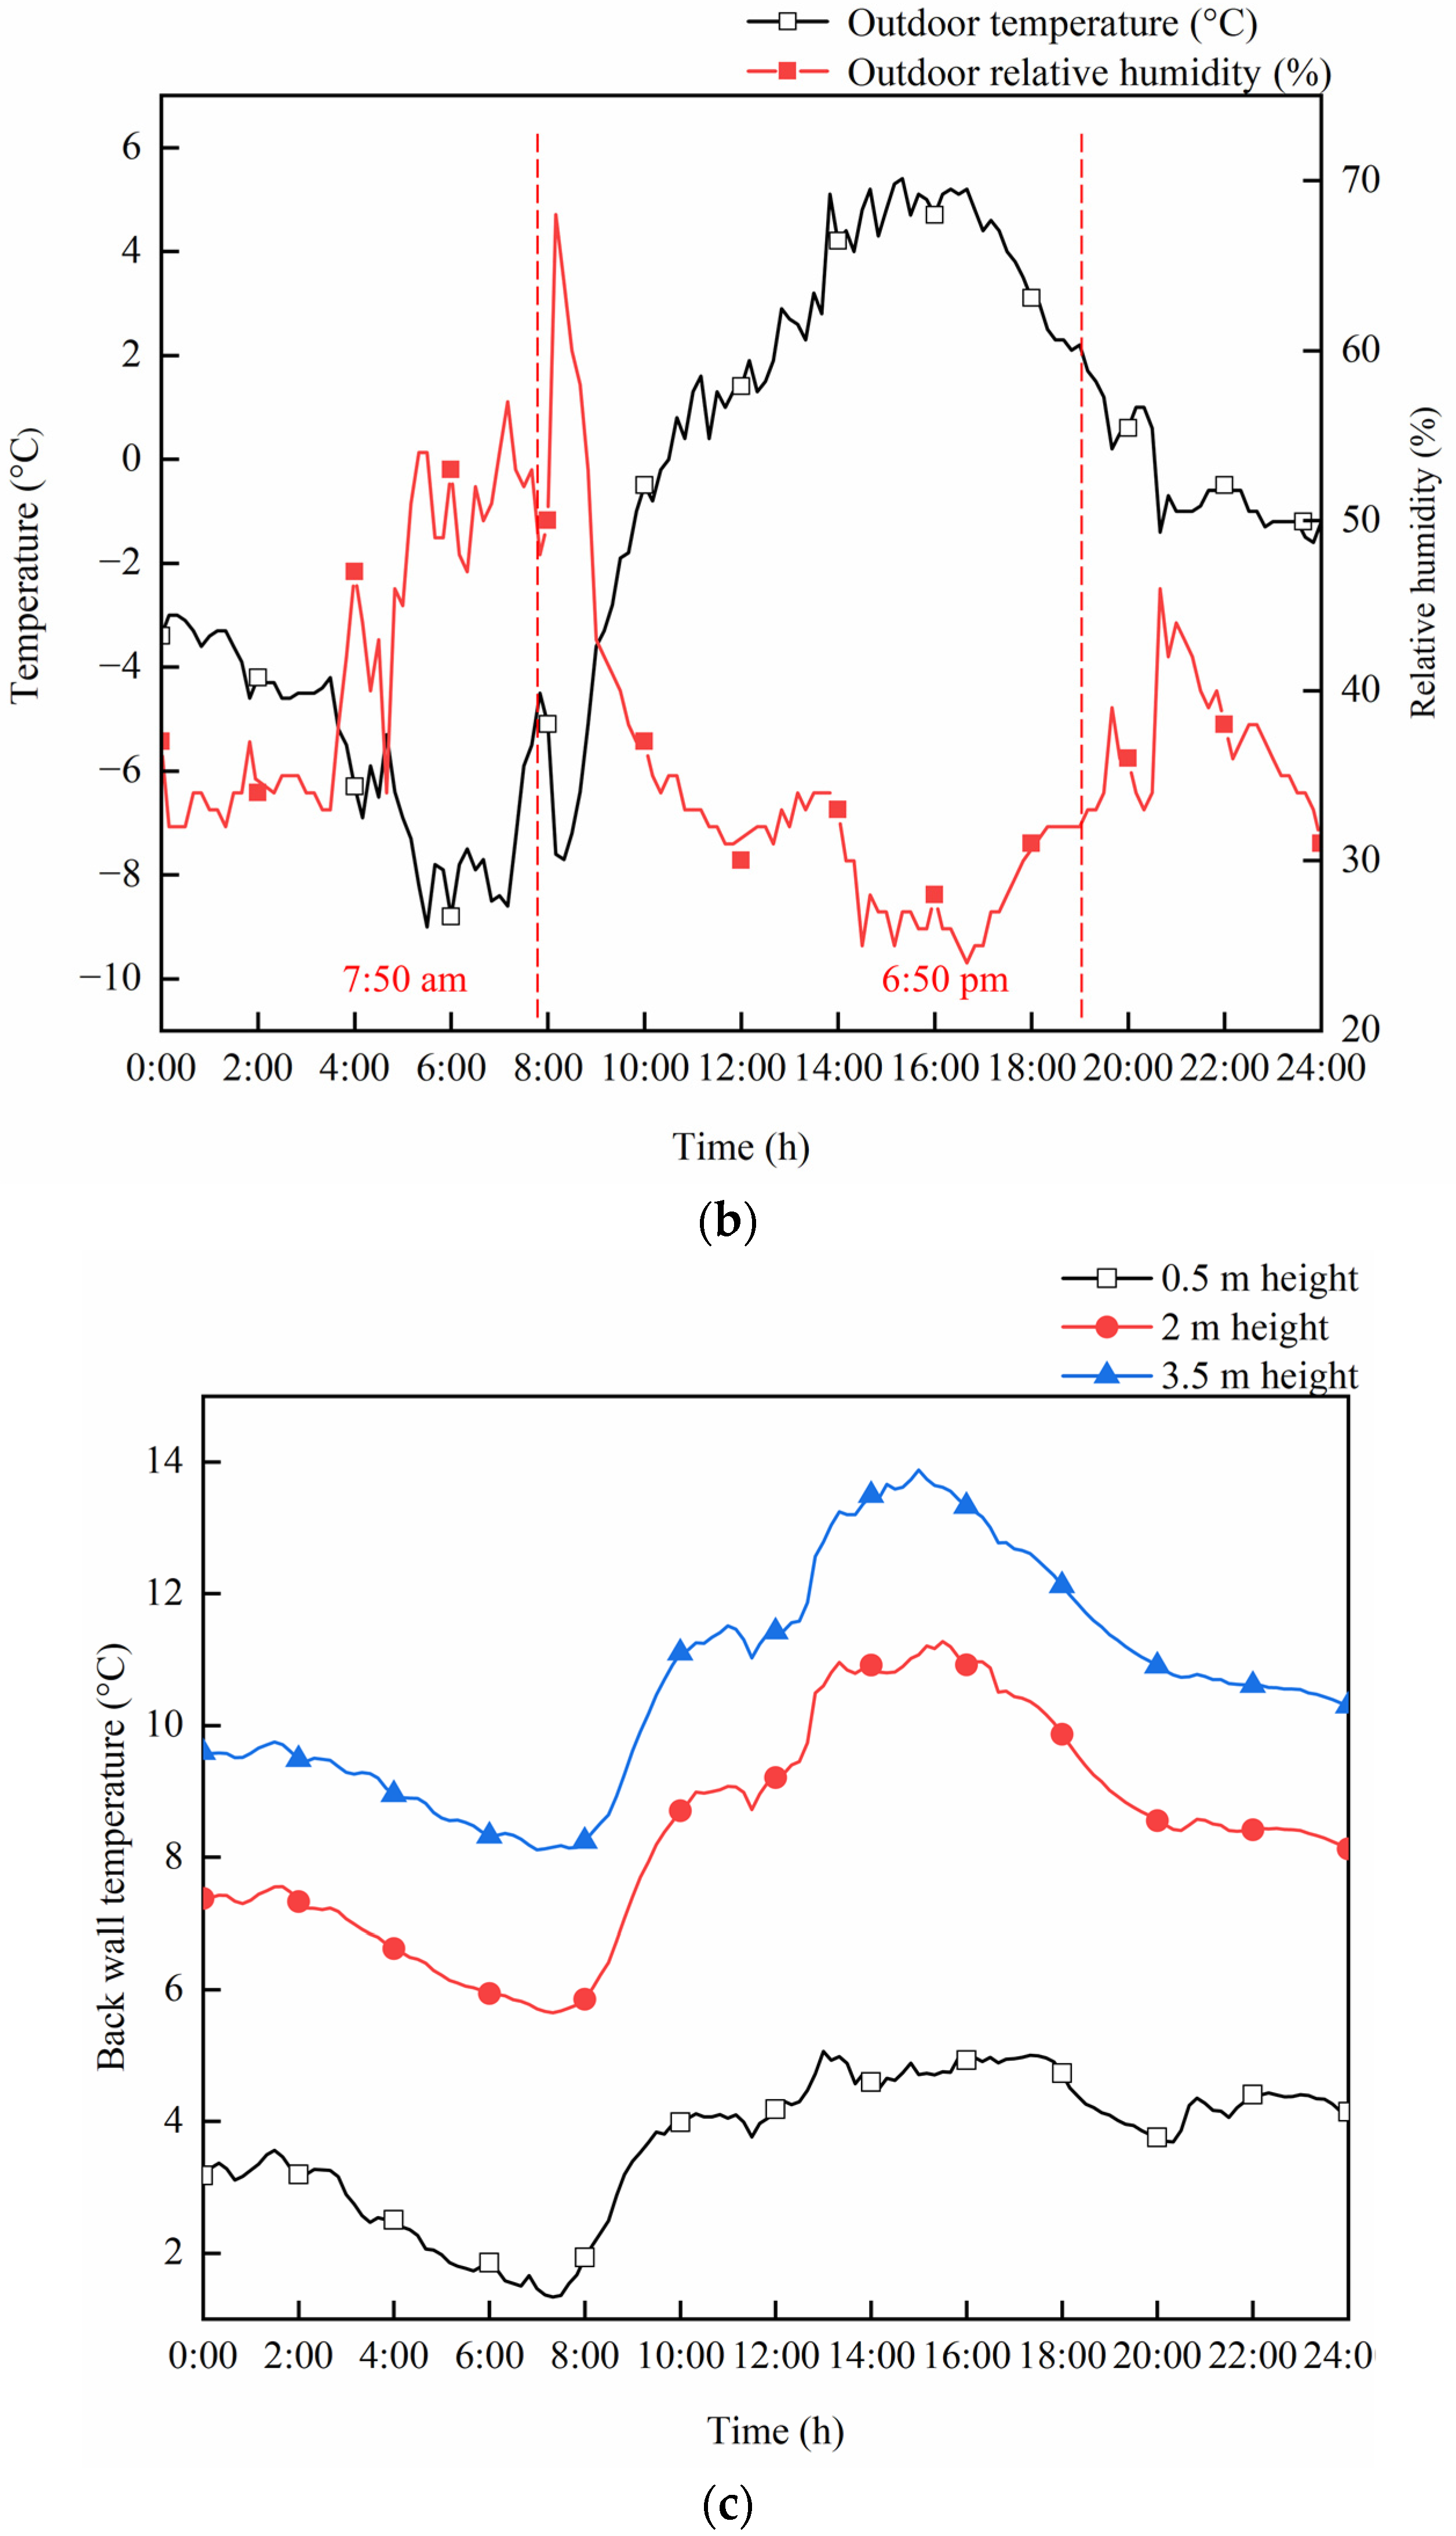
2.2. Data Collection

The test was conducted on 22 February 2022, on a sunny day with the lowest outdoor temperature of −8.8 °C. Outdoor environmental parameters, including temperature, relative humidity, solar radiation intensity, wind speed, wind direction, and rainfall, were measured by an outdoor weather station. Indoor air temperature and relative humidity were collected by HOBO UX100-003 temperature and relative humidity recorder (Onset Company, Bourne, MA, USA, accuracy ±0.21 °C, ±3.5%), and the outside of the recorder was covered with aluminum foil to avoid the influence of solar radiation. The indoor solar radiation intensity was collected by the solar radiation sensor S-LiB-M003 (Onset, measuring 0–1280 W·m−2, resolution 1.25 W·m−2). The wall temperature and soil temperature were measured with Cu-CS T-type electric couples (accuracy ±0.5 °C), and the collected data were stored in a CR1000 data collector. The collection interval of the above sensors was set to 10 min.
The specific arrangement of greenhouse sensors is shown in Figure 2. A total of 8 air temperature and humidity measuring points are numbered A1–A8 in sequence, distributed on three different planes −1 m, −4.4 m, and −7.8 m away from the back wall, and the heights of the measuring planes from the ground are 1.2 m, 1.5 m, and 3.5 m. A total of 30 temperature measuring points on the back wall are numbered T1-T30 in sequence, distributed in three measuring planes with heights of 0.5 m, 2 m, and 3.5 m, and each plane has 10 measuring points. Similarly, a total of 25 soil temperature measuring points are numbered S1–S25 in sequence, distributed on 5 different planes 2.42 m, −1 m, −4.4 m, −7.8 m, and −11.84 m away from the back wall, with a maximum depth of 0.5 m.
During the test period, tomatoes were in the ripening and fruiting stage. There were 41 rows of tomatoes with row spacing of 1 m, plant spacing of 0.25 m, and a planting area of 2.5 plants/m2. Tomato crop rows were considered parallel hexahedrons, and each row was 8 m long, 0.4 m wide, and 2 m high. Three tomato plants with the same growth potential were selected as test objects, and physiological parameters such as leaf transpiration rate, stomatal conductance, and leaf temperature were tested every 30 min using an artificial handheld portable photosynthetic system (li-6400xt, LI-COR Lincoln, NE, USA). The destructive method was used to estimate the leaf area [14], which determined the average leaf area index (LAI) of the crop during the trial period to be 2.75 m2/m2.

2.3. Physical Model and Numerical Modeling

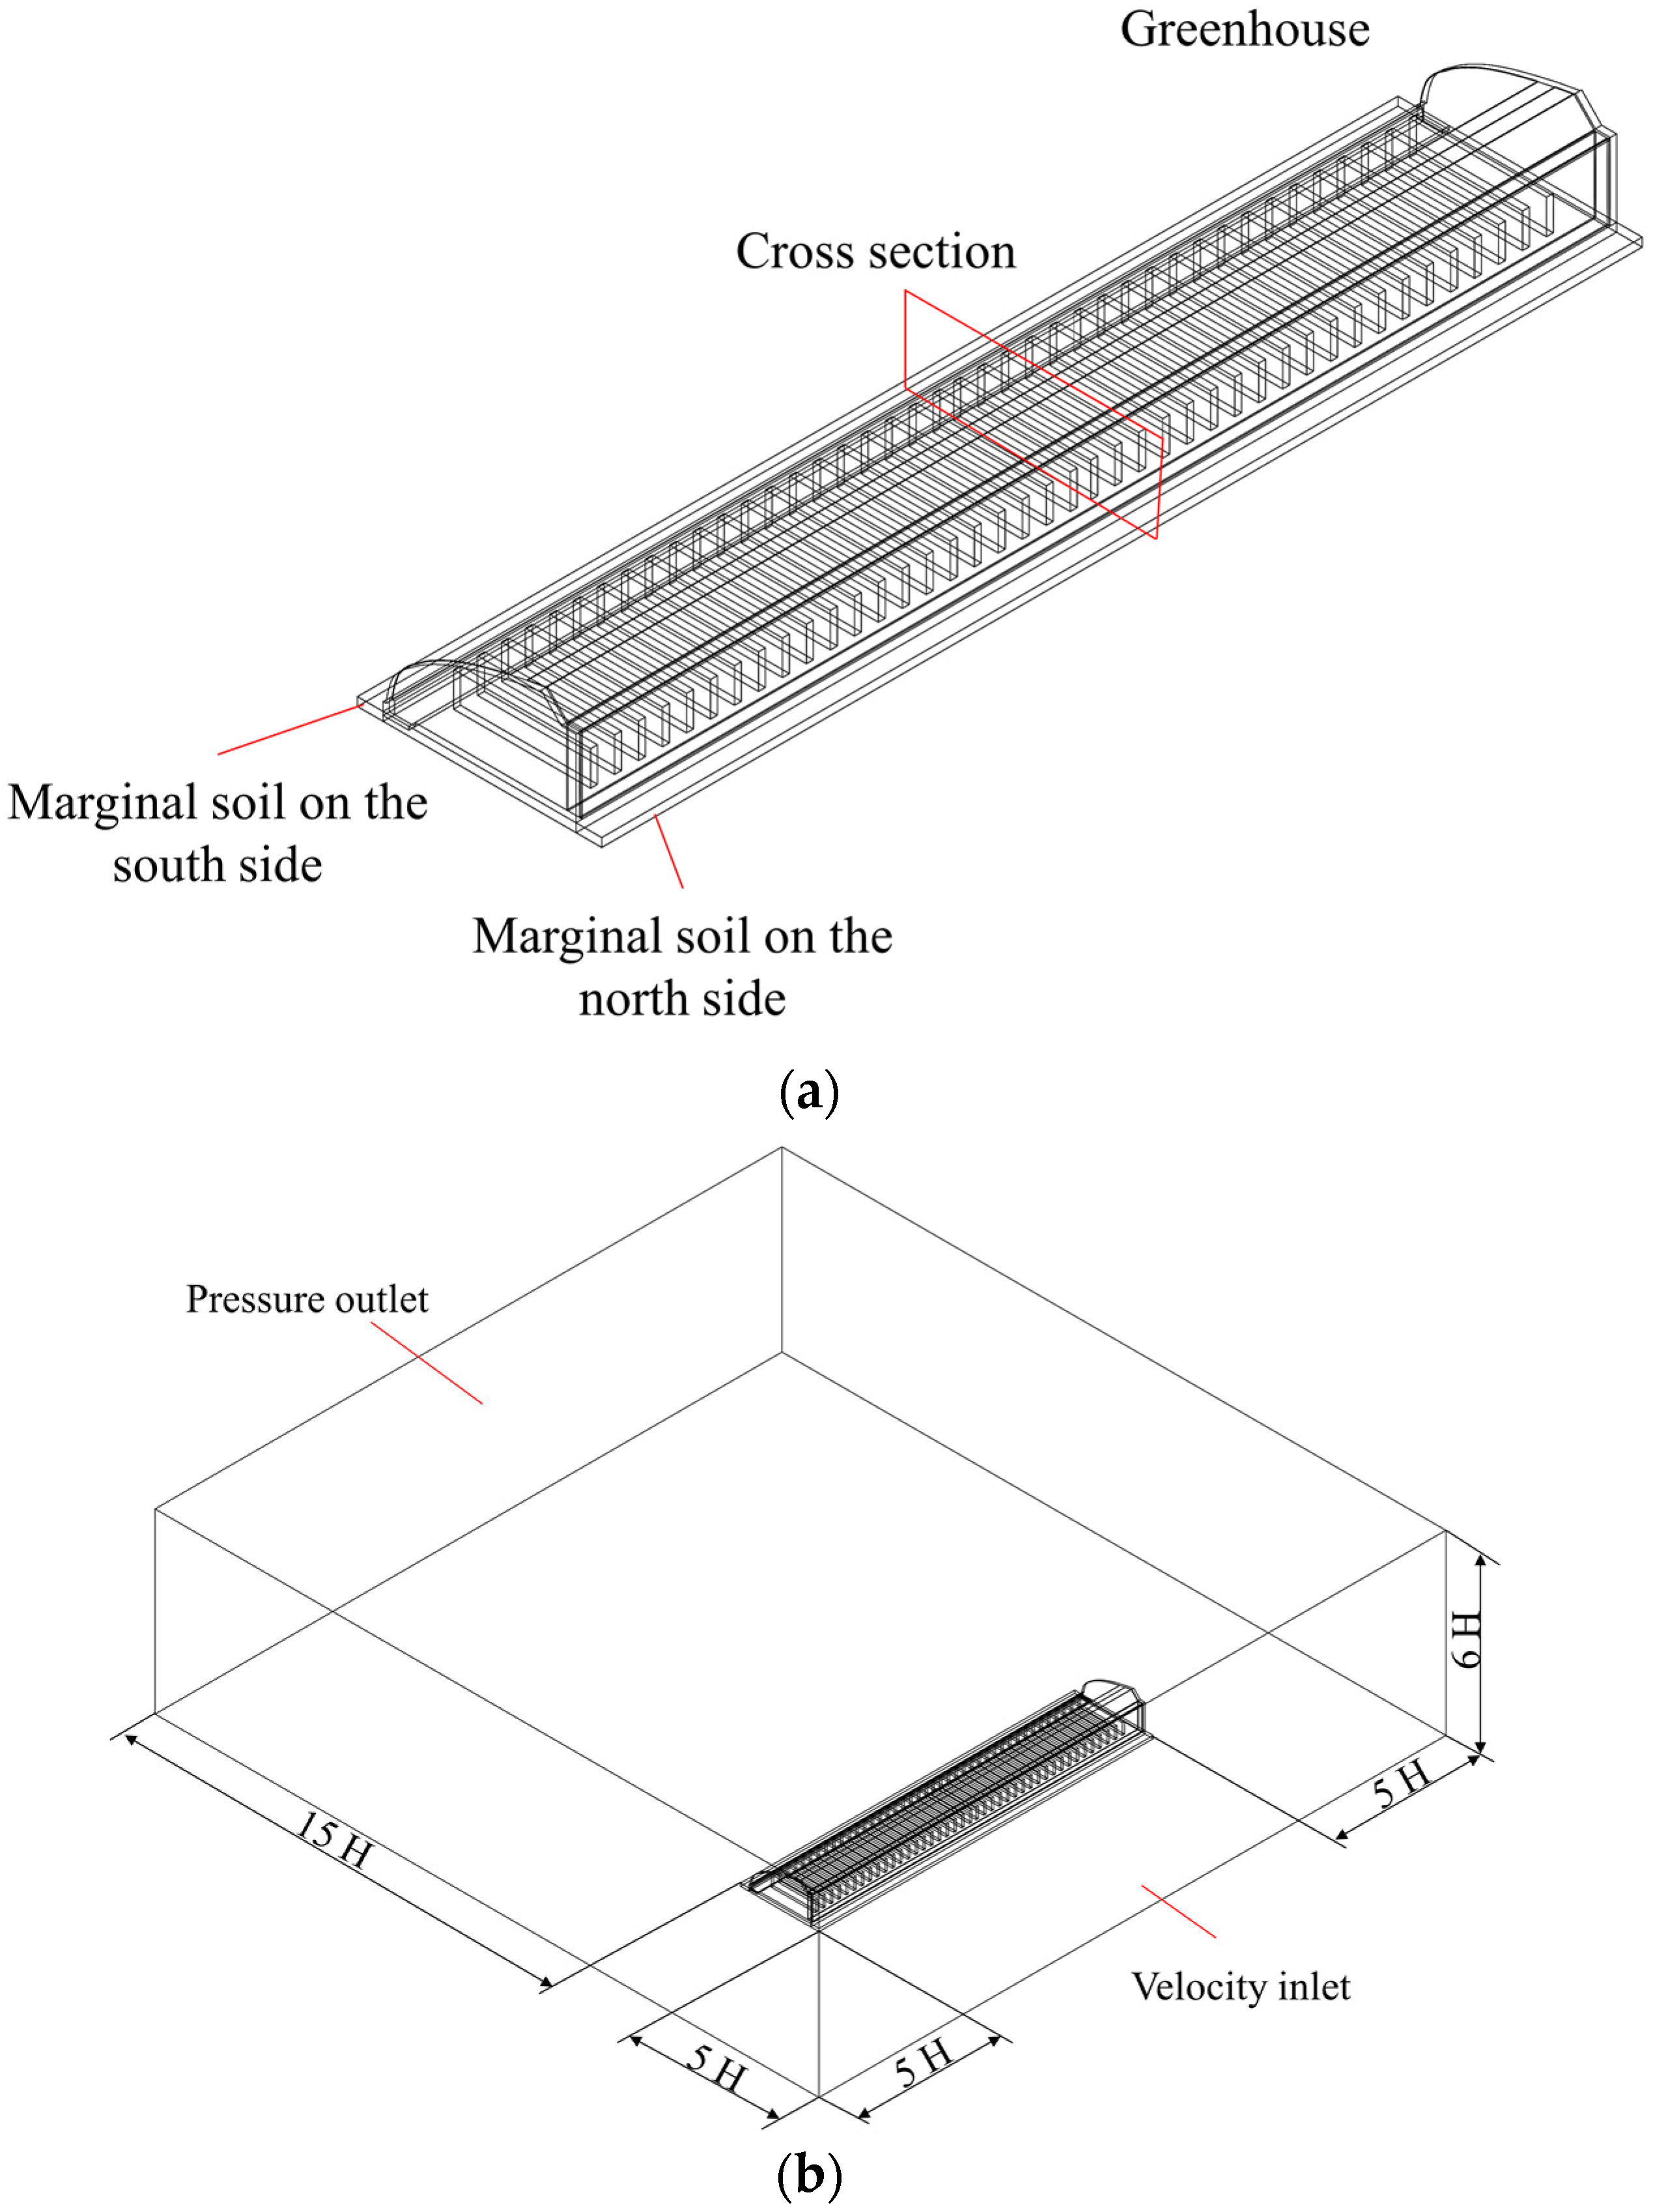
2.3.1. Computational Domain and Mesh Generation

The indoor environment of the solar greenhouse is mainly affected by solar radiation, ventilation, and so on. Therefore, this paper selected three working conditions, G1, G2, and G3, to simulate these three factors, respectively. The model calculation domain is shown in Figure 3. Indoor and outdoor air regions were defined as fluid domains and insect nets, crop regions were defined as porous media, and the rest of the regions were defined as solid domains. In addition, the influence of marginal soil in the northern and southern areas was considered. For the two working conditions of G1 and G3, the greenhouse was in a closed state, so the outdoor air region was not considered in the model. For the G2 working condition, the outdoor air region took the height of the greenhouse building H as the unit. The distance between the leeward surface and the calculation domain was 15 H, and the distance between the side and top of the calculation domain was 5 H, to ensure the full flow of air at the outlet [17].
The solar greenhouse models were divided into structured and unstructured grids. The maximum grid size of G1 and G3 was 850 mm, the grid size of the G2 outer fluid domain was 2000 mm, and the grid size of the top ventilation window area was 80 mm. The overall average quality of the grid was greater than 0.82, the average skewness was less than 0.24, and the minimum orthogonal quality was greater than 0.1, which met the quality requirements required by the flow field.
Under the working conditions of G1 and G3, four different grid numbers of 2,513,149; 3,318,569; 3,996,311; and 5,202,431 were selected for the grid independence test. The results showed that the indoor air temperature did not change more than 5% under different grid numbers, so 3,318,569 grid numbers were selected as the number of benchmark grids for subsequent calculations of G1 and G3. Similarly, 4,562,790 grid numbers were selected for the G1 working condition for subsequent calculations.

2.3.2. Governing Equation

The airflow in the greenhouse flows slowly, and under the action of buoyancy, it flows slowly and moves upward to form a temperature gradient in the height direction. Therefore, it is regarded as an ideal incompressible gas in this paper [18]. The process of mass and heat transfer in the solar greenhouse can be described by the general governing equation:
( ρ φ ) t + div ( ρ u φ ) = div ( Γ grad φ ) + S φ ,
where φ  is the dimensionless transport quantity, namely momentum, mass (mass fraction of air and water vapor), and energy; ρ is the fluid density (kg·m−3); t is time (s); u is the fluid velocity vector (m·s−1); Γ is the generalized diffusion coefficient (m2·s−1); and S φ is the source term (W·m−3).
Assumptions of the model:
  • The gas phase consists of a binary ideal gas mixture of air and water vapor;
  • Ignore soil water vapor evaporation and water vapor condensation;
  • Ignore the effect of cold air infiltration in the greenhouse.

2.3.3. Radiation Model

As the main energy source of the solar greenhouse during the day, solar radiation maintained the indoor temperature and provided energy for crop growth. The solar ray tracing was activated along with the DO radiation, and a sun calculator was used to set the date and geographical location. To simplify the calculation, this paper conducted an integral average treatment on the solar radiation intensity and finally determined that the insolation clearness index was 0.48 through repeated adjustment [19]. Since the solar azimuth changed little in the simulation period, the solar azimuth of the middle time was selected as the set value of the whole period. The front roof of the solar greenhouse was regarded as a semi-transparent medium, so the DO radiation model was selected to solve the radiation heat transfer. The radiation equation is as follows:
( I ( r , s ) s ) + ( α + σ s ) I ( r , s ) = α n 2 σ T 4 π + σ s 4 π 0 4 π I ( r , s ) Φ ( s s ) d   Ω  
where r is the position vector, s is the direction vector, s is the scattering direction vector, α is the absorption coefficient, n is the refractive index, σ s is the scattering coefficient, σ is the Stephens–Boltzmann constant (=5.672 × 10⁻⁸ W·m−2·K−4), I is the radiation intensity (W·m−2), Φ is the phase function, and   Ω   is the solid angle of the radiation.

2.3.4. Crop Energy Balance Equation

The tomato canopy affected indoor airflow, and crop transpiration affected indoor heat exchange and humidity distribution. In this paper, crops are regarded as an isotropic porous medium, which satisfy the Darcy–Forchheimer law [20], and the equation is as follows:
S ϕ = ( μ K p u + C F K p ρ u 2 )
C 1 = 1 K p ,
C 2 = 2 C F K p 0.5 ,
where μ is the air dynamic viscosity (kg·m−1·s−1), K p is the permeability of the tomato crop (m2), C F is the nonlinear momentum loss coefficient, C1 is the viscous resistance coefficient (m−2), and C2 is inertial resistance factor (m−1).
The resistance effect produced by crops can usually be expressed by the following formula [21]:
S ϕ = ρ LAD C D u 2 ,
where ρ is air density (k·gm−3), LAD is leaf area density (m−1), size is LAI/H, and C D is drag coefficient ( C D = 0.32) [22].
Since the order of aerodynamic viscosity (10−5) was much lower than the order of air velocity, to simplify the calculation, the first-order part of the source term can be ignored while Equation (6) was considered to obtain the relationship between nonlinear momentum loss factor and permeability, as shown below:
S ϕ = C F K p = LAD C D .
The permeability Kp mentioned in the above equation can be calculated according to the empirical formula [23]:
K p = d p 2 ε 180 ( 1 ε ) 2 .
During the experiment, the average leaf area measured was 1.1 square meters per unit of land, the average height of crops was 2 m, and the calculated LAD size was 1.375 m−1. By calculating the volume occupied by leaves and stems per cubic meter of canopy area, the porosity can be roughly estimated as 0.98, which is consistent with the porosity estimated by An C.H. et al. [24] at 0.984. The characteristic size of tomato crops was 0.15 m, the porosity was 0.98, the calculated K p and C F were 0.306 and 0.242, respectively, and the inferred C1 and C2 were 3.268 and 0.88, respectively.
For tomato crops grown in a solar greenhouse, the main source of water vapor is the transpiration of crops. Therefore, the influence of substrate and soil evaporation on indoor water vapor content was ignored, and the heat storage effect of the canopy was not considered [25]. The equation of mass transfer and energy exchange between crops and indoor air was as follows:
G a + Q s + Q l = 0 ,
where G a is the net radiation density absorbed by the canopy (W·m−3), Q s is the sensible heat flux density between leaves and air, and Q l is the latent heat flux density related to crop transpiration.
Sensible heat flux between canopy and air and latent heat flux generated by crop transpiration were related to the leaf area of the crop canopy, where sensible heat flux was a function of the temperature difference between leaves and air [20], which can be expressed as follows:
Q s = 2 LAD ρ a C p r a ( T l T a ) ,
where C p is the specific heat of air at constant pressure (J·kg−1·K−1), r a is leaf aerodynamic resistance (s·m−1), and T l and T a are the temperatures of the blade and the air, respectively (°C).
Latent heat flux was related to the stomatal resistance of crops themselves, and it was assumed that transpiration only occurs under tomato leaves [26], which can also be expressed as follows:
Q l = LAD L w ρ a r s + r a ( w l w a ) ,
where L w is the heat absorbed by the latent heat of water evaporation (=2450 kJ·kg−1), w l and w a are the absolute humidity of leaves and air ( kg   water · kg air - 1 ), respectively, and r s is the stomatal resistance of the leaves (s·m−1).

2.4. Fitting Regression Equations

The temperature and humidity in solar greenhouses vary greatly in horizontal and vertical directions and change dynamically with the influence of outdoor solar radiation. Therefore, it is necessary to consider the heterogeneity and dynamic characteristics of indoor microclimate. In the study of solar greenhouse microclimate, the model initialization and boundary conditions have a great influence on the simulation results. Existing studies regard the indoor environment as a uniform distribution when initializing, ignoring the distribution heterogeneity of environmental parameters in the actual situation [27]. Setting the boundary temperature of the greenhouse envelope as a constant value cannot accurately reflect the change in boundary temperature.
To simplify the calculation, only the temperature differences in the north–south and height directions of the greenhouse were considered, and the temperature distribution in the east–west direction of the greenhouse was uniform. Binary fitting functions were used to initialize the temperature in the east–west direction of the solar greenhouse. The general form of the binary function is as follows:
F = Ax2 y2 + Bx2 y + Cxy2 + Dx2 + Ey2 + Fxy + Gx + Hy + I.
According to the actual situation of the test, 9:00, 15:00, and 21:00 were selected as the initial simulation times of G1, G2, and G3, respectively. In this paper, regression equations were established to consider the dynamic changes in outdoor temperature, relative humidity, and wind speed. The back wall, soil, and air were initialized by constructing binary fitting functions of height and span concerning temperature using Origin software. Similarly, to better simulate the temperature dynamic changes of the greenhouse enclosure structure, binary fitting functions of height and time concerning temperature were constructed, and the specific results are shown in Figure 4.

2.5. Boundary Conditions and Model Solving

When the greenhouse was in a closed state (G1 and G3), the temperature of the greenhouse soil, air, back wall, and surface temperature of the enclosure structure were all measured, initialized with the binary fitting functions constructed in Section 2.4, and loaded into CFD through UDF. When the upper air outlet of the greenhouse was opened (G2), the north side of the outer fluid domain was set as the velocity inlet, the boundary condition was the regression equation obtained by fitting the actual measured wind speed, and the south side was set as the pressure outlet, which was atmospheric pressure. The physical parameters of the main materials in the CFD model of the solar greenhouse are shown in Table 1 [6,28].
In this paper, ANSYS Fluent was used as the solver for 3D transient simulation. The actual simulation duration was 1 h, the time step was 5 min, and the number of iterations was 30 times. The Reynolds N-S equations are solved using the finite volume method (FVM) and semi-implicit pressure equation (SIMPLEC) algorithms. The standard K-epsilon turbulence model was adopted, and the standard wall function was selected as the wall function, and it was verified that the range of dimensionless wall distance y+ in each area of the models was 10~150, which could meet the calculation accuracy [29]. Furthermore, the laminar flow model was enabled in the crop area. To improve the calculation accuracy, the momentum equation and turbulence equation were discretized by the second-order upwind method.

2.6. Evaluation Index

2.6.1. Model Validation Evaluation Index

To evaluate the reliability of the numerical model, the standard root means square error (RMSE) and mean absolute error (MAE) were used to judge the degree of fit between the simulated and measured values. RMSE reflected the sensitivity and extreme value of the simulation value, and MAE reflected the accuracy level of the model. The smaller the RMSE and MAE values, the higher the accuracy of the numerical model. These can be expressed as follows:
R M S E = i = 1 n ( P i O i ) 2 n .
M A E = i = 1 n | P i O i | n ,
where P i is the measured value, O i is the simulated value, and n is the number of measured values.

2.6.2. Correlation Evaluation Index

To analyze the interaction between soil, crops, and the back wall, the correlation coefficient was introduced to evaluate the correlation degree between variables. The correlation coefficient was as follows:
R = i = 1 n ( x i x ¯ ) ( y i y ) i = 1 n ( x i x ¯ ) 2 ( y i y ) 2 ,
where R is the correlation coefficient, and x i and y i are the corresponding elements of the two variables. The closer the absolute value of the correlation coefficient between variables is to 1, the higher the degree of correlation is.

3. Results and Discussion

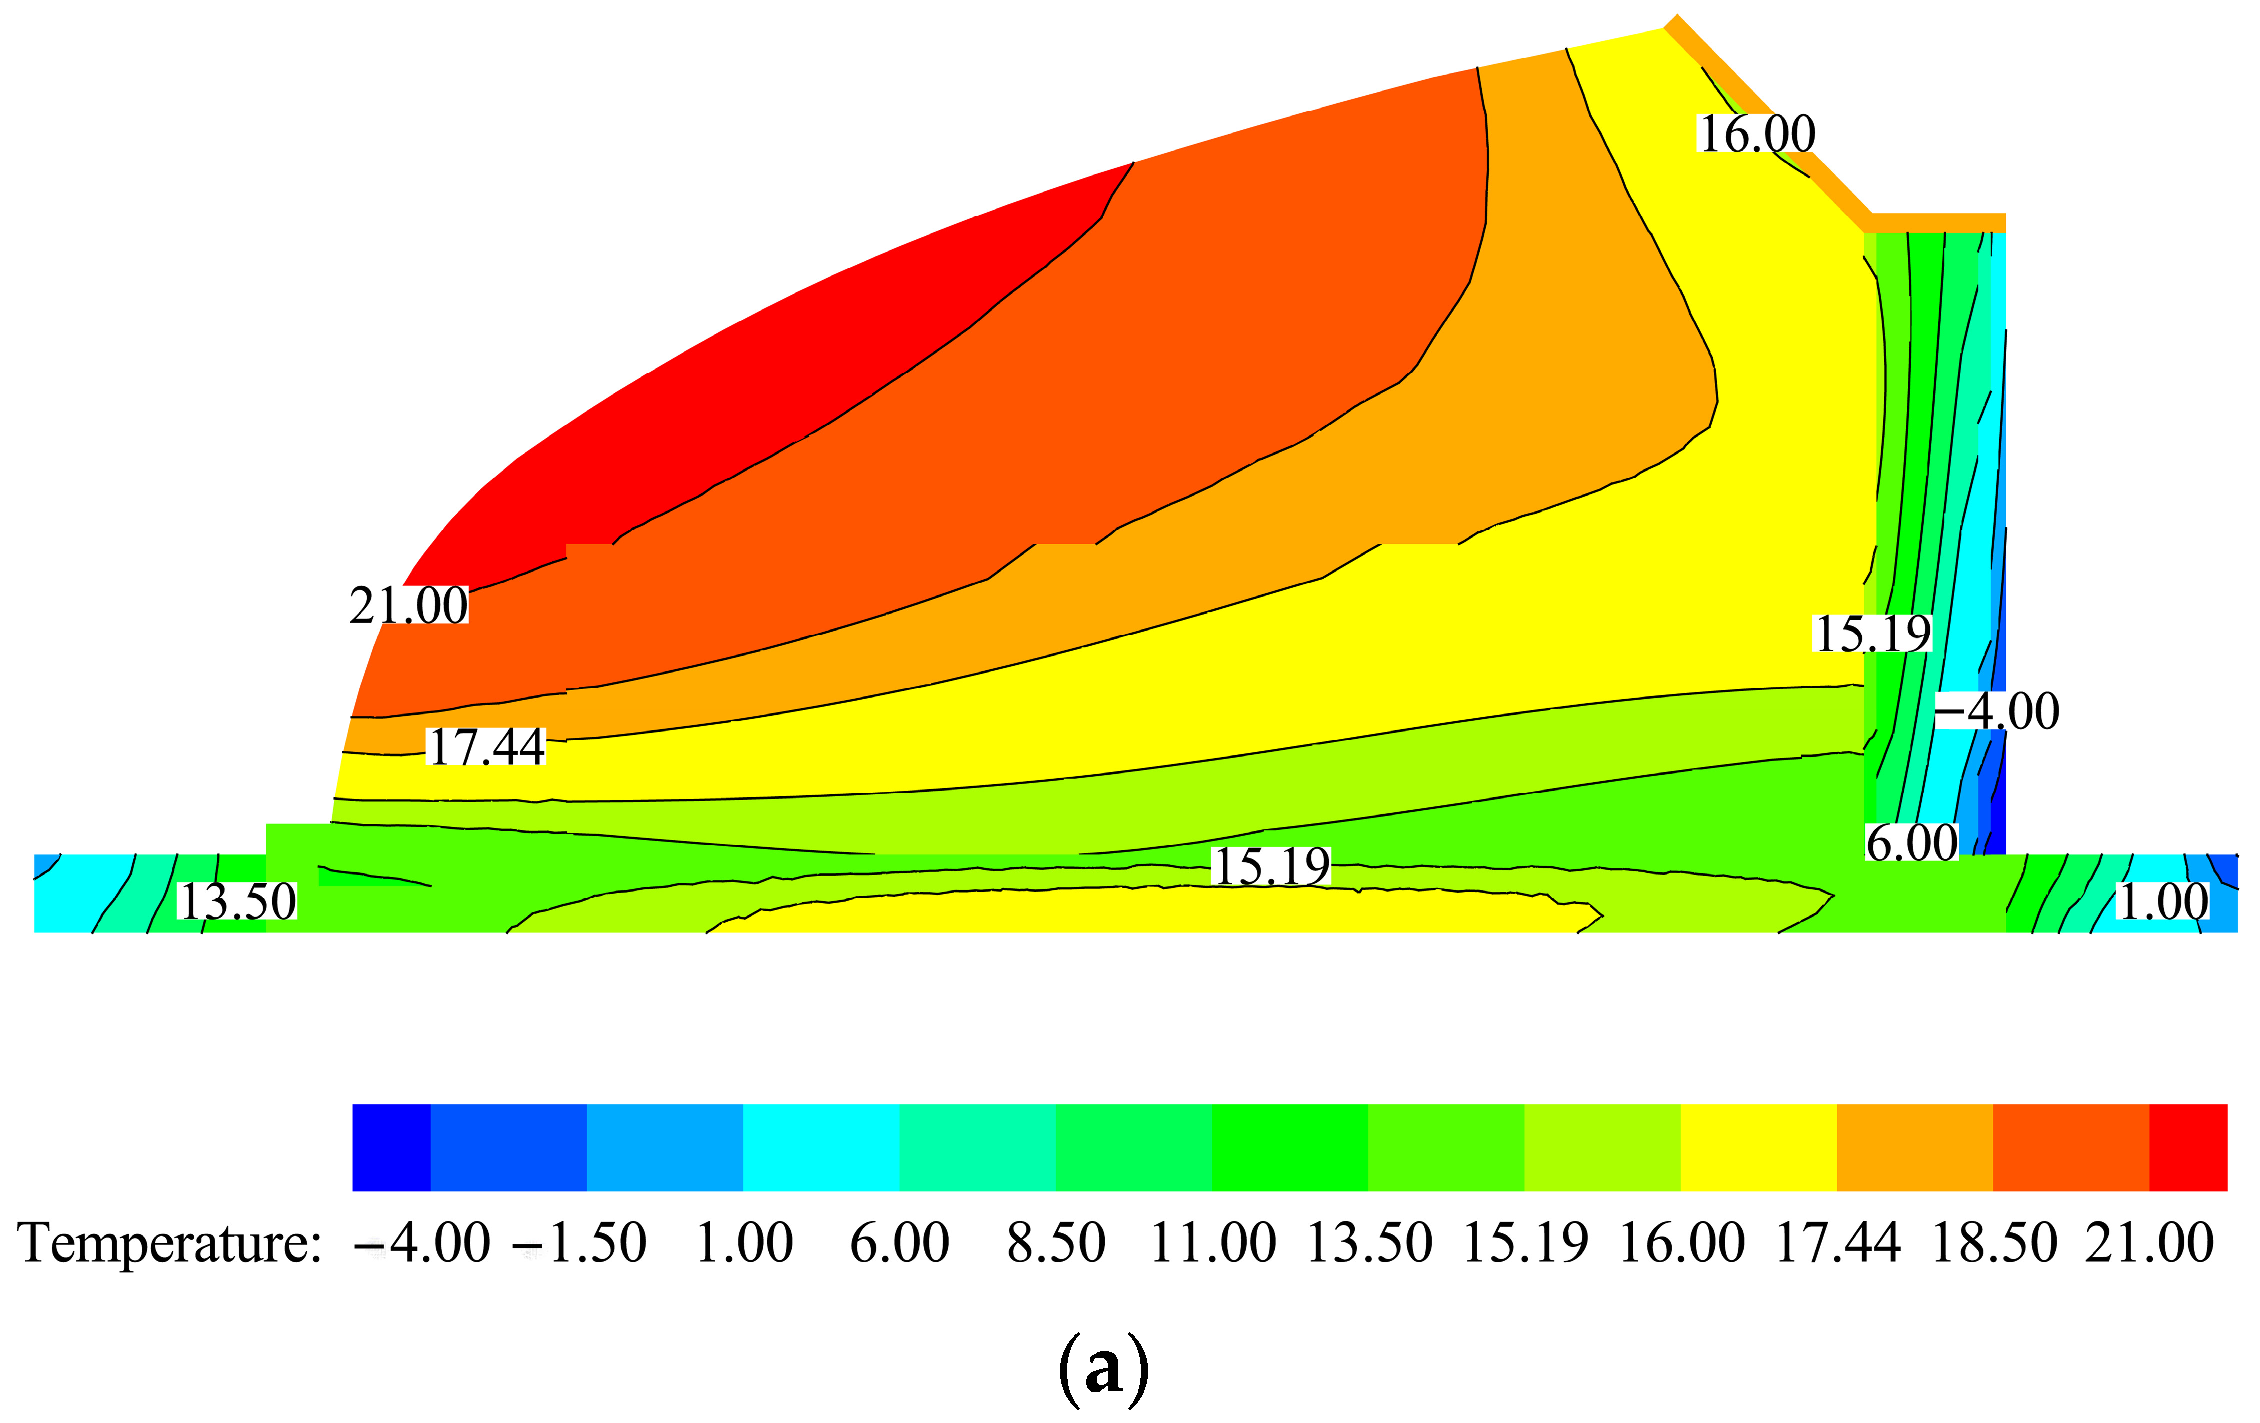
3.1. Analysis of Solar Greenhouse Environment

Temperature and humidity are important parameters of environmental regulation. Maintaining reasonable indoor temperature and humidity not only contributes to the growth of crops but also greatly reduces the probability of crop diseases and insect pests, which contribute to the efficient production of greenhouses. Figure 5a shows the daily variation curves of indoor temperature and relative humidity. Before the insulation was rolled up, the indoor temperature was low and the relative humidity was high. The temperature reached the lowest value of 10.71 °C at 7:10, and the relative humidity reached the maximum value of 95.22% at 8:30. After rolling up the insulation quilt, the indoor temperature rose rapidly and the relative humidity decreased rapidly. When the temperature was higher than 30 °C, the top ventilation window was fully opened, and the indoor temperature dropped briefly and then continued to rise. At 11:00, the maximum temperature was 29.37 °C. Figure 5b shows the daily variation curves of outdoor temperature and relative humidity. By querying the sunrise and sunset time of the same day as 7:50 am and 6:50 pm, respectively, it can be seen that the temperature and relative humidity changed significantly at the two time points. In addition, the fluctuation range of temperature and humidity in the daytime was larger than that in the night, indicating that solar radiation had an obvious impact on the thermal and humidity environment. Figure 5c shows the daily temperature variation curves of different height layers of the back wall. The average temperatures of the back wall at the height of 0.5 m, 2 m, and 3.5 m were 3.66 °C, 8.37 °C, and 10.68 °C, respectively. It can be seen that the higher the height of the back wall, the higher the internal temperature of the wall, and more energy was stored. Figure 5d shows the daily variation curves of indoor and outdoor soil temperatures. The average temperatures of indoor soil, marginal soil in the north, and marginal soil in the south were 16.46 °C, −2.81 °C, and 0.50 °C, respectively. The indoor soil temperature was much higher than the marginal soil temperature in the north and south, indicating that the greenhouse had significant thermal insulation and warming effects. Since the south side received more solar radiation, the temperature was slightly higher than the soil temperature on the north side.

3.2. Model Validation

A typical greenhouse section (Z = 30 m) was selected to analyze the indoor transient temperature and humidity distribution. To verify the validity of the established CFD model, the RMSE and the MAE of the measured and simulated values of soil temperature, air temperature, relative humidity, and back wall temperature, respectively, were calculated. The calculation results were shown in Table 2.
For different working conditions, the errors of temperature and relative humidity in each area under ventilation conditions (G2) were more significant. Furthermore, it exchanged heat and moisture with the indoor climate, and the mass and heat transfer process was more complicated. For the same working condition, the MAE and RMSE of the air temperature and relative humidity were higher, mainly because the indoor air temperature and relative humidity were comprehensively affected by various environmental factors such as soil, crops, and the back wall. For the CFD models established in this paper, under the three working conditions, the maximum RMSE of temperature and relative humidity were 2.53 °C and 5.66%, and the maximum MAE of temperature and relative humidity were 2.17 °C and 4.65%, which proved the effectiveness of the models.

3.3. Numerical Simulation under Different Working Conditions

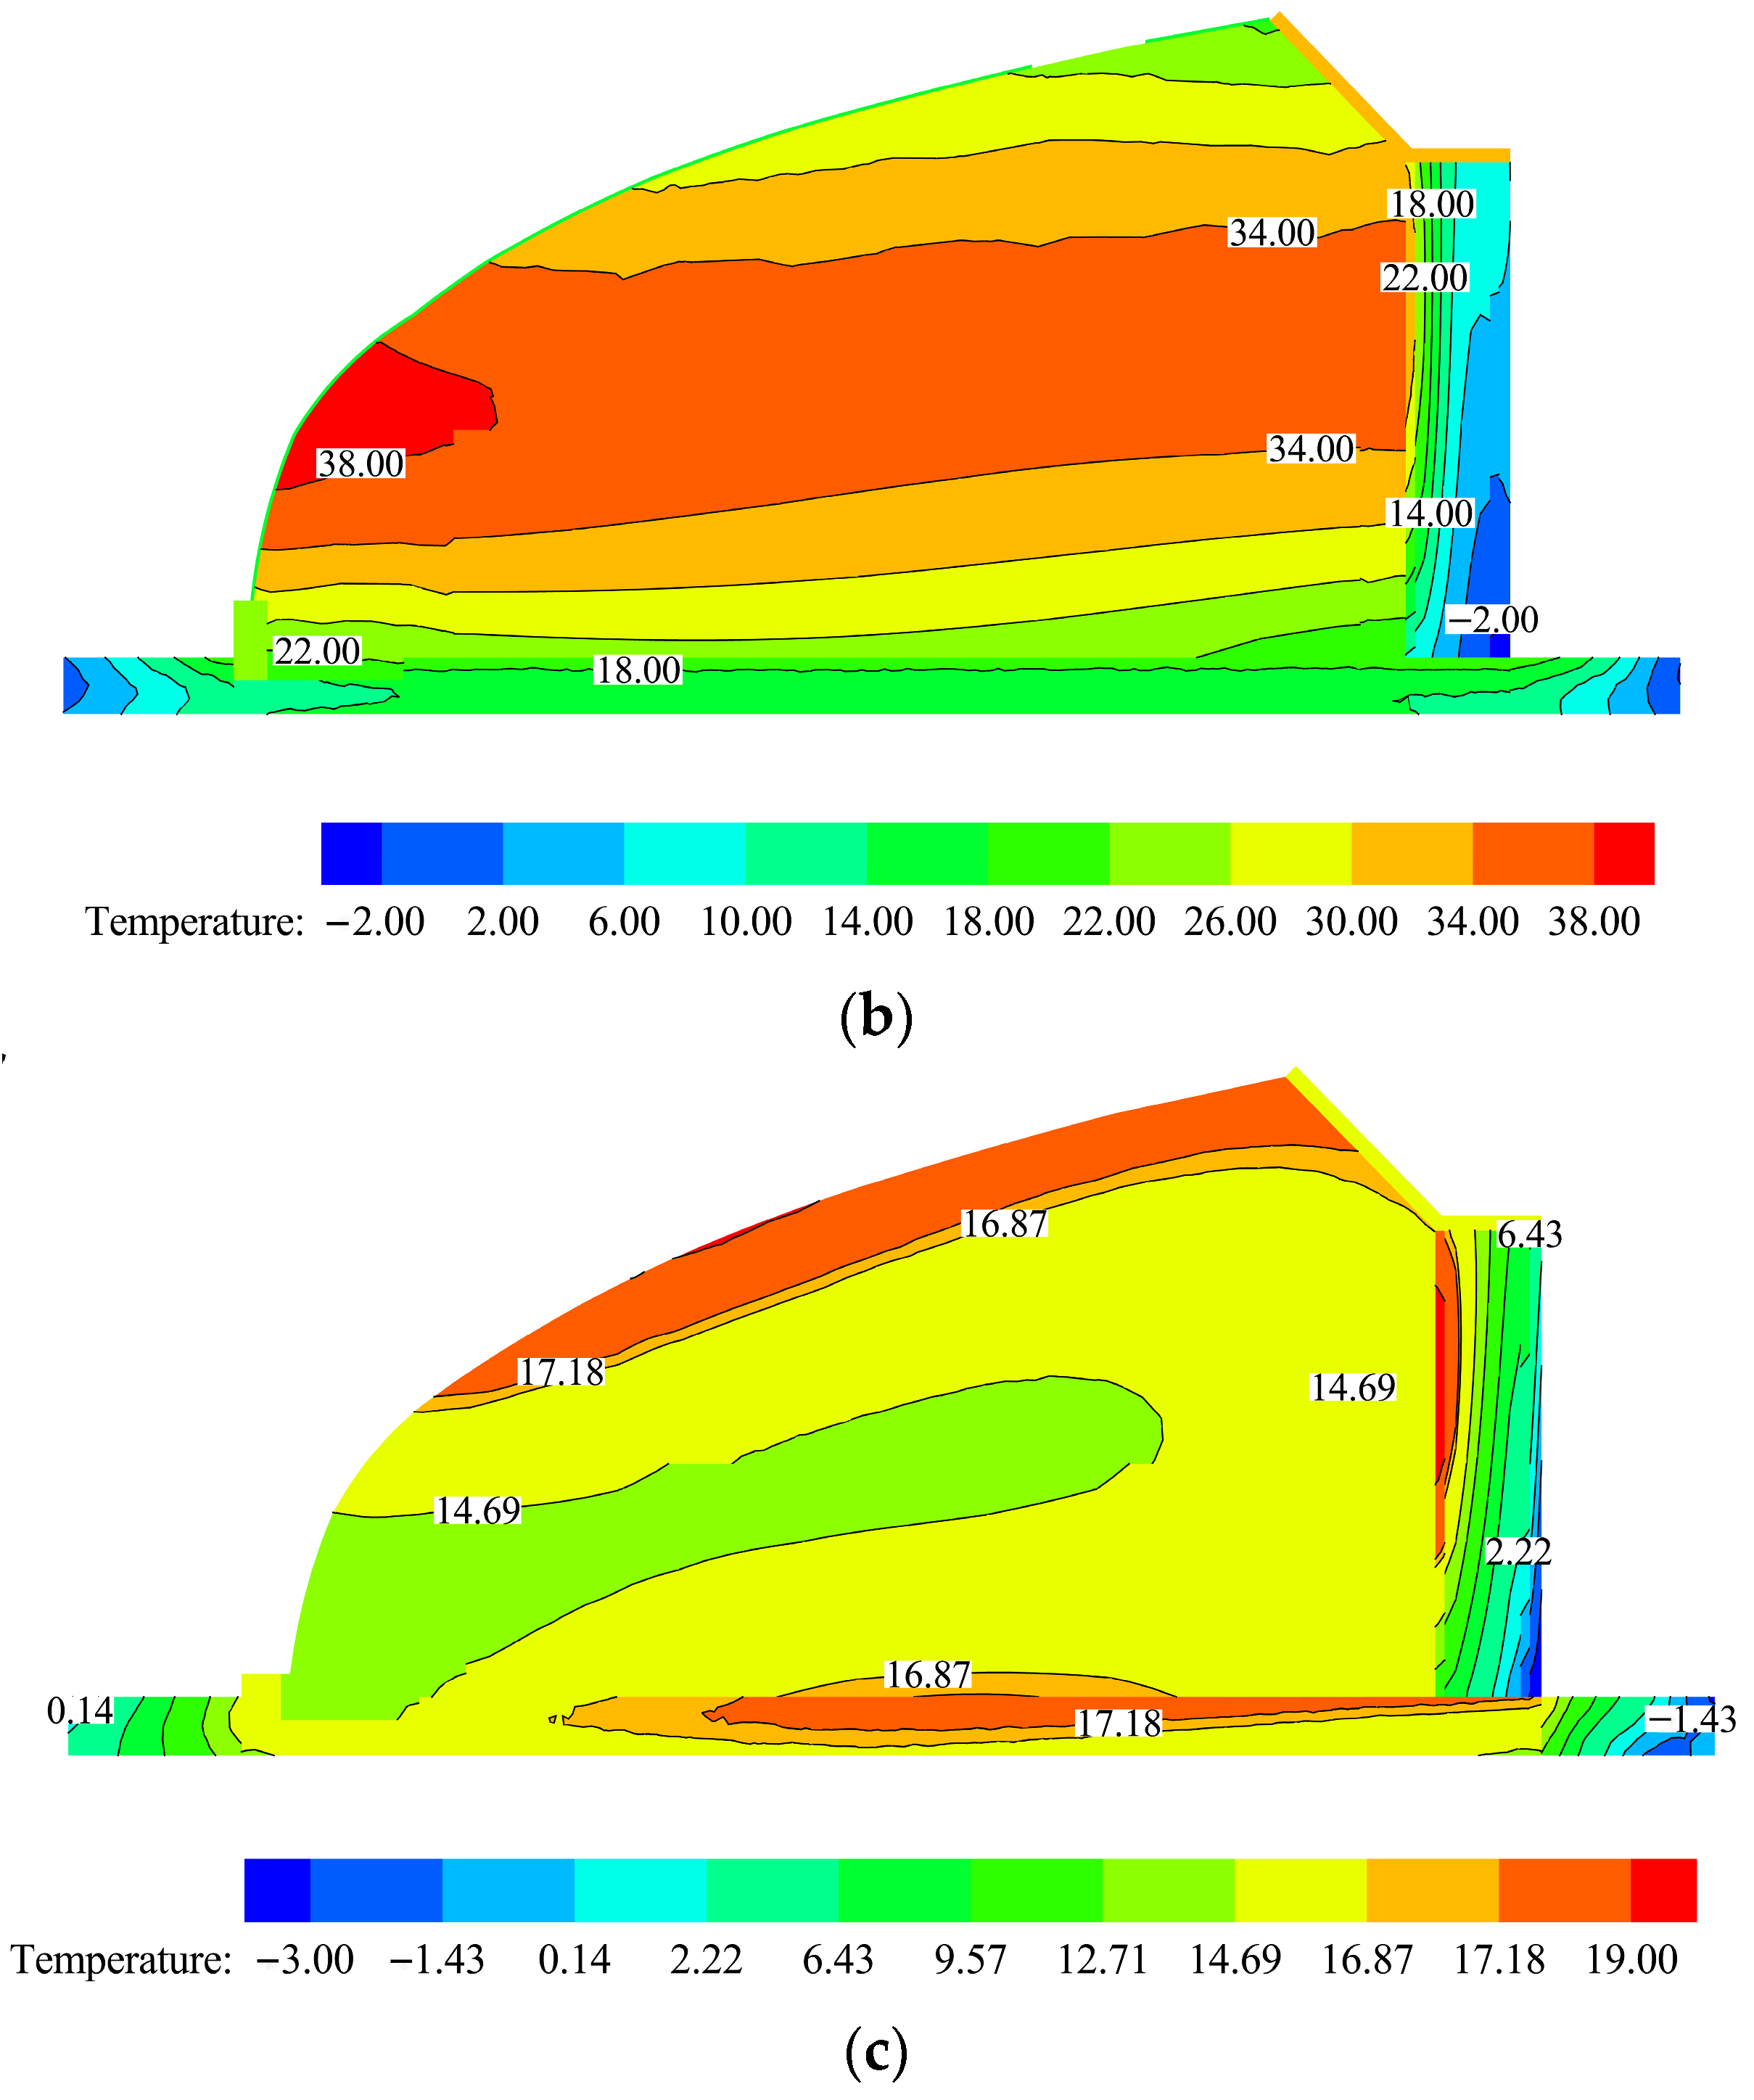
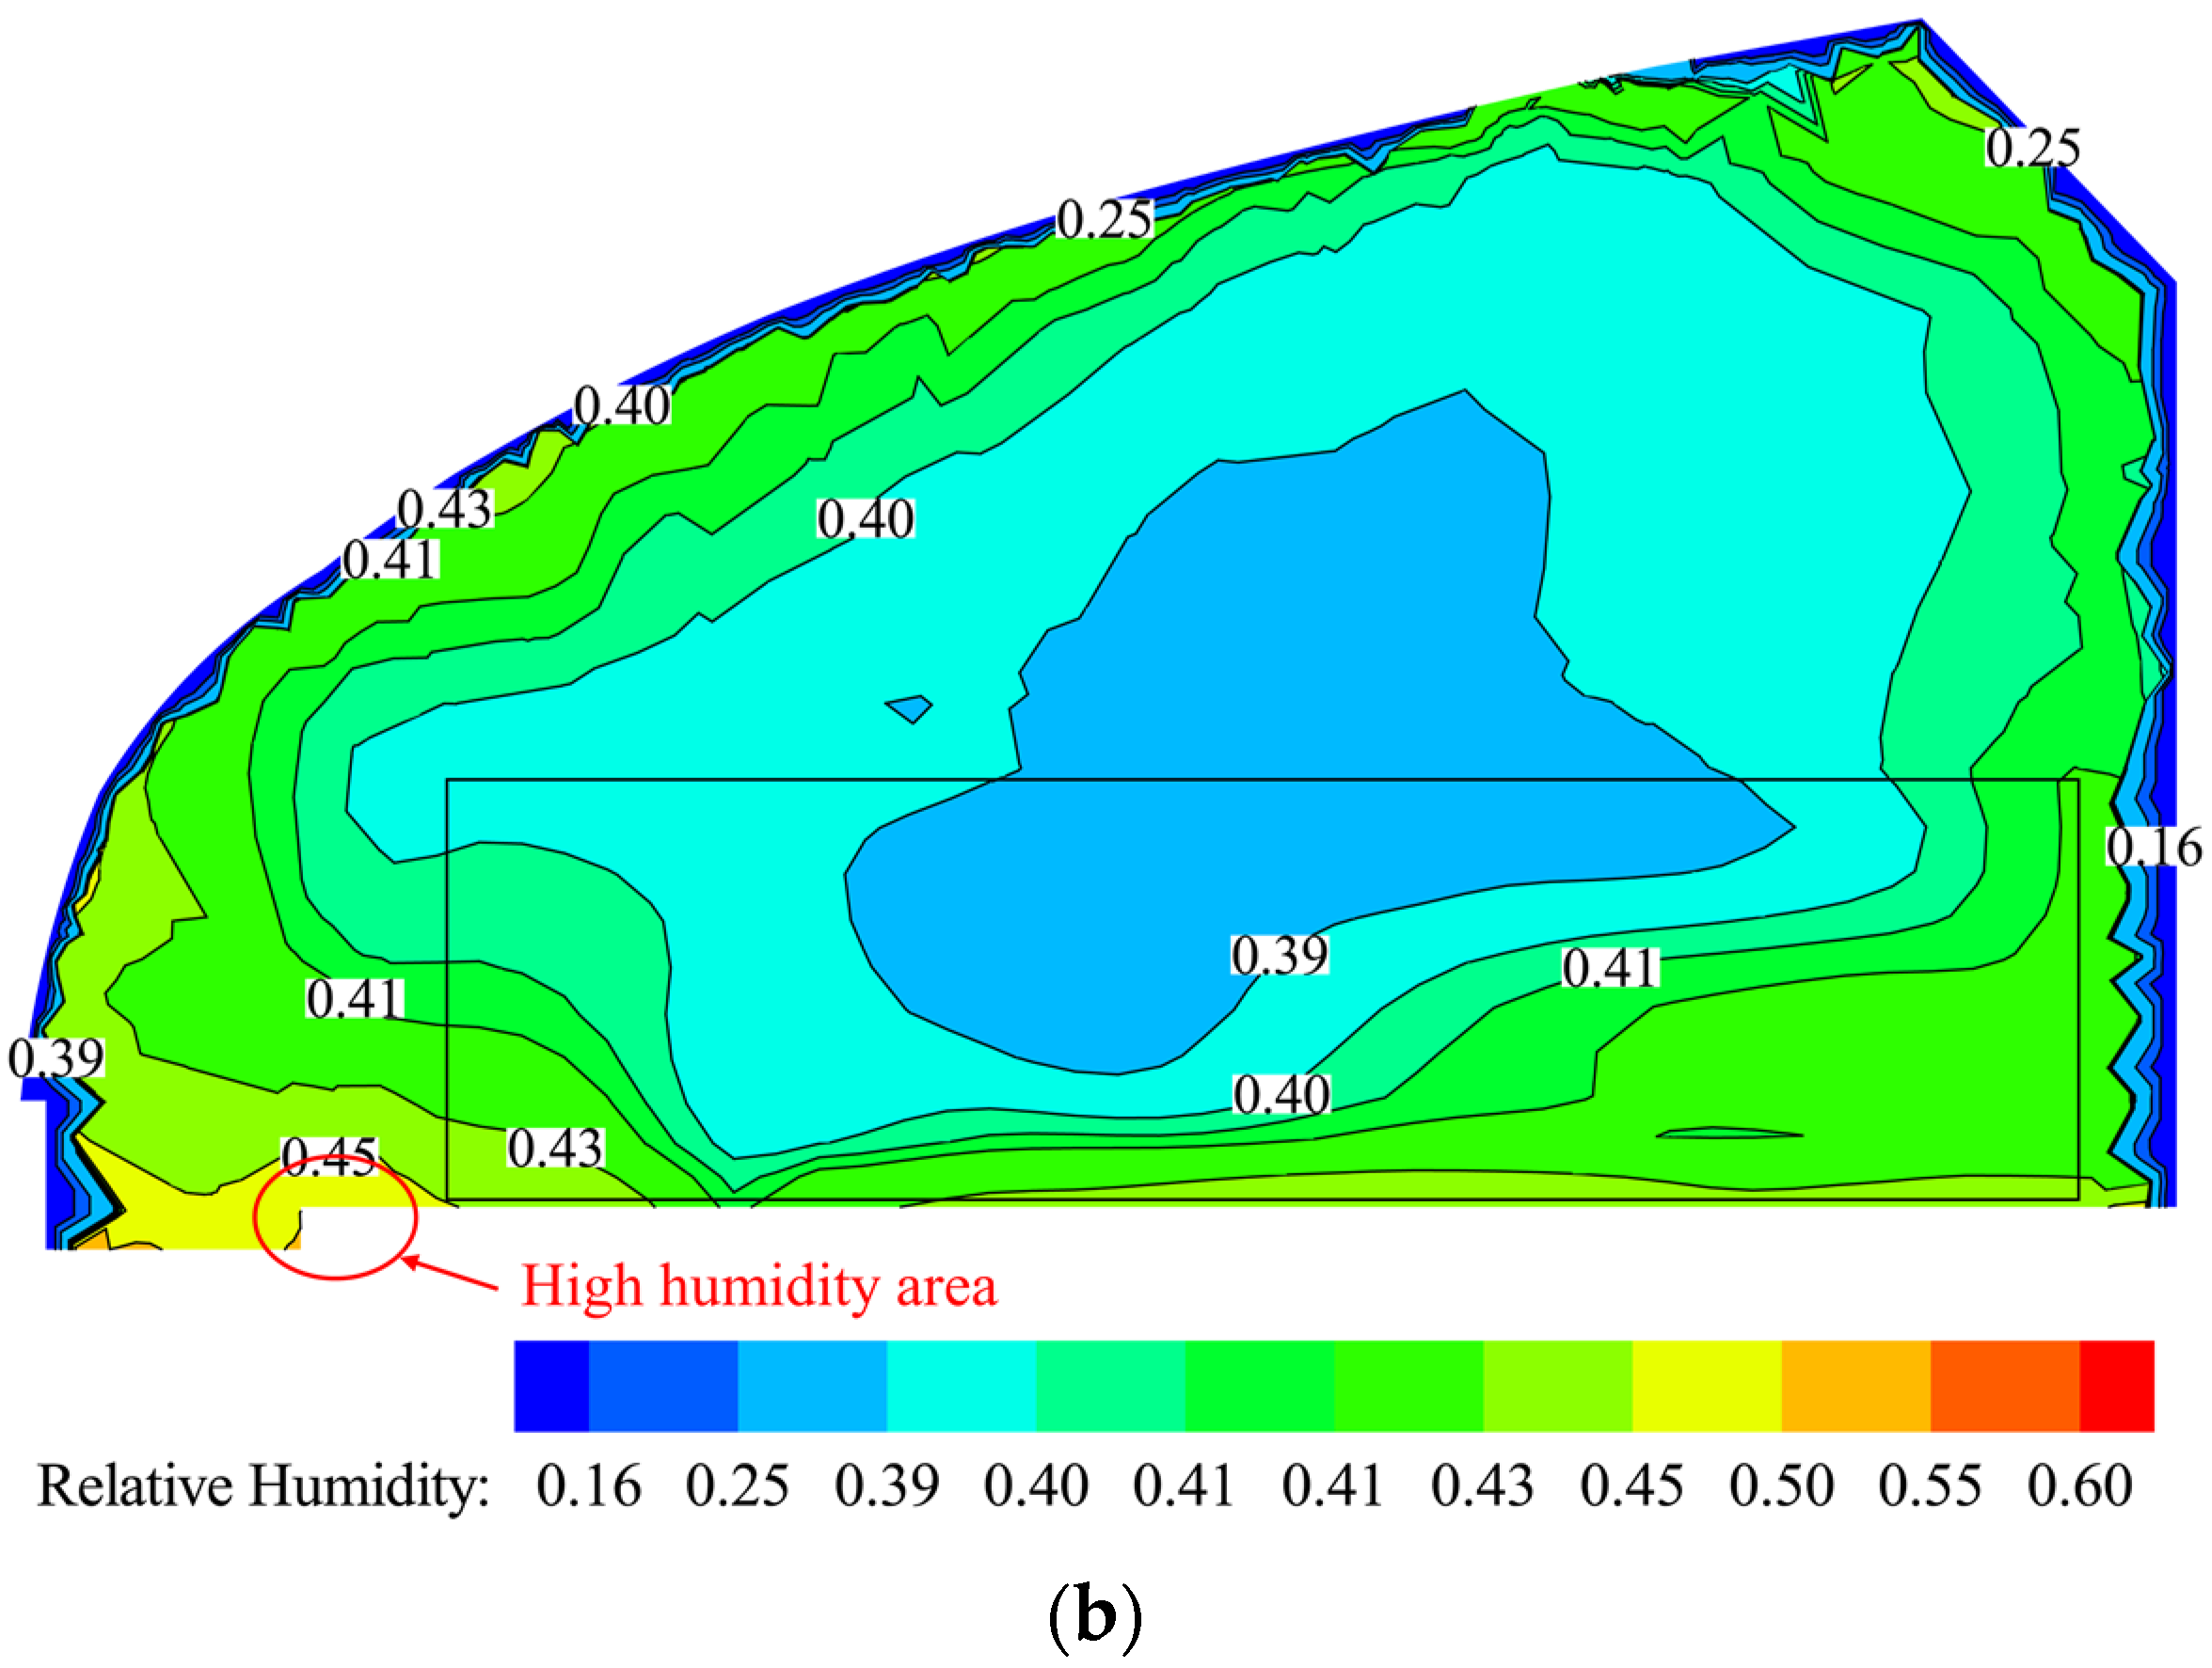
3.3.1. Numerical Simulation of Daytime Insulation Uncovered and Ventilation Window Closed (G1)

During the day, when the insulation was uncovered and the ventilation opening was closed, the main source of indoor energy in the greenhouse was solar radiation. Figure 6a reveals the temperature distribution of typical sections in the solar greenhouse under the G1 working condition. It was observed that the indoor air temperature was much higher than that of the soil and the back wall, which were both in a state of heat absorption. The temperature distribution of the back wall gradually decreased along the thickness direction from inside to outside, because the indoor temperature was much higher than the outdoor temperature, forming a temperature gradient in the thickness direction. The temperature of the back wall gradually increased from bottom to top along the height direction, because the hot air was heated up and gathered upward, and the upper layer of the back wall absorbed more heat than the lower layer in the height direction. The indoor soil temperature was much higher than the marginal soil temperature in the north and south, mainly because the greenhouse had good heat preservation and warming characteristics. The marginal soil temperature on the south side was higher than that on the north side, mainly due to the difference in the amount of solar radiation received. The marginal soil on the north side was shielded by the greenhouse building itself, resulting in less heat storage and lower overall temperature.
Figure 6b reveals the humidity distribution of the typical section of the solar greenhouse under the G1 working condition. It was observed that the lower layer humidity was high and the upper layer humidity was low in the crop area, mainly because the upper layer of the crop canopy received more solar radiation, the temperature was higher than the temperature below the crop, and the capacity of carrying water vapor was higher. For the greenhouse as a whole, the high humidity area was mainly concentrated in the aisle position, mainly because the location of the area temperature was low, and the actual production was prone to condensation.

3.3.2. Numerical Simulation of Daytime Insulation Uncovered and Ventilation Window Opened (G2)

Generally speaking, the optimal growth temperature of tomatoes was 18.3–32.2 °C [30], and the relative humidity was 60–90%, which was suitable for tomato growth in greenhouse cultivation [31]. In sunny weather conditions in winter, indoor temperatures would exceed the optimum temperature for tomatoes without ventilation. Therefore, the intelligent ventilation system was set to fully open the top ventilation window when it exceeded 30 °C, to exchange with outdoor cold air with low relative humidity. Figure 7a reveals the temperature distribution of the typical section of the solar greenhouse under the G2 working condition. It was observed that the indoor temperature was affected by the ventilation through the top window, and the temperature near the ventilation window was the lowest. As the cold air flowed along the back wall, the temperature in this area decreased. However, due to the low outdoor wind speed (1–2.8 m/s), the influence of outdoor airflow on indoor microclimate was limited, and the direction of the indoor air temperature gradient was still from bottom to top.
As the outdoor air was cold and dry, it exchanged with the warm and humid air indoors, which can take away some water vapor, but the indoor air temperature decreased, making the relative humidity of the air rise. Figure 7b revealed the humidity distribution of typical sections of the solar greenhouse under the G2 working condition.
The relative humidity near the ventilation window was low, and the indoor humidity distribution was affected by natural ventilation, which affected the uniformity of humidity distribution. Areas of higher relative humidity remained in the aisle.

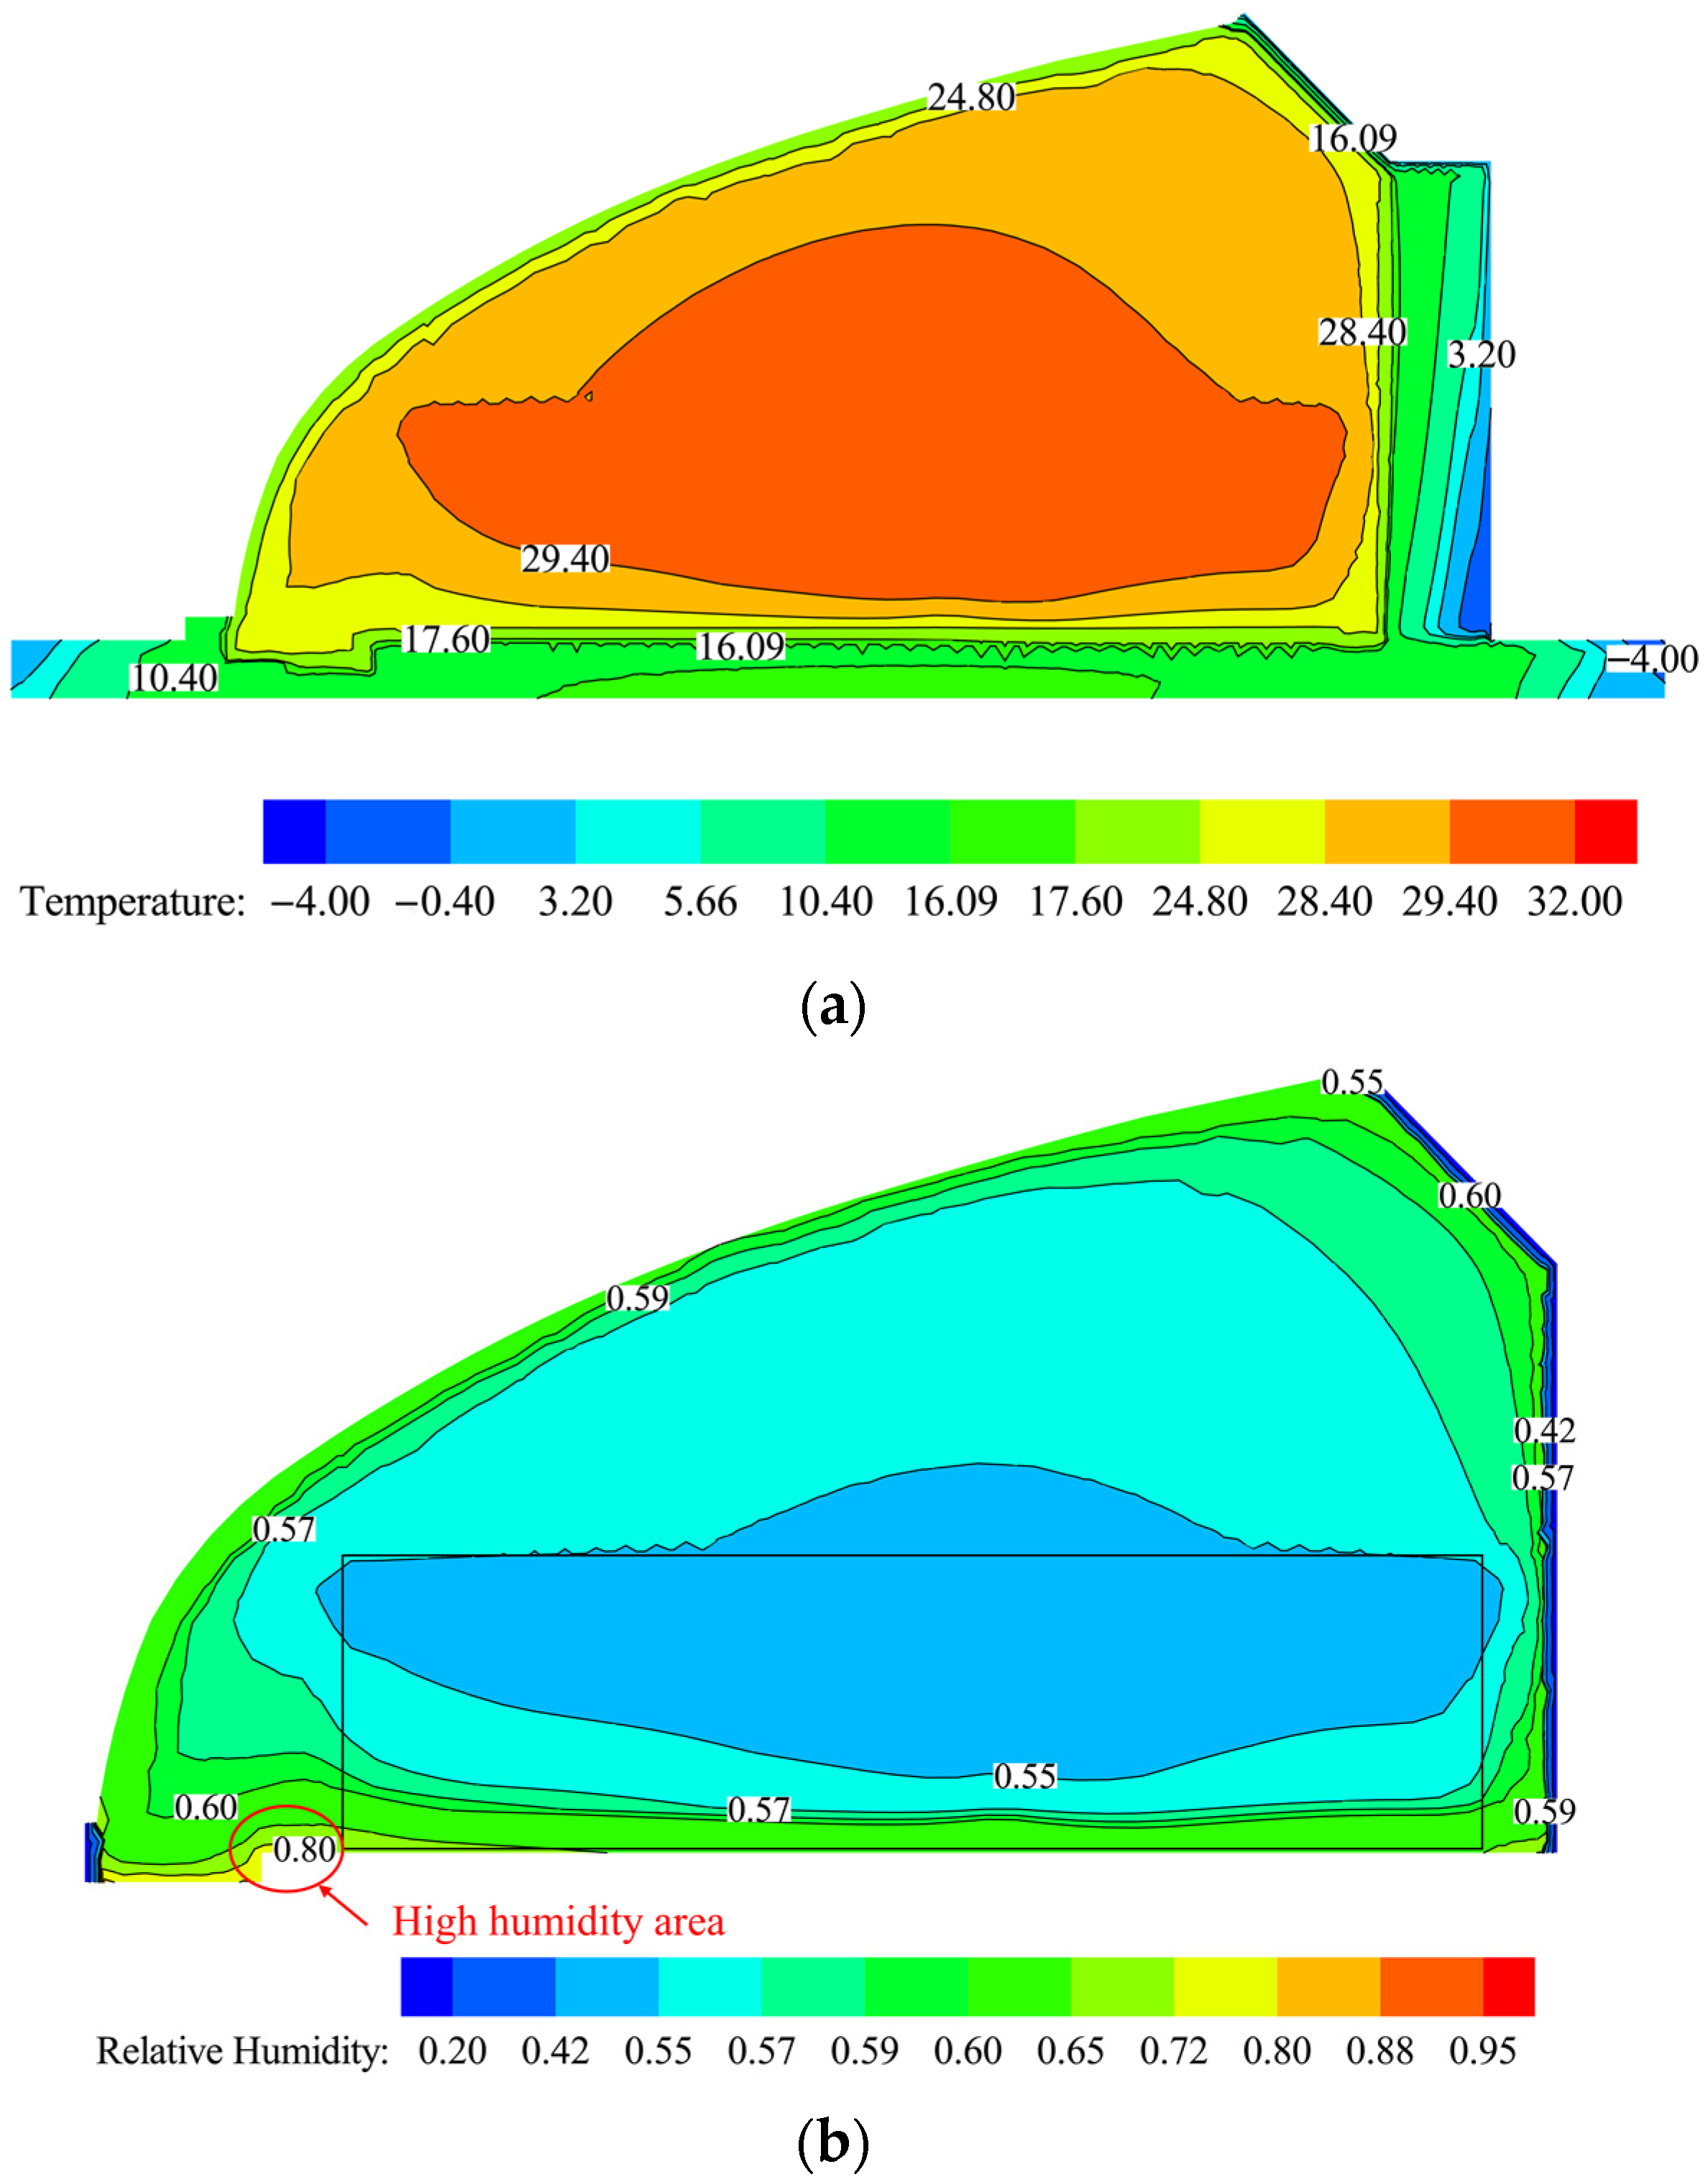
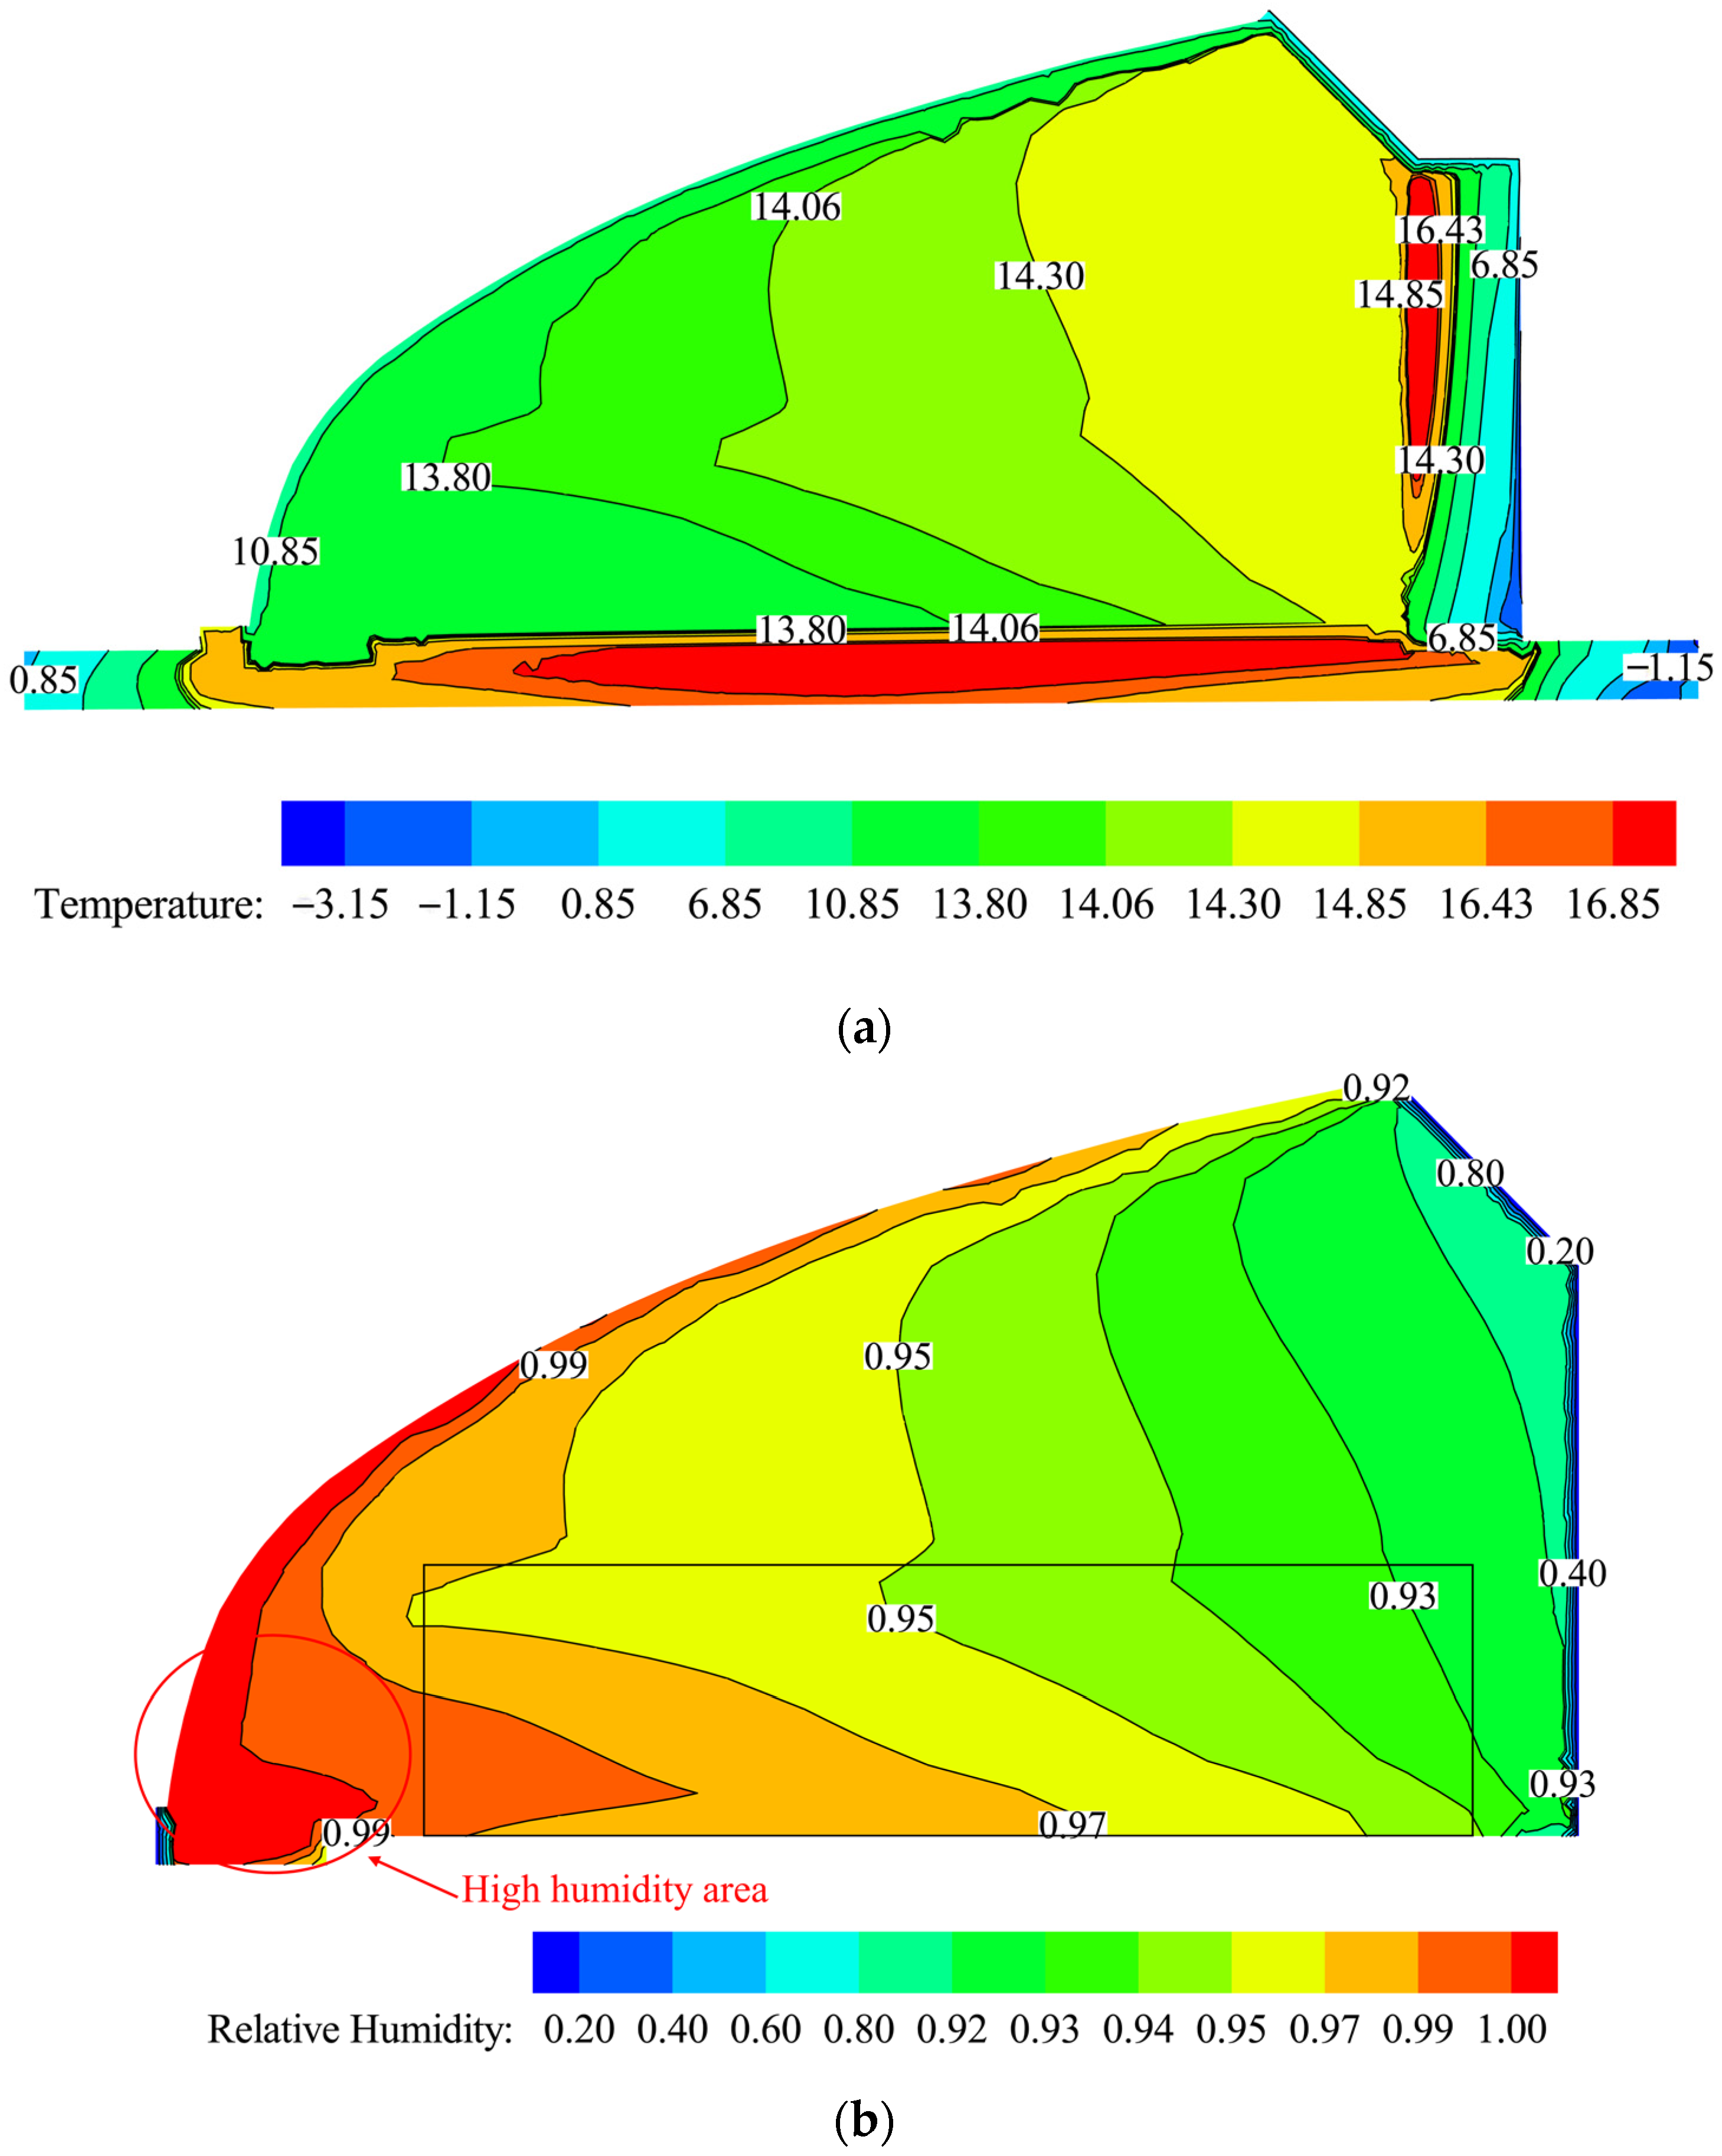
3.3.3. Numerical Simulation of Nighttime Insulation Put down and Ventilation Window Closed

At night, when the insulation was put down and the ventilation opening was closed, the indoor temperature was mainly maintained by the soil and the heat stored in the back wall. Figure 8a reveals the typical cross-section temperature distribution of the solar greenhouse under the G3 working condition. It was observed that the indoor soil and inner surface temperature of the back wall were higher than the indoor air temperature, and the indoor air temperature presented a diffuse distribution. At this point, the soil and the back wall were in an exothermic state. The temperature distribution of the back wall and soil was similar to that described in Section 3.3.1, but the temperature difference between indoor air and the back wall and soil surface at night was smaller than that in G1 during the day.
Figure 8b reveals the relative humidity distribution of a typical section of a solar greenhouse under the G3 working condition. It was observed that the temperature and relative humidity distribution had a strong negative correlation, that is, the higher the temperature, the lower the humidity. The relative humidity in the front roof and hallway area was relatively high, close to 100%, which was caused not only by the low temperature in this area but also because of the accumulation of moisture in the front roof due to the indoor airflow.

3.4. Correlation Analysis of Indoor Air Temperature and Relative Humidity with Back Wall and Soil Temperature

We analyzed the relationship between indoor air temperature and relative humidity and the temperature of the back wall and soil to further deepen the understanding of the law of heat and moisture heat transfer inside the greenhouse. SPSS software was used to test the normal distribution of all environmental variables [8], and the results showed that air temperature, relative humidity, soil temperature, and back wall temperature did not conform to normal distribution. Therefore, Spearman correlation analysis was used to calculate the correlation coefficient of indoor air temperature and relative humidity with soil temperature and back wall temperature under different conditions. The environment variables were the north marginal soil temperature (X1, °C), the indoor soil temperature (X2, °C), the south marginal soil temperature (X3, °C), the 0.5 m back wall level temperature (X4, °C), the 2 m back wall elevation layer temperature (X5, °C), and the 3.5 m back wall elevation layer temperature (X6, °C). The calculation results are shown in Table 3.
It can be seen from Table 3 that under the G1 and G3 working conditions, the indoor air temperature was positively correlated with each environmental variable, while indoor relative humidity was negatively correlated with each environmental variable. Under the G1 working condition, the correlation between indoor air temperature and soil temperature on the south side was high, because the soil temperature on the south side was rapidly increased by solar radiation, while the indoor soil and the marginal soil at the north side were shielded by crops and the back wall, and the temperature rise was relatively insignificant. The correlation between indoor air temperature and the temperature at 3.5 m height of the back wall was higher because the hot air was mainly concentrated above the greenhouse, which can absorb more heat. The indoor air relative humidity was highly correlated with the indoor soil temperature and the temperature of the 3.5 m high rise behind the back wall.
Under the G3 working condition, the correlation between indoor air temperature and indoor soil temperature was high, because there was no solar radiation at night, and the source of the indoor temperature depended on the heat accumulated by the soil and the back wall during the day. The correlation between the indoor air temperature and the temperature at the 3.5 m height of the back wall was higher, because the higher the back wall, the more heat accumulated during the day, and the greater the impact on the indoor temperature. In addition, the indoor soil temperature and the temperature of the back wall had a high correlation with the indoor air temperature, which reflected the important influence of soil and the heat storage capacity of the back wall on the thermal environment of the greenhouse at night. Indoor air relative humidity had a high correlation with indoor soil temperature and the 3.5 m height layer temperature of the back wall. Under the G2 working condition, due to the influence of ventilation, the correlation between indoor temperature and relative humidity, soil temperature, and back wall temperature was weakened, or even insignificant, indicating that the influence of soil and back wall temperatures on indoor temperature and relative humidity was weakened under ventilation.

4. Conclusions

In this paper, a CFD model was established to consider the distribution of temperature and humidity in a solar greenhouse under the interaction between soil, crops, and the back wall. In addition, binary fitting functions were constructed to achieve precise boundary conditions and integrated with CFD models through UDF. The distribution laws of the temperature field and humidity field in the solar greenhouse under three different working conditions were studied. The results showed that the maximum RMSE of temperature and relative humidity were 2.53 °C and 5.66%, and the maximum MAE of temperature and relative humidity were 2.17 °C and 4.65%, which proved the effectiveness of the models.
The temperature and humidity distribution was analyzed for different working conditions, and the results showed that there was a big difference in the temperature and humidity distribution of the indoor air in the solar greenhouse, while the soil temperature was consistent with the temperature distribution of the back wall. In addition, the areas with higher humidity were mainly in the aisles.
The correlation analysis of different working conditions showed that under the G1 and G3 working conditions, the indoor air temperature was positively correlated with each environmental variable, while the indoor relative humidity was negatively correlated with each environmental variable. Under the G2 working condition, due to the influence of ventilation, the correlation between indoor temperature and relative humidity, soil temperature, and back wall temperature was weakened, or even insignificant.
In this paper, by exploring the law of thermal and humidity transfer in the greenhouse system, it is helpful to further study the change law between the greenhouse structure, control measures, and indoor microclimate, and provide theoretical guidance for subsequent agricultural production.

Author Contributions

Conceptualization, C.S. and F.H.; methodology, C.S. and F.H.; software, L.Z.; validation, C.S., F.H. and Z.G.; formal analysis, F.Q. and X.D.; investigation, X.D.; resources, F.Q. and F.H.; data curation, C.S. and F.H.; writing—original draft preparation, C.S.; writing—review and editing, C.S. and F.H.; visualization, C.S.; supervision, Q.F.; project administration, F.H. and F.Q.; funding acquisition, F.H. All authors have read and agreed to the published version of the manuscript.

Funding

This paper is a part research accomplishment of the project “Key Research Development Program of Hebei Province (grant numbers 22327214D)”, which is supported by Science and Technology Department of Hebei Province of China.

Data Availability Statement

Not applicable.

Conflicts of Interest

The authors declare no conflict of interest.

References

  1. Choab, N.; Allouhi, A.; El Maakoul, A.; Kousksou, T.; Saadeddine, S.; Jamil, A. Review on greenhouse microclimate and application: Design parameters, thermal modeling and simulation, climate controlling technologies. Sol. Energy 2019, 191, 109–137. [Google Scholar] [CrossRef]
  2. Zhang, X.; Wang, H.; Zou, Z.; Wang, S. CFD and weighted entropy based simulation and optimisation of Chinese Solar Greenhouse temperature distribution. Biosyst. Eng. 2016, 142, 12–26. [Google Scholar] [CrossRef]
  3. Abbas, Z.; Yong, L.; Abbas, S.; Chen, D.; Li, Y.; Wang, R. Performance analysis of seasonal soil heat storage system based on numerical simulation and experimental investigation. Renew. Energy 2021, 178, 66–78. [Google Scholar] [CrossRef]
  4. Li, Y.; Liu, X.; Qi, F.; Wang, L.; Li, T. Numerical investigation of the north wall passive thermal performance for Chinese solar greenhouse. Therm. Sci. 2020, 24, 3465–3476. [Google Scholar] [CrossRef]
  5. Zhang, X.; Lv, J.; Dawuda, M.M.; Xie, J.; Yu, J.; Gan, Y.; Zhang, J.; Tang, Z.; Li, J. Innovative passive heat-storage walls improve thermal performance and energy efficiency in Chinese solar greenhouses for non-arable lands. Sol. Energy 2019, 190, 561–575. [Google Scholar] [CrossRef]
  6. Wang, J.; Li, S.; Guo, S.; Ma, C.; Wang, J.; Jin, S. Simulation and optimization of solar greenhouses in Northern Jiangsu Province of China. Energy Build. 2014, 78, 143–152. [Google Scholar] [CrossRef]
  7. Liu, X.; Li, H.; Li, Y.; Yue, X.; Tian, S.; Li, T. Effect of internal surface structure of the north wall on Chinese solar greenhouse thermal microclimate based on computational fluid dynamics. PLoS ONE 2020, 15, e0231316. [Google Scholar] [CrossRef] [Green Version]
  8. Fan, Z.; Liu, X.; Yue, X.; Zhang, L.; Xie, X.; Li, Y.; Li, T. Effect of external thermal insulation layer on the Chinese solar greenhouse microclimate. R. Soc. Open Sci. 2021, 8, 211–217. [Google Scholar] [CrossRef]
  9. Sypka, P.; Kucza, J.; Starzak, R. Assumptions for Fourier-based modelling of diurnal temperature variations in the top soil layer under Istebna spruce stands. Agric. For. Meteorol. 2016, 222, 71–86. [Google Scholar] [CrossRef]
  10. Roxy, M.S.; Sumithranand, V.B.; Renuka, G. Estimation of soil moisture and its effect on soil thermal characteristics at Astronomical Observatory, Thiruvananthapuram, south Kerala. J. Earth Syst. Sci. 2014, 123, 1793–1807. [Google Scholar] [CrossRef] [Green Version]
  11. Baille, A.; López, J.C.; Bonachela, S.; Gonzalez-Real, M.M.; Montero, J.I. Night energy balance in a heated low-cost plastic greenhouse. Agric. For. Meteorol. 2006, 137, 107–118. [Google Scholar] [CrossRef]
  12. Bonachela, S.; Granados, M.R.; López, J.C.; Hernández, J.; Magán, J.J.; Baeza, E.J.; Baille, A. How plastic mulches affect the thermal and radiative microclimate in an unheated low-cost greenhouse. Agric. For. Meteorol. 2012, 152, 65–72. [Google Scholar] [CrossRef]
  13. Katsoulas, N.; Stanghellini, C. Modelling crop transpiration in greenhouses: Different models for different applications. Agronomy 2019, 9, 392. [Google Scholar] [CrossRef] [Green Version]
  14. Kichah, A.; Bournet, P.E.; Migeon, C.; Boulard, T. Measurement and CFD simulation of microclimate characteristics and transpiration of an Impatiens pot plant crop in a greenhouse. Biosyst. Eng. 2012, 112, 22–34. [Google Scholar] [CrossRef]
  15. Boulard, T.; Roy, J.C.; Pouillard, J.B.; Fatnassi, H.; Grisey, A. Modelling of micrometeorology, canopy transpiration and photosynthesis in a closed greenhouse using computational fluid dynamics. Biosyst. Eng. 2017, 158, 110–133. [Google Scholar] [CrossRef]
  16. Norton, T.; Sun, D.W.; Grant, J.; Fallon, R.; Dodd, V. Applications of computational fluid dynamics (CFD) in the modelling and design of ventilation systems in the agricultural industry: A review. Bioresour. Technol. 2007, 98, 2386–2414. [Google Scholar] [CrossRef]
  17. Van Hooff, T.; Blocken, B. CFD evaluation of natural ventilation of indoor environments by the concentration decay method: CO2 gas dispersion from a semi-enclosed stadium. Build. Environ. 2013, 61, 1–17. [Google Scholar] [CrossRef]
  18. Ali, H.B.; Bournet, P.E.; Cannavo, P.; Chantoiseau, E. Using CFD to improve the irrigation strategy for growing ornamental plants inside a greenhouse. Biosyst. Eng. 2019, 186, 130–145. [Google Scholar]
  19. Li, H.; Ji, D.; Hu, X.; Xie, T.; Song, W.; Tian, S. Comprehensive evaluation of combining CFD simulation and entropy weight to predict natural ventilation strategy in a sliding cover solar greenhouse. Int. J. Agric. Biol. Eng. 2021, 14, 213–221. [Google Scholar] [CrossRef]
  20. Boulard, T.; Wang, S. Experimental and numerical studies on the heterogeneity of crop transpiration in a plastic tunnel. Comput. Electron. Agric. 2002, 34, 173–190. [Google Scholar] [CrossRef]
  21. Wilson, J.D. Numerical studies of flow through a windbreak. J. Wind. Eng. Ind. Aerodyn. 1985, 21, 119–154. [Google Scholar] [CrossRef]
  22. Roy, J.C.; Boulard, T.; Kittas, C.; Wang, S. PA—Precision Agriculture: Convective and ventilation transfers in greenhouses, Part 1: The greenhouse considered as a perfectly stirred tank. Biosyst. Eng. 2002, 83, 1–20. [Google Scholar] [CrossRef] [Green Version]
  23. Nield, D.A.; Bejan, A. Convection in Porous Media; Springer: New York, NY, USA, 2006; Volume 3. [Google Scholar]
  24. An, C.H.; Ri, H.J.; Han, T.U.; Kim, S.I.; Ju, U.S. Feasibility of winter cultivation of fruit vegetables in a solar greenhouse in temperate zone; experimental and numerical study. Sol. Energy 2022, 233, 18–30. [Google Scholar] [CrossRef]
  25. Stanghellini, C. Transpiration of Greenhouse Crops: An Aid to Climate Management; Wageningen University and Research: Wageningen, The Netherlands, 1987. [Google Scholar]
  26. Baille, M.; Baille, A.; Laury, J.C. Canopy surface resistances to water vapour transfer for nine greenhouse pot plant crops. Sci. Hortic. 1994, 57, 143–155. [Google Scholar] [CrossRef]
  27. Zhang, G.; Fu, Z.; Yang, M.; Liu, X.; Dong, Y.; Li, X. Nonlinear simulation for coupling modeling of air humidity and vent opening in Chinese solar greenhouse based on CFD. Comput. Electron. Agric. 2019, 162, 337–347. [Google Scholar] [CrossRef]
  28. Li, H.; Li, Y.; Yue, X.; Liu, X.; Tian, S.; Li, T. Evaluation of airflow pattern and thermal behavior of the arched greenhouses with designed roof ventilation scenarios using CFD simulation. PloS ONE 2020, 15, e0239851. [Google Scholar] [CrossRef]
  29. Blocken, B.; Stathopoulos, T.; Carmeliet, J. CFD simulation of the atmospheric boundary layer: Wall function problems. Atmos. Environ. 2007, 41, 238–252. [Google Scholar] [CrossRef]
  30. Shamshiri, R.R.; Jones, J.W.; Thorp, K.R.; Ahmad, D.; Man, H.C.; Taheri, S. Review of optimum temperature, humidity, and vapour pressure deficit for microclimate evaluation and control in greenhouse cultivation of tomato: A review. Int. Agrophys. 2018, 32, 287–302.087. [Google Scholar] [CrossRef]
  31. Suzuki, M.; Umeda, H.; Matsuo, S.; Kawasaki, Y.; Ahn, D.; Hamamoto, H.; Iwasaki, Y. Effects of relative humidity and nutrient supply on growth and nutrient uptake in greenhouse tomato production. Sci. Hortic. 2015, 187, 44–49. [Google Scholar] [CrossRef] [Green Version]
Figure 1. Structure of the experimental greenhouse: (a) Outside sight; (b) Inside sight; (c) Greenhouse structure diagram.
Energies 16 02305 g001aEnergies 16 02305 g001b
Figure 2. Distribution of measuring points in the experimental greenhouse: (a) Schematic diagram of measuring points in the center section; (b) Schematic diagram of measuring points at a horizontal height of 2 m on the north wall; (c) Schematic diagram of S11–S15 soil measuring points.
Energies 16 02305 g002
Figure 3. Geometric computation domain: (a) Geometric computational domain in the G1 and G3 working conditions; (b) Geometric computational domain in the G2 working condition.
Energies 16 02305 g003
Figure 4. Temperature initialization under different working conditions: (a) 9:00: Initial temperature distribution (G1); (b) 15:00: Initial temperature distribution (G2); (c) 21:00: Initial temperature distribution (G3).
Energies 16 02305 g004aEnergies 16 02305 g004b
Figure 5. Variation of environmental parameters in the solar greenhouse: (a) Daily variation of indoor air temperature and relative humidity; (b) Daily variation of outdoor air temperature and relative humidity; (c) Daily variation of back wall temperature; (d) Daily variation of soil temperature.
Energies 16 02305 g005aEnergies 16 02305 g005bEnergies 16 02305 g005c
Figure 6. Distribution of temperature and relative humidity under G1 working condition: (a) Temperature distribution at 10:00; (b) Relative humidity at 10:00 (×100%).
Energies 16 02305 g006
Figure 7. Distribution of temperature and relative humidity under the G2 working condition: (a) Temperature distribution at 16:00; (b) Relative humidity at 10:00 (×100%).
Energies 16 02305 g007aEnergies 16 02305 g007b
Figure 8. Distribution of temperature and relative humidity under the G3 working condition: (a) Temperature distribution at 22:00; (b) Relative humidity at 22:00 (×100%).
Energies 16 02305 g008
Table 1. Physical parameters of main materials in solar greenhouse.
ParametersPO FilmGableSoilTomato CropExtruded Polystyrene
Board
Thermal InsulationConcrete
Density (kg·m−3)95016001600560321502300
Specific heat
(J·kg−1·K−1)
160010502200210015001880920
Coefficient of thermal conductivity
(W·m−1·K−1)
0.191.4320.800.190.0280.061.51
Absorption coefficient (m−1)0.150.80.880.450.10.10.8
Scattering coefficient(m−1)/0.370.120.1///
Refractive index1.701.471.922.771.71.71.47
Emissivity0.850.850.920.950.80.80.85
Table 2. Numerical model verification under different working conditions.
Working ConditionsSoil TemperatureBack Wall TemperatureAir TemperatureAir Relative Humidity
RMSEMAERMSEMAERMSEMAERMSEMAE
G11.22 °C0.66 °C1.54 °C0.96 °C1.69 °C1.34 °C5.66%4.65%
G22.45 °C1.50 °C2.28 °C1.59 °C2.53 °C2.17 °C4.78%4.33%
G30.66 °C0.46 °C1.35 °C0.95 °C0.15 °C0.11 °C3.97%3.68%
Table 3. Correlation analysis of indoor temperature and relative humidity, back wall, and soil temperature in solar greenhouse.
Working Conditions X1X2X3X4X5X6
G1Indoor air temperature0.611 **0.724 **0.858 **0.759 **0.747 **0.785 **
Indoor air relative humidity−0.352−0.596 **−0.573 **−0.552 **−0.599 **−0.635 **
G2Indoor air temperature0.0980.580 **0.580 **−0.748 **−0.30.523 *
Indoor air relative humidity0.601 **0.0540.0890.604 **−0.386−0.920 **
G3Indoor air temperature0.849 **0.978 **0.886 **0.914 **0.984 **0.987 **
Indoor air
relative humidity
−0.623 **−0.842 **−0.688 **−0.731 **−0.830 **−0.832 **
Notes: X1 is marginal soil temperature on the north side, X2 is indoor soil temperature, X3 is marginal soil temperature on the south side, X4 is 0.5 m back wall height layer temperature, X5 is 2 m back wall height layer temperature, and X6 is 3.5 m back wall height layer temperature. ** Correlation is significant at the 0.01 level (2-tailed). * Correlation is significant at the 0.05 level (2-tailed).
Disclaimer/Publisher’s Note: The statements, opinions and data contained in all publications are solely those of the individual author(s) and contributor(s) and not of MDPI and/or the editor(s). MDPI and/or the editor(s) disclaim responsibility for any injury to people or property resulting from any ideas, methods, instructions or products referred to in the content.

