Article

Real-Time Multi-Home Energy Management with EV Charging Scheduling Using Multi-Agent Deep Reinforcement Learning Optimization

by
Niphon Kaewdornhan
1,
Chitchai Srithapon
2,
Rittichai Liemthong
3 and
Rongrit Chatthaworn
1,4,*
1
Department of Electrical Engineering, Khon Kaen University, Khon Kaen 40002, Thailand
2
Department of Electrical Engineering, KTH Royal Institute of Technology, SE-100 44 Stockholm, Sweden
3
Business Development Engineer, Sermsang Power Corporation Public Company Limited, Bangkok 10300, Thailand
4
Center for Alternative Energy Research and Development, Khon Kaen University, Khon Kaen 40002, Thailand
*
Author to whom correspondence should be addressed.
Energies 2023, 16(5), 2357; https://doi.org/10.3390/en16052357
Submission received: 8 February 2023 / Revised: 22 February 2023 / Accepted: 27 February 2023 / Published: 1 March 2023
(This article belongs to the Section F5: Artificial Intelligence and Smart Energy)

Abstract

:
Energy management for multi-home installation of solar PhotoVoltaics (solar PVs) combined with Electric Vehicles’ (EVs) charging scheduling has a rich complexity due to the uncertainties of solar PV generation and EV usage. Changing clients from multi-consumers to multi-prosumers with real-time energy trading supervised by the aggregator is an efficient way to solve undesired demand problems due to disorderly EV scheduling. Therefore, this paper proposes real-time multi-home energy management with EV charging scheduling using multi-agent deep reinforcement learning optimization. The aggregator and prosumers are developed as smart agents to interact with each other to find the best decision. This paper aims to reduce the electricity expense of prosumers through EV battery scheduling. The aggregator calculates the revenue from energy trading with multi-prosumers by using a real-time pricing concept which can facilitate the proper behavior of prosumers. Simulation results show that the proposed method can reduce mean power consumption by 9.04% and 39.57% compared with consumption using the system without EV usage and the system that applies the conventional energy price, respectively. Also, it can decrease the costs of the prosumer by between 1.67% and 24.57%, and the aggregator can generate revenue by 0.065 USD per day, which is higher than that generated when employing conventional energy prices.

1. Introduction

Nowadays, Electric Vehicles (EVs) used instead of traditional vehicles are an efficient way to solve air pollution and climate change issues in cities, especially carbon emissions. The role of EVs is to act as a decarbonization actor which can increase the activity of exchanging power between EV owners and the power utility, i.e., EVs used at the home level can charge or discharge to reduce the user’s electricity expense. Additionally, employing the demand response strategy and developing energy meters are the main factors in increasing interest in using Home Energy Management Systems (HEMSs) with EV charging scheduling to manage energy properly [1]. Vehicle-to-Home (V2H) and Home-to-Vehicle (H2V) relationships are also applied with the HEMS to schedule the charging and discharging of the EV, which causes a change in the role of consumers to prosumers [2]. The HEMS is defined as an essential component for the prosumer to manage electrical energy within the home. It is utilized to optimize the cost of energy consumption and to monitor real-time energy usage for each home [3]. In addition, the HEMS can manage the energy generated for selling to the grid at certain times. This situation can improve the load profile of the power utility and decrease the payments of EV owners [4]. However, the uncertainty of EV usage is a significant challenge for applying V2H and H2V modes with the HEMS because their behavior is difficult to predict, as it is influenced by their EV types, departure times, and arrival times. Therefore, several researchers have tried to find methods for avoiding the uncertainty of EV usage. For example, in reference [5], the departure and arrival times of EV usage were fixed to avoid the complexity of the HEMS optimization. Also, an initial State of Charge (SoC) and EV types were specified in reference [6]. In addition, in reference [7], the departure and arrival times of EVs were randomized to create various scenarios for EV charging scheduling tasks in a smart grid. Nevertheless, EV types were not varied in the work. Thus, if the HEMS is developed to have an excellent capability for dealing with these uncertainties, it can provide the framework to control the energy storage devices efficiently and comprehensively.
Along with EV usage, Distributed Energy Resources (DERs) are promoted to generate and store electricity in the smart grid, especially solar PhotoVoltaic (solar PV) and Battery Energy Storage Systems (BESSs) [8]. Because the cost of solar PVs is continuously decreasing, and EV usage is promoted to deal with the carbon emission issue, many countries support solar PV generation and EV usage [9]. Additionally, EVs are defined as the BESS when applying V2H and H2V modes. The BESS is utilized with the HEMS to store surplus power and supply desired power, which the EV can use instead of the BESS. However, the utilization of both solar PVs and EVs in many homes leads to major issues due to their uncertainties. This situation may negatively impact the distribution system, i.e., reliability problems [10], transformer overloading due to EVs charged simultaneously [11,12], and voltage violations due to output power fluctuations from solar PV generation [13]. To mitigate the aforementioned problems, the aggregator is assigned to control the power consumption of a small/median number of prosumers because the electricity utility manages the energy inadequately for a large number of prosumers [8]. There are many research works that apply the aggregator to achieve this aim. For example, in reference [14], the authors presented a bi-level energy management framework consisting of the aggregator and HEMS levels. The HEMS level aimed to minimize electricity expenses through appliance scheduling, while the aggregator level sought to reduce the load deviation of all consumers and the associated cost. In reference [15], the authors considered optimizing household appliance scheduling with solar PV systems installed in each home to reduce expenses. In contrast, the BESS and power trading between households were controlled by the aggregator to optimize the electricity expenses of all houses. Additionally, in reference [16], the authors proposed a three-level optimization solution, including HEMS, aggregator, and Volt/VAR Optimization (VVO) levels. The HEMS level controlled home appliances and the BESS under solar PV generation, prosumer’s preferred appliance scheduling, and their comfort level to reduce electricity expenses. Moreover, the aggregator level minimized the power loss in a low-voltage system and the power deviation of all homes while reducing the power loss and deviation of all aggregators considered in the VVO level. In reference [17], the authors proposed co-optimization levels for both the HEMS, which considered EV usage, and the aggregator, which considered the transformer’s loss of life that supplied power to all homes. However, the aggregator in the mentioned research works did not consider making a profit from supervising multi-home systems, which is an essential factor for providing revenue to the aggregator. Additionally, the integration of solar PV systems and EV usage was not taken into account in the above works.
According to the review in reference [8], there were several objectives and constraints in HEMS optimization considered. For example, electricity costs and consumption were minimized, the comfort level of consumers was maximized due to the use of thermal and electrical appliances, and peak demand reduction was usually considered in the optimization. Moreover, operating conditions of appliances such as solar PVs, BESSs, and EVs were commonly determined as the constraints of HEMS optimization. At the aggregator level, reducing prosumer costs, power loss, voltage violation, and power consumption of all prosumers were defined as the objective functions in the optimization. At the same time, the aggregator profit was maximized in the task. Additionally, the aggregator constraints were the current limit, voltage limit, and power balance condition for energy trading.
Along with the objective functions and constraints, there are various algorithms for designing the AEMS and HEMS. For the mathematical programming algorithm, the research work in reference [18] proposed multi-home energy management optimization using Mixed-Integer Linear Programming (MILP). Additionally, the authors presented the control of both active and reactive powers combined with the Home Energy Management (HEM) task using the linear formulation. In reference [19], the authors presented HEM with dynamic pricing by applying the Mixed Integer Non-Linear Program (MINLP). Moreover, the power and comfort constraints of both electrical and thermal appliances were considered to provide the optimal solution in the work. Reference [20] proposed thermal and electrical energy management in HEM using Mixed-Integer Quadratic Programming (MIQP). Although mathematical programming is popular and provides a low computation time, the HEM problem formulation is required to transform to a linear/nonlinear equation, which leads to a decrease in the solution accuracy. Hence, several researchers applied metaheuristic algorithms to solve the HEM problem instead of that method. Reference [21] used the Genetic Algorithm (GA) to improve the performance of the HEMS with different power cost scenarios and novel smart home modeling, which caused the obtained solution to be secure in many scenarios. In the research work [22], the researchers demonstrated a solution to the problem of appliance scheduling and EV charging scheduling in a home using the Particle Swarm Optimization (PSO) algorithm. Reference [23] proposed the optimal scheduling for appliances in the home to reduce the electricity cost using the Grey Wolf Optimization (GWO) algorithm. However, the solution provided by the metaheuristic algorithms is not verified as the global optimum [24]. To guarantee the global optimum, the solution obtained by the method has to be calculated many times, causing a higher computation time.
Reinforcement Learning (RL) is a model-free approach which has been employed to solve energy management problems in many works, especially Deep RL. Deep RL is one of the RL types that uses Deep Neural Networks (DNNs) as the model for learning agent behavior through interaction. Deep RL is employed in many optimization tasks; for example, it was utilized to coordinate different sources of electricity generation to manage energy in a microgrid [25]. Furthermore, it was deployed to manage energy in real-time scheduling and to deal with the uncertainties of renewable energy sources in a microgrid [26]. In reference [27], the authors applied Deep RL to increase the comfort level brought by thermal appliances in the home while the total energy consumption was minimized. In addition, Deep RL was also utilized to discover the proper action for controlling the BESS to reduce energy consumption costs in the home [28]. Deep RL has been proven to be a robust optimization algorithm with an exceptional ability to solve complex dynamic systems [29]. This is because deep learning, which can provide solutions for high-dimensional and complex problems [30], is combined with reinforcement learning. This increases the likelihood of discovering the global solution to high-dimensional and complex problems when using Deep RL. Additionally, in reference [31], it was shown that deploying Deep RL can provide a solution for energy management close to the solution obtained by the Genetic Algorithm (GA), which is one of the meta-heuristic algorithms. To this end, Deep RL was verified as the suitable optimization tool for managing home and microgrid energies in this work, which is a high-complexity problem.
To improve the performance of the HEMS and to promote multi-home energy management optimization with solar PV generation and EV usage, in this paper, Deep Deterministic Policy Gradient (DDPG), which is one of the Deep RL types and the best tool for dealing with problems consisting of continuous variables, is applied to manage energy in the multi-home system and to optimally schedule EV charging using a real-time energy trading concept. Furthermore, the uncertainties of power consumption behavior, solar PV generation, and EV usage are taken into account in this work. The multi-home energy management optimization problem is mapped to the multi-agent optimization problem based on the Markov Decision Process (MDP). There are four homes and a single aggregator in this work. Each home has an EV, general appliances defined as a home baseload, a solar PV rooftop setup, and a HEMS. The HEMS is employed to schedule charging/discharging of the EV to reduce electricity expenses and to send/receive the data to/from the aggregator. In contrast, the aggregator has a central BESS and an AEMS. The AEMS proposes the optimal selling/buying energy prices and properly controls the BESS to store surplus power from all prosumers. The main contributions of this paper are summarized as follows.
  • This paper presents a multi-home energy management optimization solution with optimal EV charging and discharging scheduling to enhance the load profile of a group of prosumers under the supervision of an aggregator. The study also incorporates an energy trading strategy based on Real-Time Pricing (RTP), as the four prosumers and the aggregator are considered profit-making entities, which has not been addressed in previous research. The strategy promotes appropriate behavior among prosumers for consuming and injecting power from and to the grid.
  • This paper proposes a multi-agent optimization solution using the DDPG algorithm to tackle the multi-home energy management problem with EV charging and discharging scheduling, taking into account the uncertainties in power consumption, solar PV generation, and EV usage among all prosumers. The proposed method trains well-adaptable agents capable of efficiently finding optimal solutions in uncertain situations. Furthermore, the agents require less discovery time for the optimal solution compared to existing methods, particularly metaheuristic methods [32]. Additionally, this paper considers the EV battery as the BESS for each prosumer, which presents a significant challenge in dealing with the uncertainty of EV usage, especially departure and arrival times, which has not been explored in previous research.
The remainder of this paper is organized as follows. The proposed energy management framework is presented in Section 2. Then, the problem formulation is defined in Section 3, and the proposed method is demonstrated in Section 4. Section 5 illustrates the simulation results and discussions of this work. Finally, the conclusion is described in the last section.

2. Proposed Energy Management Framework

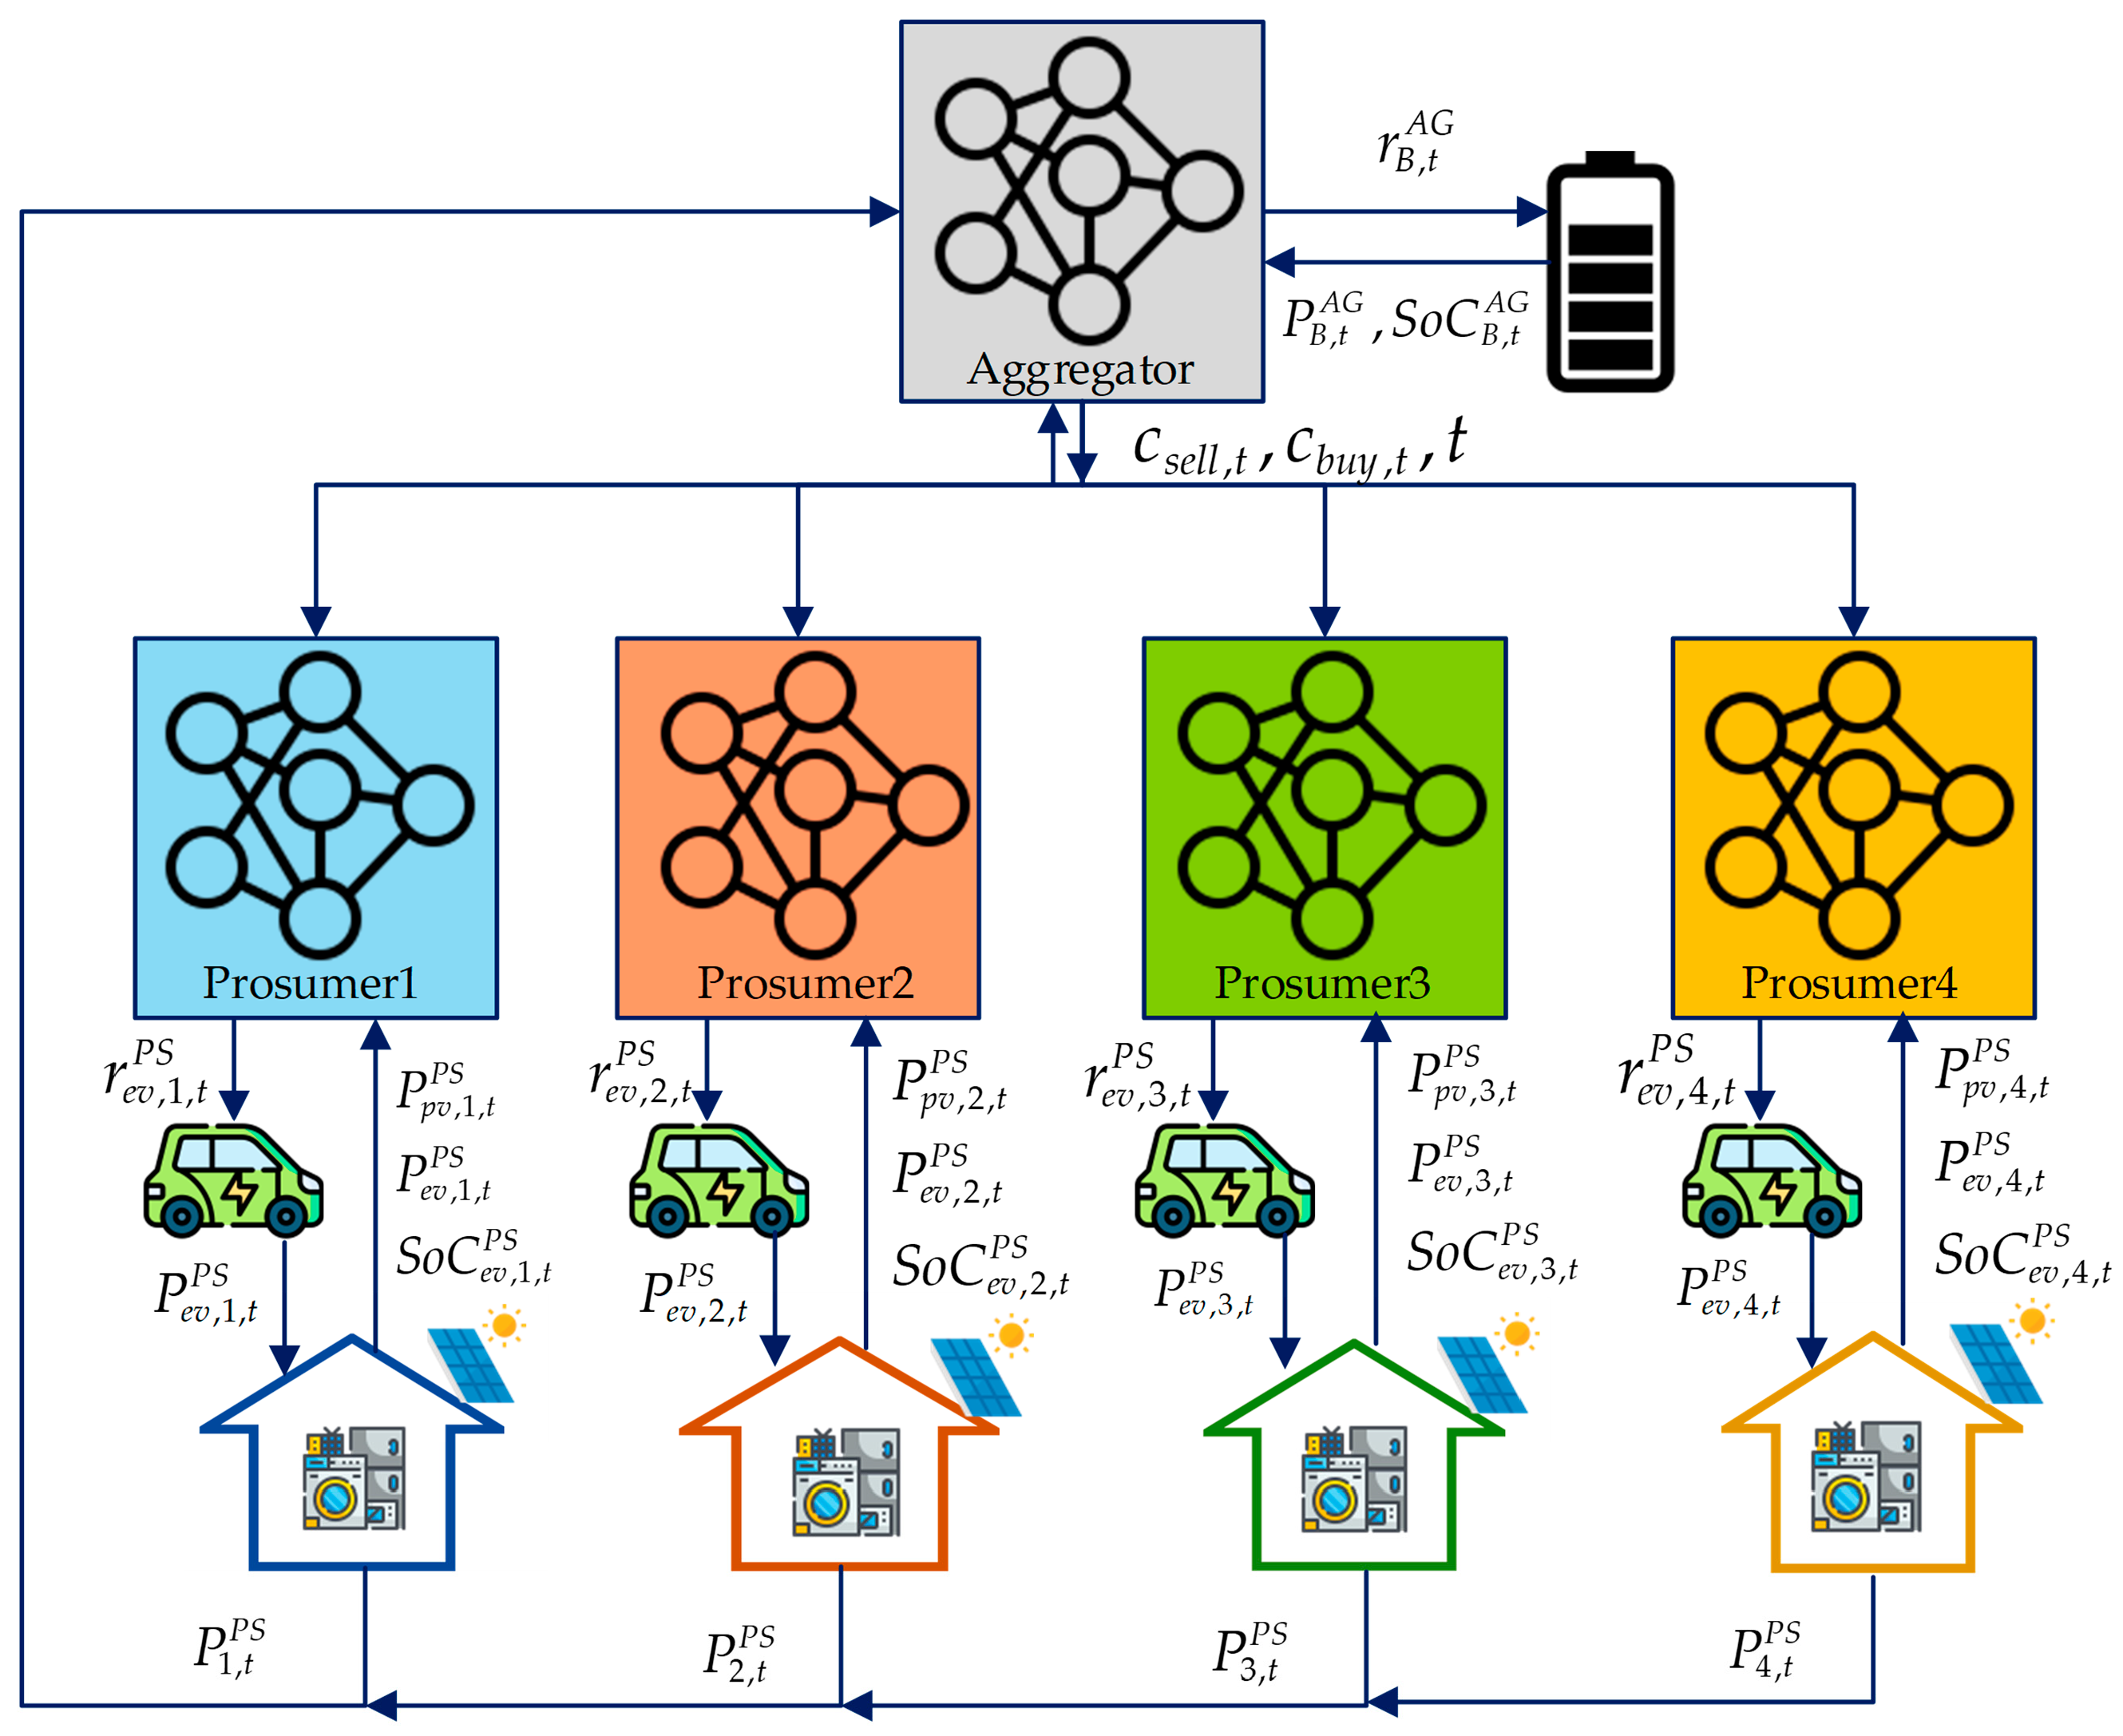
The proposed multi-agent optimization using the DDPG algorithm addresses the complex energy management problem in a distribution system with multiple prosumers and an aggregator, considering the uncertainties in power consumption, solar PV generation, and EV usage. The multi-level Energy Management System (EMS) consisting of home, aggregator, and distribution levels can ensure mutual benefits for the prosumers, aggregator, and utility [8], but the use of V2H and H2V modes for EV scheduling increases the complexity of the problem. The proposed method groups prosumers at the home level and employs the aggregator in managing their energy to avoid disorder in energy trading and undesired events in the distribution system.
One of the many problems of concern is the improvement of the load profile of all prosumers, which is also addressed in this work. The behavior of prosumers is changed through the use of Real-Time Pricing (RTP) to incentivize them to sell and buy energy during the appropriate periods. The selling/buying energy prices are estimated by the aggregator and proposed to all prosumers. Thus, this work proposes a multi-home energy management system with optimal EV charging scheduling. The proposed framework can be seen in Figure 1.
In Figure 1, a model is demonstrated with four homes and a single aggregator to show the operation of the proposed method. Each home has a solar PV rooftop setup to minimize power received from the grid. A single EV that can switch between V2H and H2V modes is also included along with the home’s base load and solar PV generation. The HEMS controls the EV charging and discharging to provide optimal scheduling, and the AEMS considers RTP to change the behavior of all prosumers in the optimization problem. Solar PVs only generate power during the day, and the EV battery is used for energy management within the home, leading to surplus power being injected into the grid when the EV leaves. To mitigate this, the aggregator controls a central BESS using the AEMS to store surplus power generated during the day and to supply power to improve consumption schedules for all prosumers.

3. Problem Formulation

To provide optimal EV charging scheduling and manage the energy of a multi-home system with improved power consumption, an EMS is developed at both the home and aggregator levels. The Deep Deterministic Policy Gradient (DDPG) algorithm is utilized to solve the energy management problem at each level. The interaction between the aggregator and the four prosumers is crucial to find the optimal decisions for all parties, and this interaction is achieved through multi-agent optimization using the DDPG algorithm within a Markov Decision Process (MDP) framework. The objective functions used in the MDP formulation of the energy management task at the home and aggregator levels are described in the first subsection, while the constraints, such as the operating limitations of the central BESS, EV battery, power balance, and power consumption, are presented in the second subsection. The last subsection details how the objective functions and constraints are transformed into a multi-agent problem using the MDP formulation.

3.1. Objective Functions

The objective functions considered at both the home and aggregator levels consist of revenue or cost for selling or buying energy and the degradation costs of the battery. These can be expressed as follows.

3.1.1. Revenue/Cost for Selling/Buying Energy

Since real-time energy trading is applied in this work, the selling/buying energy objective function can reflect the electricity expense reduction due to the HEMS working. Furthermore, the objective function is also used to verify the efficiency of generated RTP from the AEMS that can generate a high or low revenue for the aggregator. The equations of the objective function calculation for each prosumer and aggregator can be represented as follows.
C G , t A G = c T O U , t P t A G ; P t A G > 0 c F I T , t P t A G ; P t A G 0 ,
C P S , t A G = c s e l l , t P t o t a l , t P S ; P t o t a l , t P S 0 c b u y , t P t o t a l , t P S ; P t o t a l , t P S > 0 ,
C A G , i , t P S = c s e l l , t P i , t P S ; P i , t P S > 0 c b u y , t P i , t P S ; P i , t P S 0 ,
where  P t A G  is the received/injected power (kW) from/into the grid of the aggregator at time  t P t o t a l , t P S  represents the total load of all prosumers at time  t P i , t P S  denotes the received/injected power (kW) from/into the grid of the prosumer  i  at time  t . If  P t A G  or  P i , t P S  is more than 0, the aggregator or prosumer is receiving the power, which incurs the buying energy cost. Otherwise ( P t A G  or  P i , t P S  is less than or equal to 0), the power will be injected into the grid, which generates the selling energy revenue. Moreover, if  P t o t a l , t P S  is less than or equal 0, the aggregator will supply the power to all prosumers, which generates the selling energy revenue. Otherwise, the power will be received from all prosumers, which incurs the buying energy cost. Then,  C G , t A G  and  C P S , t A G  denote the revenue/cost for selling/buying energy (USD) at time  t  of the aggregator with the grid and all prosumers, respectively.  C A G , i , t P S  is the revenue/cost for selling/buying energy (USD) of the prosumer i with the aggregator at time  t . Then,  c T O U , t  and  c F I T , t  represent the Time-of-Use (TOU) and Feed-in-Tarif (FIT) rates (USD/kWh) of the grid at time  t , respectively. Then,  c s e l l , t  and  c b u y , t  denote the selling and buying rates (USD/kWh) at time  t , respectively, which are proposed by the aggregator to all prosumers.

3.1.2. Battery Degradation Cost

Five batteries are utilized to store/supply energy in this work, consisting of a central BESS controlled by the aggregator and four EV batteries supervised by four prosumers. Nevertheless, if these batteries are mismanaged and heavily used, it will accelerate the aging of the batteries, leading to an increase in degradation costs. Thus, this cost is considered one of the objective functions in the work, as it effectively reflects battery usage behavior. The cost can be formulated using the following equations [33,34].
C B , t A G = C B , i , t P S = 0 ; P B , t 0 C B S o C t C B S o C t 1   ; P B , t   <   0   ,
C B ( S o C t ) = C B , c a p N B , c y c l e ( S o C t ) ,
N B , c y c l e ( S o C t ) = 694 1 S o C t 0.795 ,
where  C B , t A G  and  C B , i , t P S  are the battery degradation costs (USD) of a central BESS of the aggregator and EV battery of the prosumer i at time  t , respectively. Then,  P B , t  denotes the charging/discharging power (kW) of the battery at time  t . If  P B , t  is greater than or equal to 0, the battery will charge, and the cost will equal 0. Otherwise, the battery will discharge, and the cost will be calculated by using the second condition in Equation (4).  S o C t  is the state of charge of the battery at time  t . Then,  C B ( S o C t )  denotes the cost (USD) at the state of charge  S o C t C B , c a p  represents the capital cost of the battery (USD), while the number of the life cycle of the battery at state of charge  S o C t  is denoted  N B , c y c l e ( S o C t ) . Since a lithium-ion Battery is defined as the battery type for all batteries,  N B , c y c l e ( S o C t )  is evaluated by using Equation (6) [34].

3.2. Constraints

This work considers three constraints, including the operating limits of all batteries, power balance, and power consumption for all prosumers and the aggregator. The operating limits of the batteries are discussed in the first sub-subsection, the power balance equations are formulated in the second sub-subsection, and the power consumption is defined in the last sub-subsection.

3.2.1. Operating Limits of the Battery

Energy storage devices, particularly batteries, must operate within their limitations in order to extend their lifespan. The main factors that reflect the operating limits of the battery are its state of charge and charging/discharging power, which can be expressed as follows.
S o C t = S o C t 1 + E t E c a p ,   E t = P B , t η c h ; P B , t 0 P B , t / η d i s ; P B , t < 0 ,
S o C min S o C t S o C max ,   P B , t P B , r a t e d ,
where  E t  and  E c a p  are the charging/discharging energy (kWh) at time  t  and energy capacity (kWh), respectively. Then,  η c h  and  η d i s  denote the charging and discharging efficiencies, respectively.  S o C min  and  S o C max  represent the minimum and maximum states of charges. The current state of charge ( S o C t ) must not exceed  S o C max  and must not be lower than  S o C min . Then,  P B , r a t e d  is the charging/discharging power rating (kW) of the battery. The absolute of current power ( P B , t ) must not exceed  P B , r a t e d .
From the above constraints, the chargeable/dischargeable power of the battery needs to be evaluated to protect against the violating situation when dispatching the battery. The power can be calculated as the following equations.
P a b l e , t = min ( P r e m , t , P B , r a t e d ) ; Charging max ( P r e m , t , P B , r a t e d ) ; Discharging ,
P r e m , t = ( S o C max S o C t ) E c a p η c h 1 ; Charging ( S o C t S o C min ) E c a p η d i s ; Discharging ,
where  P a b l e , t  is the chargeable/dischargeable power (kW) of the battery at time  t , whereas  P r e m , t  denotes the charging or discharging power (kW) when the current state of charge increases to  S o C max  or decreases to  S o C min  at time  t . Then,  P r e m , t  is compared with  P B , r a t e d  to estimate the  P a b l e , t  using the two conditions in Equation (9). Thus, Equations (9) and (10) are applied to estimate the chargeable/dischargeable power of the battery in this work.

3.2.2. Power Balance

Power balance is essential in the energy management task. The EMS must be able to schedule distributed generators and energy storage devices to balance the power within the system. Only real power balance is considered in this work at both the home level and aggregator level, which can be shown as follows.
P i , t P S = P L , i , t P S P P V , i , t P S + P e v , i , t P S ,
P t A G = P B , t A G + i = 1 4 P i , t P S ,
where  P L , i , t P S  and  P P V , i , t P S  are the home baseload (kW) and the output power of solar PV (kW) of the prosumer i at time  t , respectively.  P B , t A G  and  P e v , i , t P S  denote the charging/discharging powers (kW) of the central BESS of the aggregator and the EV battery of the prosumer i at time  t , respectively. In Equations (11) and (12),  P i , t P S  and  P t A G  can be both positive (received power) and negative (injected power) values depending on the behaviors of home baseload, solar PV generation, and battery scheduling at that time.

3.2.3. Power Consumption of All Prosumers

In this work, the power consumption of the four prosumers is a crucial factor that should be improved by the aggregator due to increased EV usage within the home level. Hence, this factor is taken into account in the optimization task of the aggregator. Desired variables for estimating the factor can be represented as the following equations.
P a v = t = 0 23 P t o t a l , t P S 24 ,
D P C = P a v , e v P a v , n o e v   ; P a v , e v > P a v , n o e v 0 ; Otherwise ,
where  P t o t a l , t P S  is defined as the total load (kW) of the four prosumers at time  t . Moreover, it is used to evaluate the average load ( P a v ) in Equation (13). Then, the mismatching ( D P C ) of the power consumption between the average load without the EV usage ( P a v , n o e v ) and the one with the EV usage ( P a v , e v ) is evaluated according to Equation (14) and is defined as one of the constraints in this work. If  P a v , e v  is more than  P a v , n o e v D P C  will equal to  P a v , e v P a v , n o e v . This indicates that the scheduling solution for EVs does not result in a reduction of power consumption for all prosumers. Otherwise ( P a v , e v P a v , n o e v ), the solution used to schedule the EVs can decrease the power consumption of all prosumers, leading to  D P C  being equal to 0.

3.3. Multi-Agent Problem Transformation

The objective functions and constraints are mapped to the variables of the Deep Deterministic Policy Gradient (DDPG) algorithm. The DDPG algorithm, used to solve the Markov Decision Process (MDP) problem at both the home and aggregator levels, utilizes four variables: Current State, Continuous Action, Reward, and Next State. The DDPG attempts to find the best continuous action from the current state by maximizing the reward. Further details on the formulation of the DDPG variables can be found in [31]. In this subsection, the variables at the home level are discussed in the first sub-subsection, and the ones at the aggregator level are presented in the last sub-subsection.

3.3.1. DDPG Variables at the Home Level

The objective functions and constraints used in the home level optimization are mapped into the DDPG variables as follows.
S i , t P S = P p v , i , t P S , P e v , i , t P S , S o C e v , i , t P S , c s e l l , t , c b u y , t , t ,
R i , t P S = ( C A G , i , t P S + γ 1 C B , i , t P S ) ;   t [ t a r , t d p )   ( C A G , i , t P S + γ 1 C B , i , t P S + β 1 S o C e v , i , t P S S o C max 2 ) ;   t = t d p ,
A i , t P S = r e v , i , t P S ,
P e v , i , t P S = P a b l e , i , t P S r e v , i , t P S ,
where  S i , t P S  is the current state of the prosumer  i  at time  t A i , t P S  and  R i , t P S  are the continuous action and reward of the prosumer  i  at time  t , respectively.  γ 1  is the scaling factor of the EV battery degradation cost. Currently, the cost of batteries remains high, which results in higher degradation costs when discharging, as indicated by Equation (4). Incorporating the degradation cost without scaling into the reward may not effectively control the EV battery discharging behavior. Therefore, it is necessary to use the scaling factor. Moreover,  β 1  denotes the scaling factor for the mismatch between the state of charge of the EV of the prosumer at departure time and the maximum state of charge ( S o C max ), also known as the SoC penalty scaling factor. The scaling factor is necessary to adjust the SoC penalty to reasonable bounds, ensuring it does not exceed the value of the objective function. This ensures that the SoC penalty is proportional to the objective function. This allows for a balance between the objective and the SoC penalty in the optimization process. Then,  S o C e v , i , t P S  denotes the state of charge of the EV of the prosumer  i  at time  t t a r  is the arrival time of the EV, while its departure time is determined as  t d p . Moreover,  P e v , i , t P S  is the power of the EV of the prosumer  i  at time  t , whereas the chargeable/dischargeable power of the EV of the prosumer  i  at time  t  is denoted as  P a b l e , i , t P S . Then,  r e v , i , t P S  is the value that has a boundary of [−1, 1] and is used to evaluate the  P e v , i , t P S  using Equation (18).

3.3.2. DDPG Variables at the Aggregator Level

The objective functions and constraints used in the aggregator-level optimization are mapped into the DDPG variables as follows.
S t A G = P B , t A G , S o C B , t A G , P 1 , t P S , P 2 , t P S , P 3 , t P S , P 4 , t P S , c s e l l , t , c b u y , t , t ,
R t A G = C G , t A G + C P S , t A G + γ 2 C B , t A G ;   t t d p C G , t A G + C P S , t A G + γ 2 C B , t A G + β 2 S o C B , t A G S o C max 2 + α D P C ;   t = t d p ,
A t A G = c s e l l , t , c b u y , t , r B , t A G ,
P B , t A G = r B , t A G P t o t a l , t P S ,
where  S t A G  is the current state of the aggregator at time  t A t A G  and  R t A G  are the continuous action and reward of the aggregator at time  t , respectively. Then,  S o C B , t A G  denotes the state of charge of the aggregator’s BESS at time  t γ 2  and  β 2  denote the scaling factors of the BESS degradation cost and the SoC penalty, respectively. Then,  D P C  is the mismatch in the power consumption between the average load without the EV usage and the one with the EV usage, which is evaluated by using Equation (14) and is called the Power Consumption (PC) penalty.  α  is the scaling factor of  D P C . From Equation (14), the PC penalty is limited by its boundary, which may not be equal to the value of the objective function. By using the scaling factor, the penalty value can be made closer to the value of the objective functions. Hence, the scaling factor is necessary. Then, we consider the first two variables that are defined as consisting of selling price ( c s e l l , t ) and buying price ( c b u y , t ) which are proposed to all prosumers. Additionally, the third variable is  r B , t A G , which has a boundary of [0, 1] and is applied with the total load of all prosumers ( P t o t a l , t P S ) in Equation (22) to estimate the power of the BESS of the aggregator ( P B , t A G ) at time  t .
These variables in both level optimizations can be described using the DDPG framework, as shown in Figure 2.

4. Proposed Method

Real-time multi-home optimization is more complicated when considering EV charging scheduling and solar PV generation uncertainties. Understanding how to create stochastic models of random variables, which are used to model the uncertain behaviors of solar PV generation and EV usage, can help address the problem of uncertainty. Additionally, the use of robust optimization algorithms is an effective solution for multi-home optimization. The Deep Deterministic Policy Gradient (DDPG) is a robust algorithm that is well-suited for handling the complexity of multi-home optimization through real-time multi-agent optimization. The first subsection covers the construction of stochastic models for random variables. The second subsection describes the training process for multi-agent optimization to find well-trained models for all agents. Finally, the testing procedure is outlined in the last subsection.

4.1. Stochastic Model Construction

Commonly, stochastic models are modeled using the Probability Density Function (PDF). There are three stochastic models that are used to describe the uncertainty of multi-home optimization in this work, consisting of the models of EV usage, home baseload, and solar PV generation. Therefore, the stochastic model of EV usage behavior is presented in the first sub-subsection. Then, the stochastic models of solar PV generation and home baseload are described in the last sub-subsection.

4.1.1. The Stochastic Model of EV Usage

Currently, many EV types are used at the home level. To be able to learn the behaviors of several EV types comprehensively, the EV type of each prosumer is randomly labeled using the usage proportion. Furthermore, the departure and arrival times of each EV are essential for determining charging/discharging EV scheduling. The departure and arrival times are usually modeled as a normal PDF [6] which can be formulated as follows.
f n ( t ) = 1 2 π σ n exp ( t μ n ) 2 2 σ n 2 ,
where  f n ( t )  is a normal PDF, whereas  t  denotes the time variable (h), i.e., the departure time or the arrival time. Then,  μ n  and  σ n  are the mean and standard deviation of a normal PDF.
Moreover, the daily driven distance of each EV is an important factor in estimating the initial state of charge at the arrival time. The distance can be generated using a lognormal PDF [35] which can be written as the following equation.
f l ( d ) = 1 2 π σ l d exp ( ln d μ l ) 2 2 σ l 2 ,
where  f l ( d )  is a lognormal PDF while  d  denotes the daily driven distance (km). Then,  μ l  and  σ l  are the mean and standard deviation of a lognormal PDF.
From the above description, the EV type, the departure time, the arrival time, and the daily driven distance have been randomized; hereafter, the above variables are defined as the general data of the EV of the prosumer i. Then, the initial state of charge is estimated by using the following equation [36].
S o C i , a r r i v a l = S o C i , d e p a r t ε i d i E i , c a p ,
where  ε i  and  E i , c a p  are the consumption rate (kWh/km) and energy capacity (kWh) of the EV of the prosumer  i , respectively. The above two variables are based on the EV type.  d i  is the daily driven distance (kW) of the EV of the prosumer  i . Then,  S o C i , a r r i v a l  and  S o C i , d e p a r t  denote the state of charge at the arrival time and at the departure time of the EV of the prosumer  i , respectively.

4.1.2. Solar PV Generation and Home Baseload

Ambient temperature and solar radiation are important factors for evaluating the output power of a solar PV system. However, these variables have a natural uncertainty. Knowing how to generate the stochastic models of those variables will enable estimation of the range of the output power of the solar PV system. Along with the solar PV generation uncertainty, the consumption behavior at the home level is defined as an uncertain variable in multi-home optimization.
To mitigate those uncertainties, the above variables need to be used to generate stochastic models to evaluate their behavior comprehensively. Ambient temperature and home baseload are usually modeled using a normal PDF [37,38,39] according to Equation (23). Regarding solar radiation, it is modeled using a beta PDF [40,41], which can be formulated as follows.
f ( r ) = Γ ( α + β ) Γ ( α ) + Γ ( β ) r α 1 ( 1 r ) β ,
where  f ( r )  is a beta PDF while  r  denotes the solar radiation (W/m2).  Γ  is the gamma function, whereas  α  is the exponent of the random variable. Then,  β  is the control variable.
Furthermore, the stochastic model of the output power of the solar PV system can be written as the following equations [9].
P p v , t = η o v e r P p v , r R t α P ( T c e l l , t T c e l l , S T C ) + 1 ,
T c e l l , t = T a m b i , t + R t ( T c e l l , N O 20 ) ,
R t = 1 r t > r s t d r t / r s t d r c r t r s t d   r t 2 / ( r c r s t d ) r t < r c ,
where  P p v , t  and  P p v , r  are the output power (kW) at time  t  and the power rating (kW) of the solar PV system, respectively.  η o v e r  is the overall efficiency of the solar PV system. Then,  α P  is the power temperature efficiency (W/°C), whereas  T c e l l , S T C  denotes the cell temperature (°C) under the standard test conditions (STC). The cell temperature (°C) at time  t  is represented as  T c e l l , t  and it can be evaluated using Equation (28).  T c e l l , N O  is the cell temperature under the nominal operation (°C), whereas the ambient temperature (°C) at time  t  is represented as  T a m b i , t . Then,  R t  is the value associated with solar radiation which can be calculated using Equation (29) according to three conditions. Then,  r t  denotes the solar radiation (W/m2) at time  t  while the solar radiation (W/m2) under STC is represented as  r s t d , which is commonly determined as 1000 W/m2. Also,  r c  is a certain radiation point, which is usually defined as 150 W/m2.

4.2. Training Procedure

The training procedure is crucial in finding well-trained models for all agents. It allows the agents to learn through interactions with their environment and generates multiple solutions for optimizing the multi-home scenario.
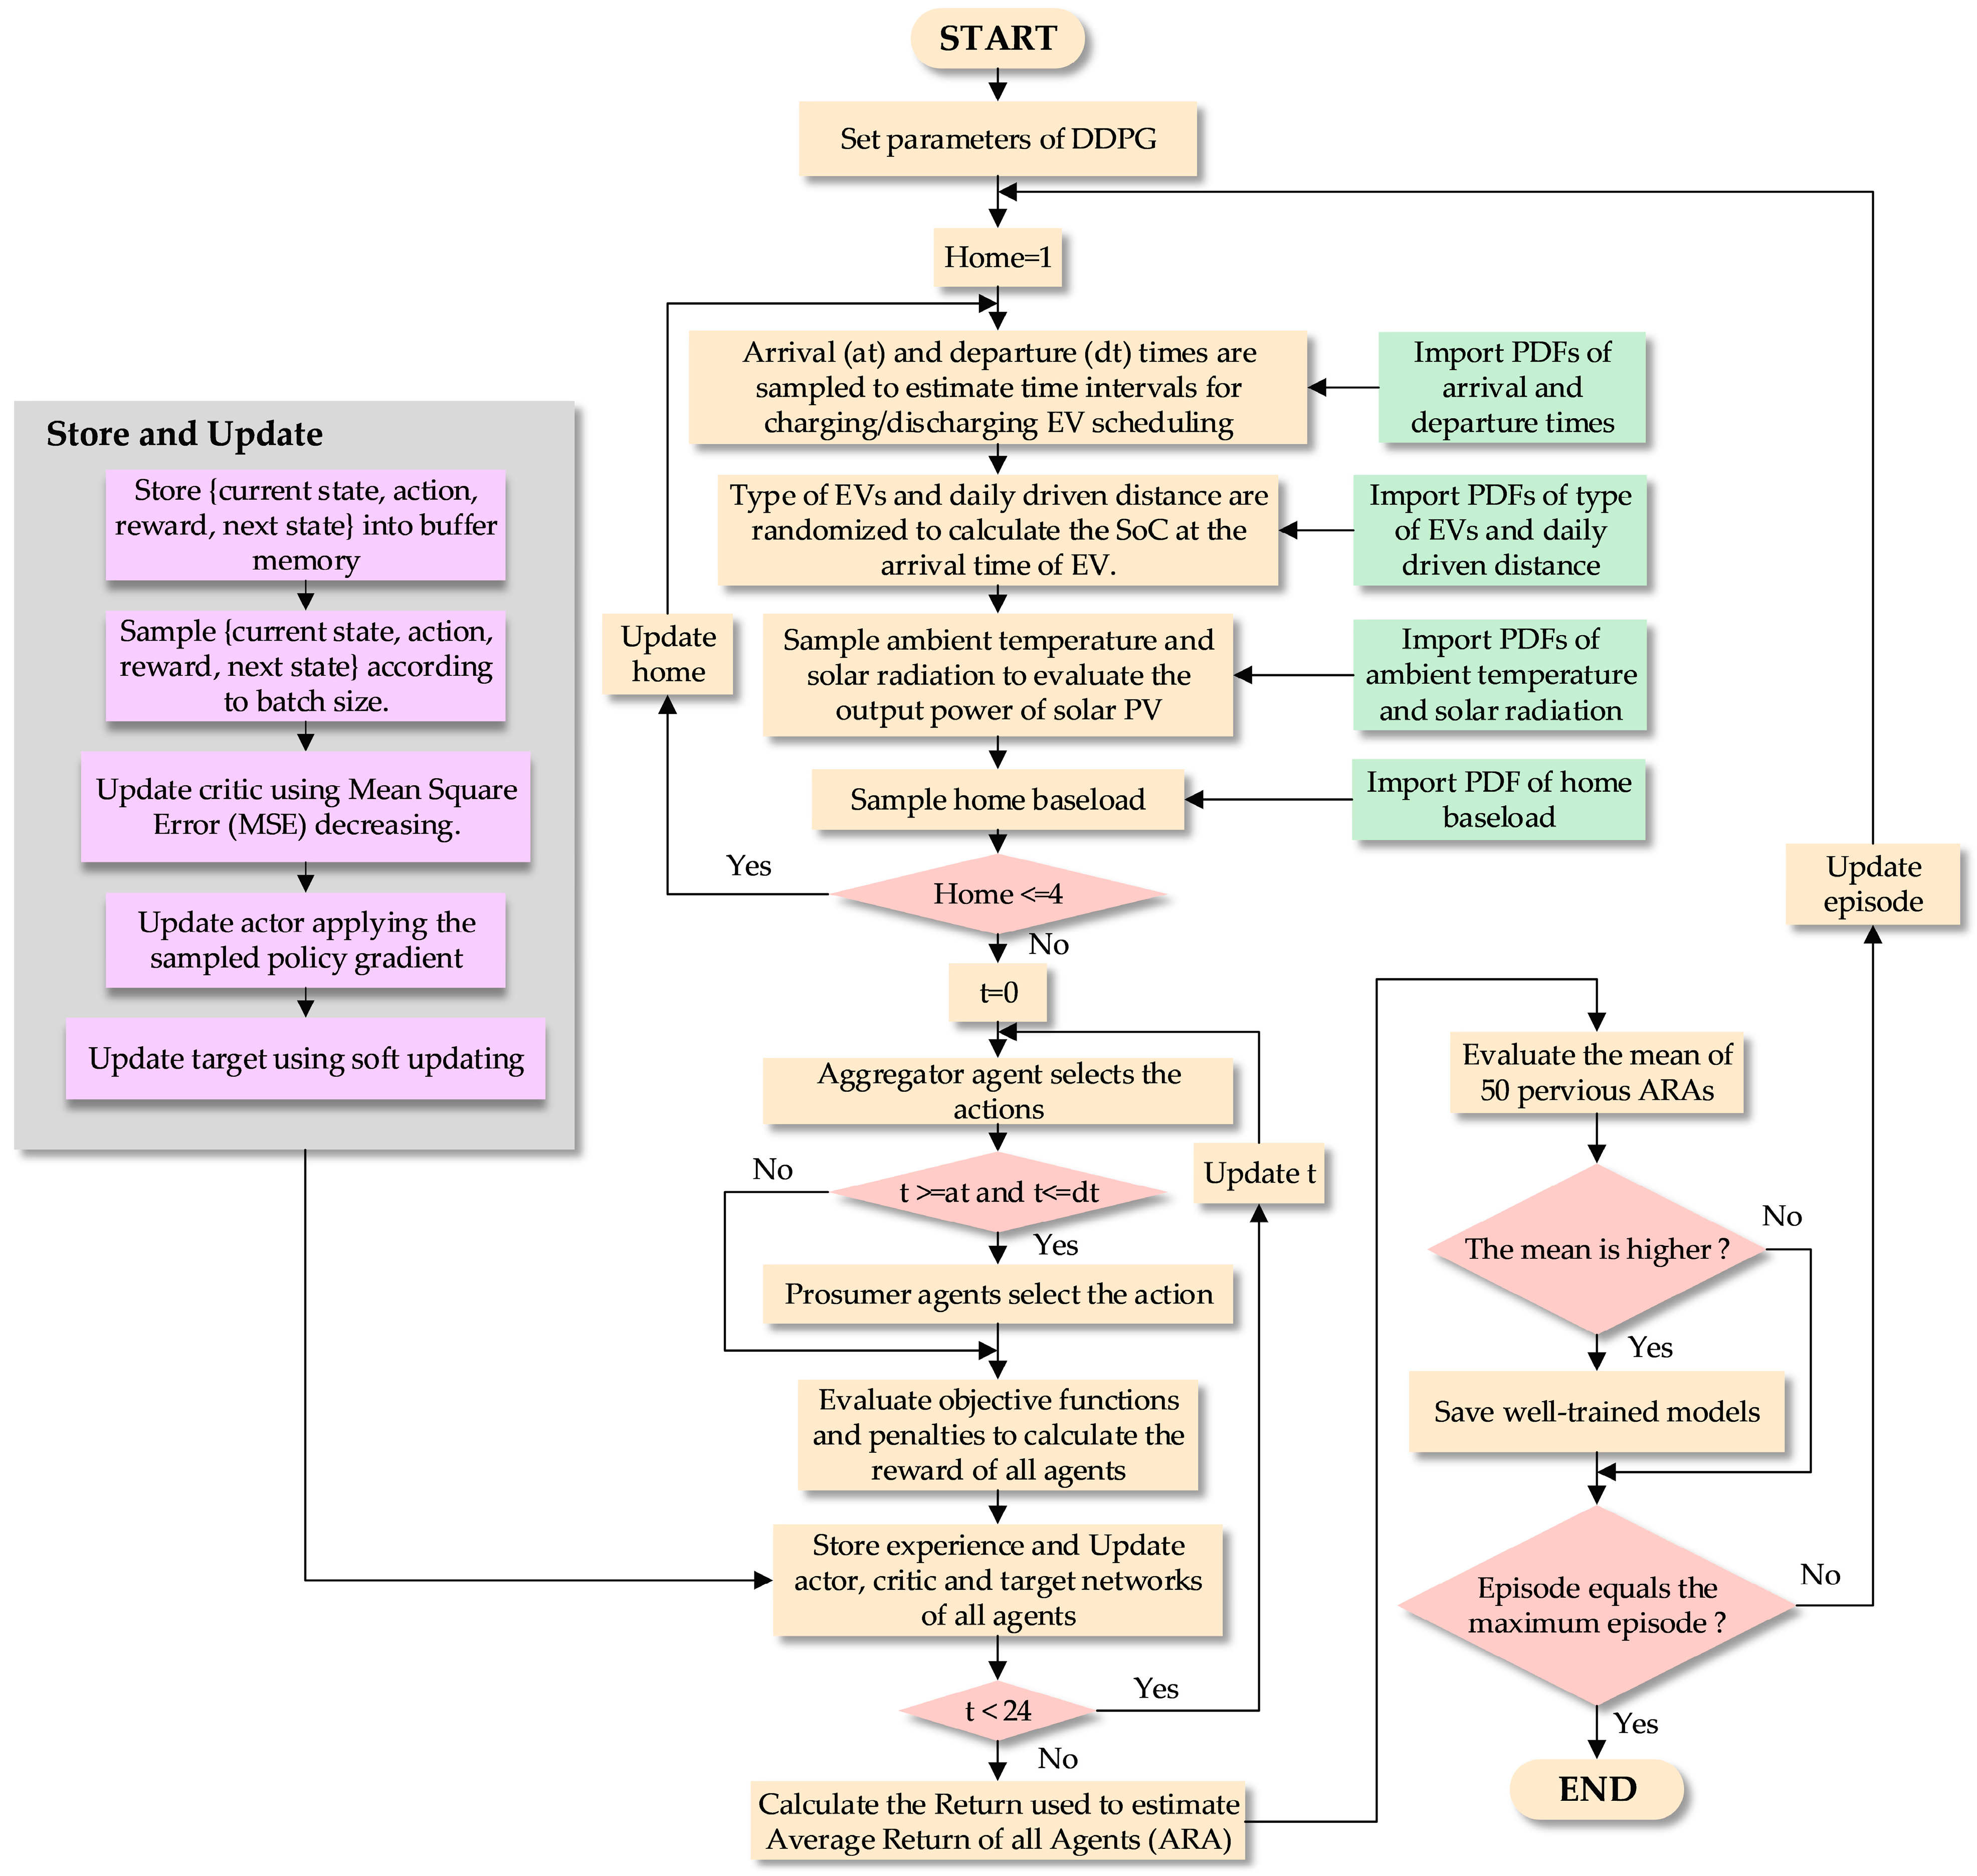
Two tasks must be handled within the multi-home optimization, consisting of dealing with overall uncertainties and applying the DDPG algorithm to solve the multi-agent problem. Because the uncertainties of EV usage, solar PV generation, and home baseload are considered in this work, the variables associated with those uncertainties are randomized to create learning scenarios along with multi-agent optimization. The DDPG algorithm under the MDP concept is employed to find global solutions in this work. These tasks are simultaneously operated to be able to learn several situations, leading to providing global solutions for multi-agent optimization under all uncertainties. Therefore, the training procedure can be shown, as in Figure 3.
In Figure 3, the DDPG parameters of each agent are set in the first step. Then, evaluation of the time interval for EV scheduling and the net power of each home is begun. The arrival and departure times are sampled from their PDFs to estimate the time interval for charging/discharging EV scheduling. After that, the type of EVs and the daily driven distance are randomized from their PDFs to calculate the initial state of charge. Then, the output power of the solar PV system is evaluated using sampled ambient temperature and sampled solar radiation. Next, each home baseload is sampled to estimate the power consumption at that time. The above evaluating process is applied to four homes, which are defined as four prosumers in this work.
The aggregator agent then selects an action, which includes determining the selling price, buying price, and the variable used to manage the central BESS, to improve its reward. These selling and buying prices are then proposed to the four prosumer agents simultaneously. Afterwards, the prosumer agents begin to respond to the prices. If the current time falls within the EV scheduling interval (i.e., between the arrival and departure times), the prosumer agent is able to adjust the charging/discharging of the EV battery to enhance their reward. However, if the EV has already left the home, the prosumer agent cannot control the EV battery. Finally, the objective functions and penalties of all agents are calculated and mapped onto their rewards.
Hereafter, the experience storage and updating of neural networks at that time are started. Each agent stores the DDPG variable, defined as the experience; namely, the current state, action, reward, and next state, into the buffer memory. The acquisition of various experiences relies on two processes, exploitation and exploration. In the training procedure according to the DDPG concept [31], there are four main networks that are embedded in each agent, namely actor and target actor networks, and critic and target critic networks. The role of the actor is to map from the current state to the best action using the current policy. In contrast, the target actor is employed to predict the action at the next state. Also, the role of the critic is to map from the state-action pair to the value of action taken into the environment, which is called the Q-value. In contrast, the target critic is applied to predict the Q-value of the next state-action pair. Hence, the actor predicts the current action using the best policy discovered at that time, which is called the exploitation process. However, various experiences will occur when applying the exploration process to the training, since the action is usually a continuous value. Hence, continuous noise is a proper factor which is added to the action for exploration. Then, the new action occurs and is guaranteed using the Q-value predicted by the critic. Both exploitation and exploration are operated simultaneously to achieve the aim of the training.
The continuous noise ( λ t ) added to the action ( A t ) can be described using the following equations [31].
λ t = N ( μ n , σ n ) ,   σ n = e φ t
A t = A t + λ t ,
where  N ( μ n , σ n )  is a normal distribution, which has the mean and standard deviation as  μ n  and  σ n , respectively.  μ n  is commonly set as 0, whereas  σ n  is usually decreased according to increasing episodes for training using decay rate ( φ ).
From the previous process, it is experience generation which is stored in the buffer memory. Hereafter, the updating of the four networks is started. In Figure 3, the experiences, or  S j , A j , R j , S j + 1 , are sampled according to desired batch size  N . Then, the sampled experiences are used to update the actor and critic. The critic is updated by minimizing the Mean Squared Error (MSE) between the Q-value obtained by the calculation and the one predicted by the critic. The MSE can be calculated using the following equations.
M S E = 1 N j = 1 N Q c a l , j Q p r e d , j 2 ,
Q c a l , j = R j + γ Q p r e d , j + 1 ,
Q p r e d , j = C S j , A j θ c r i t ,   Q p r e d , j + 1 = C S j + 1 , A j + 1 θ c r i t ,  
A j = A S j + 1 θ a c t ,   A j + 1 = A S j + 1 θ a c t ,  
where  Q c a l , j  and  Q p r e d , j  are the Q-values at state  S j  and action  A j  from the calculation using Equation (33) and the prediction using the critic ( C ) in Equation (34), respectively.  Q p r e d , j + 1  denotes the Q-value at the next state  S j + 1  and next action  A j + 1 , predicted by the target critic ( C ) in Equation (34). The  A j  and  A j + 1  are evaluated using  S j  and  S j + 1 , which are fed into the actor ( A ) and target actor ( A ), respectively, in Equation (35).  γ  is the discount factor. Then,  θ c r i t  and  θ c r i t  are the weights of the critic and target critic, respectively. In contrast,  θ a c t  and  θ a c t  are the weights of the actor and target actor, respectively. Each  S j , A j , R j , S j + 1  sampled from the buffer memory is used to estimate the  Q c a l , j  and  Q p r e d , j . Therefore,  Q c a l , j  and  Q p r e d , j  are calculated according to the number of batch size  N  and they are used to estimate the MSE using Equation (32). Subsequently, the weight of the critic ( θ c r i t ) is updated by an Adam optimizer using the calculated MSE under the desired learning rate. The above process will occur every time step  t  of each episode occurs.
Furthermore, the weight of the actor is updated along with the updating of the weight of the critic. In Figure 3, the sampled policy gradient is employed to achieve the above aim. The policy gradient is used to apply the chain rule for finding the proper-changing direction of the action, which can provide the maximum Q-value [42]. The sampled experiences in the previous process are used in the policy gradient, which can be described using the following equation [42].
θ a c t J 1 N j = 1 N a C S , a θ c r i t S = S j , a = A S j θ a c t A S θ a c t S = S j ,  
where  θ a c t J  is the result that can provide the proper-changing direction of the action. From the chain rule concept and Equation (36), there are two parts that are applied to the gradient, consisting of the critic network with respect to the action predicted by the actor ( a C ), and the actor network with respect to the actor parameters ( θ a c t A ). Two parts will operate at the same time to provide the  θ a c t J  properly; more detail about how to prove the policy gradient and its performance can be found in [43].
Moreover, two target networks need to be updated, which is considered the last step for updating the networks within each agent, as observed in Figure 3. These networks cannot consistently apply a strong update along with the actor and critic update. They are used to protect the divergence situation for the learning of the actor and critic, which has more detail for target network usage in [42]. Thus, the soft update concept is utilized to update them by transferring the weights of the actor and critic onto the target actor and target critic, respectively, using a soft factor ( τ 1 ), which can be shown as follows.
θ c r i t τ θ c r i t + ( 1 τ ) θ c r i t θ a c t τ θ a c t + ( 1 τ ) θ a c t ,
The above processes are replaced with 24 h in each episode. Next, 24 rewards of the agent m at episode k are summed as a single return ( R k , m ). The number of agents is defined as M. The average return of all agents at episode k is defined as ARAk. Then, the variable defined as the condition for well-trained models’ saving is the mean of 50 previous ARAs at episode k (MARAk). The ARAk and MARAk are estimated using the following equations.
A R A k = m = 1 M R k , m M ,  
M A R A k = p = k 50 k A R A p 50 ,  
In Figure 3, if MARAk is more than the MARAk−1, well-trained models of all agents will be saved. Otherwise, saving all models does not operate. Finally, if the current episode equals the maximum episode, the training procedure will end. Otherwise, it is still operated, and the current episode is updated as the next episode.

4.3. Testing Procedure

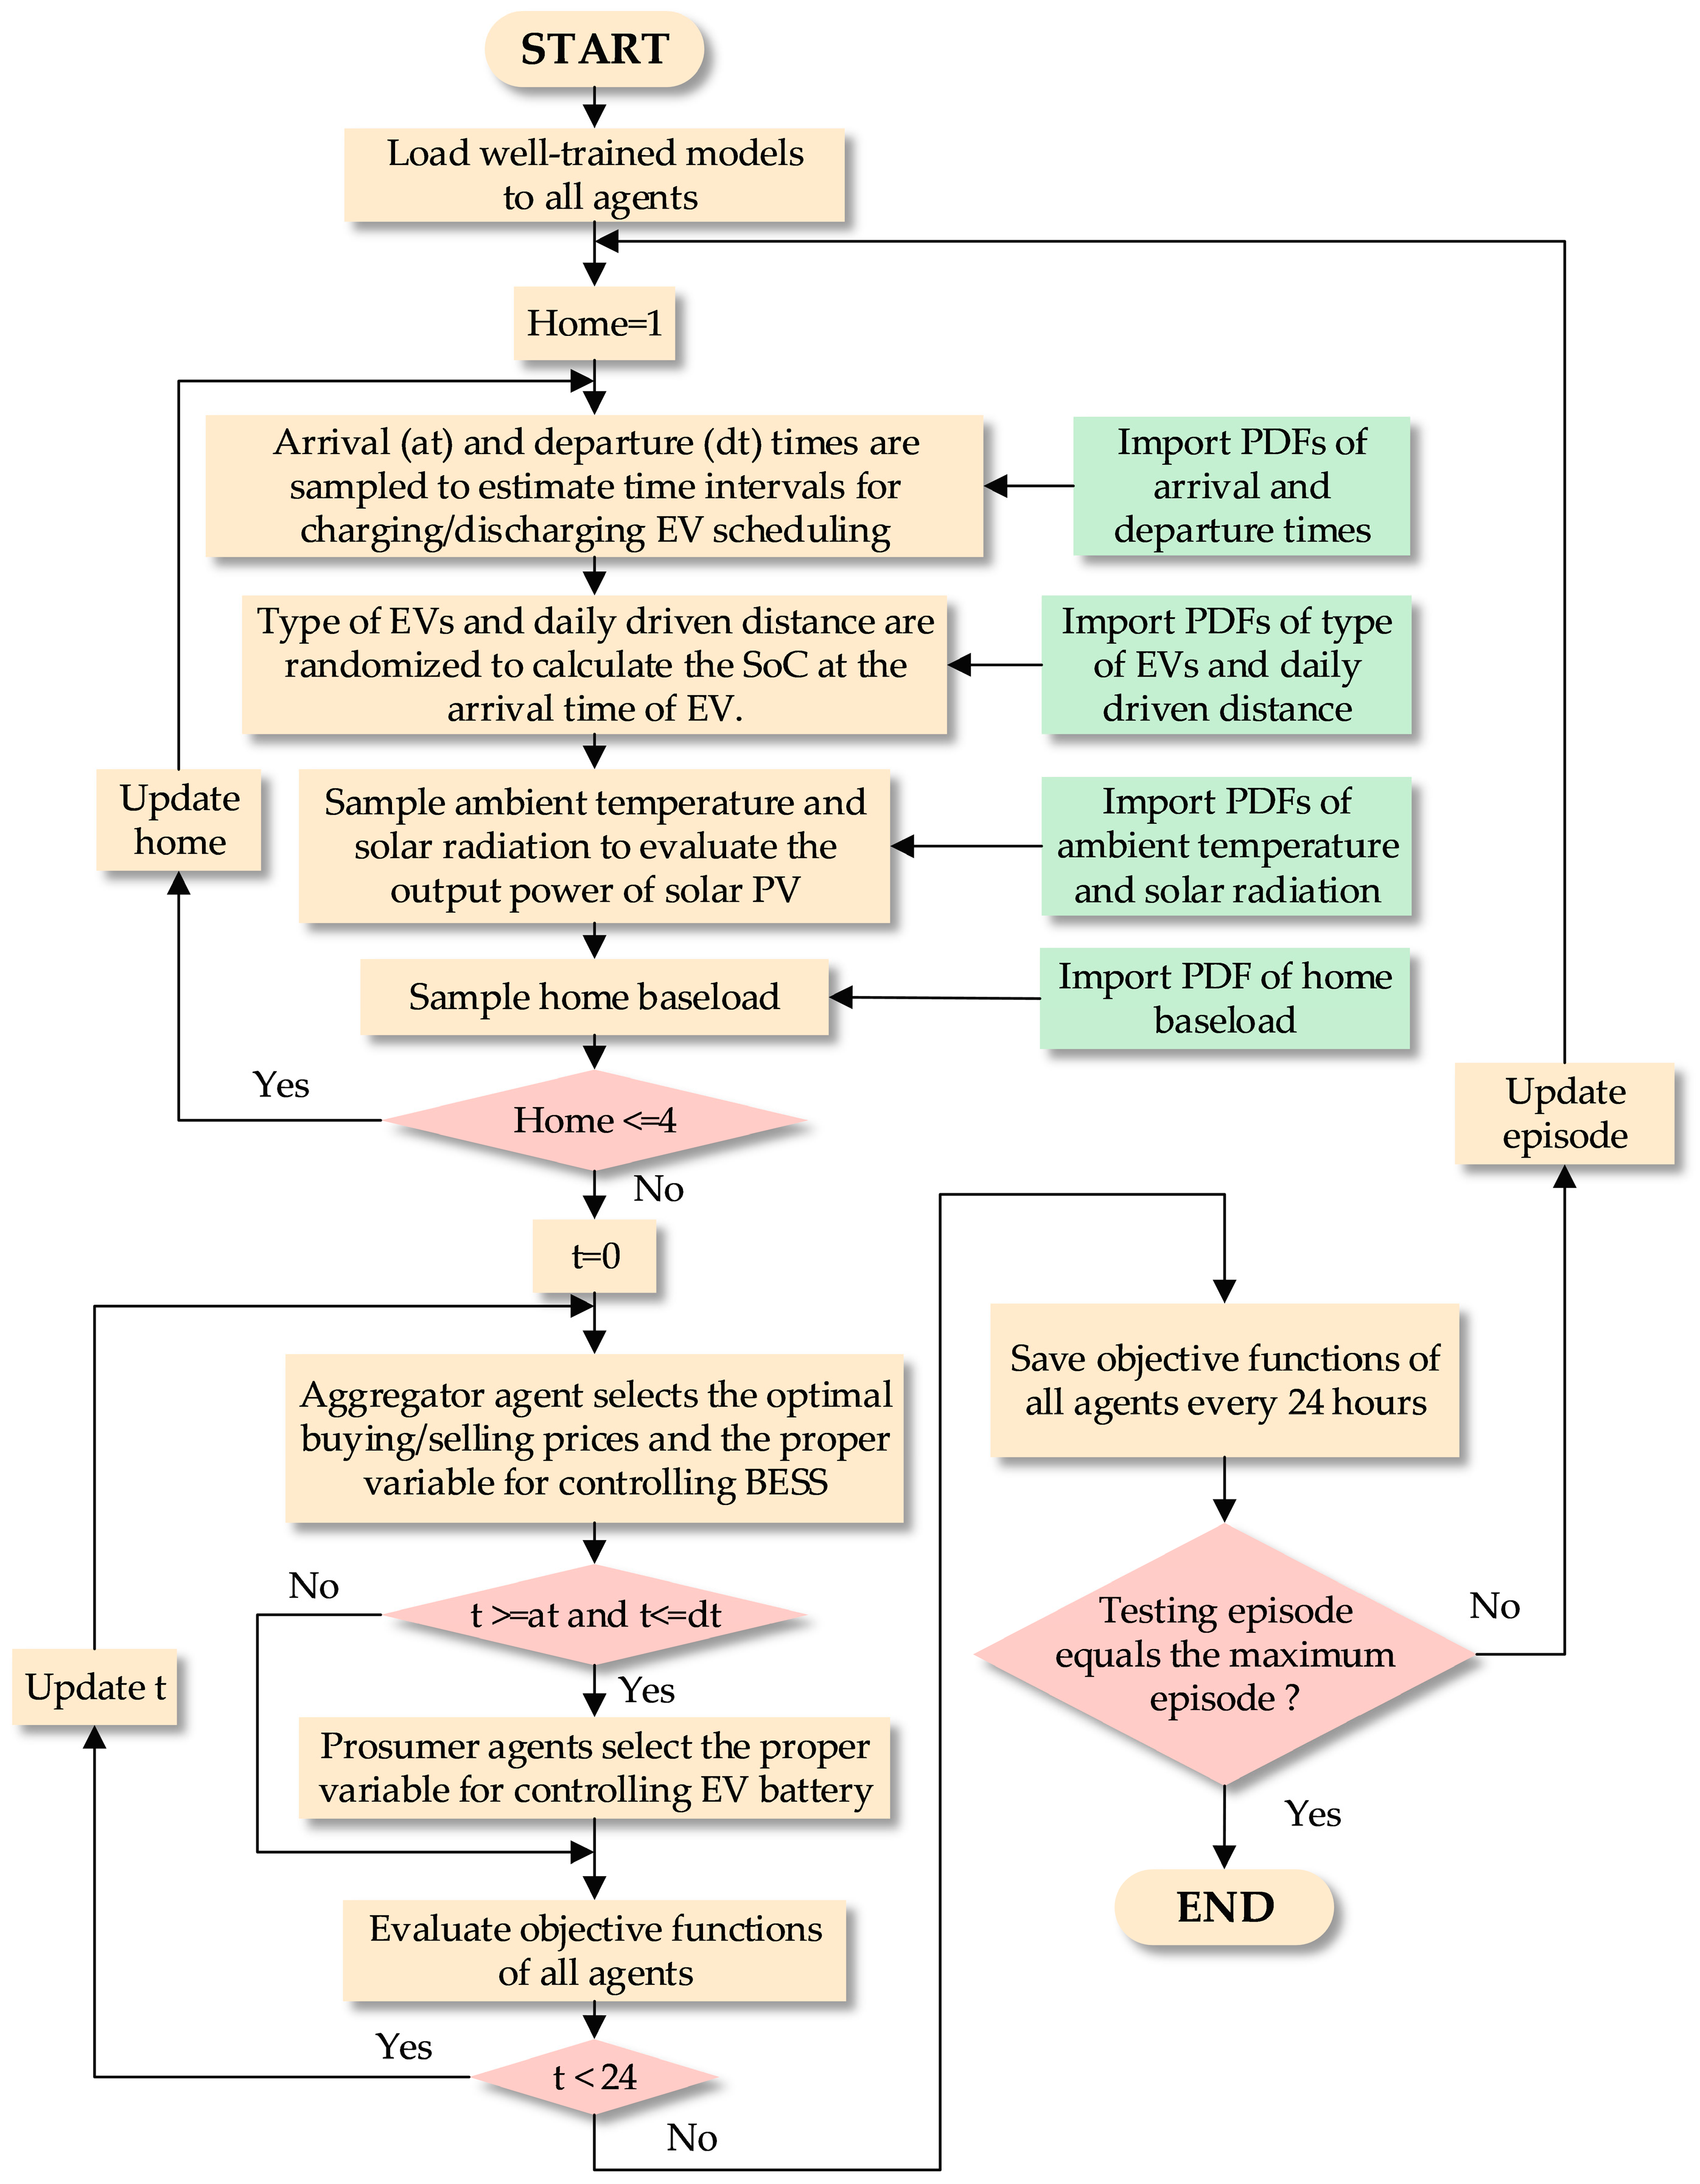
In this subsection, the well-trained model of each agent is loaded into the agent to control the environment properly. Also, the optimal overall cost of each agent is estimated in the procedure. The testing procedure is shown in Figure 4.
In Figure 4, firstly, the well-trained models saved from the training procedure are loaded into all agents. Then, necessary variables are randomized to estimate important information about EV usage, solar PV generation, and home baseload, just as in the training procedure. This process is applied to four homes. Subsequently, the aggregator agent will select the optimal buying and selling prices and the proper variable for controlling the BESS. Then, all prosumers will take the proper variable for controlling their EV batteries if the current time is between the arrival and departure times. Next, the overall objective functions of all agents are evaluated. This process is repeated until 24 h have passed. The objectives of all agents are then saved every 24 h in each testing episode. If the testing episode equals the maximum episode, the testing procedure will stop. Otherwise, the episode is updated, and the testing procedure is repeated in the next episode.

5. Simulation Results and Discussions

5.1. Assumption and Case Studies

Four prosumers are grouped together for energy trading with a single aggregator. Each prosumer has a single EV, solar PV rooftop setup, and home baseload. The peak demands of the four prosumers are determined as 3 kW, 4 kW, 5 kW, and 6 kW, respectively. The output power rating of solar PV rooftop setups is determined to be 5 kW. The charging/discharging power rating at the home level is 5 kW, the same as the output power rating of a solar PV rooftop setup. Additionally, charging/discharging efficiency is determined to be 0.95 in this work. The prosumer aims to control the EV battery when the EV is at home to reduce their electricity expenses. On the other hand, the aggregator proposes buying and selling prices for energy to all prosumers to address the inconsistent EV scheduling and improve the power consumption of all prosumers. Additionally, the aggregator controls the central BESS to manage the surplus or desired power of all prosumers and to regulate the power being injected or absorbed into/from the grid system.
To demonstrate the performance of the proposed method, real data is used in this work. For the EV behavior at the home level, according to reference [6], the departure time is randomized from a normal PDF with a mean equal to 7.0 and a standard deviation equal to 1.5. Also, the arrival time is sampled from a normal PDF with its mean equal to 18.0 and its standard deviation equal to 3.0. Moreover, 3.20 and 0.88 are determined to be the mean and the standard deviation of a lognormal PDF [35], respectively, used for sampling the daily driven distance. Furthermore, three EV models are randomly labeled, including the Chevy Volt, Nissan Leaf, and Tesla Model 3. Their specifications, consisting of battery capacity, charging/discharging power rating, and consumption rate, are determined according to the reference [6]. Also, the capital cost of the lithium-ion battery is determined to be USD 135/kWh according to [44]. Moreover, the energy capacity and power rating of the central BESS are 60 kWh and 15 kW, respectively.
For real data used for evaluating the power of solar PV systems and home baseloads, the hourly ambient temperature and hourly solar radiation in summer (March–June) over three years (2015–2017) according to reference [32] are used to generate the stochastic model of the solar PV power. Also, the hourly home baseload in the residential system in summer over three years (2017–2020) according to reference [32] is applied to estimate the consumption behavior of each prosumer. Time-of-Use (TOU) and Feed-in Tariff (FIT) rates in reference [5] determined by the utility are utilized in this work, which can be shown in Table 1.
Moreover, the parameters of the aggregator and prosumer agents are shown in Table 2, whereas the parameters for the training and testing procedure are presented in Table 3. To acquire the simulation results, the Spyder program based on the Python language is applied to create the energy trading experiment between the aggregator and four prosumers. The generated situations are run on a personal computer. The computer specification includes Core (TM) i7-8700, Intel(R), 16.0 GB RAM, and CPU 3.20 GHz.
Two case studies are presented in this work. The first case study involves energy trading between a single aggregator and four prosumers with EV charging scheduling using Time-of-Use (TOU) and Feed-in Tariff (FIT) rates. The second case study involves energy trading using Real-Time Pricing (RTP). The specifics of both case studies are described as follows.
  • Case I: TOU & FIT energy trading; the aggregator proposes the selling energy price using the TOU rate to four prosumers. In contrast, the FIT rate, determined as the buying energy price, is offered to four prosumers every 24 h. Additionally, the aggregator and prosumers can only control their battery to maximize their rewards through multi-agent optimization using the DDPG algorithm.
  • Case II: RTP energy trading (proposed method); the aggregator proposes the selling energy price and buying energy price using the RTP concept to four prosumers for 24 h. The aggregator can control both selling/buying prices and its BESS, whereas the four prosumers try to control their EV batteries to maximize their rewards. Additionally, multi-agent optimization using the DDPG algorithm is employed to acquire the optimal decisions of both the aggregator and prosumer.

5.2. Comparison Results

From the previous subsection, two case studies are defined to represent the performance of the proposed method. Thereafter, the simulation results provided by the two case studies are compared in this subsection.

5.2.1. Training Results

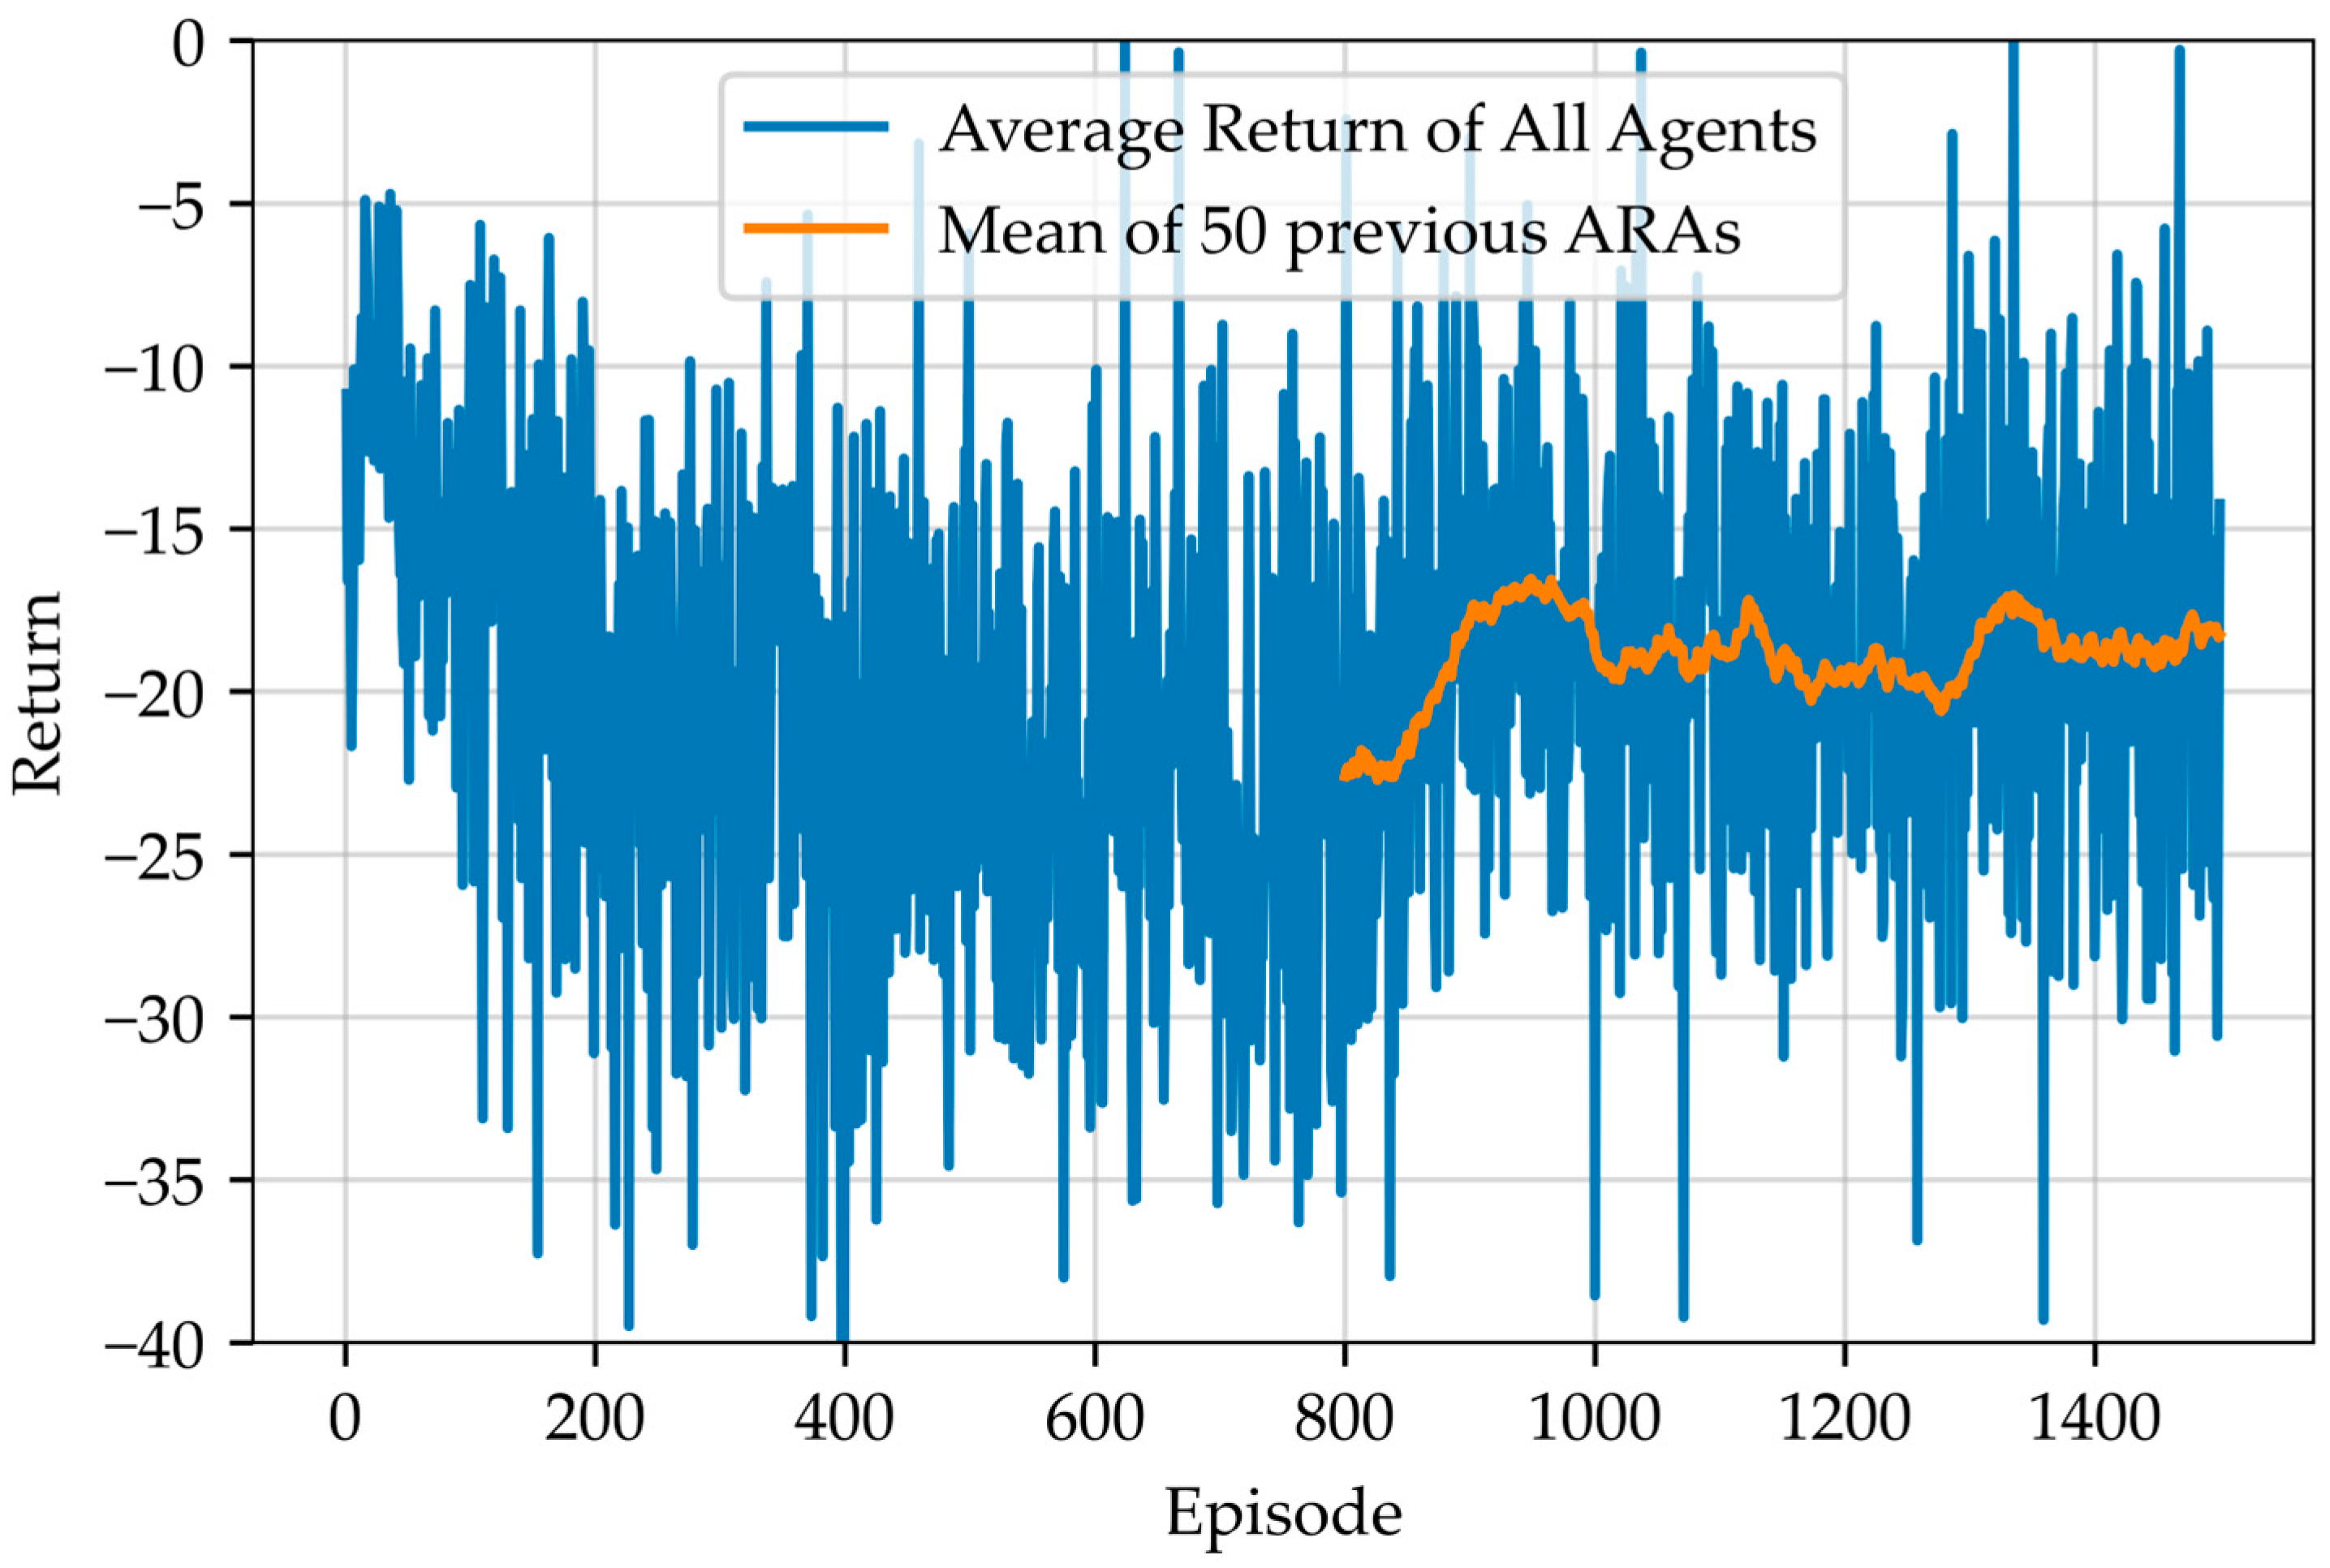
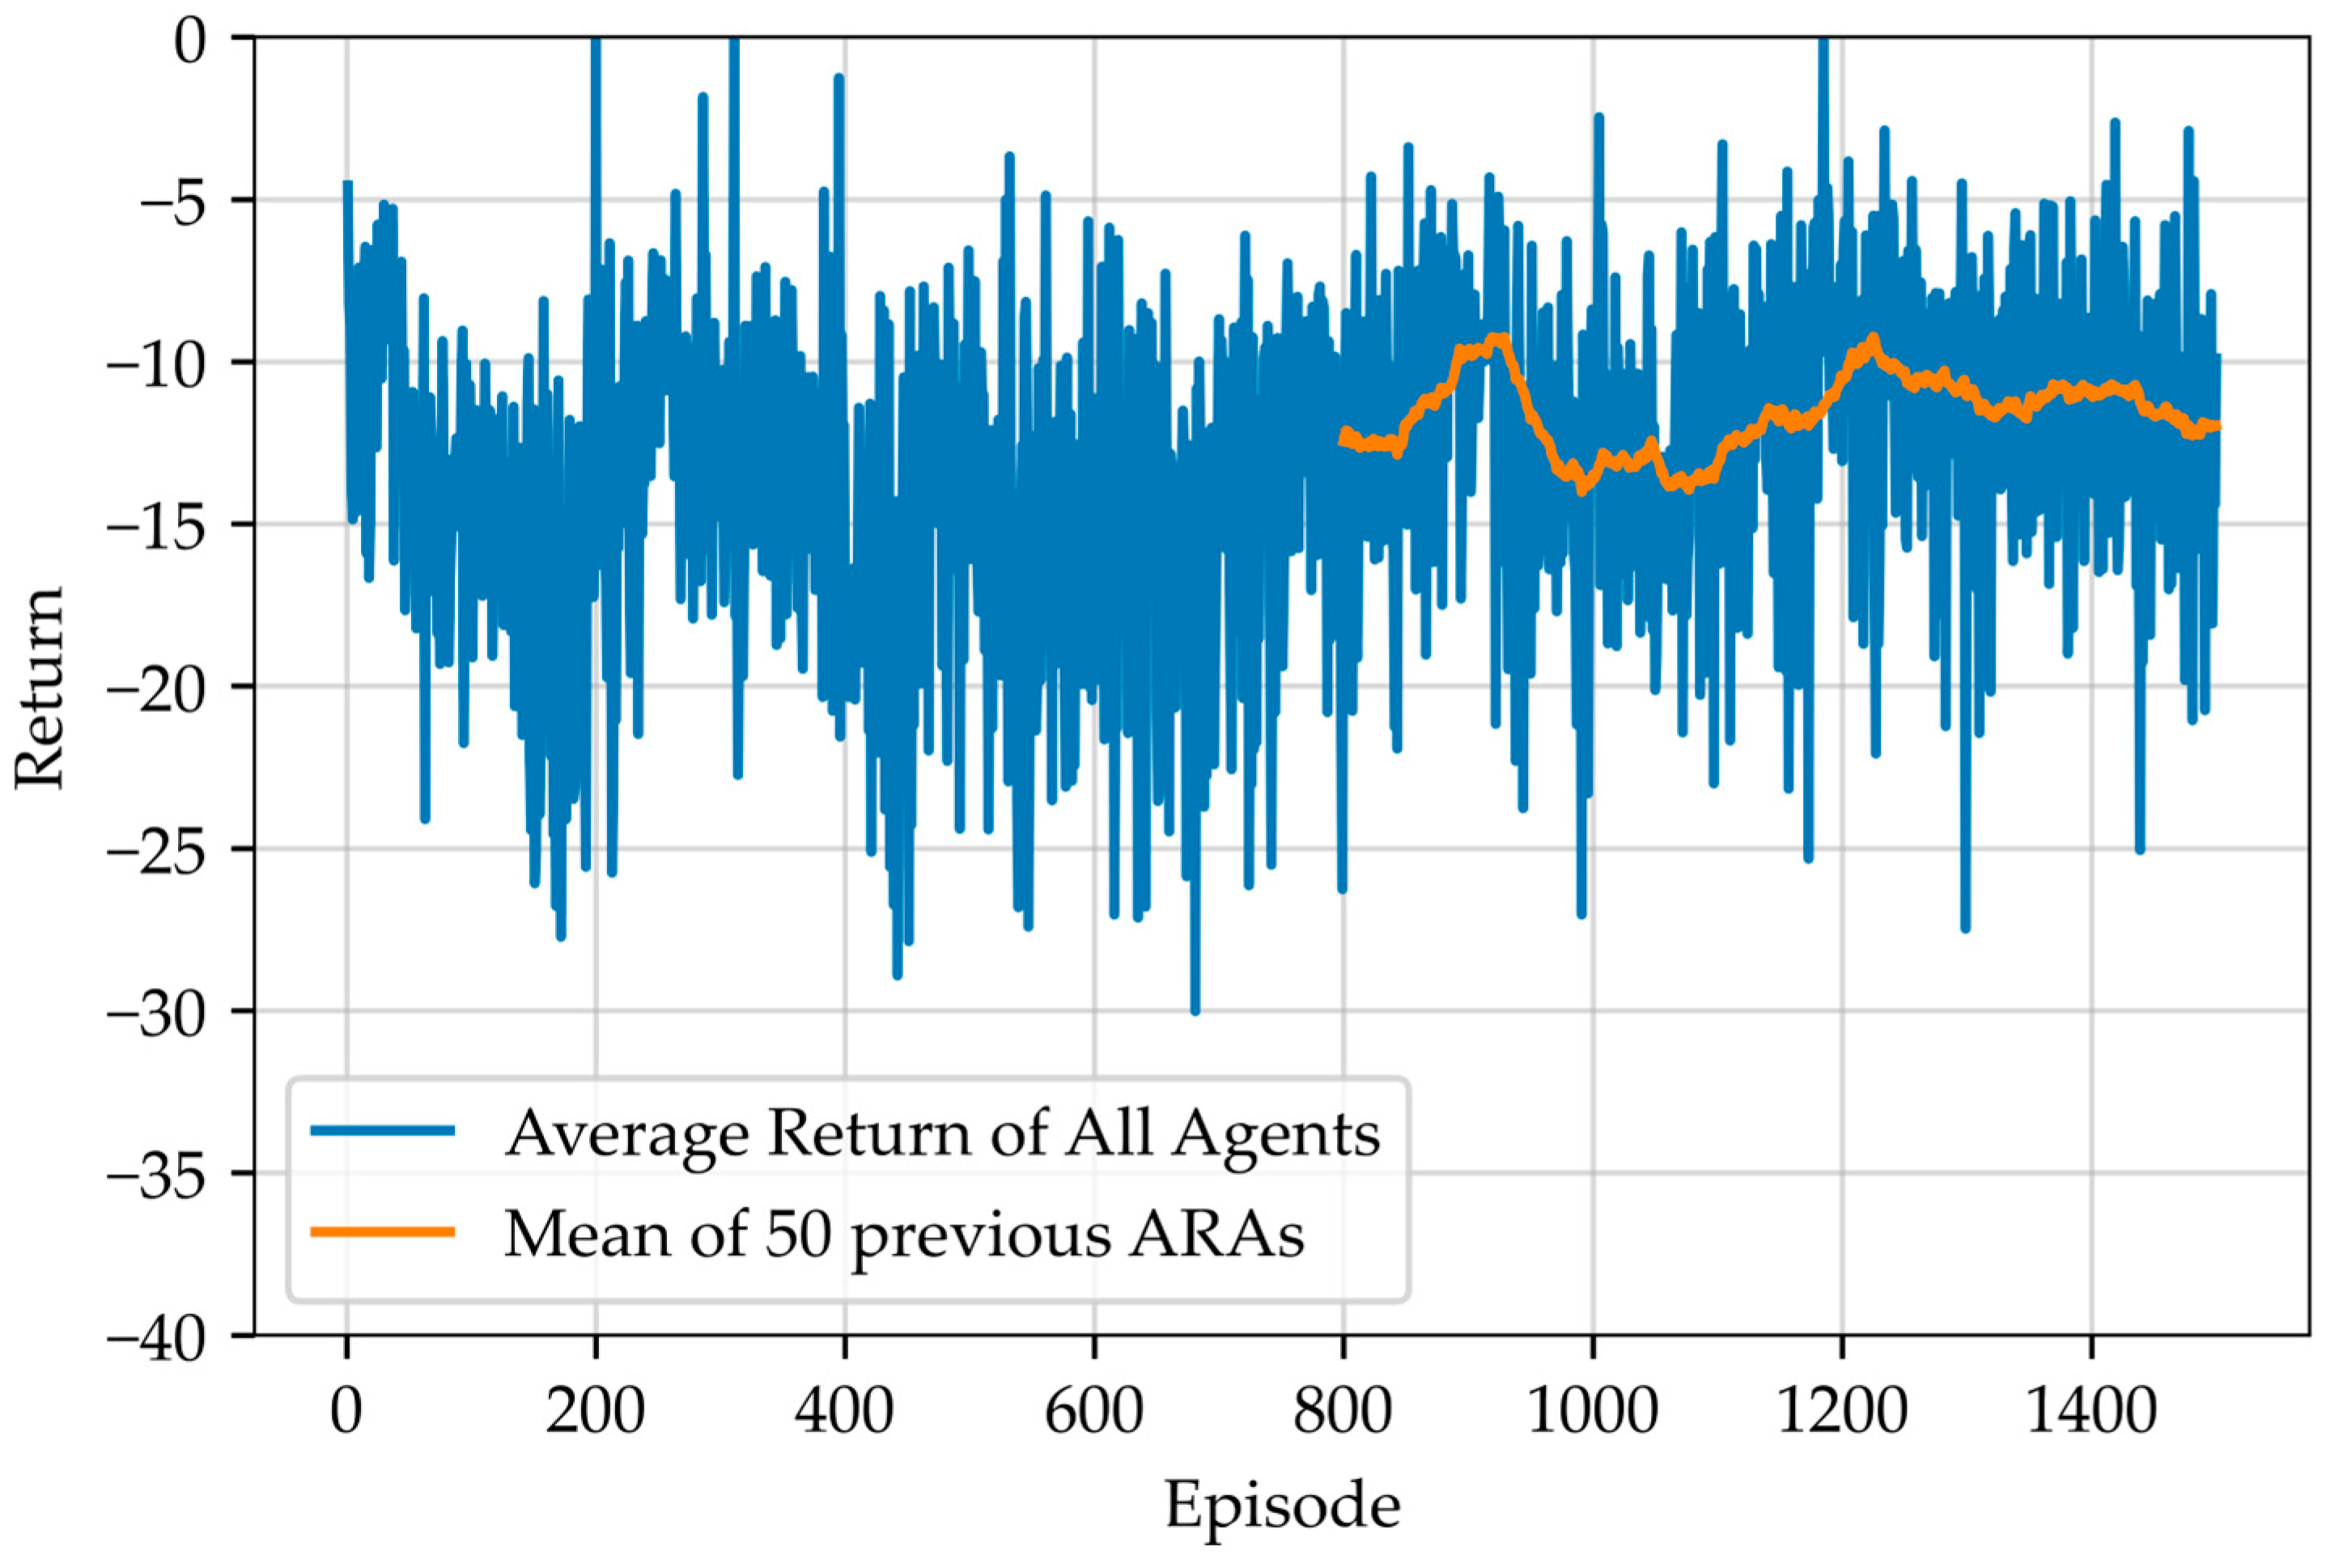
The training procedure is adapted to ensure the compliance definition of each case. The ARA and MARA defined in the training procedure are used to represent the training behaviors of all agents in each case. The ARA and MARA of Case I and Case II are shown in Figure 5 and Figure 6, respectively.
As seen in Figure 5 and Figure 6, the results indicate that the ARA value experiences significant fluctuations in comparison to the MARA trend. It is therefore necessary to switch from the ARA to the MARA in order to avoid frequent model saving in the training procedure. During the early episodes, the noise effect added to the actions to encourage exploration by the agent is quite high, leading to an inability to save the model. In this work, the decay rate is set at 0.0005. According to Equations (30) and (31), the noise effect decreases exponentially when the training episode reaches 800 episodes. Hence, if the episode is greater than or equal to 800, the calculation of the MARA begins.
For Case I, the MARA is highest at about the 950th episode, as shown in Figure 5. Hence, the well-trained models of all agents are saved in this episode. In contrast, the MARA is highest at about the 900th episode in Case II, along with saving the well-trained models of all agents, as shown in Figure 6. However, consideration of the value of the MARA reveals that the highest MARA obtained by Case II is more than the highest MARA obtained by Case I. The above situation indicates a preliminary conclusion that applying real-time energy trading has a good capability for achieving the aim of this work.

5.2.2. Energy Pricing Results

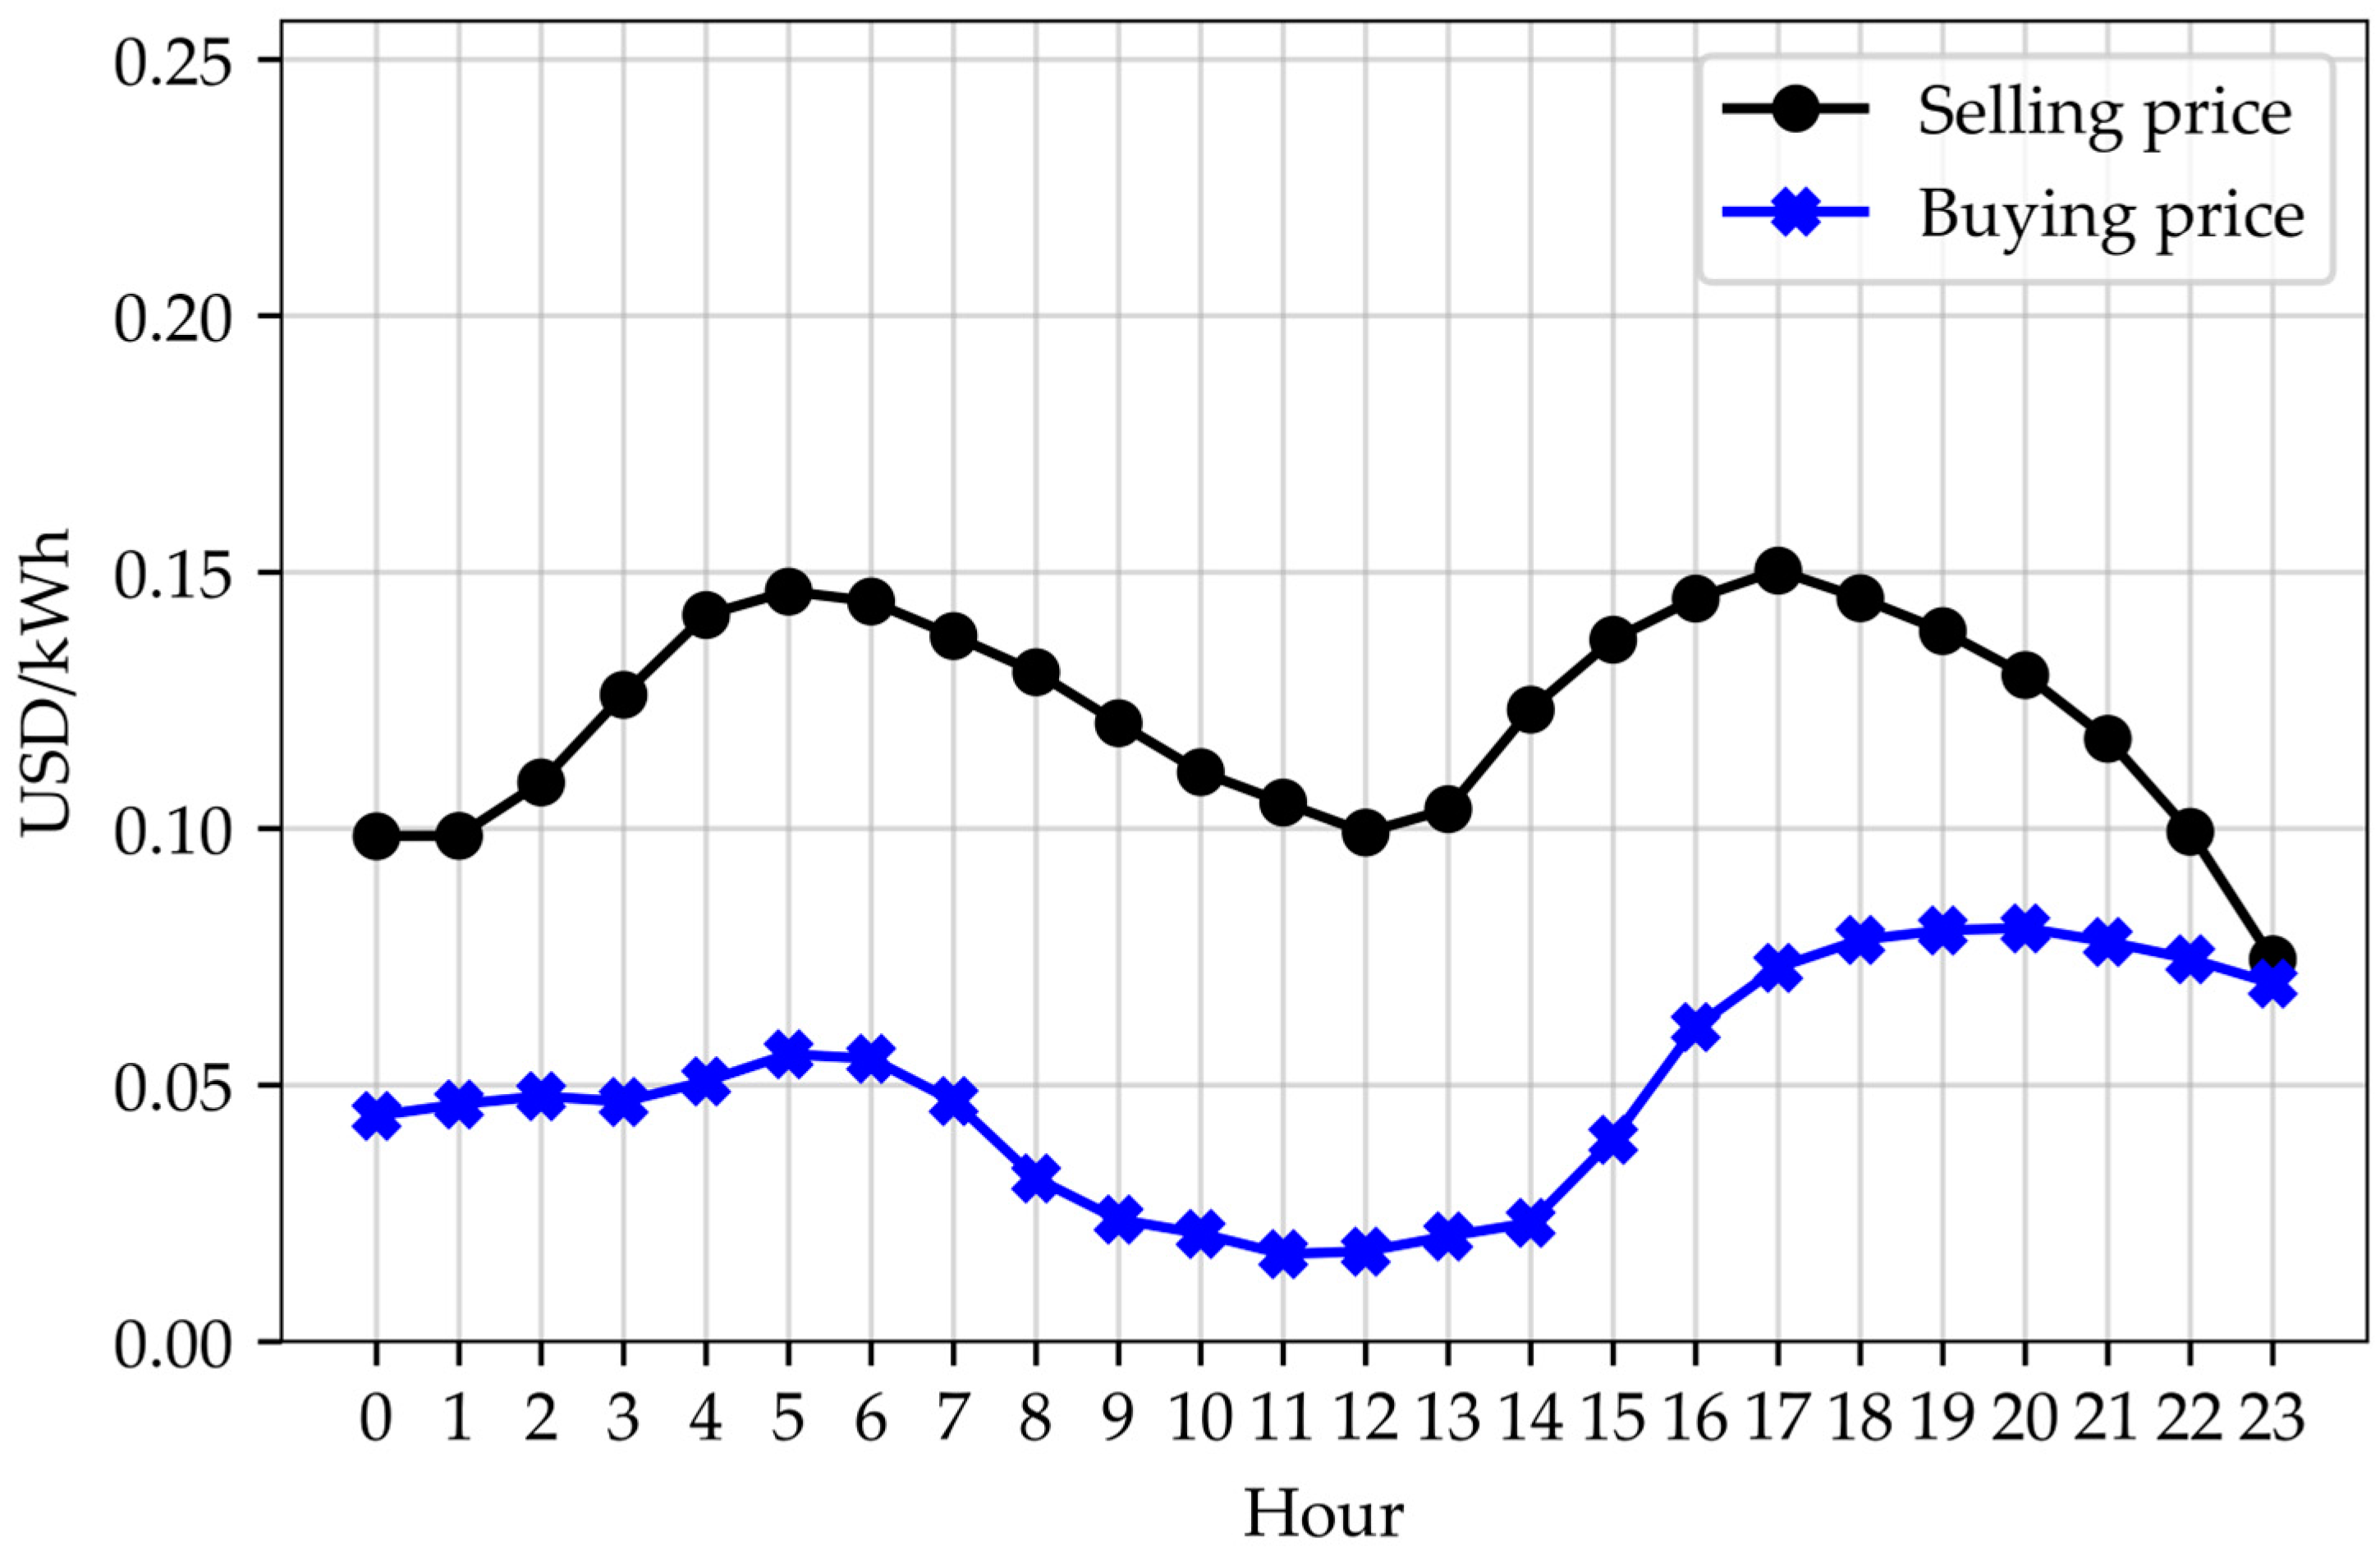
The well-trained models obtained from the training procedure are saved for later use in testing. These models are loaded into all agents for the testing phase, which takes into account the uncertainties of EV usage, solar PV generation, and home baseloads. To ensure reliable results, the testing procedure is repeated 1000 times and the desired results are averaged for representation, rather than using a single episode’s results. Thus, the hourly mean energy prices of Case I are presented in Figure 7, while the hourly mean energy prices of Case II are shown in Figure 8.
As seen in Figure 7, the energy prices in Case I are determined using TOU and FIT rates from the utility. The selling price has a step-like characteristic, while the buying price is constant. Thus, the selling price has a greater impact on prosumer behavior compared to the buying price. In Case II, energy prices are determined through multi-agent optimization during the training procedure, wherein the aggregator interacts with the four prosumers using RTP to provide optimal prices for improving the power consumption of all prosumers. The energy prices for Case II can be seen in Figure 8, and both the selling and buying prices have similar characteristics, but with different scaling. The comparison results between Case I and Case II will be described in Section 5.2.3 and Section 5.2.4.

5.2.3. Power State Results

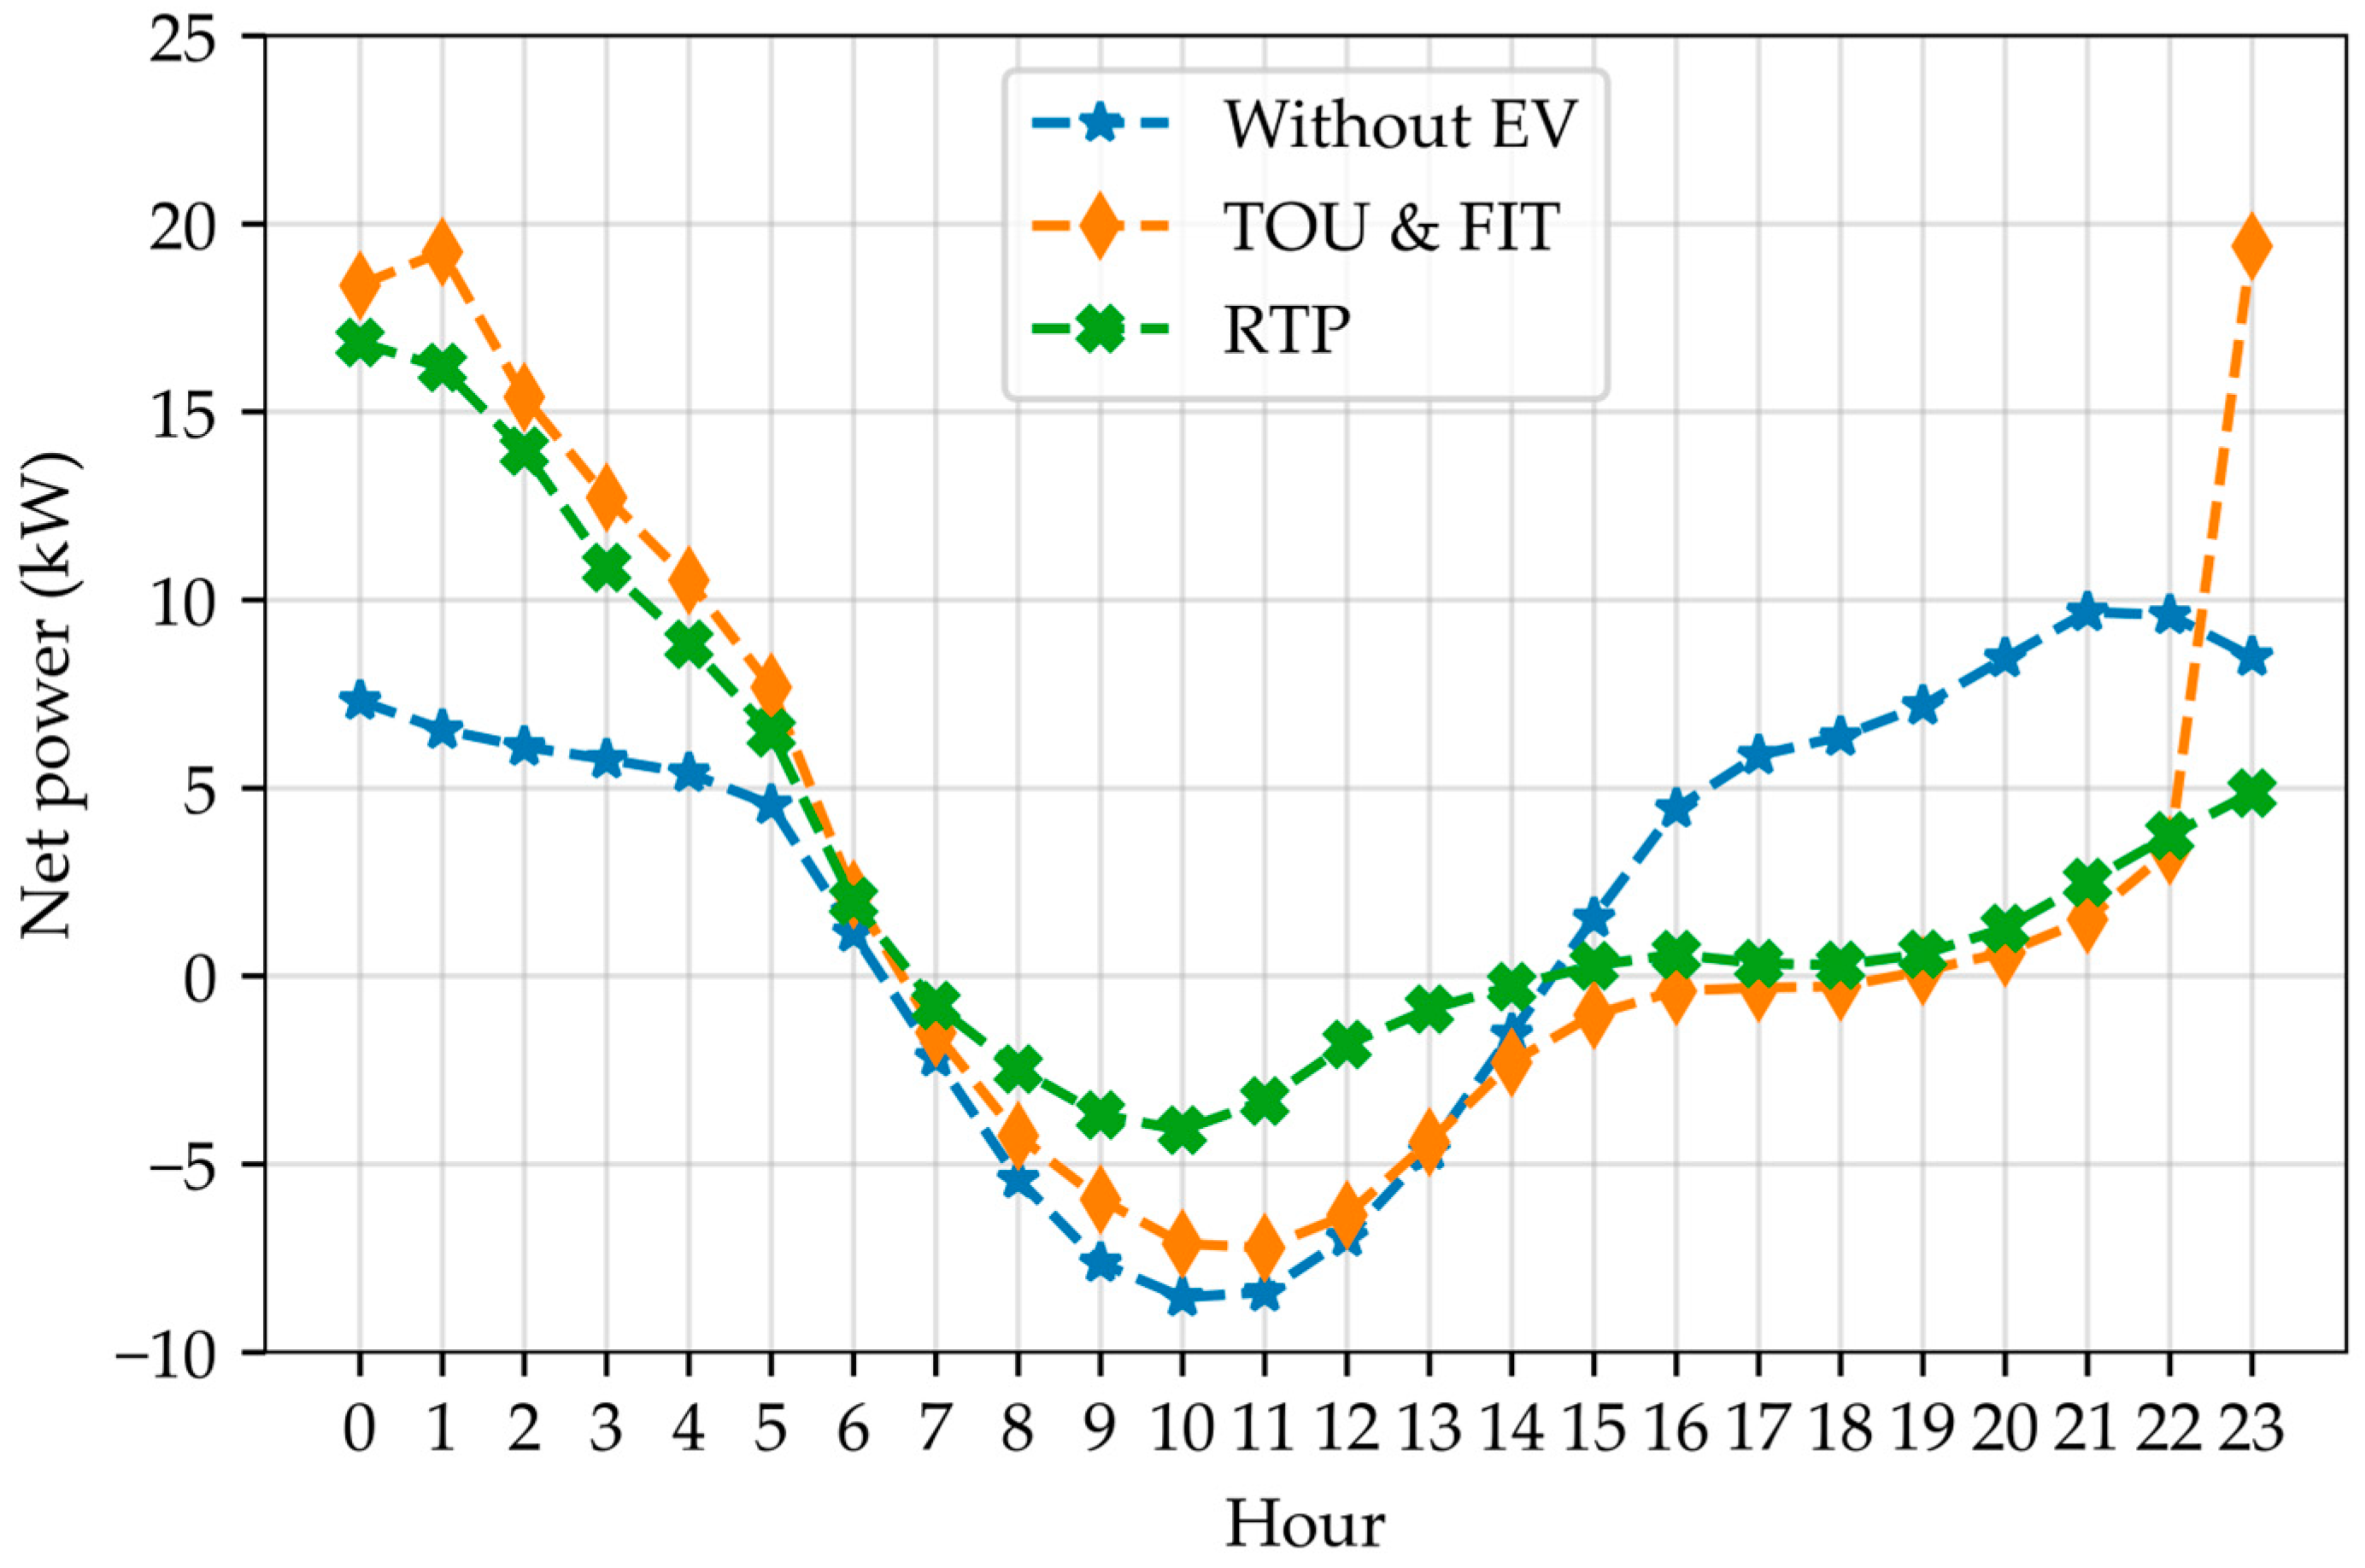
The power state is one of the essential factors that can reflect advantages or disadvantages when applying the two case studies above. The hourly mean of the net power of the aggregator is as shown in Figure 9.
During the time interval of 7.00 A.M. to 2.00 P.M., there is substantial surplus power, represented by negative blue power, generated from the solar photovoltaic systems installed in individual homes. To utilize this surplus energy, the aggregator will activate the central battery energy storage system (BESS). By employing the RTP method, the aggregator will effectively store a greater amount of surplus power from all prosumers, as evidenced by the reduced net power observed in Figure 9. During the intervals of 15.00–20.00, the net power is close to zero in both Case I and Case II, compared to the net power without EVs. This is because EVs usually arrive during this interval. Hence, each prosumer tries to control their EV battery to reduce electricity expenses. In this interval, Case I has a high selling price offered by the aggregator, defined as the buying price for the prosumer, as shown in Figure 7. Meanwhile, the buying price in Case II has an increasing trend, defined as the selling price for the prosumer in Figure 8. This attracts the attention of prosumers to control their EV batteries for discharging, leading to reduced net power in both cases.
For the intervals from 21.00 to 23.00, there is a noticeable increase in the net power, especially in Case I. The rapid decrease in the TOU rate from peak to off-peak times leads to the prosumer switching the EV operation from V2H to H2V modes when TOU & FIT is applied. This results in an undesired demand at the 23rd hour. However, the use of RTP helps to alleviate this problem, as can be seen from the net power at this interval in Figure 9.
For the intervals of 0.00–6.00, the net power in both Case I and Case II is higher than the power without EVs. This indicates that most EVs are charging during this interval to prepare for their departure. However, the net power when applying Case II is lower than the net power when using Case I. These comparison results demonstrate that RTP can effectively prevent unwanted demand and schedule the charging/discharging of EVs efficiently. The mean of the net power without EVs and the net powers from Case I and II during the power consumption interval can be seen in Table 4 for verification.
As can be seen in Table 4, the mean of the net power consumption applying RTP in Case II is less than the mean obtained by the condition without EV and Case I. Additionally, the proposed method using RTP can decrease the mean by 9.04% compared with the mean without EV. In contrast, employing Case I using the TOU & FIT cannot reduce the mean compared with the mean without EV, as can be noticed from the negative decreased percentage. Therefore, implementing the RTP approach is more effective than the TOU & FIT and results in a decrease in overall demand compared to a system without EV usage.
Moreover, the mean of the net power consumption when applying RTP in Case II can be reduced by 39.57% compared to the mean obtained using TOU & FIT. Also, not utilizing EVs within the home can result in a better mean compared to employing EVs with TOU & FIT, as seen from the positive decrease percentage of 33.56% in the condition without EVs. As a result, the proposed method represented by RTP can more effectively reduce total demand compared to deploying TOU & FIT.

5.2.4. Objective Evaluation Results

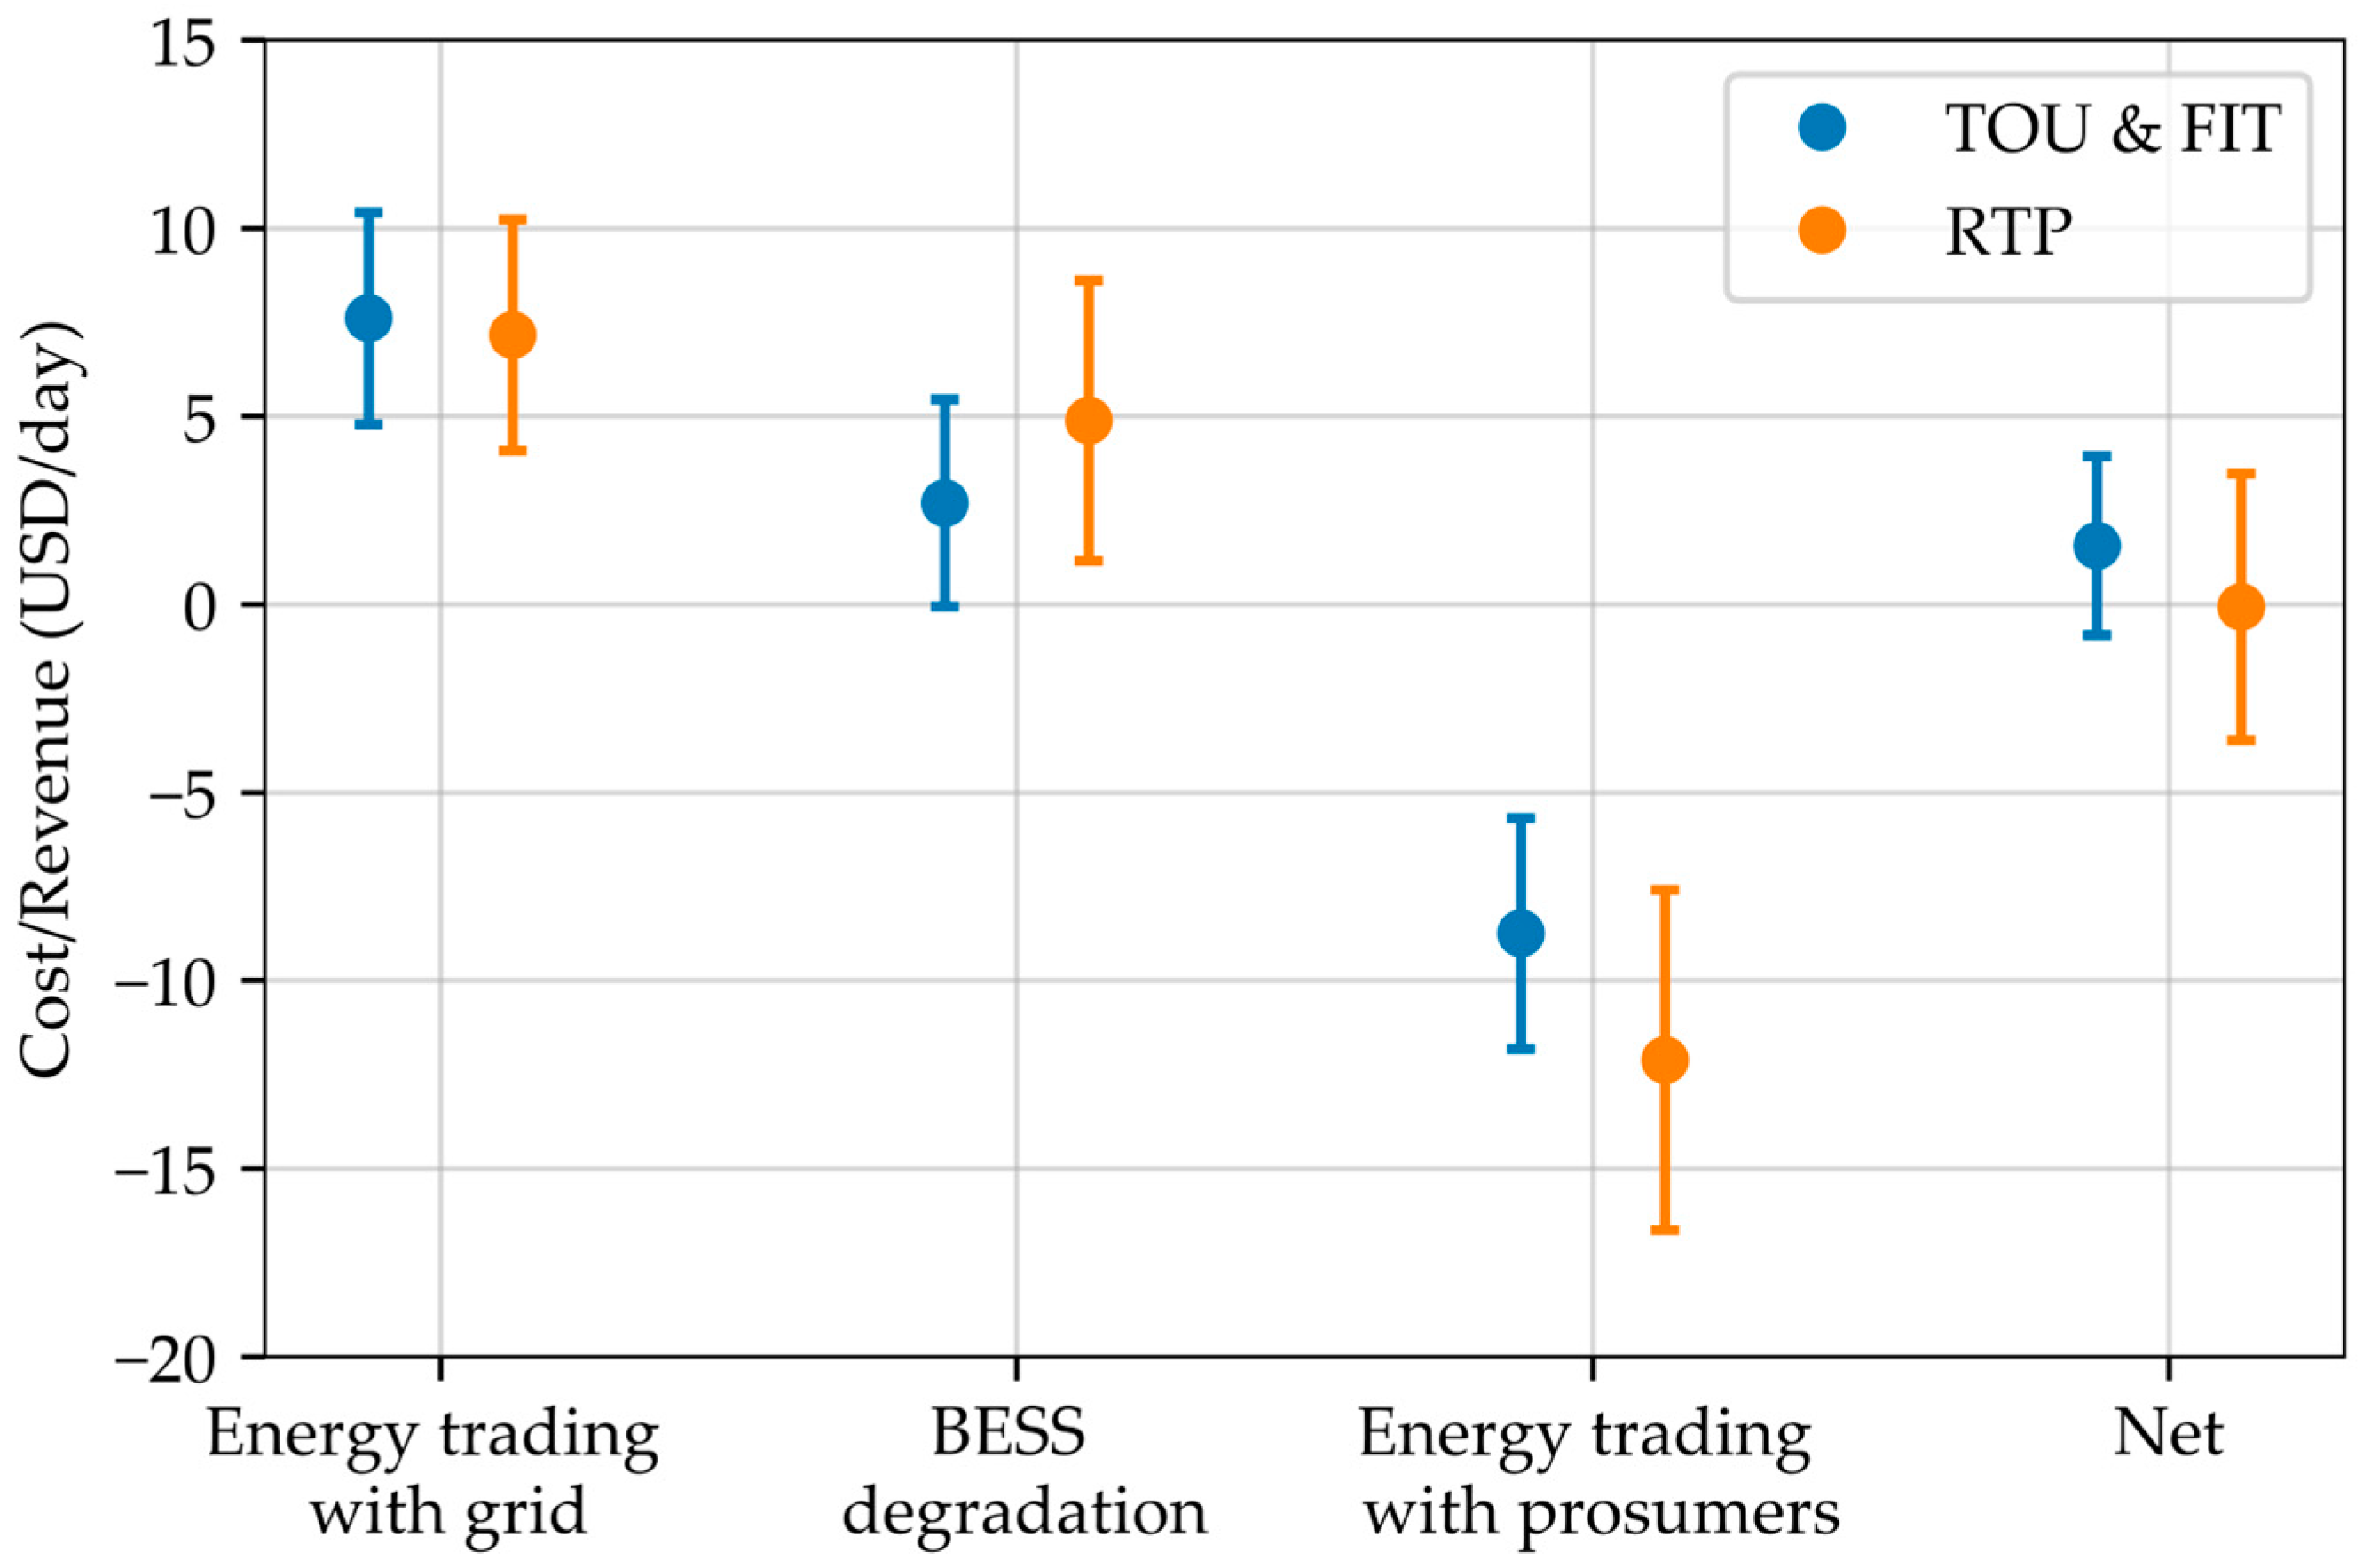
From the previous sub-subsection, the net power results are shown to verify the power reduction of the proposed methods. Hereafter, the overall revenue/cost of the aggregator and prosumers are presented in this sub-subsection. The results are based on 1000 simulation episodes and represented with 95% confidence levels. The overall objective values of the aggregator can be found in Figure 10.
There are three objectives considered in the aggregator, including revenue/cost from energy trading with the grid and prosumers, and BESS degradation cost. If the objective value is positive, it is considered as a cost, and if it is negative, it is considered as revenue. The results in Figure 10 show that the cost of energy trading with the grid when applying the TOU & FIT is similar to the cost when using RTP. However, the cost of BESS degradation when applying RTP is higher than the cost obtained through the TOU & FIT, indicating that the BESS is discharged more frequently when using RTP.
Moreover, applying RTP can increase the revenue from energy trading with prosumers, as depicted in Figure 10, leading to a net close to 0. On the other hand, the net will become a cost when using TOU & FIT. As a result, the net mean obtained by using RTP can be reduced further. To provide a clearer understanding, the mean and standard deviation of each objective function of the aggregator, and the net cost of all prosumers, can be seen in Table 5 and Table 6, respectively.
The proposed method, as shown in Table 5, has a mean net of USD −0.065 per day, which is a revenue. In contrast, using TOU & FIT results in a net cost trend with a value of USD 1.564 per day. This demonstrates that the proposed method can increase revenue-making opportunities for the prosumer supervision.
Furthermore, as shown in Table 6, energy trading using the RTP can generate a change in the net cost reduction of all prosumers of between 1.67% to 24.57% compared with TOU & FIT. Thereby, the above result can guarantee the performance of the proposed method.

5.3. Discussions

The challenge of managing energy in a multi-home environment with optimal EV charging scheduling is substantial, especially when considering real-time optimization with multiple uncertain variables. The proposed solution is to deploy a multi-agent optimization using the DDPG algorithm. As seen in Table 4 and Figure 9, the proposed method leads to improved behavior among all prosumers compared to the condition without EV usage and using TOU & FIT, as evidenced by the decreased mean net power of 9.04% and 39.57%, respectively.
Furthermore, the distribution of the aggregator’s objective values, with a 95% confidence level, as shown in Figure 10, indicates that the aggregator’s net cost/revenue can have both positive and negative values, which reflect costs and revenues, respectively. The TOU & FIT results in a higher occurrence of net costs. On the other hand, the proposed method has a higher occurrence of net revenue.
To confirm that the proposed method can increase the aggregator’s revenue opportunity for prosumer supervision, the mean aggregator’s net revenue is verified to be 0.065 USD per day as shown in Table 5. Moreover, the proposed RTP leads to a reduced net cost for each prosumer compared to TOU & FIT by 1.67% to 24.57%, as shown in Table 6. These results verify the performance of the proposed method, which proves its suitability in solving the energy management problem for multi-homes under high uncertainty. Therefore, applying the proposed method can improve the load profile of four prosumers. This causes a decreased opportunity for heavy load occurrence, directly benefiting the utility. Along with load profile improvement, the RTP estimated by the proposed method can increase revenue for supervising the prosumer of the aggregator. Also, the proposed RTP can reduce the net cost of prosumers. However, deploying the RTP concept with multi-home energy management tasks requires real-time coordination to determine RTP, which depends on prosumer behaviors in each area. This leads to a higher computational time. In contrast, applying the TOU & FIT, which the utility has already set, consumes less computational time because the aggregator and prosumers control their batteries to reduce costs without pricing coordination. However, the above results show that employing RTP can achieve all aims of this work better than applying the TOU & FIT.

6. Conclusions

The complexity of managing energy in multi-homes with scheduled EV charging/discharging presents a significant challenge in designing an energy management system and finding an optimization tool. This is particularly true for homes that face uncertainties related to solar PV system and EV usage. The goal is to enhance the ability of the home to inject/receive power to/from the grid, control the EV battery for charging/discharging scheduling, and interact with the aggregator for information exchange to reduce electricity expenses. The prosumer is defined as the entity that does so. The aggregator, on the other hand, can propose real-time pricing for buying/selling to all prosumers and control a central BESS to achieve its objective. The scenario is modeled with four prosumers and a single aggregator. The peak demands of the four prosumers are set as 3 kW, 4 kW, 5 kW, and 6 kW, respectively. Each home is equipped with a single solar PV system, EV, and home baseload. The revenue/cost from energy trading with the grid and prosumers and BESS degradation cost are set as the aggregator’s objective functions. Meanwhile, each prosumer has two objective functions: the revenue/cost from energy trading with the aggregator and the degradation cost of the EV battery.
The aggregator and prosumer are modeled as agents using the deep reinforcement optimization concept. A multi-agent optimization using the DDPG algorithm is employed to create the interaction between the aggregator and prosumer and find the best decision for each agent, which is the proposed method. Simulation results indicate that the proposed method can reduce power consumption by 9.04% and 39.57% compared to multi-homes without energy trading and EV usage, and those using time-of-use along with feed-in-tariff, respectively. The proposed method also increases the aggregator’s revenue opportunity by 0.065 USD per day and decreases the prosumer’s net cost by 1.67% to 24.57% compared to using time-of-use and feed-in-tariff.
Therefore, the proposed method, verified by the above results, is a suitable strategy for energy management in multi-homes with EV charging/discharging scheduling under the uncertainties of solar PV generation and EV usage. Opting for the best optimization tool and strategy can address irregular EV usage scheduling and handle the uncertainties of solar PV generation and EV usage. Multi-agent optimization using the DDPG algorithm with real-time energy trading is one of the best methods to achieve this goal and can be applied to solve energy management issues for many prosumers, ultimately improving the load profile at the distribution system level.

Author Contributions

Conceptualization, N.K., C.S., R.L. and R.C.; methodology, N.K. and R.C.; software, N.K.; validation, N.K., C.S., R.L. and R.C.; formal analysis, N.K., C.S., R.L. and R.C.; investigation, N.K., C.S. and R.C.; resources, N.K. and R.C.; data curation, N.K.; writing—original draft preparation, N.K.; writing—review and editing, C.S., R.L. and R.C.; visualization, N.K. and R.C.; supervision, R.C.; project administration, R.C.; funding acquisition, R.C. All authors have read and agreed to the published version of the manuscript.

Funding

This research was supported by Research and Graduate Studies, Khon Kaen University, and the Faculty of Engineering, Khon Kaen University under grant number: Mas. Ee-2565/9.

Institutional Review Board Statement

Not applicable.

Informed Consent Statement

Not applicable.

Data Availability Statement

The study did not report any data.

Acknowledgments

The authors would like to acknowledge the Research and Graduate Studies, Khon Kaen University, and the Faculty of Engineering for supporting the funding for the publication of this research.

Conflicts of Interest

The authors declare no conflict of interest.

References

  1. Aslam, S.; Iqbal, Z.; Javaid, N.; Khan, Z.; Aurangzeb, K.; Haider, S. Towards Efficient Energy Management of Smart Buildings Exploiting Heuristic Optimization with Real Time and Critical Peak Pricing Schemes. Energies 2017, 10, 2065. [Google Scholar] [CrossRef] [Green Version]
  2. Vahidinasab, V.; Ardalan, C.; Mohammadi-Ivatloo, B.; Giaouris, D.; Walker, S.L. Active Building as an Energy System: Concept, Challenges, and Outlook. IEEE Access 2021, 9, 58009–58024. [Google Scholar] [CrossRef]
  3. Nguyen, H.T.; Nguyen, D.T.; Le, L.B. Energy Management for Households With Solar Assisted Thermal Load Considering Renewable Energy and Price Uncertainty. IEEE Trans. Smart Grid 2015, 6, 301–314. [Google Scholar] [CrossRef]
  4. Mahmud, K.; Hossain, M.J.; Ravishankar, J. Peak-Load Management in Commercial Systems With Electric Vehicles. IEEE Syst. J. 2019, 13, 1872–1882. [Google Scholar] [CrossRef]
  5. Liemthong, R.; Srithapon, C.; Ghosh, P.K.; Chatthaworn, R. Home Energy Management Strategy-Based Meta-Heuristic Optimization for Electrical Energy Cost Minimization Considering TOU Tariffs. Energies 2022, 15, 537. [Google Scholar] [CrossRef]
  6. Srithapon, C.; Ghosh, P.; Siritaratiwat, A.; Chatthaworn, R. Optimization of Electric Vehicle Charging Scheduling in Urban Village Networks Considering Energy Arbitrage and Distribution Cost. Energies 2020, 13, 349. [Google Scholar] [CrossRef] [Green Version]
  7. Park, K.; Moon, I. Multi-Agent Deep Reinforcement Learning Approach for EV Charging Scheduling in a Smart Grid. Appl. Energy 2022, 328, 120111. [Google Scholar] [CrossRef]
  8. Hussain, S.; El-Bayeh, C.Z.; Lai, C.; Eicker, U. Multi-Level Energy Management Systems Toward a Smarter Grid: A Review. IEEE Access 2021, 9, 71994–72016. [Google Scholar] [CrossRef]
  9. Srithapon, C.; Fuangfoo, P.; Ghosh, P.K.; Siritaratiwat, A.; Chatthaworn, R. Surrogate-Assisted Multi-Objective Probabilistic Optimal Power Flow for Distribution Network With Photovoltaic Generation and Electric Vehicles. IEEE Access 2021, 9, 34395–34414. [Google Scholar] [CrossRef]
  10. Deb, S.; Tammi, K.; Kalita, K.; Mahanta, P. Impact of Electric Vehicle Charging Station Load on Distribution Network. Energies 2018, 11, 178. [Google Scholar] [CrossRef] [Green Version]
  11. Awadallah, M.A.; Singh, B.N.; Venkatesh, B. Impact of EV Charger Load on Distribution Network Capacity: A Case Study in Toronto. Can. J. Electr. Comput. Eng. 2016, 39, 268–273. [Google Scholar] [CrossRef]
  12. Satarworn, S.; Hoonchareon, N. Impact of EV Home Charger on Distribution Transformer Overloading in an Urban Area. In Proceedings of the 2017 14th International Conference on Electrical Engineering/Electronics, Computer, Telecommunications and Information Technology (ECTI-CON), Phuket, Thailand, 27–30 June 2017; pp. 469–472. [Google Scholar]
  13. Singh, R.; Tripathi, P.; Yatendra, K. Impact of Solar Photovoltaic Penetration In Distribution Network. In Proceedings of the 2019 3rd International Conference on Recent Developments in Control, Automation & Power Engineering (RDCAPE), Noida, India, 10–11 October 2019; pp. 551–556. [Google Scholar]
  14. Rastegar, M.; Fotuhi-Firuzabad, M.; Moeini-Aghtaie, M. Developing a Two-Level Framework for Residential Energy Management. IEEE Trans. Smart Grid 2018, 9, 1707–1717. [Google Scholar] [CrossRef]
  15. Joo, I.-Y.; Choi, D.-H. Distributed Optimization Framework for Energy Management of Multiple Smart Homes With Distributed Energy Resources. IEEE Access 2017, 5, 15551–15560. [Google Scholar] [CrossRef]
  16. Mak, D.; Choi, D.-H. Optimization Framework for Coordinated Operation of Home Energy Management System and Volt-VAR Optimization in Unbalanced Active Distribution Networks Considering Uncertainties. Appl. Energy 2020, 276, 115495. [Google Scholar] [CrossRef]
  17. Sarker, M.R.; Olsen, D.J.; Ortega-Vazquez, M.A. Co-Optimization of Distribution Transformer Aging and Energy Arbitrage Using Electric Vehicles. IEEE Trans. Smart Grid 2017, 8, 2712–2722. [Google Scholar] [CrossRef]
  18. Mak, D.; Choi, D.-H. Smart Home Energy Management in Unbalanced Active Distribution Networks Considering Reactive Power Dispatch and Voltage Control. IEEE Access 2019, 7, 149711–149723. [Google Scholar] [CrossRef]
  19. Althaher, S.; Mancarella, P.; Mutale, J. Automated Demand Response From Home Energy Management System Under Dynamic Pricing and Power and Comfort Constraints. IEEE Trans. Smart Grid 2015, 6, 1874–1883. [Google Scholar] [CrossRef]
  20. Killian, M.; Zauner, M.; Kozek, M. Comprehensive Smart Home Energy Management System Using Mixed-Integer Quadratic-Programming. Appl. Energy 2018, 222, 662–672. [Google Scholar] [CrossRef]
  21. Gonçalves, I.; Gomes, Á.; Henggeler Antunes, C. Optimizing the Management of Smart Home Energy Resources under Different Power Cost Scenarios. Appl. Energy 2019, 242, 351–363. [Google Scholar] [CrossRef]
  22. Ma, K.; Hu, S.; Yang, J.; Xu, X.; Guan, X. Appliances Scheduling via Cooperative Multi-Swarm PSO under Day-Ahead Prices and Photovoltaic Generation. Appl. Soft Comput. 2018, 62, 504–513. [Google Scholar] [CrossRef]
  23. Jordehi, A.R. Optimal Scheduling of Home Appliances in Home Energy Management Systems Using Grey Wolf Optimisation (Gwo) Algorithm. In Proceedings of the 2019 IEEE Milan PowerTech, Milan, Italy, 23–27 June 2019; pp. 1–6. [Google Scholar]
  24. Battula, A.R.; Vuddanti, S.; Salkuti, S.R. Review of Energy Management System Approaches in Microgrids. Energies 2021, 14, 5459. [Google Scholar] [CrossRef]
  25. Nakabi, T.A.; Toivanen, P. Deep Reinforcement Learning for Energy Management in a Microgrid with Flexible Demand. Sustain. Energy Grids Netw. 2021, 25, 100413. [Google Scholar] [CrossRef]
  26. Ji, Y.; Wang, J.; Xu, J.; Fang, X.; Zhang, H. Real-Time Energy Management of a Microgrid Using Deep Reinforcement Learning. Energies 2019, 12, 2291. [Google Scholar] [CrossRef] [Green Version]
  27. Gao, G.; Li, J.; Wen, Y. Energy-Efficient Thermal Comfort Control in Smart Buildings via Deep Reinforcement Learning. arXiv 2019, arXiv:1901.04693. [Google Scholar]
  28. Wan, Z.; Li, H.; He, H. Residential Energy Management with Deep Reinforcement Learning. In Proceedings of the 2018 International Joint Conference on Neural Networks (IJCNN), Rio de Janeiro, Brazil, 8–13 July 2018; pp. 1–7. [Google Scholar]
  29. Sutton, R.S.; Barto, A.G. Reinforcement Learning: An Introduction; MIT Press: Cambridge, MA, USA, 2018; p. 352. [Google Scholar]
  30. Arulkumaran, K.; Deisenroth, M.P.; Brundage, M.; Bharath, A.A. A Brief Survey of Deep Reinforcement Learning. IEEE Signal Process. Mag. 2017, 34, 26–38. [Google Scholar] [CrossRef] [Green Version]
  31. Guo, C.; Wang, X.; Zheng, Y.; Zhang, F. Optimal Energy Management of Multi-Microgrids Connected to Distribution System Based on Deep Reinforcement Learning. Int. J. Electr. Power Energy Syst. 2021, 131, 107048. [Google Scholar] [CrossRef]
  32. Kaewdornhan, N.; Srithapon, C.; Chatthaworn, R. Electric Distribution Network With Multi-Microgrids Management Using Surrogate-Assisted Deep Reinforcement Learning Optimization. IEEE Access 2022, 10, 130373–130396. [Google Scholar] [CrossRef]
  33. Lee, J.-O.; Kim, Y.-S. Novel Battery Degradation Cost Formulation for Optimal Scheduling of Battery Energy Storage Systems. Int. J. Electr. Power Energy Syst. 2022, 137, 107795. [Google Scholar] [CrossRef]
  34. Zhou, C.; Qian, K.; Allan, M.; Zhou, W. Modeling of the Cost of EV Battery Wear Due to V2G Application in Power Systems. IEEE Trans. Energy Convers. 2011, 26, 1041–1050. [Google Scholar] [CrossRef]
  35. Li, Y.; Xie, K.; Wang, L.; Xiang, Y. The Impact of PHEVs Charging and Network Topology Optimization on Bulk Power System Reliability. Electr. Power Syst. Res. 2018, 163, 85–97. [Google Scholar] [CrossRef]
  36. Affonso, C.d.M.; Kezunovic, M. Technical and Economic Impact of PV-BESS Charging Station on Transformer Life: A Case Study. IEEE Trans. Smart Grid 2019, 10, 4683–4692. [Google Scholar] [CrossRef]
  37. Wang, C.; Liu, C.; Tang, F.; Liu, D.; Zhou, Y. A Scenario-Based Analytical Method for Probabilistic Load Flow Analysis. Electr. Power Syst. Res. 2020, 181, 106193. [Google Scholar] [CrossRef]
  38. Gupta, N. Gauss-Quadrature-Based Probabilistic Load Flow Method With Voltage-Dependent Loads Including WTGS, PV, and EV Charging Uncertainties. IEEE Trans. Ind. Appl. 2018, 54, 6485–6497. [Google Scholar] [CrossRef]
  39. Reddy, S.S.; Abhyankar, A.R.; Bijwe, P.R. Market Clearing for a Wind-Thermal Power System Incorporating Wind Generation and Load Forecast Uncertainties. In Proceedings of the 2012 IEEE Power and Energy Society General Meeting, San Diego, CA, USA, 22–26 July 2012; pp. 1–8. [Google Scholar]
  40. Baghaee, H.R.; Mirsalim, M.; Gharehpetian, G.B.; Talebi, H.A. Application of RBF Neural Networks and Unscented Transformation in Probabilistic Power-Flow of Microgrids Including Correlated Wind/PV Units and Plug-in Hybrid Electric Vehicles. Simul. Model. Pract. Theory 2017, 72, 51–68. [Google Scholar] [CrossRef]
  41. Park, J.; Liang, W.; Choi, J.; El-Keib, A.A.; Shahidehpour, M.; Billinton, R. A Probabilistic Reliability Evaluation of a Power System Including Solar/Photovoltaic Cell Generator. In Proceedings of the 2009 IEEE Power & Energy Society General Meeting, Calgary, AB, Canada, 26–30 July 2009; pp. 1–6. [Google Scholar]
  42. Lillicrap, T.P.; Hunt, J.J.; Pritzel, A.; Heess, N.; Erez, T.; Tassa, Y.; Silver, D.; Wierstra, D. Continuous Control with Deep Reinforcement Learning. arXiv 2019, arXiv:1509.02971. [Google Scholar] [CrossRef]
  43. Silver, D.; Lever, G.; Heess, N.; Degris, T.; Wierstra, D.; Riedmiller, M. Deterministic Policy Gradient Algorithms. In Proceedings of the 31st International Conference on Machine Learning, Beijing, China, 21–26 June 2014; Volume 32. [Google Scholar]
  44. Average Annual Prices of Lithium-Ion Battery Packs from 2010 to 2022. Available online: https://www.statista.com/statistics/1042486/india-lithium-ion-battery-packs-average-price/ (accessed on 23 November 2022).
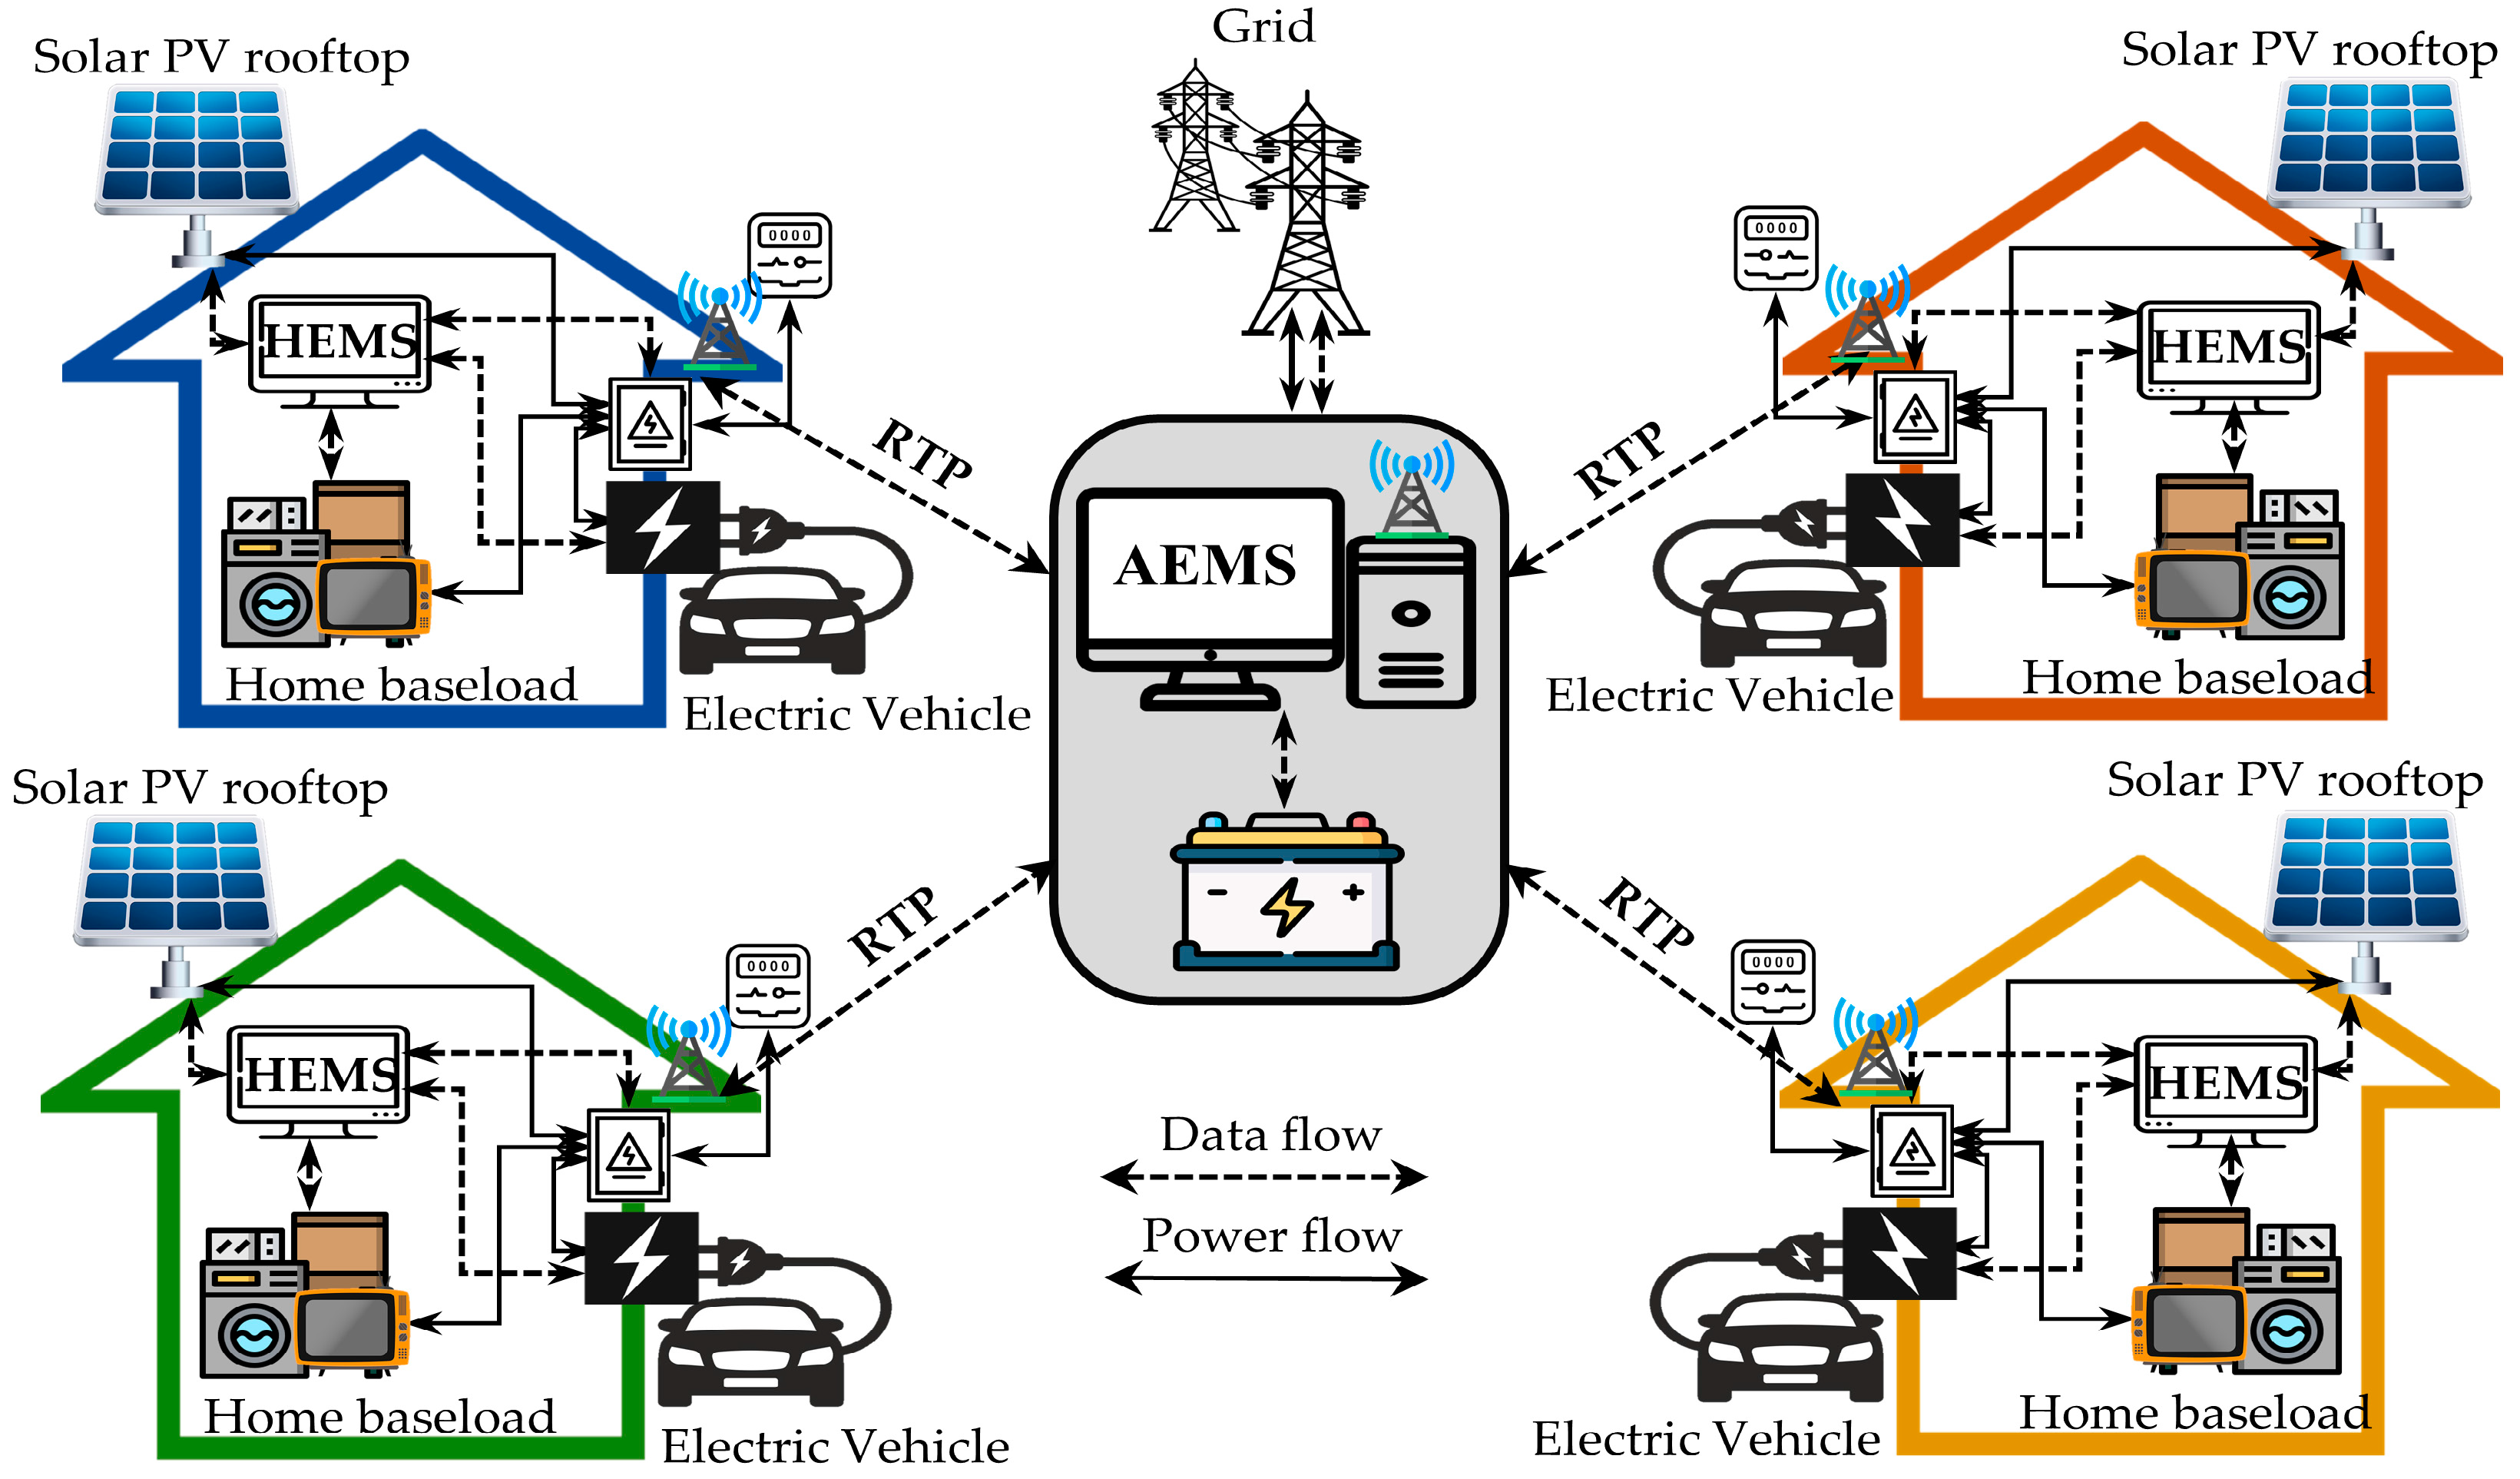
Figure 1. The proposed energy management framework.
Energies 16 02357 g001
Figure 2. The proposed DDPG with MDP framework.
Energies 16 02357 g002
Figure 3. The training procedure for multi-agent optimization.
Energies 16 02357 g003
Figure 4. The testing procedure for multi-agent optimization.
Energies 16 02357 g004
Figure 5. The ARA and MARA of Case I.
Energies 16 02357 g005
Figure 6. The ARA and MARA of Case II.
Energies 16 02357 g006
Figure 7. The hourly mean energy prices of Case I.
Energies 16 02357 g007
Figure 8. The hourly mean energy prices of Case II.
Energies 16 02357 g008
Figure 9. The hourly mean of the net power of the aggregator.
Energies 16 02357 g009
Figure 10. The overall objective values of the aggregator.
Energies 16 02357 g010
Table 1. The hourly TOU and FIT rates [5].
Energy Rate Period
Peak (9.00–22.00)Off-Peak (22.00–9.00)
Time-of-Use (TOU)0.1855 USD/kWh0.0843 USD/kWh
Feed-in-Tariff (FIT)0.0574 USD/kWh
Table 2. The parameters of the aggregator and prosumer agents.
AgentNetworksParameters
Learning
Rate
Activate Function
(Hidden, Output)
Number of Hidden Layers
(Number of Neurons)
AggregatorActor0.001ReLU, Sigmoid2 (512, 512)
Critic0.01
ProsumerActor0.001ReLU, Tanh
Critic0.01
Table 3. The parameters of the training and testing procedure.
ProcedureParameters
EpisodeDecay RateDiscount FactorSoft Update FactorBatch
Size
  Battery   Scaling   Factor   ( γ 1 , γ 2 )   SoC   Penalty   Scaling   Factor   ( β 1 , β 2 )   PC   Penalty   Scaling   Factor   ( α )
Training15000.00050.90.0055120.20.0021
Testing1000-------
Table 4. The mean of the net power consumption for the without EV case, Case I, and Case II.
Case StudyThe Mean of the Positive Net Power (kW)Decrease (%) Compared with the Power without EVDecrease (%) Compared with the Power from Case I
Without EV6.152-33.56
Case I9.260−50.52-
Case II
(proposed)
5.5969.0439.57
Table 5. The mean and standard deviation of each objective function of the aggregator.
Case StudyRevenue/Cost (USD/Day)
Energy Trading
with the Grid
BESS DegradationEnergy Trading
with Prosumers
Net
MeanStdMeanStdMeanStdMeanStd
Case I7.6101.4092.6991.375−8.7451.5351.5641.192
Case II
(proposed)
7.1601.5374.8861.863−12.1112.262−0.0651.770
Table 6. The mean and standard deviation of the net cost of each prosumer.
Case StudyNet Cost (USD/day)
Prosumer1Prosumer2Prosumer3Prosumer4
MeanStdMeanStdMeanStdMeanStd
Case I3.4581.2094.7320.9756.5651.1687.3901.706
Case II (proposed)3.0980.9154.6531.1456.3251.5545.5741.313
Decreased (%)10.41%-1.67%-3.66%-24.57%-
Disclaimer/Publisher’s Note: The statements, opinions and data contained in all publications are solely those of the individual author(s) and contributor(s) and not of MDPI and/or the editor(s). MDPI and/or the editor(s) disclaim responsibility for any injury to people or property resulting from any ideas, methods, instructions or products referred to in the content.