Pilot Scheme Conceptual Analysis of Rooftop East–West-Oriented Solar Energy System with Optimizer
Abstract
:1. Introduction
- 1.
- A new implementation approach including an optimizer-supported real solar energy system with east–west orientation is analyzed on a monthly basis, and comparison between the east–west orientation and the south orientation is presented in an attempt to decide ideal placement.
- 2.
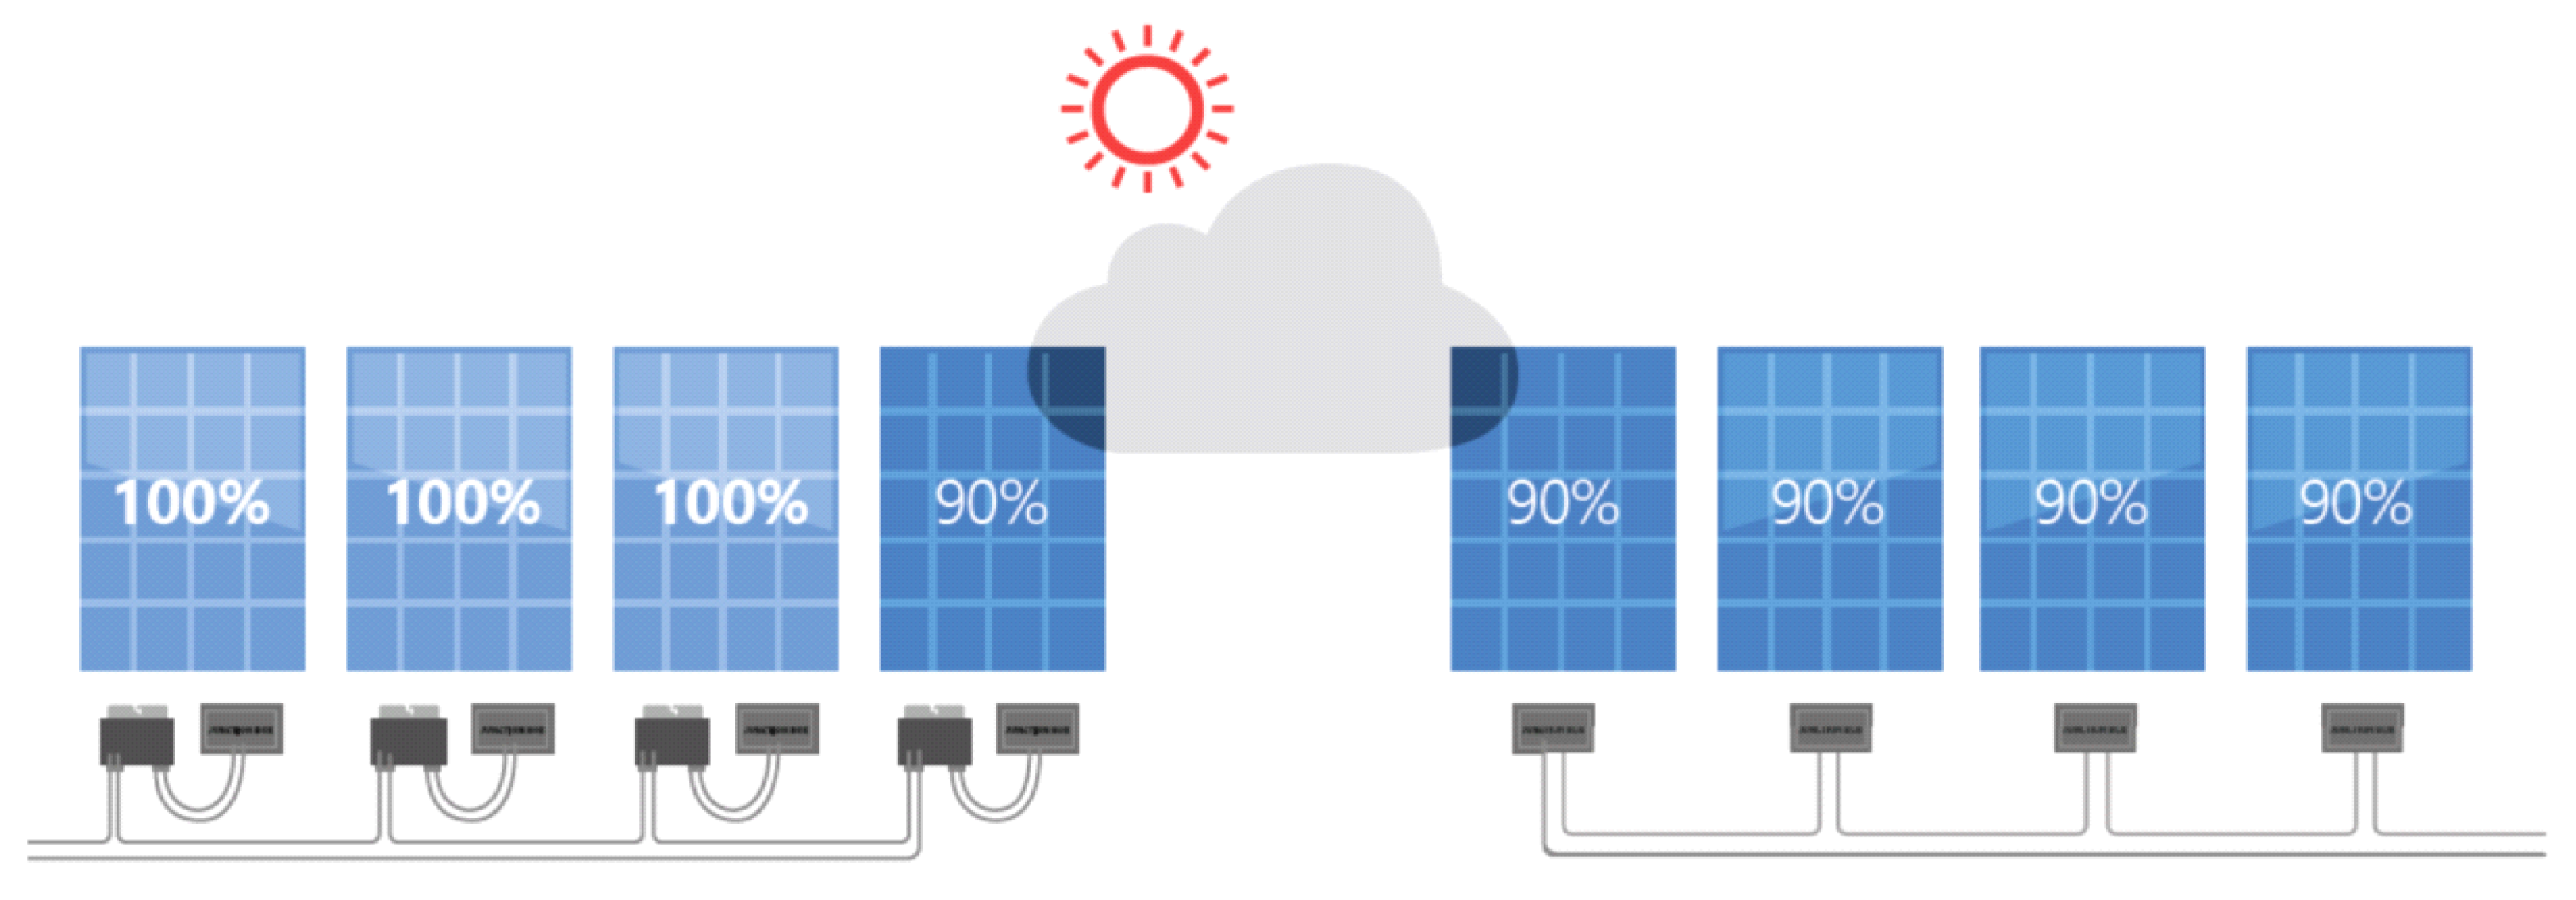
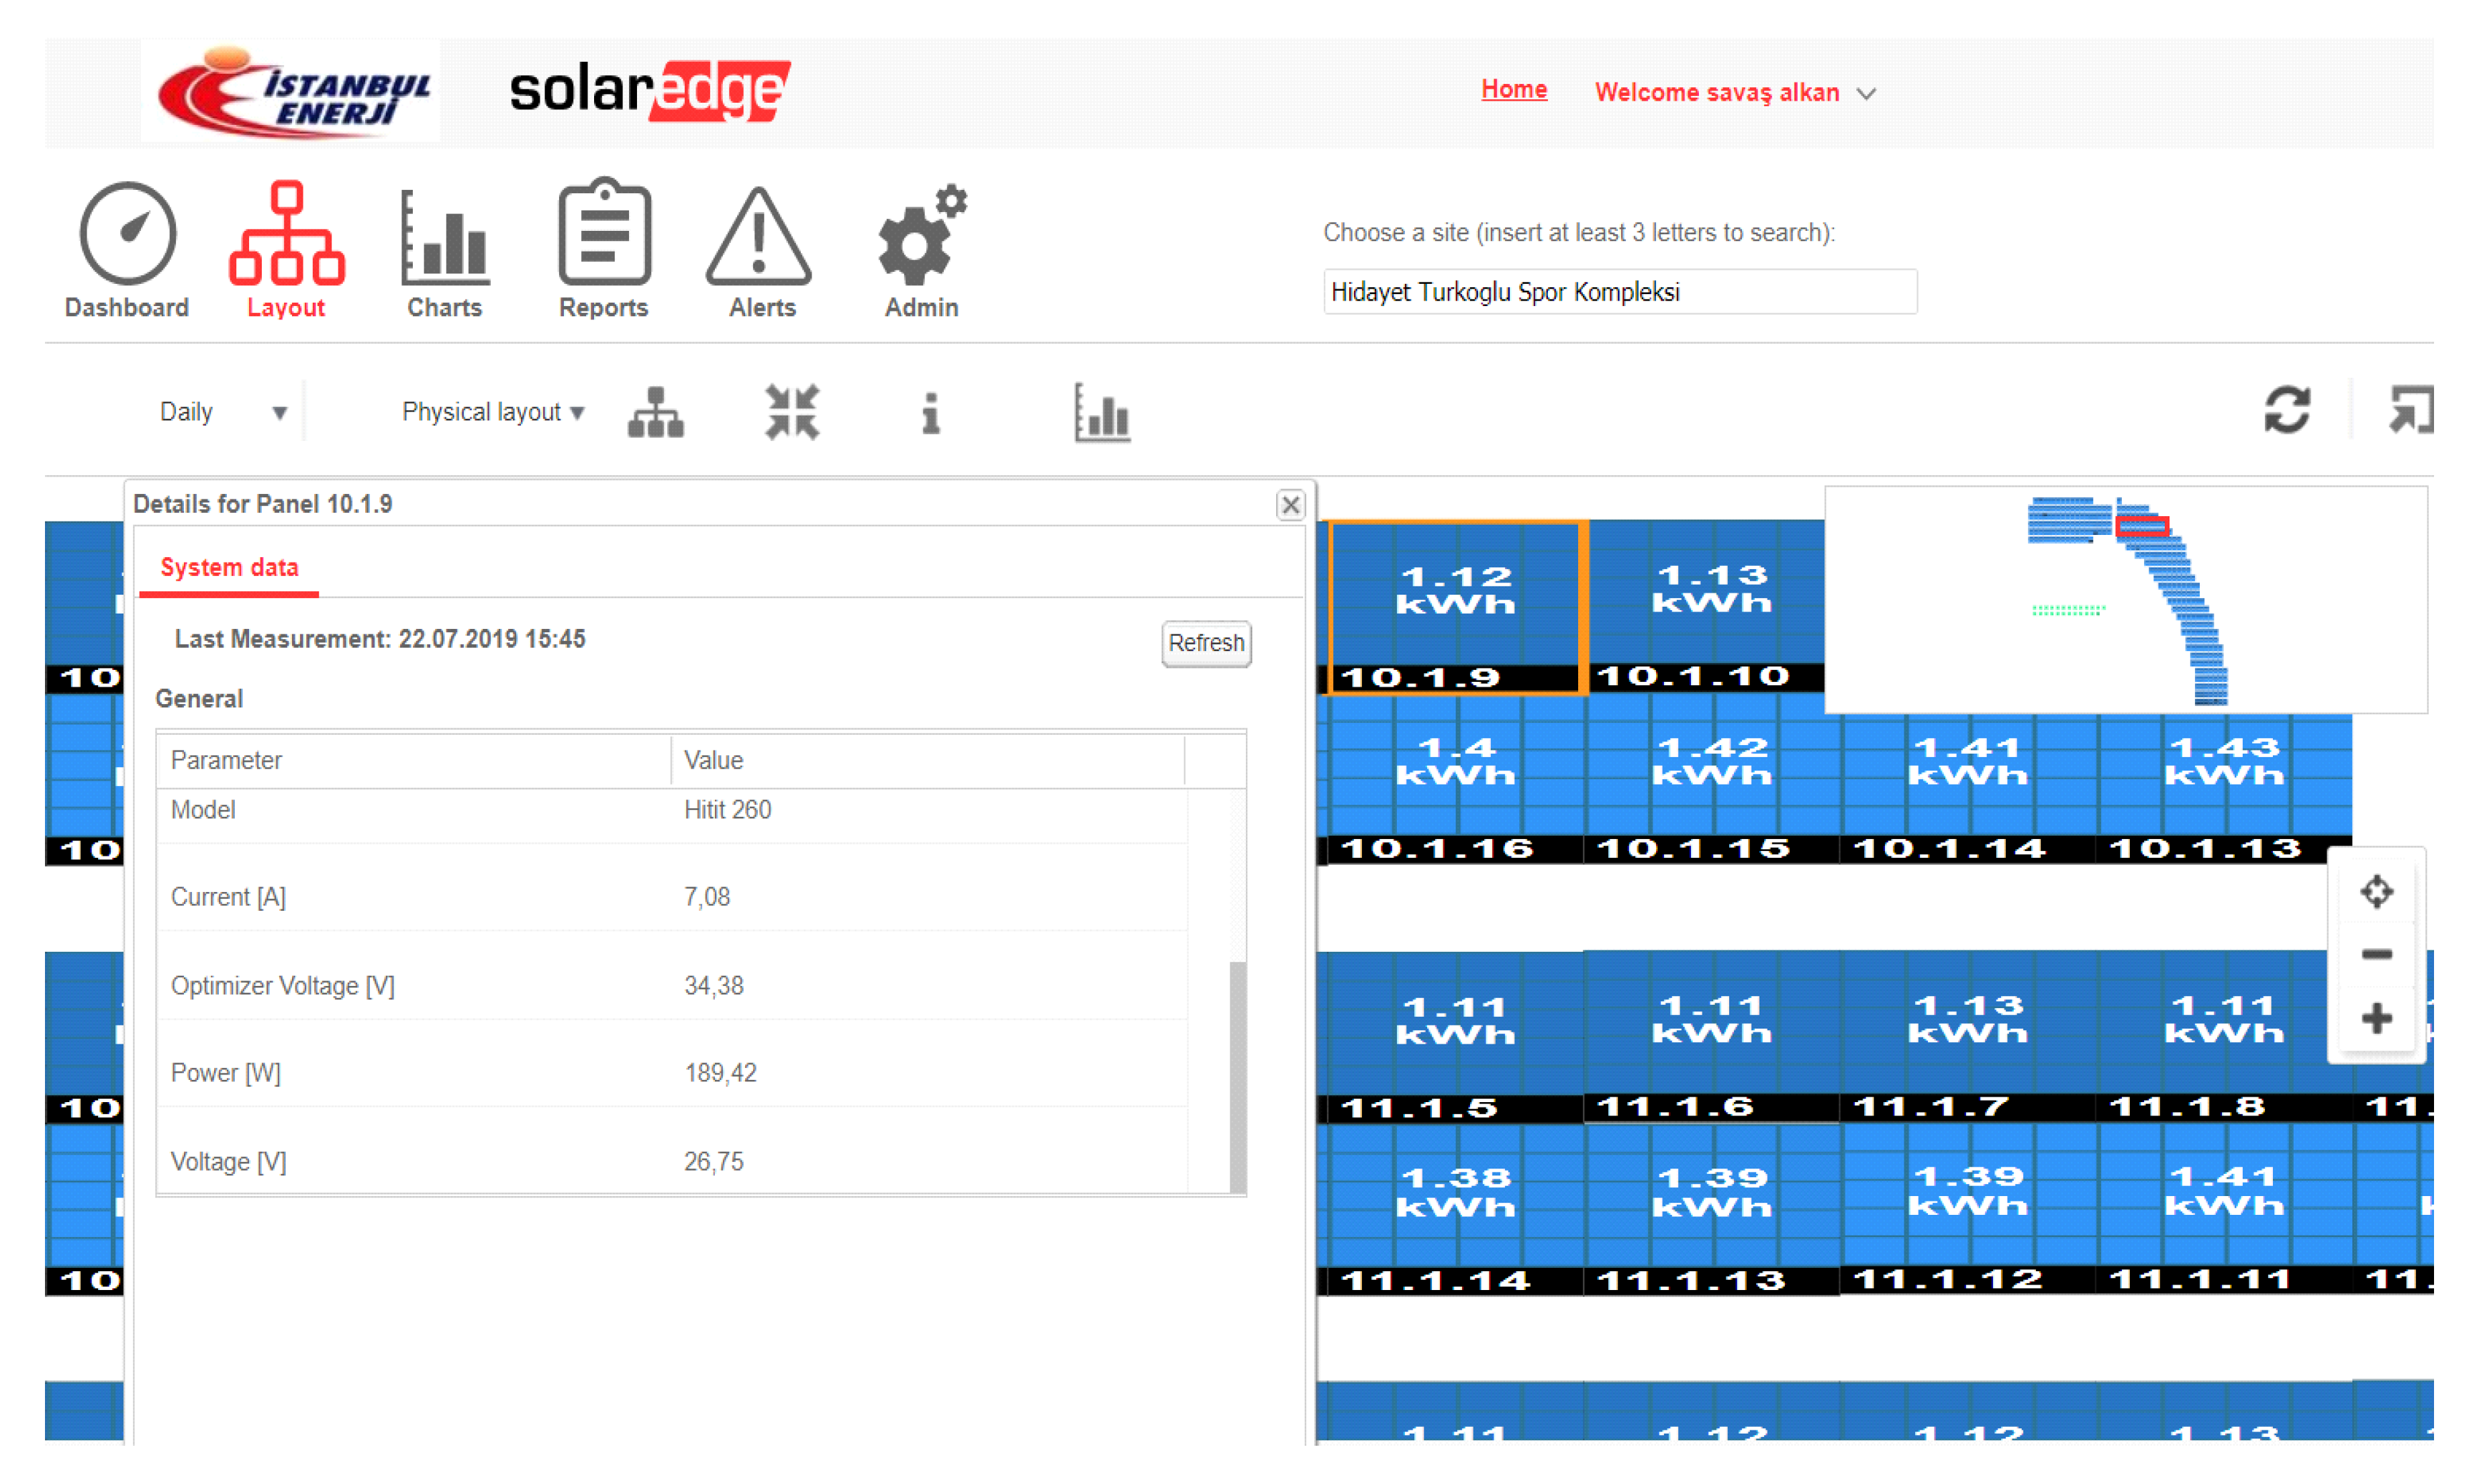
- Efficient management of a solar system is crucial for maximizing the utilization of solar irradiation. However, in the case of uncertain solar generation or maintenance issues, all strings may be affected, leading to a system-wide outage. To address this challenge, a multi-functional optimizer, which enables real-time monitoring of the system status and provides maximum operational efficiency, is integrated with each panel.
- 3.
- The robustness of the presented experimental approach is tested by simulating different angle configurations using PVSOL and PVGIS software, and a comparative analysis of the pros/cons of east–west and south orientation is conducted to determine the ideal investment.
2. Methodology
2.1. General Structure of the System
- -
- Solar panel: 650 polycrystalline solar panels with 260 Wp power,
- -
- Inverter: 25 3-phase solar inverters with 8 kW power,
- -
- Optimizer: 650 optimizers for panel-based monitoring and panel-based maximum power tracking,
- -
- Switchboards and switchgear: DC collection panel for solar panel input and output connections, panel for AC output and grounding,
- -
- Carrier construction and stabilizing ballast concrete: carrier system with strength and properties suitable for solar panel system,
- -
- Cables: PV cables and power cables,
- -
- Connector: MC4 connector,
- -
- Solar radiation: sensor to detect solar radiation (pyranometer),
- -
- Temperature measurement: ambient and module temperature sensors,
- -
- Wind measurement: wind detection sensor (anemometer),
- -
- Data storage and remote access system: remote monitoring software, data recording and installation,
- -
- Information display (Kiosk): 23″ inch screen and PC module.
2.1.1. 260 Wp Photovoltaic Solar Panel
2.1.2. Optimizer
2.1.3. Inverter
2.2. System Design
2.2.1. Location of the Complex
2.2.2. Information on the Sports Complex
2.2.3. Compatibility of the Material Used with the System Designed for the Complex
2.3. Using Simulation Programs
2.3.1. PVSOL
2.3.2. PVGIS
2.3.3. Meteonorm
2.3.4. Sketch-Up
3. Testing and Results
3.1. Simulation of 169 kWp 11° East–West Oriented Solar Power Plant
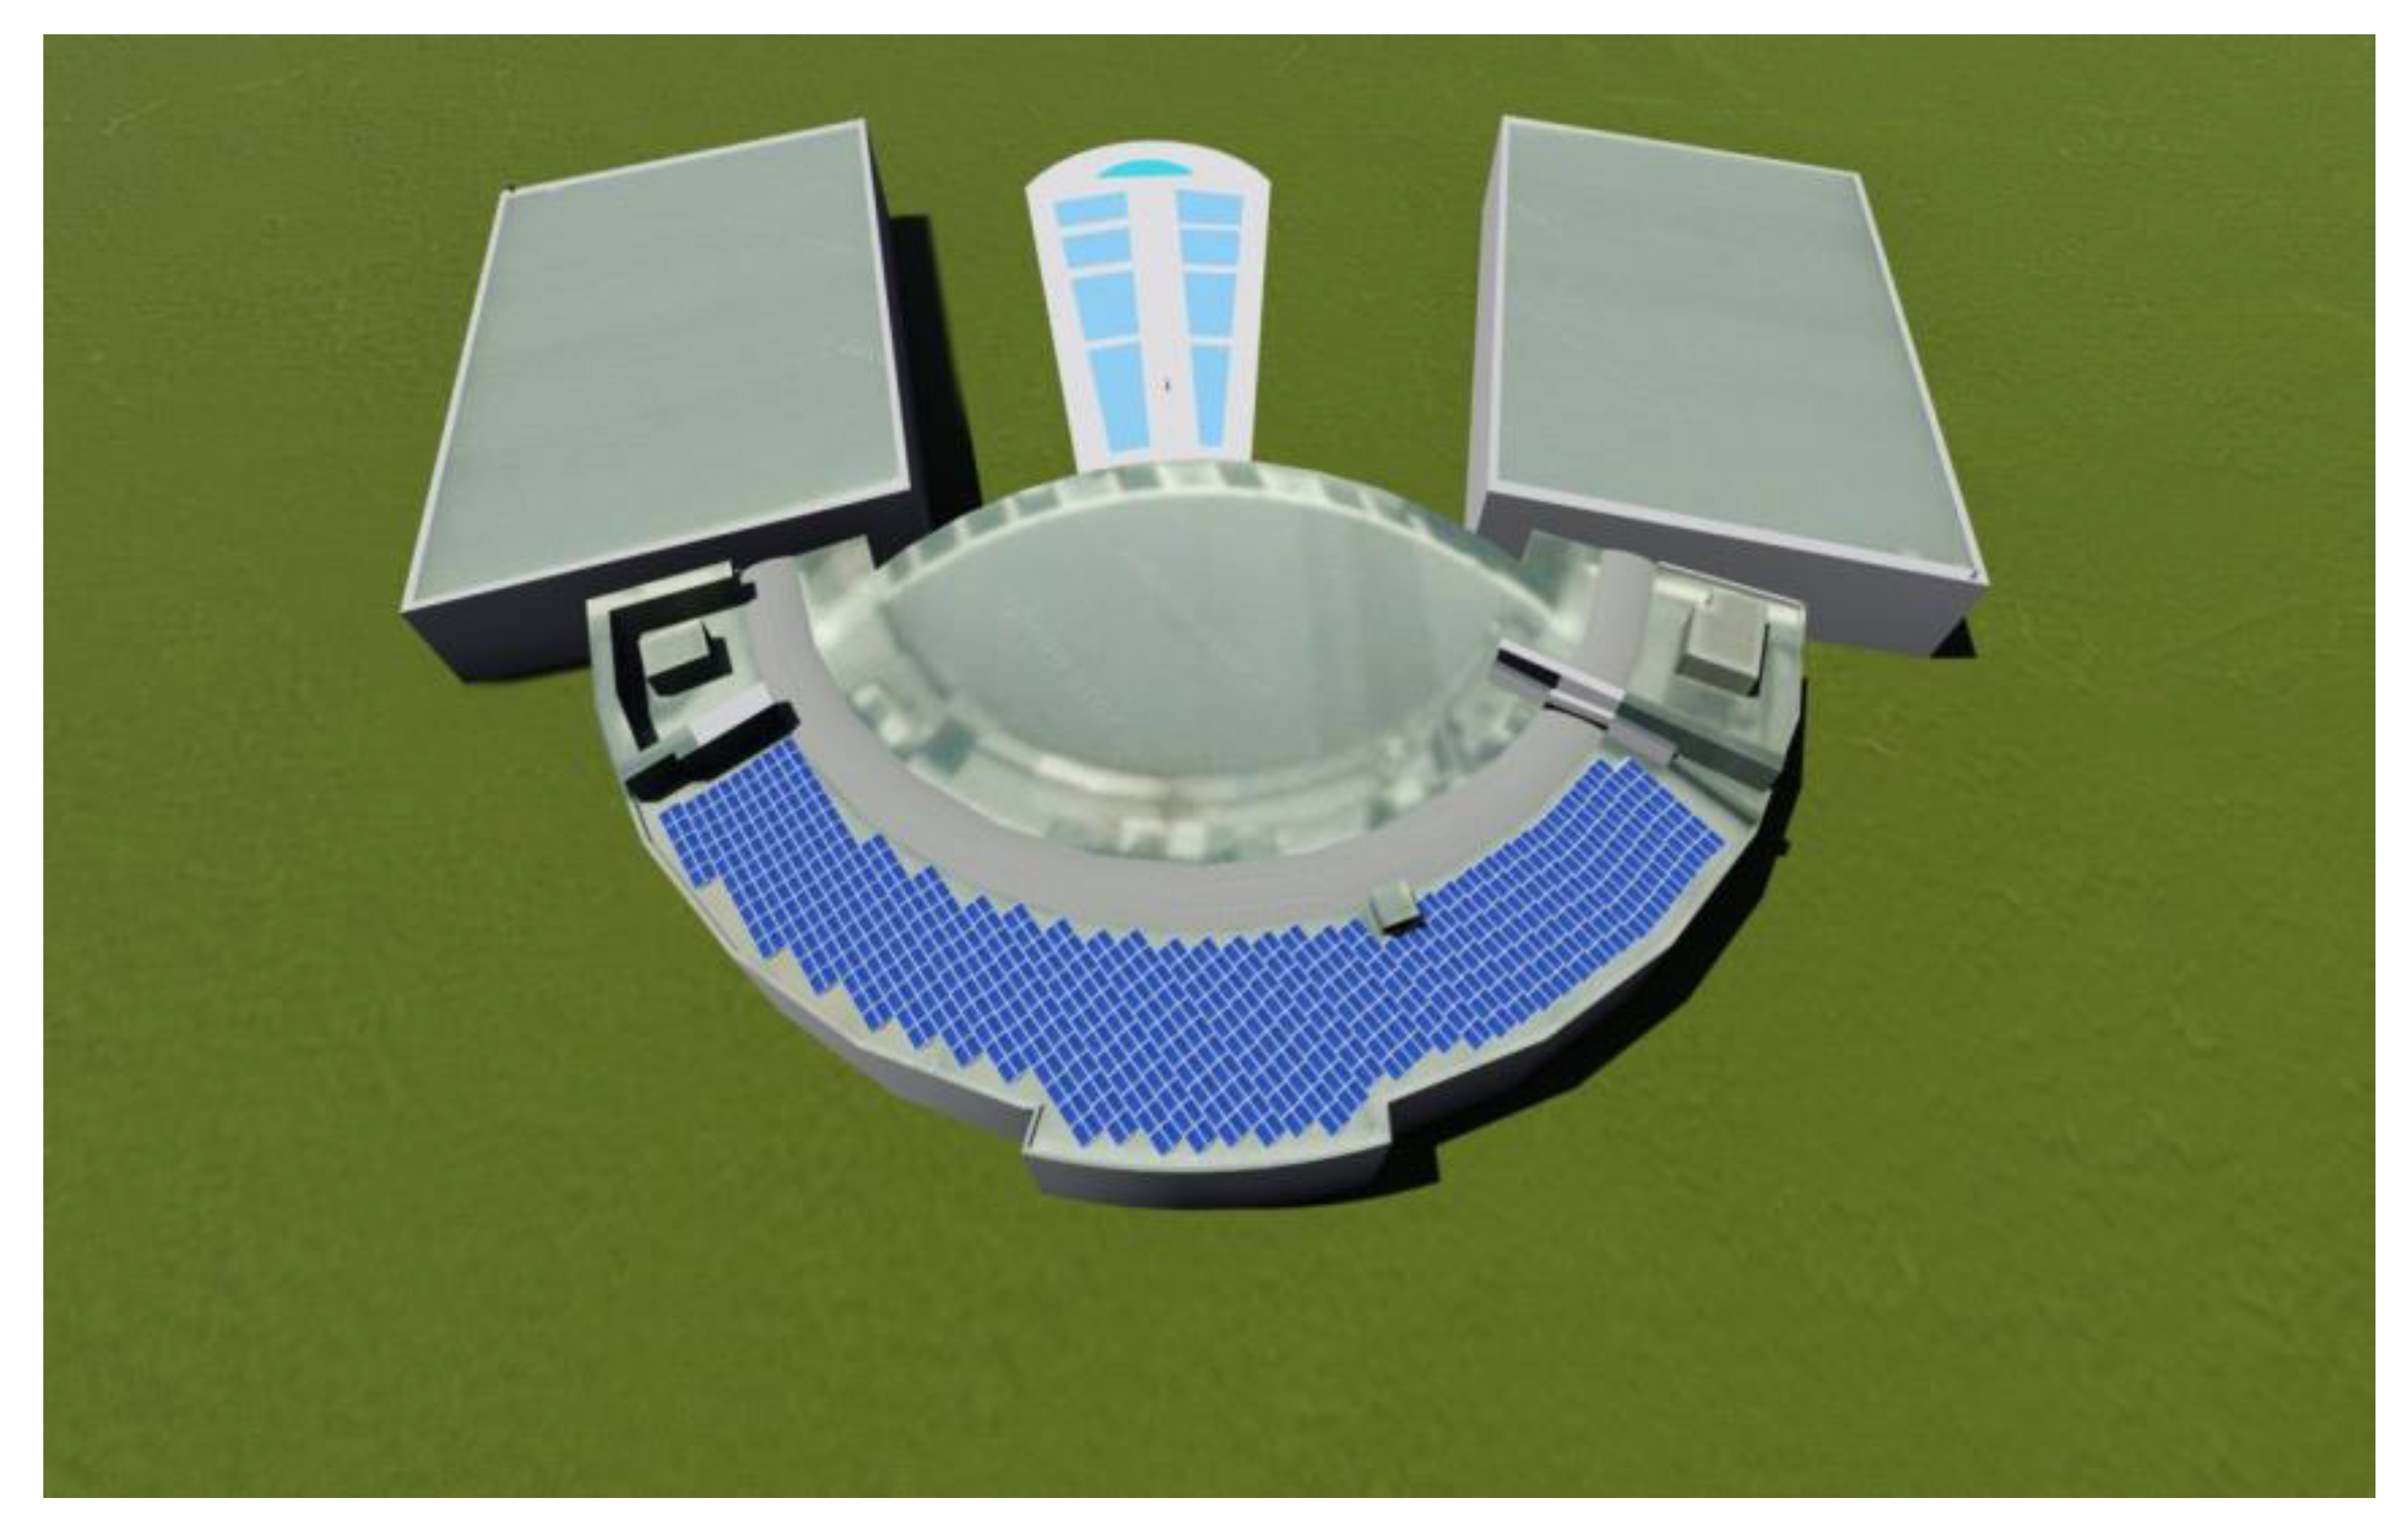
3.2. Simulation of 169 kWp 30° South-Oriented Solar Power Plant
3.3. Comparison of 169 kWp 11° East–West Orientation System and 169 kWp 30° South Orientation System
3.4. Comparison of 169 kWp 11° East–West-Oriented System and 110.5 kWp 30° South-Oriented System That Can Be Installed on the Existing Roof Area
3.5. Implementation of the East–West-Oriented Photovoltaic System
3.5.1. Analysis of Simulation and Real-Time Production Data of 169 kWp 11° East–West-Oriented Solar Power Plant on Annual Basis
3.5.2. Panel-Based Analysis of Real-Time Production Data
- Advantages:
- -
- There is 35% more installed power installed in the same unit area.
- -
- There is 40% more electricity generated in the first year.
- -
- There is longer and better matching with the load profile during the day.
- -
- More carbon emissions are prevented and more contribution is made to nature.
- -
- When the investment return period is completed, 47% more annual return is obtained.
- -
- When system costs decrease or electricity unit prices increase with the developing technology, the return on investment period will be shorter than the south-oriented installation in the same area.
- -
- In the summer months when the sunshine duration is high, it generates more energy than the south-oriented installation of the same power.
- Disadvantages:
- -
- Initial investment costs are high.
- -
- Investment return period is longer.
4. Discussion
5. Conclusions
Author Contributions
Funding
Data Availability Statement
Acknowledgments
Conflicts of Interest
References
- Muneer, T.; Gul, M.S.; Alam, M. Modelling of a Large Solar PV Facility: England’s Mallard Solar Farm Case Study. Energies 2022, 15, 8609. [Google Scholar] [CrossRef]
- Diniz, F.L.J.; Vital, C.V.P.; Gómez-Malagón, L.A. Parametric analysis of energy and exergy efficiencies of a hybrid PV/T system containing metallic nanofluids. Renew. Energy 2022, 186, 51–65. [Google Scholar] [CrossRef]
- Shah, R.; Mithulananthan, N.; Bansal, R.; Ramachandaramurthy, V. A review of key power system stability challenges for large-scale PV integration. Renew. Sustain. Energy Rev. 2015, 41, 1423–1436. [Google Scholar] [CrossRef]
- Park, C.-Y.; Hong, S.-H.; Lim, S.-C.; Song, B.-S.; Park, S.-W.; Huh, J.-H.; Kim, J.-C. Inverter Efficiency Analysis Model Based on Solar Power Estimation Using Solar Radiation. Processes 2020, 8, 1225. [Google Scholar] [CrossRef]
- Ko, J.-S.; Huh, J.-H.; Kim, J.-C. Overview of Maximum Power Point Tracking Methods for PV System in Micro Grid. Electronics 2020, 9, 816. [Google Scholar] [CrossRef]
- Energy Prosumers in Europe. Citizen Participation in the Energy Transition. EEA Report No 1/2022. Available online: https://www.eea.europa.eu/publications/the-role-of-prosumers-of (accessed on 1 October 2022).
- Mark, L.; Legget, W.; Ball, A. The implication for climate change and peak fossil fuel of the continuation of the current trend in wind and solar energy production. Energy Policies 2022, 41, 610–617. [Google Scholar] [CrossRef]
- Hamidpour, H.; Aghaei, J.; Pirouzi, S.; Dehghan, S.; Niknam, T. Flexible, reliable, and renewable power system resource expansion planning considering energy storage systems and demand response programs. IET Renew. Power Gener. 2019, 13, 1862–1872. [Google Scholar] [CrossRef]
- Zhuo, Z.; Zhang, N.; Yang, J.; Kang, C.; Smith, C.; O’Malley, M.J.; Kroposki, B. Transmission Expansion Planning Test System for AC/DC Hybrid Grid With High Variable Renewable Energy Penetration. IEEE Trans. Power Syst. 2019, 35, 2597–2608. [Google Scholar] [CrossRef]
- Havrlík, M.; Libra, M.; Poulek, V.; Kouřím, P. Analysis of Output Signal Distortion of Galvanic Isolation Circuits for Monitoring the Mains Voltage Waveform. Sensors 2022, 22, 7769. [Google Scholar] [CrossRef]
- Diahovchenko, I.; Petrichenko, L. Comparative Analysis of Power Distribution Systems with Individual Prosumers Owing Photovoltaic Installations and Solar Energy Communities in Terms of Profitability and Hosting Capacity. Energies 2022, 15, 8837. [Google Scholar] [CrossRef]
- Agathokleous, R.A.; Kalogirou, S.A. PV roofs as the first step towards 100% RES electricity production for Mediterranean islands: The case of Cyprus. Smart Energy 2021, 4, 100053. [Google Scholar] [CrossRef]
- Ceran, B.; Jurasz, J.; Mielcarek, A.; Campana, P.E. PV systems integrated with commercial buildings for local and national peak load shaving in Poland. J. Clean. Prod. 2021, 322, 129076. [Google Scholar] [CrossRef]
- Ota, Y.; Araki, K.; Nagaoka, A.; Nishioka, K. Facilitating vehicle-integrated photovoltaics by considering the radius of curvature of the roof surface for solar cell coverage. Clean. Eng. Technol. 2022, 7, 100446. [Google Scholar] [CrossRef]
- Polo, J.; Martín-Chivelet, N.; Sanz-Saiz, C.; Alonso-Montesinos, J.; López, G.; Alonso-Abella, M.; Battles, F.J.; Marzo, A.; Hanrieder, N. Modeling soiling losses for rooftop PV systems in suburban areas with nearby forest in Madrid. Renew. Energy 2021, 178, 420–428. [Google Scholar] [CrossRef]
- Libra, M.; Petrik, T.; Poulek, V.; Tyukhov, I.I.; Kourim, P. Changes in the Efficiency of Photovoltaic Energy Conversion in Temperature Range with Extreme Limits. IEEE J. Photovolt. 2021, 11, 1479–1484. [Google Scholar] [CrossRef]
- Feng, C.; Zheng, H.; Wang, R.; Yu, X.; Su, Y. A novel solar multifunctional PV/T/D system for green building roofs. Energy Convers. Manag. 2015, 93, 63–71. [Google Scholar] [CrossRef]
- Jahanfar, A.; Drake, J.; Gharabaghi, B.; Sleep, B. An experimental and modeling study of evapotranspiration from integrated green roof photovoltaic systems. Ecol. Eng. 2020, 152, 105767. [Google Scholar] [CrossRef]
- Anang, N.; Azman, S.S.N.; Muda, W.; Dagang, A.; Daud, M.Z. Performance analysis of a grid-connected rooftop solar PV system in Kuala Terengganu, Malaysia. Energy Build. 2021, 248, 111182. [Google Scholar] [CrossRef]
- Lammert, G.; Premm, D.; Ospina, L.D.P.; Boemer, J.C.; Braun, M.; van Cutsem, T. Control of Photovoltaic Systems for Enhanced Short-Term Voltage Stability and Recovery. IEEE Trans. Energy Convers. 2019, 34, 243–254. [Google Scholar] [CrossRef] [Green Version]
- Dolara, A.; Leva, S.; Manzolini, G.; Simonetti, R.; Trattenero, I. Outdoor Performance of Organic Photovoltaics: Comparative Analysis. Energies 2022, 15, 1620. [Google Scholar] [CrossRef]
- Sankar, A.; Kalathil, A. Qualitative validation of empirically observed higher generation in East-West orientated PV arrays over conventional South orientation. In Proceedings of the 2014 IEEE Region 10 Humanitarian Technology Conference (R10 HTC), Chennai, India, 6–9 August 2014; pp. 25–28. [Google Scholar] [CrossRef]
- Etukudor, C.; Orovwode, H.; Wara, S.; Agbetuyi, F.; Adozhe, A.; Obieje, B.O.; Oparaocha, C.N. Optimum Tilt and Azimuth Angles for Solar Photovoltaic Systems in South-West Nigeria. In Proceedings of the 2018 IEEE PES/IAS PowerAfrica, Cape Town, South Africa, 28–29 June 2018; pp. 348–353. [Google Scholar] [CrossRef]
- Chowdhury, S.; Al-Amin, M.; Ahmad, M. Performance variation of Building integrated photovoltaic application with tilt and azimuth angle in Bangladesh. In Proceedings of the 2012 7th International Conference on Electrical and Computer Engineering, Dhaka, Bangladesh, 20–22 December 2012; pp. 896–899. [Google Scholar] [CrossRef]
- Asgharzadeh, A.; Deline, C.; Stein, J.; Toor, F. A comparison study of the performance of south/north-facing vs east/west-facing bifacial modules under shading condition. In Proceedings of the 2018 IEEE 7th World Conference on Photovoltaic Energy Conversion (WCPEC) (A Joint Conference of 45th IEEE PVSC, 28th PVSEC & 34th EU PVSEC), Waikoloa, HI, USA, 10–15 June 2018; pp. 1730–1734. [Google Scholar] [CrossRef]
- Hwang, T.; Seokyoun, K.; Kim, J.T. Optimization Of The Building Integrated Photovoltaic System In Office Buildings-Focus On The Orientation, Inclined Angle And Installed Area. Energy Build. 2012, 46, 92–104. [Google Scholar] [CrossRef]
- Roxana, O.; Marcel, I.; Dragos, M.; Ravan, B. Experimental Evaluation of the Optimum Tilt Angle for Fixed Photovoltaic Modules. In Proceedings of the 2018 International Conference and Exposition on Electrical And Power Engineering (EPE), Iasi, Romania, 18–19 October 2018; pp. 0594–0598. [Google Scholar] [CrossRef]
- TUIK. 2019. Available online: http://tuik.gov.tr/PreTabloArama.do?metod=search&araType=hb_x (accessed on 8 May 2019).
- Environmental Protection Agency (EPA). Available online: https://www.epa.gov/energy/greenhouse-gases-equivalencies-calculator-calculations-and-references (accessed on 6 July 2019).








| 260 Wp Polycrystalline Solar Panel | |||
|---|---|---|---|
| Mechanical Properties | Electrical Properties | ||
| Cell type | Polycrystalline | Rated power | 260 W |
| Cell count | 6 × 10 | Max. power voltage | 30.51 V |
| Panel dimensions | 1640 × 992 × 40 mm3 | Max. power current | 8.53 A |
| Weight | 18.5 kg | Open circuit voltage | 34.3 V |
| Frame | Aluminum | Short circuit current | 9.09 A |
| Connection box | IP67 protection class | Power tolerance | 3% |
| Output cables | 1 m, MC4 compatible | Pmax temperature coefficient | −0.43 (°C) |
| Optimizer | |||
|---|---|---|---|
| Mechanical Properties | Electrical Properties | ||
| Size | 139 × 165 × 41 mm3 | DC input power | 300 W |
| Weight | 880 g | Maximum input voltage | 48 Vdc |
| Protection class | IP68 | Yield | 99.5% |
| Output cables | 1 m, MC4 compatible | Open circuit voltage | 1 Vdc |
| Technical Specifications | ||
|---|---|---|
| Input Data | Max. string short circuit current | 13.5 A |
| Nominal input voltage | 700 V | |
| Max. input voltage | 900 V | |
| MPP voltage range | 184–264.5 V | |
| Output Data | AC rated power | 8000 W |
| AC output current | 13 A | |
| Network | 400 V/230 V | |
| Frequency | 50 Hz/60 Hz | |
| First Reading | Last Reading of History | Date Active Consumption (kWh) | Unit Price (TL) | Invoice Amount (TRY) |
|---|---|---|---|---|
| 1 January 2021 | 31 January 2021 | 353,343 | 0.43 | 151,175.24 |
| 1 February 2021 | 29 February 2021 | 263,069 | 0.43 | 112,552.16 |
| 29 February 2021 | 31 March 2021 | 267,154 | 0.43 | 114,299.90 |
| 31 March 2021 | 30 April 2021 | 226,872 | 0.42 | 94,386.43 |
| 1 May 2021 | 31 May 2021 | 232,348 | 0.42 | 96,664.63 |
| 1 June 2021 | 30 June 2021 | 361,207 | 0.42 | 150,274.33 |
| 1 July 2021 | 31 July 2021 | 380,022 | 0.42 | 158,102.01 |
| 1 August 2021 | 31 August 2021 | 436,397 | 0.50 | 219,294.12 |
| 1 September 2021 | 30 September 2021 | 307,414 | 0.57 | 176,105.83 |
| 1 October 2021 | 31 October 2021 | 248,555 | 0.68 | 168,729.33 |
| 1 November 2021 | 30 November 2021 | 234,663 | 0.68 | 159,298.87 |
| 1 December 2021 | 31 December 2021 | 268,824 | 0.68 | 182,488.76 |
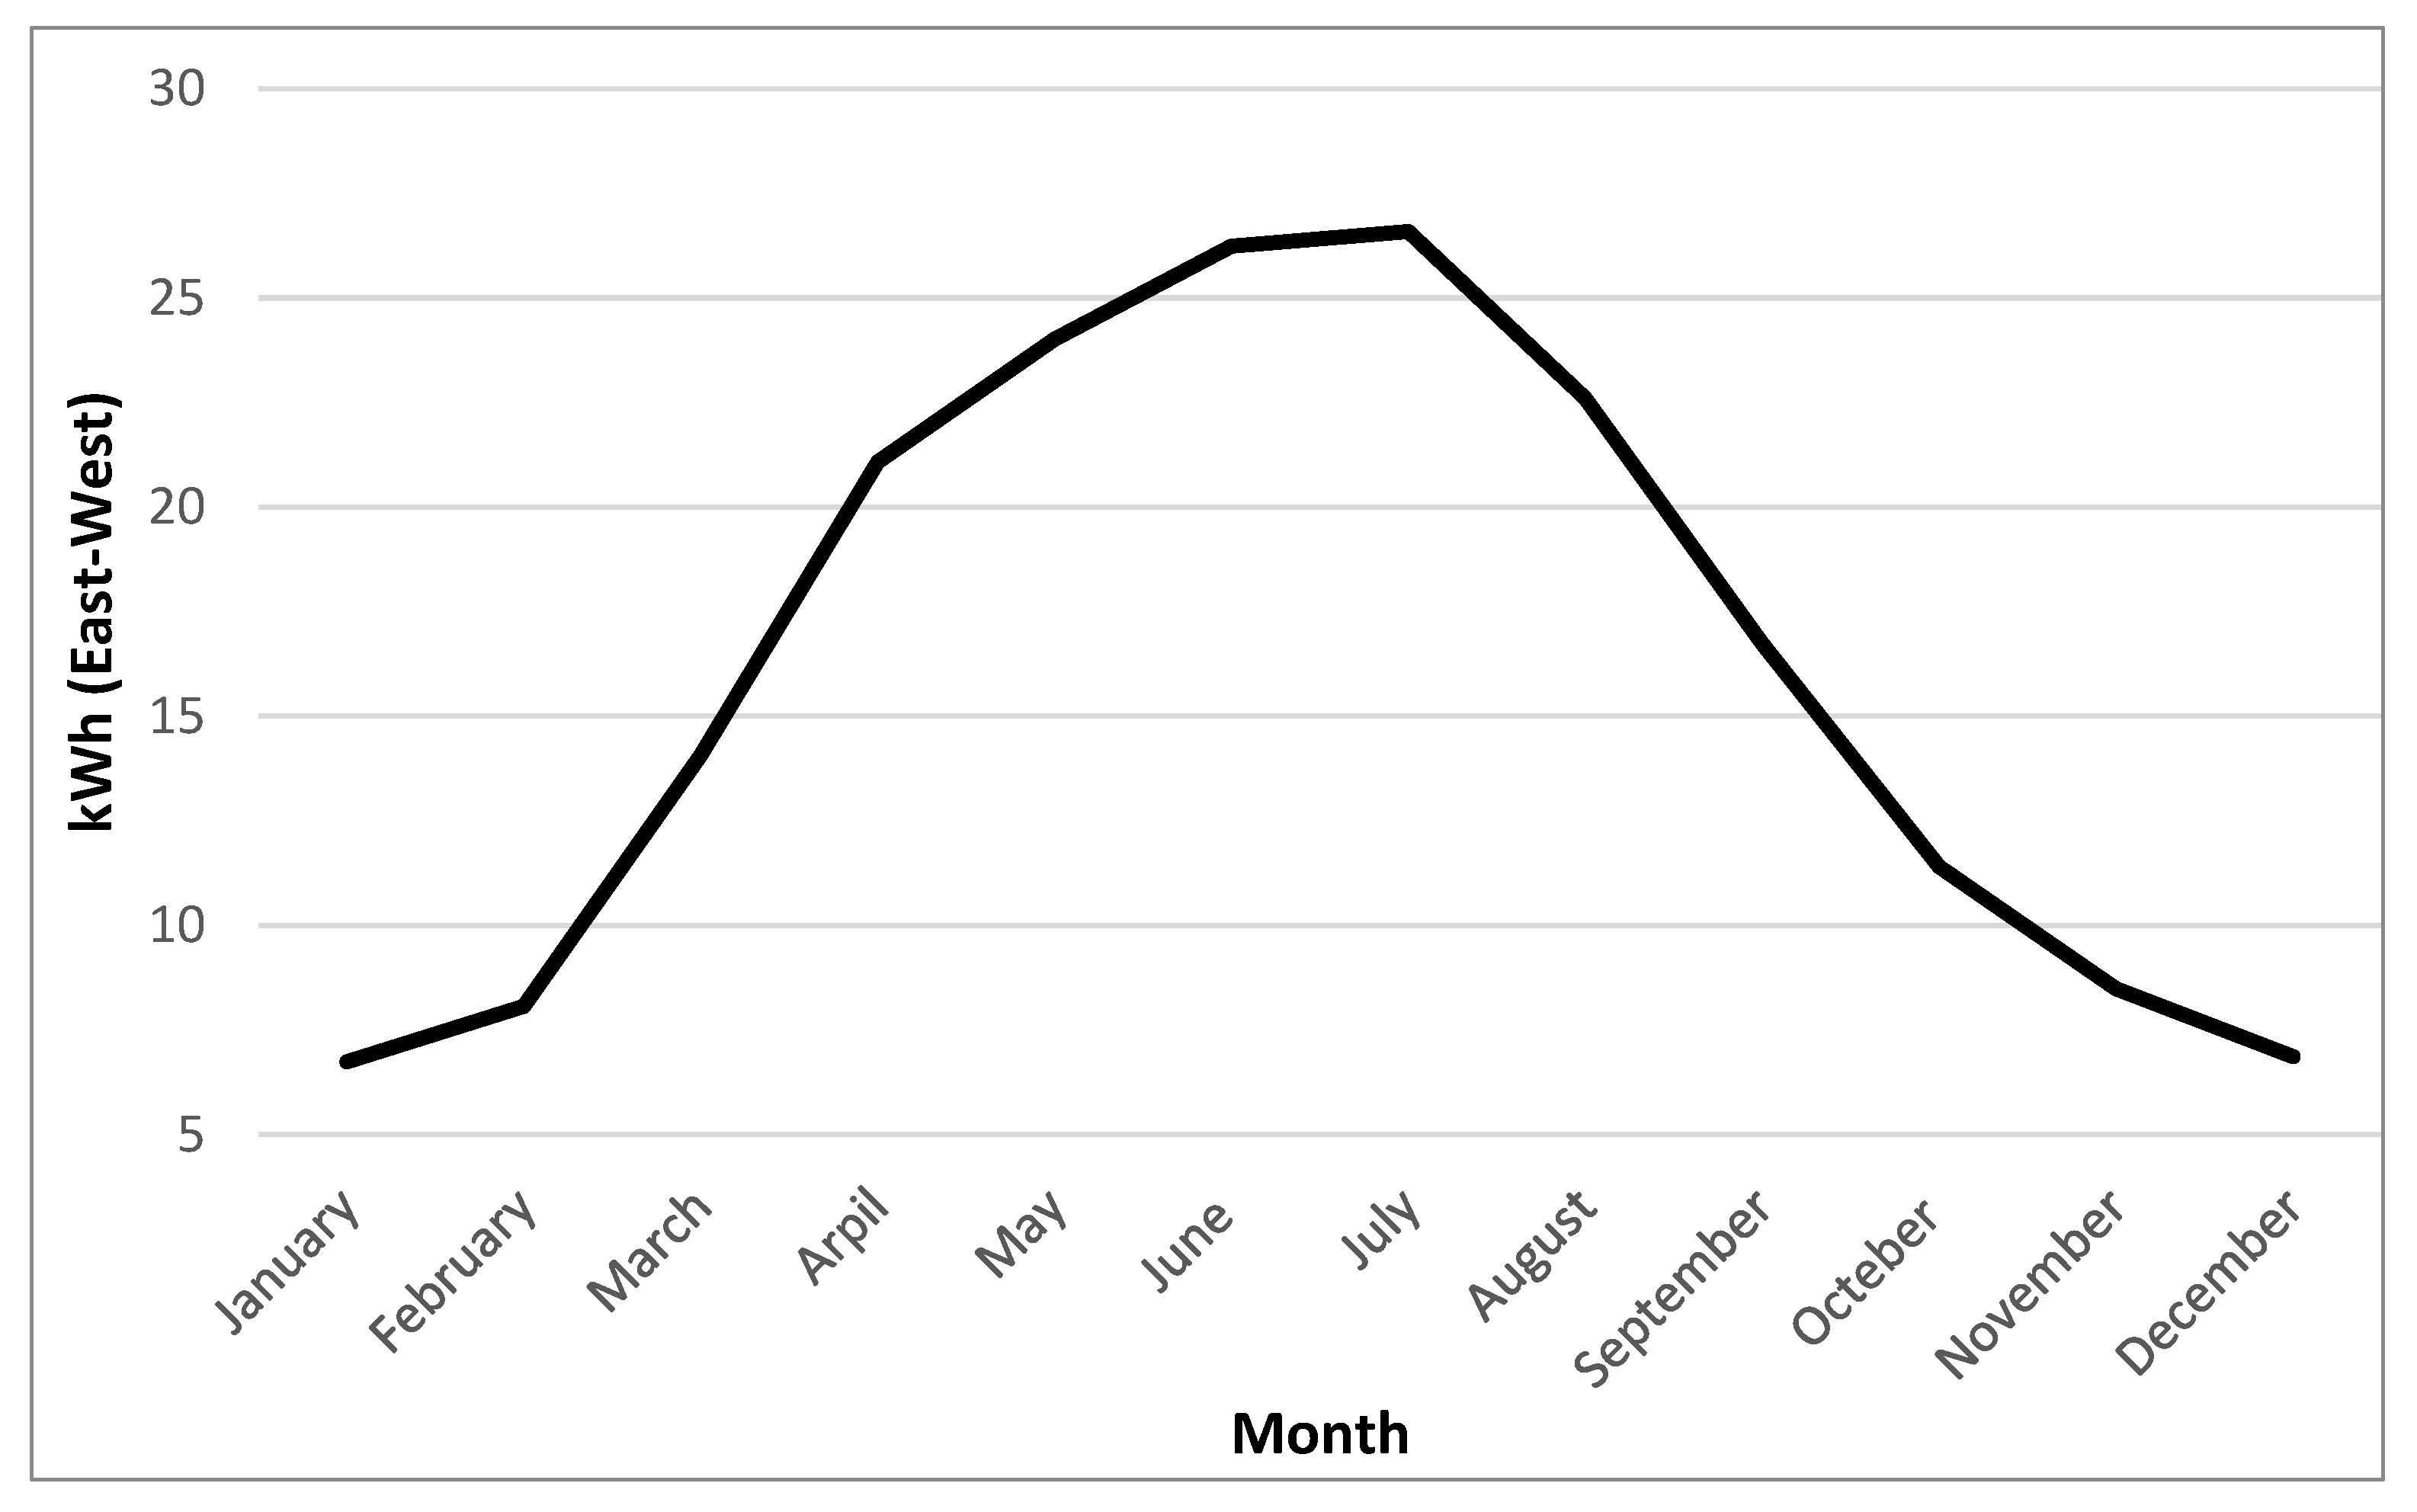
| Month | kWh (PVSOL) | kWh (PVGIS) |
|---|---|---|
| January | 6.74 | 6.54 |
| February | 8.07 | 8.58 |
| March | 14.06 | 14.72 |
| April | 21.08 | 20.5 |
| May | 24.02 | 25.5 |
| June | 26.24 | 26.8 |
| July | 26.59 | 28.9 |
| August | 22.6 | 25.6 |
| September | 16.73 | 18.18 |
| October | 11.4 | 11.94 |
| November | 8.49 | 7.87 |
| December | 6.86 | 5.58 |
| Total | 192.88 | 200.71 |
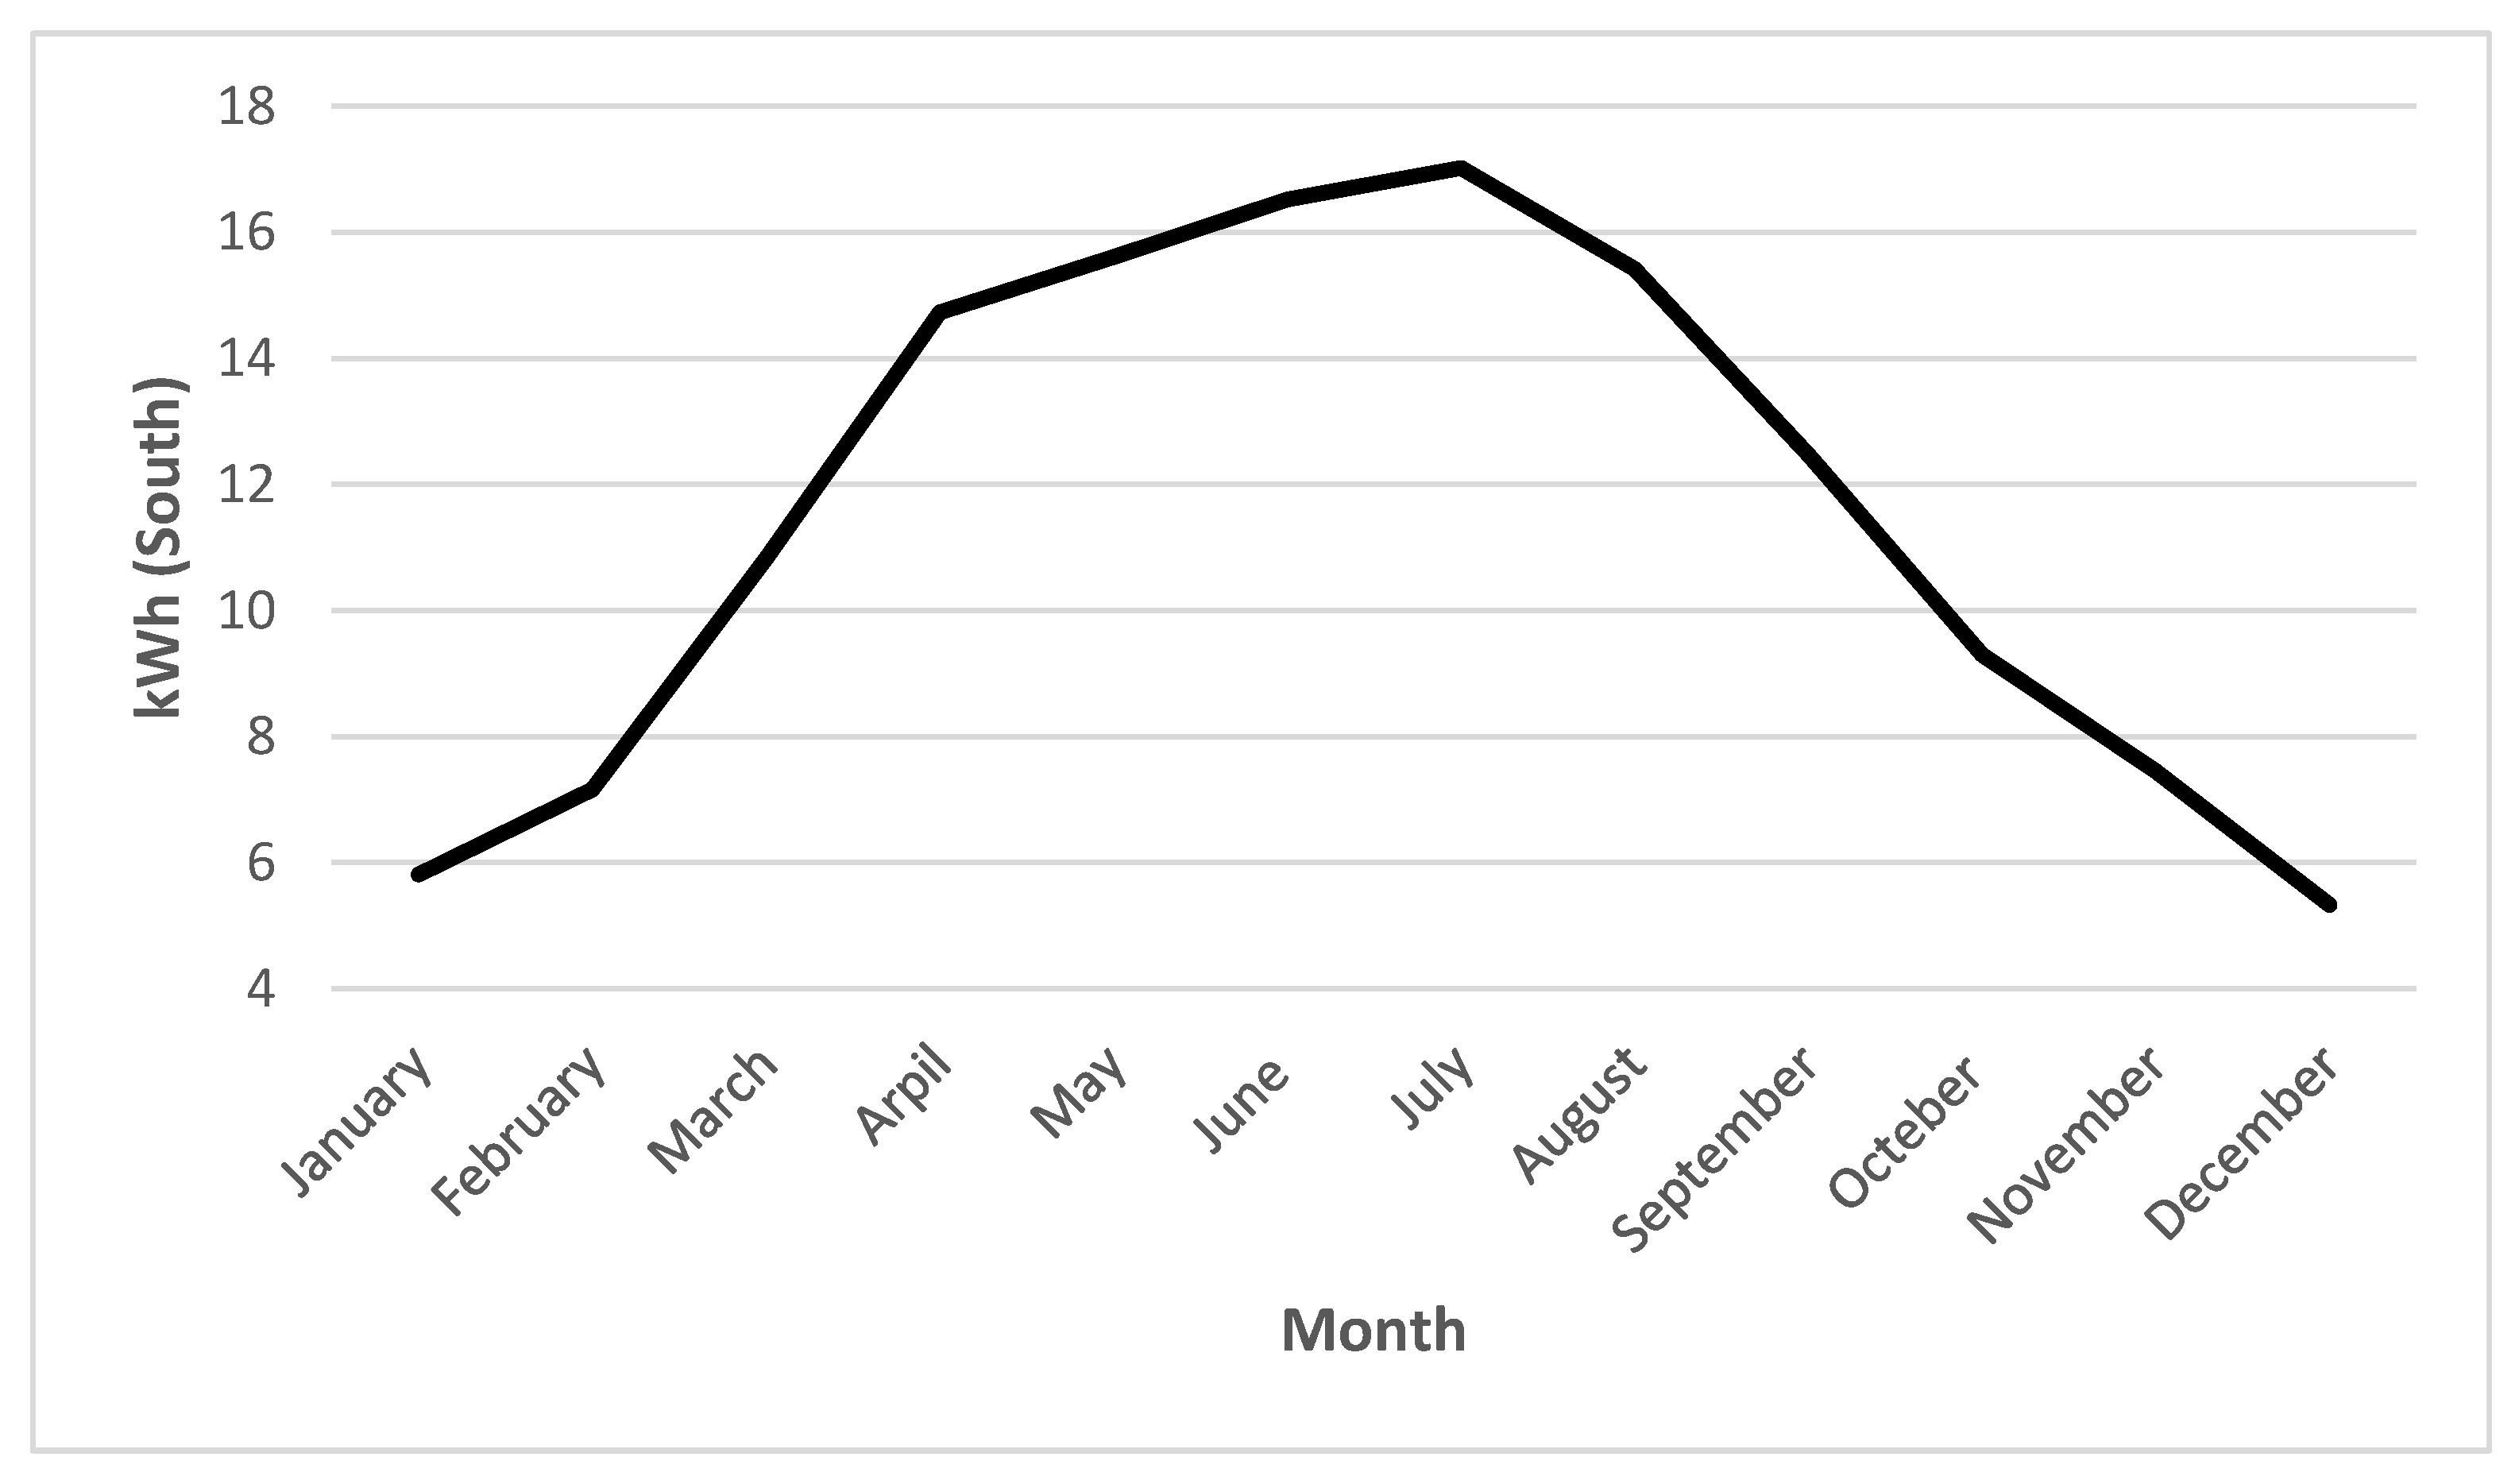
| Month | kWh (PVSOL) | kWh (PVGIS) |
|---|---|---|
| January | 5.81 | 6.62 |
| February | 7.16 | 7.61 |
| March | 10.83 | 11.6 |
| April | 14.73 | 14.5 |
| May | 15.61 | 16.6 |
| June | 16.52 | 16.7 |
| July | 17.02 | 18.3 |
| August | 15.42 | 17.7 |
| September | 12.47 | 14.1 |
| October | 9.30 | 10.5 |
| November | 7.45 | 8.04 |
| December | 5.33 | 5.99 |
| Total | 137.63 | 148.26 |
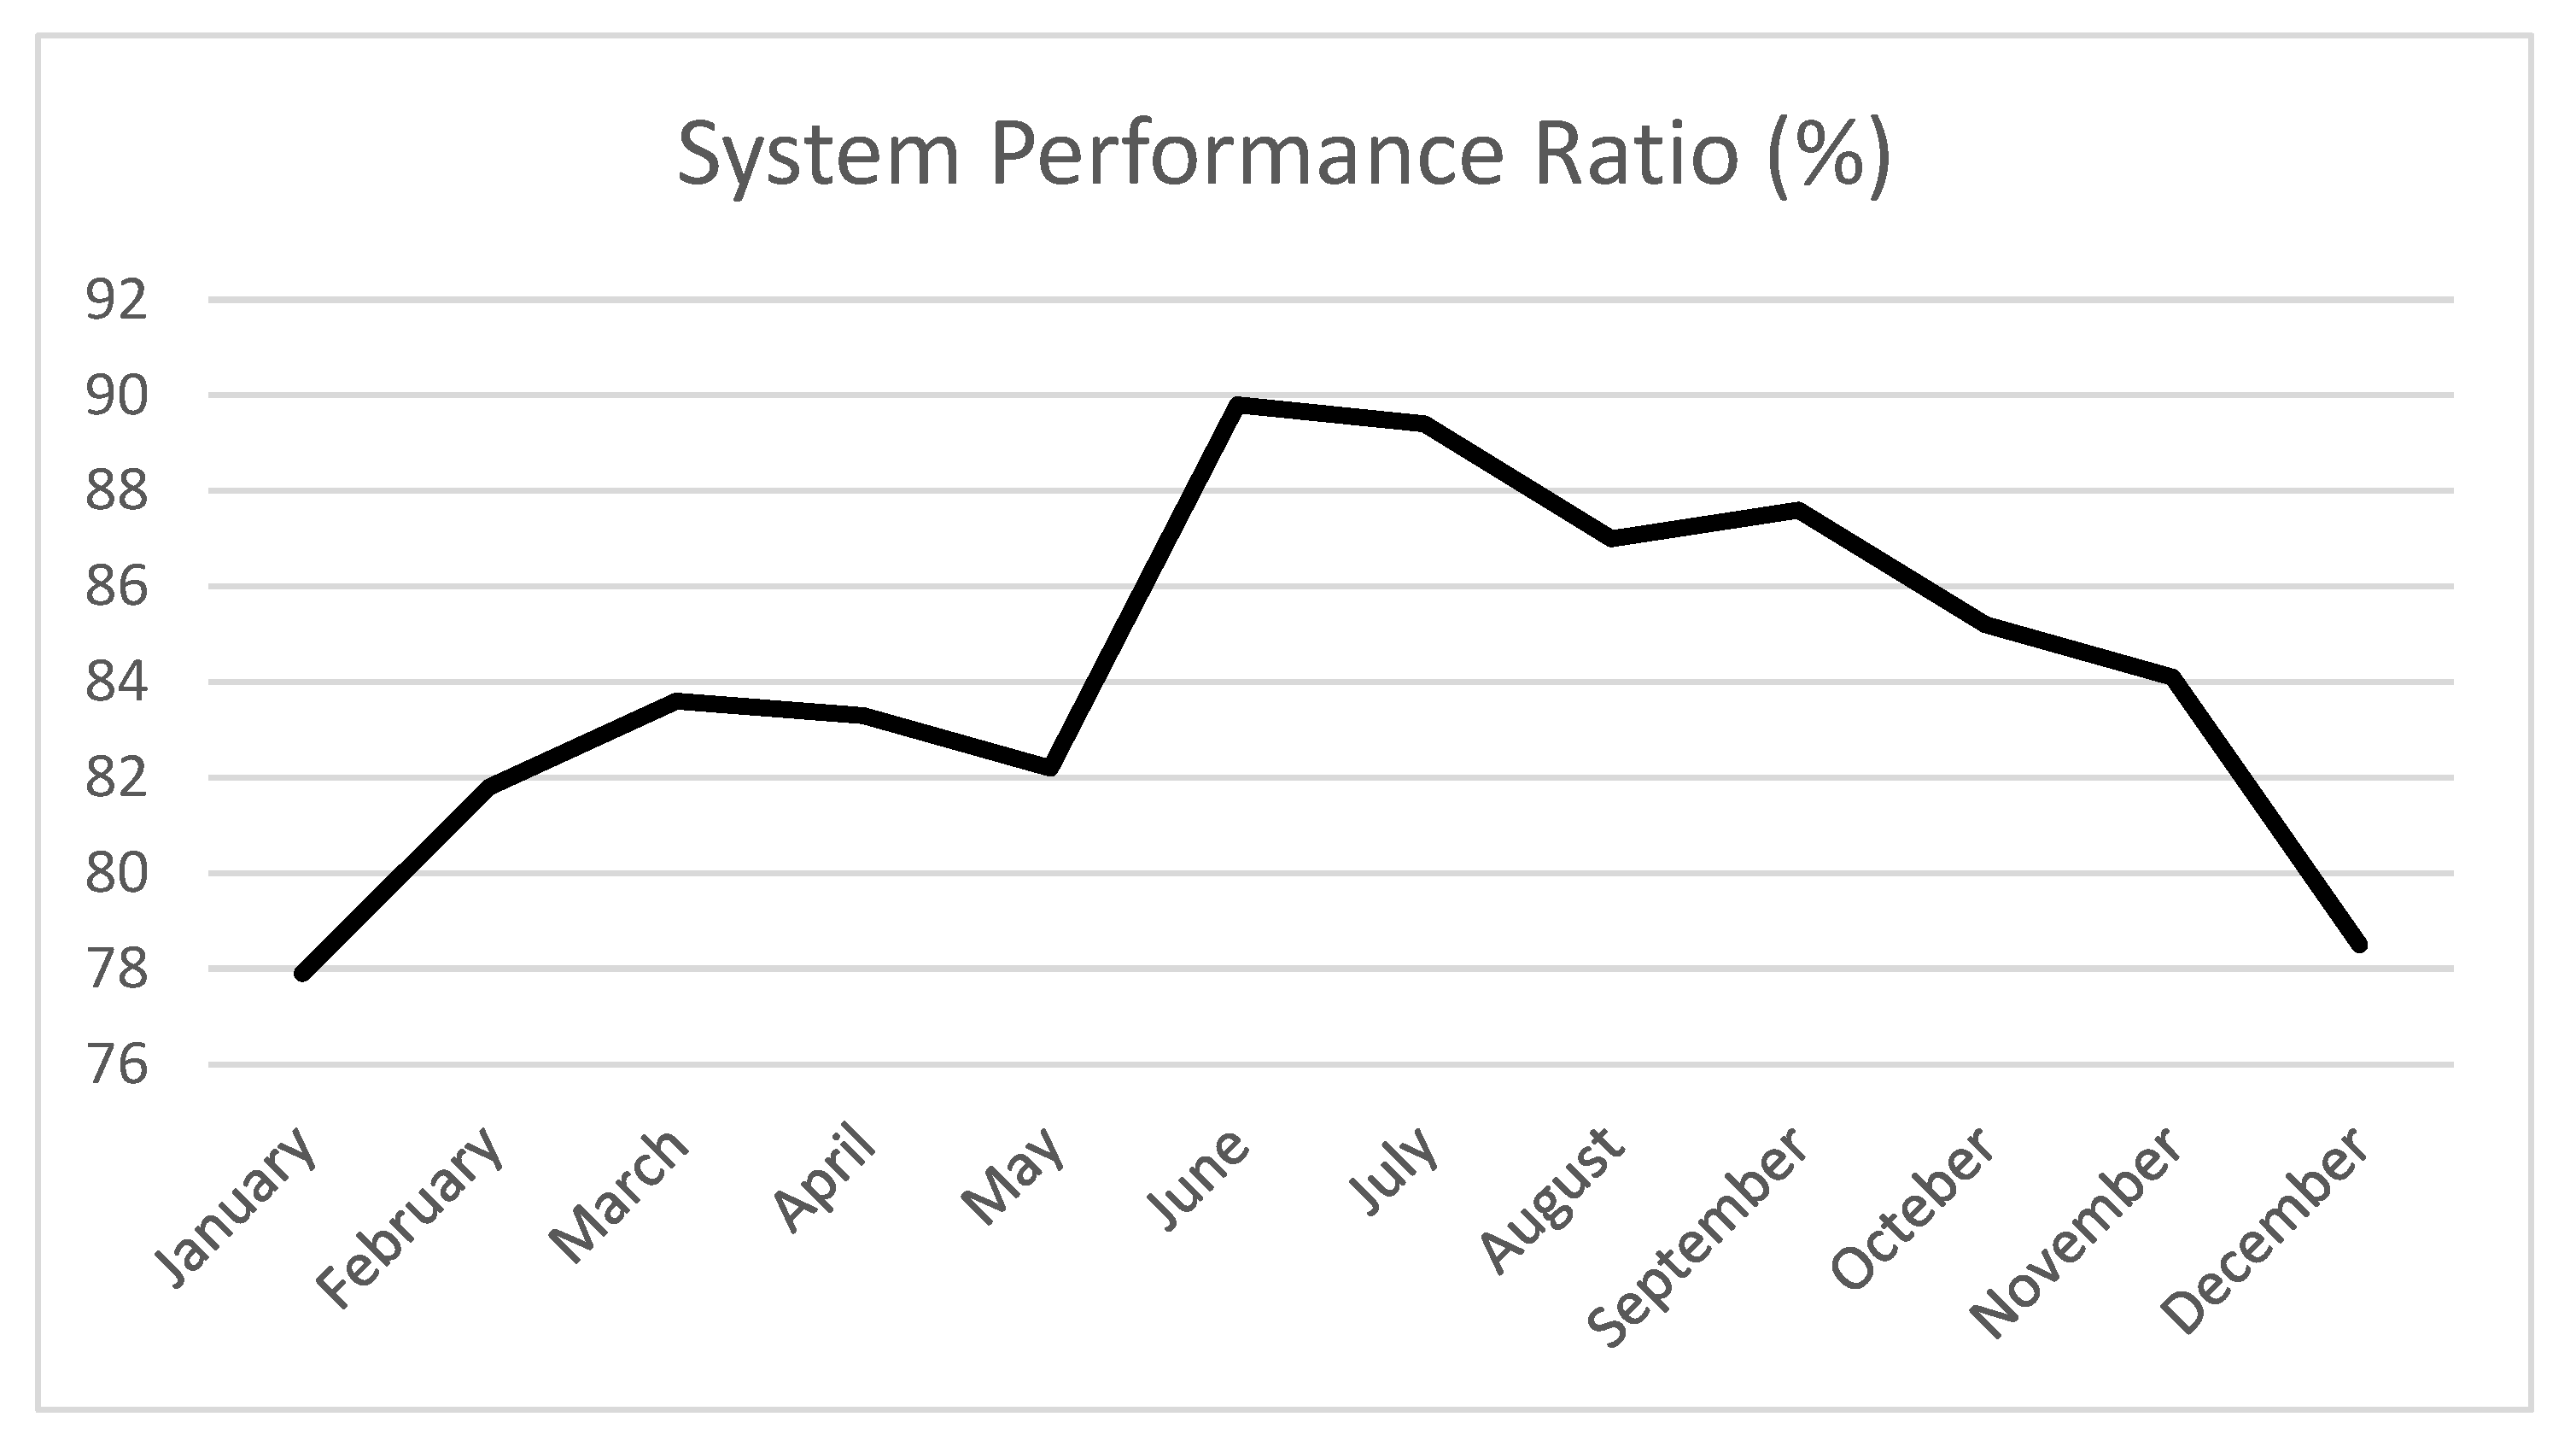
| Month | System Performance Rate (%) |
|---|---|
| January | 73.9 |
| February | 85.7 |
| March | 87.8 |
| April | 87.4 |
| May | 84.7 |
| June | 83.5 |
| July | 82.4 |
| August | 82.7 |
| September | 84.1 |
| October | 84.4 |
| November | 78.9 |
| December | 64.1 |
| Average | 81.6 |
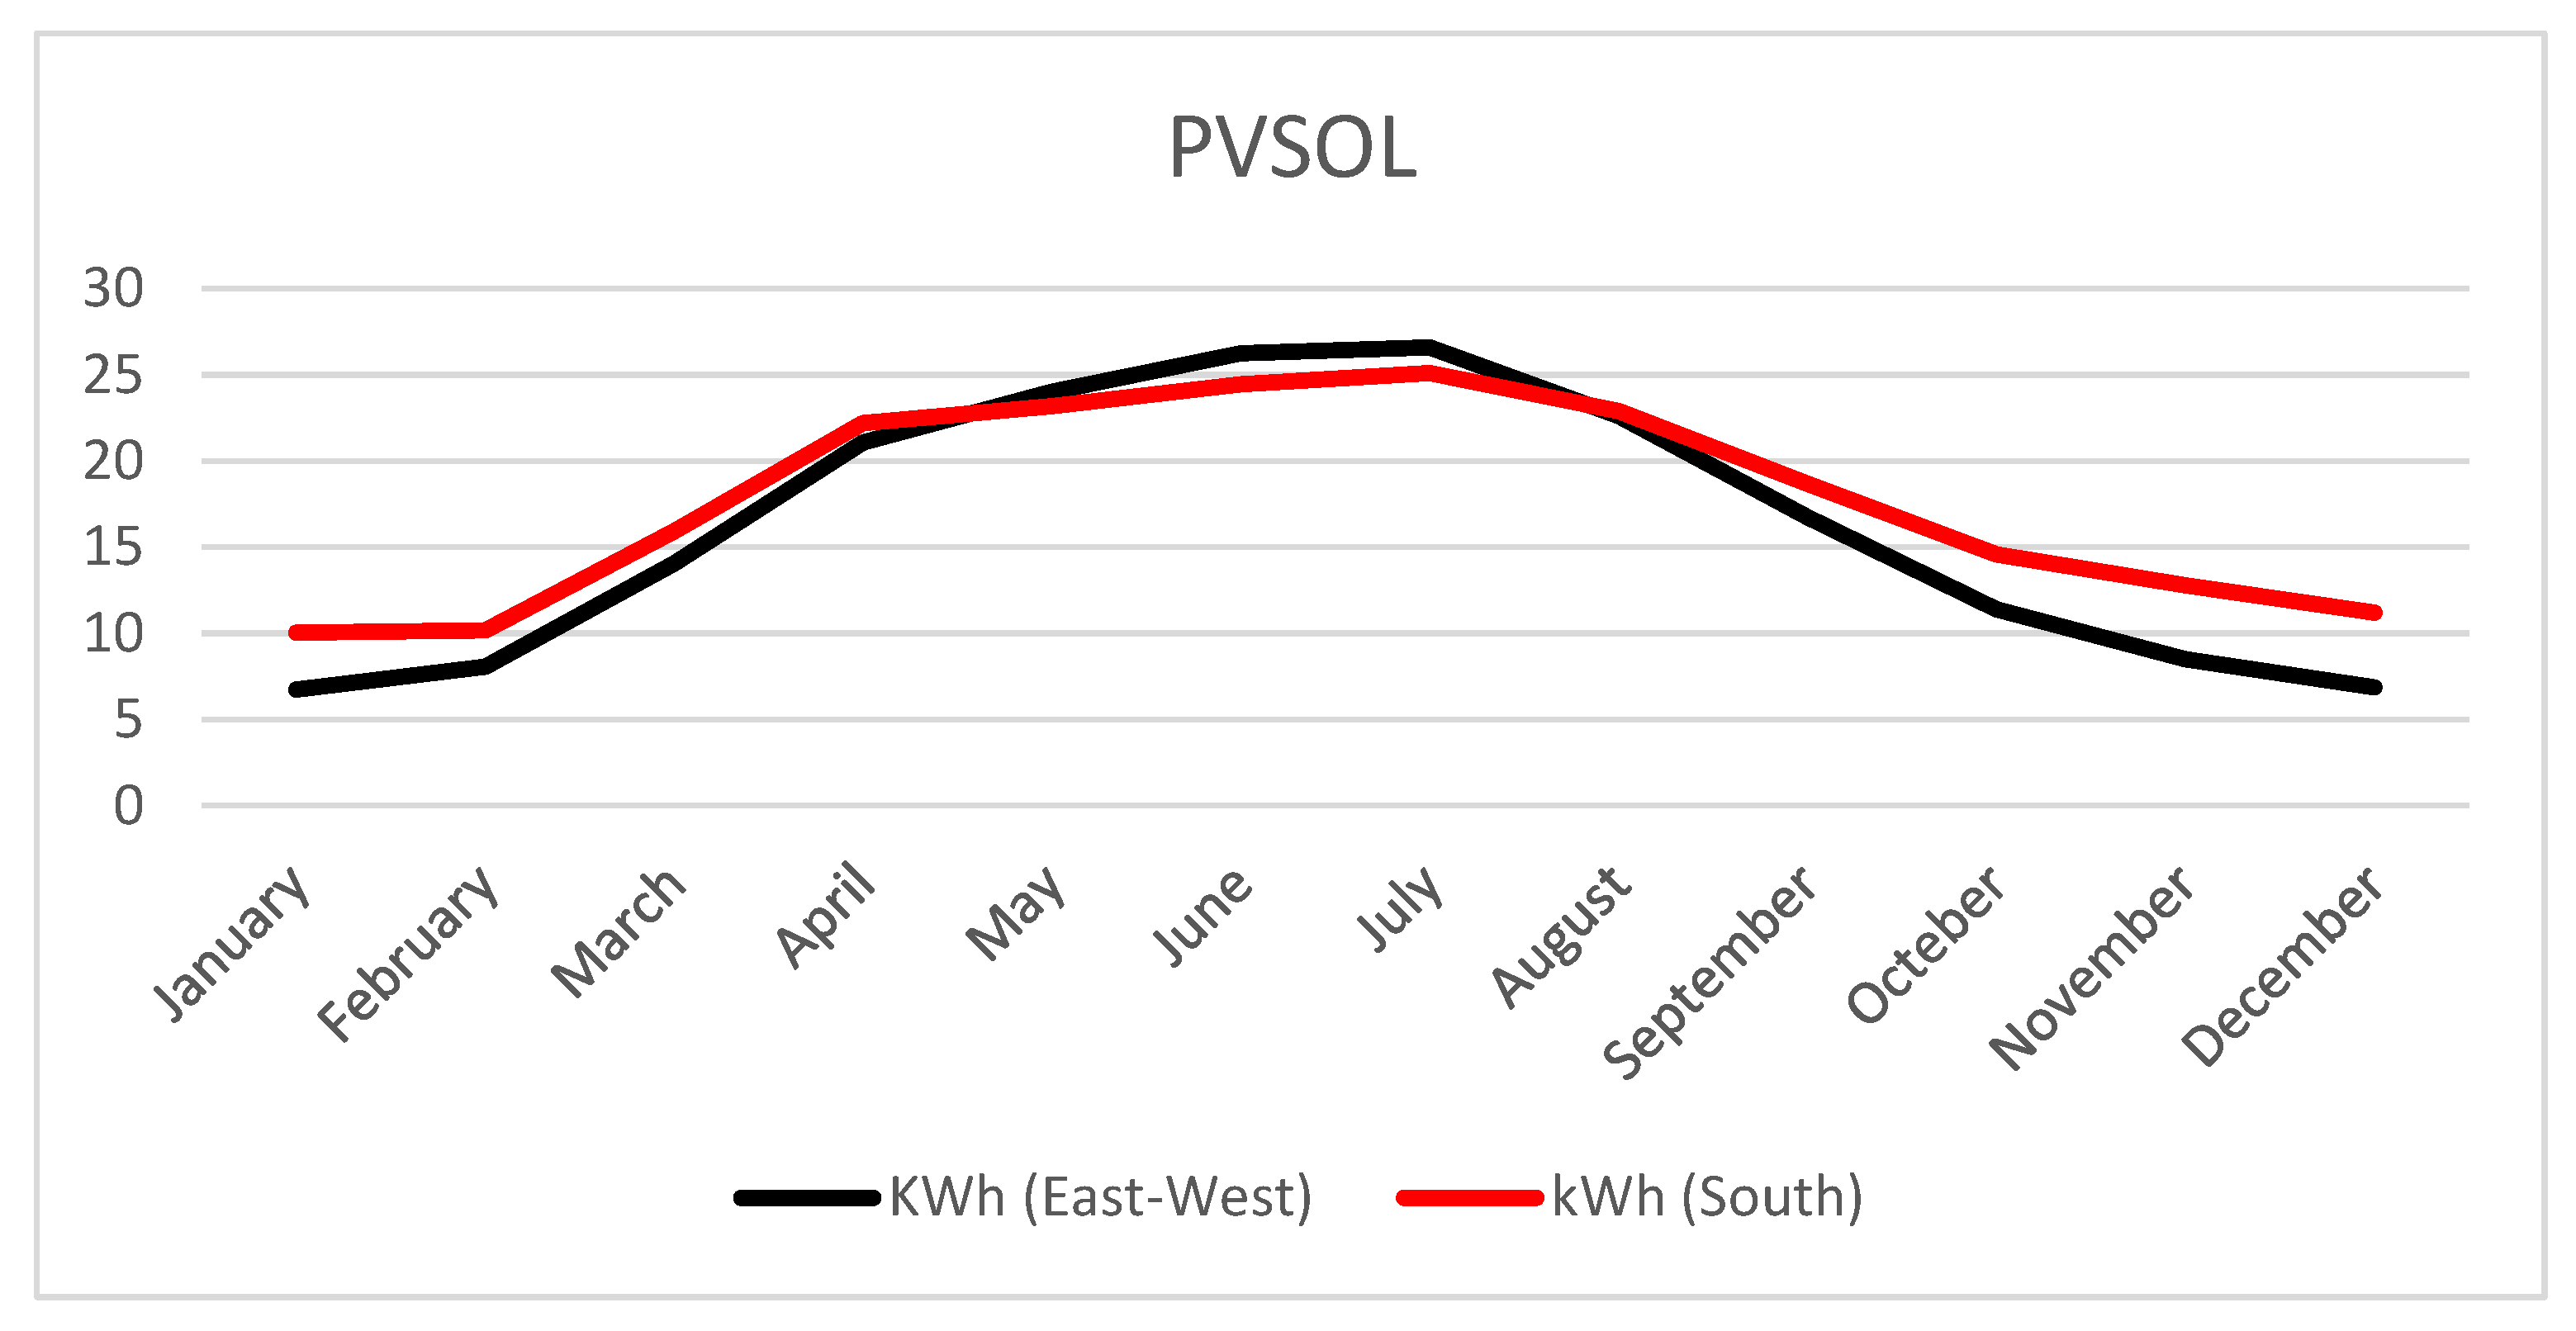
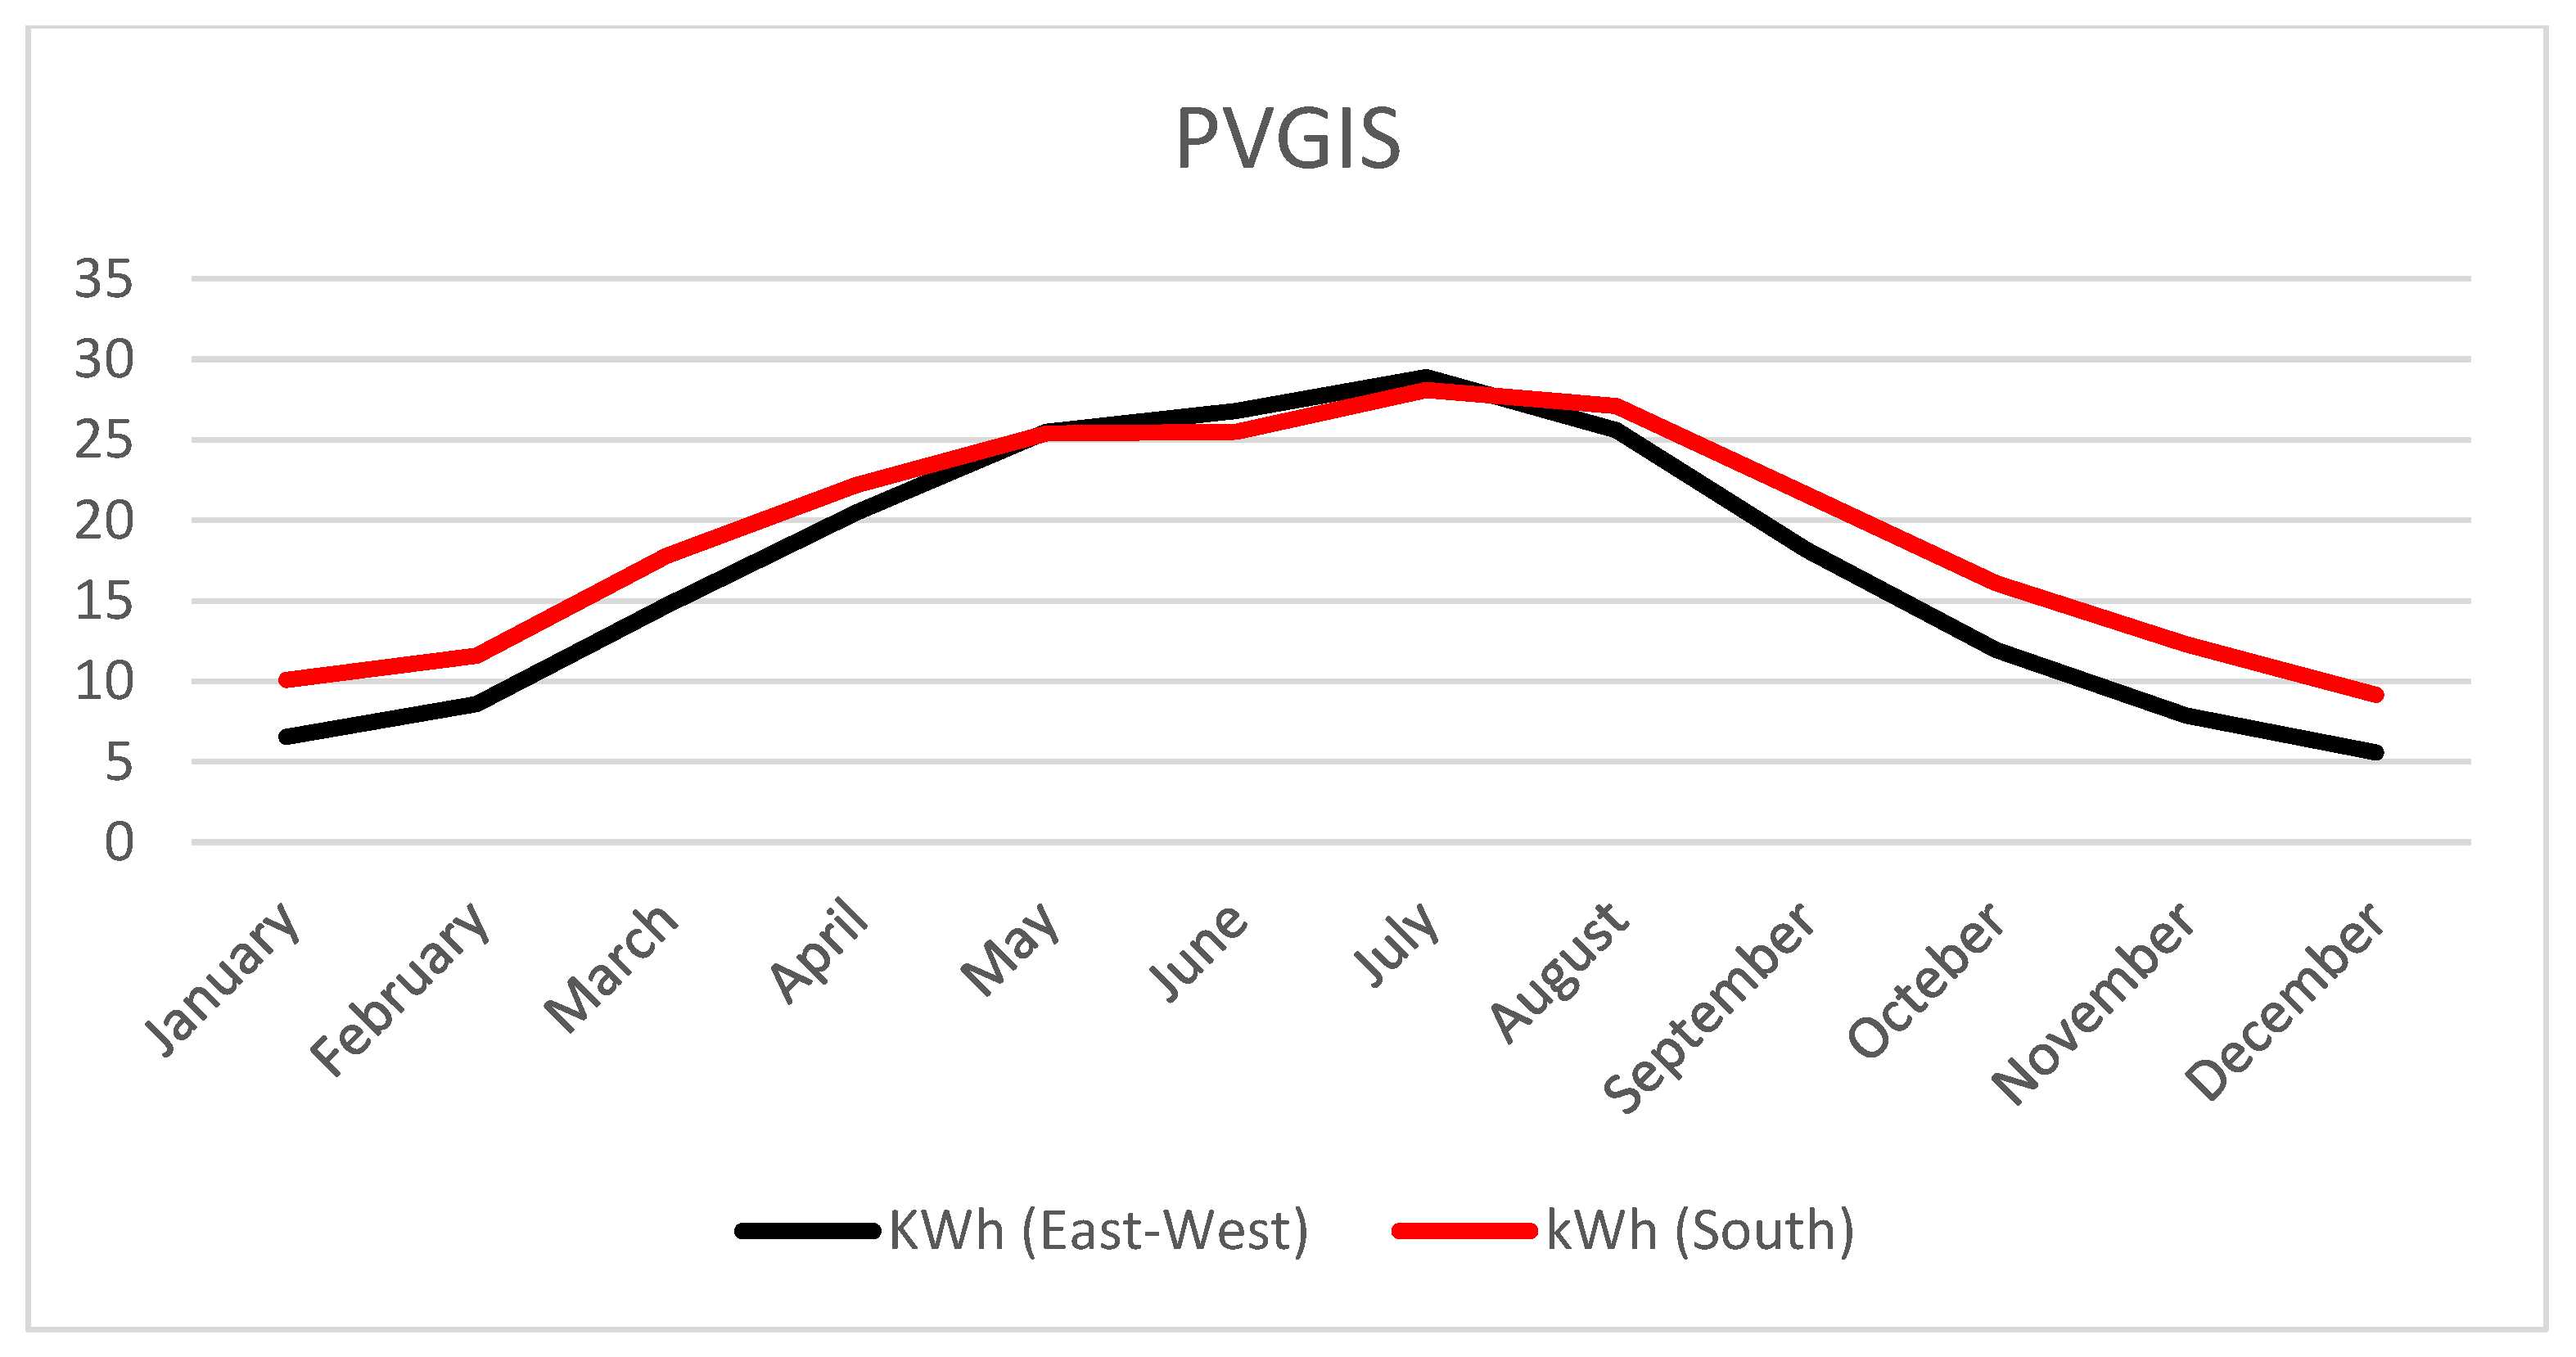
| By Month with PVSOL Energy Production Comparison | By Month with PVGIS Energy Production Comparison | ||||
|---|---|---|---|---|---|
| Moon | KWh (East–West) | kWh (South) | Moon | KWh (East–West) | kWh (South) |
| January | 6.74 | 10.04 | January | 6.54 | 10.1 |
| February | 8.07 | 10.17 | February | 8.58 | 11.6 |
| March | 14.06 | 15.92 | March | 14.72 | 17.8 |
| April | 21.08 | 22.2 | April | 20.5 | 22.2 |
| May | 24.02 | 23.17 | May | 25.5 | 25.4 |
| June | 26.24 | 24.45 | June | 26.8 | 25.5 |
| July | 26.59 | 25.1 | July | 28.9 | 28.1 |
| August | 22.6 | 22.9 | August | 25.6 | 27.1 |
| September | 16.73 | 18.67 | September | 18.18 | 21.6 |
| October | 11.4 | 14.58 | October | 11.94 | 16.1 |
| November | 8.49 | 12.79 | November | 7.87 | 12.3 |
| December | 6.86 | 11.2 | December | 5.58 | 9.16 |
| Total | 192.88 | 211.25 | Total | 200.71 | 226.96 |
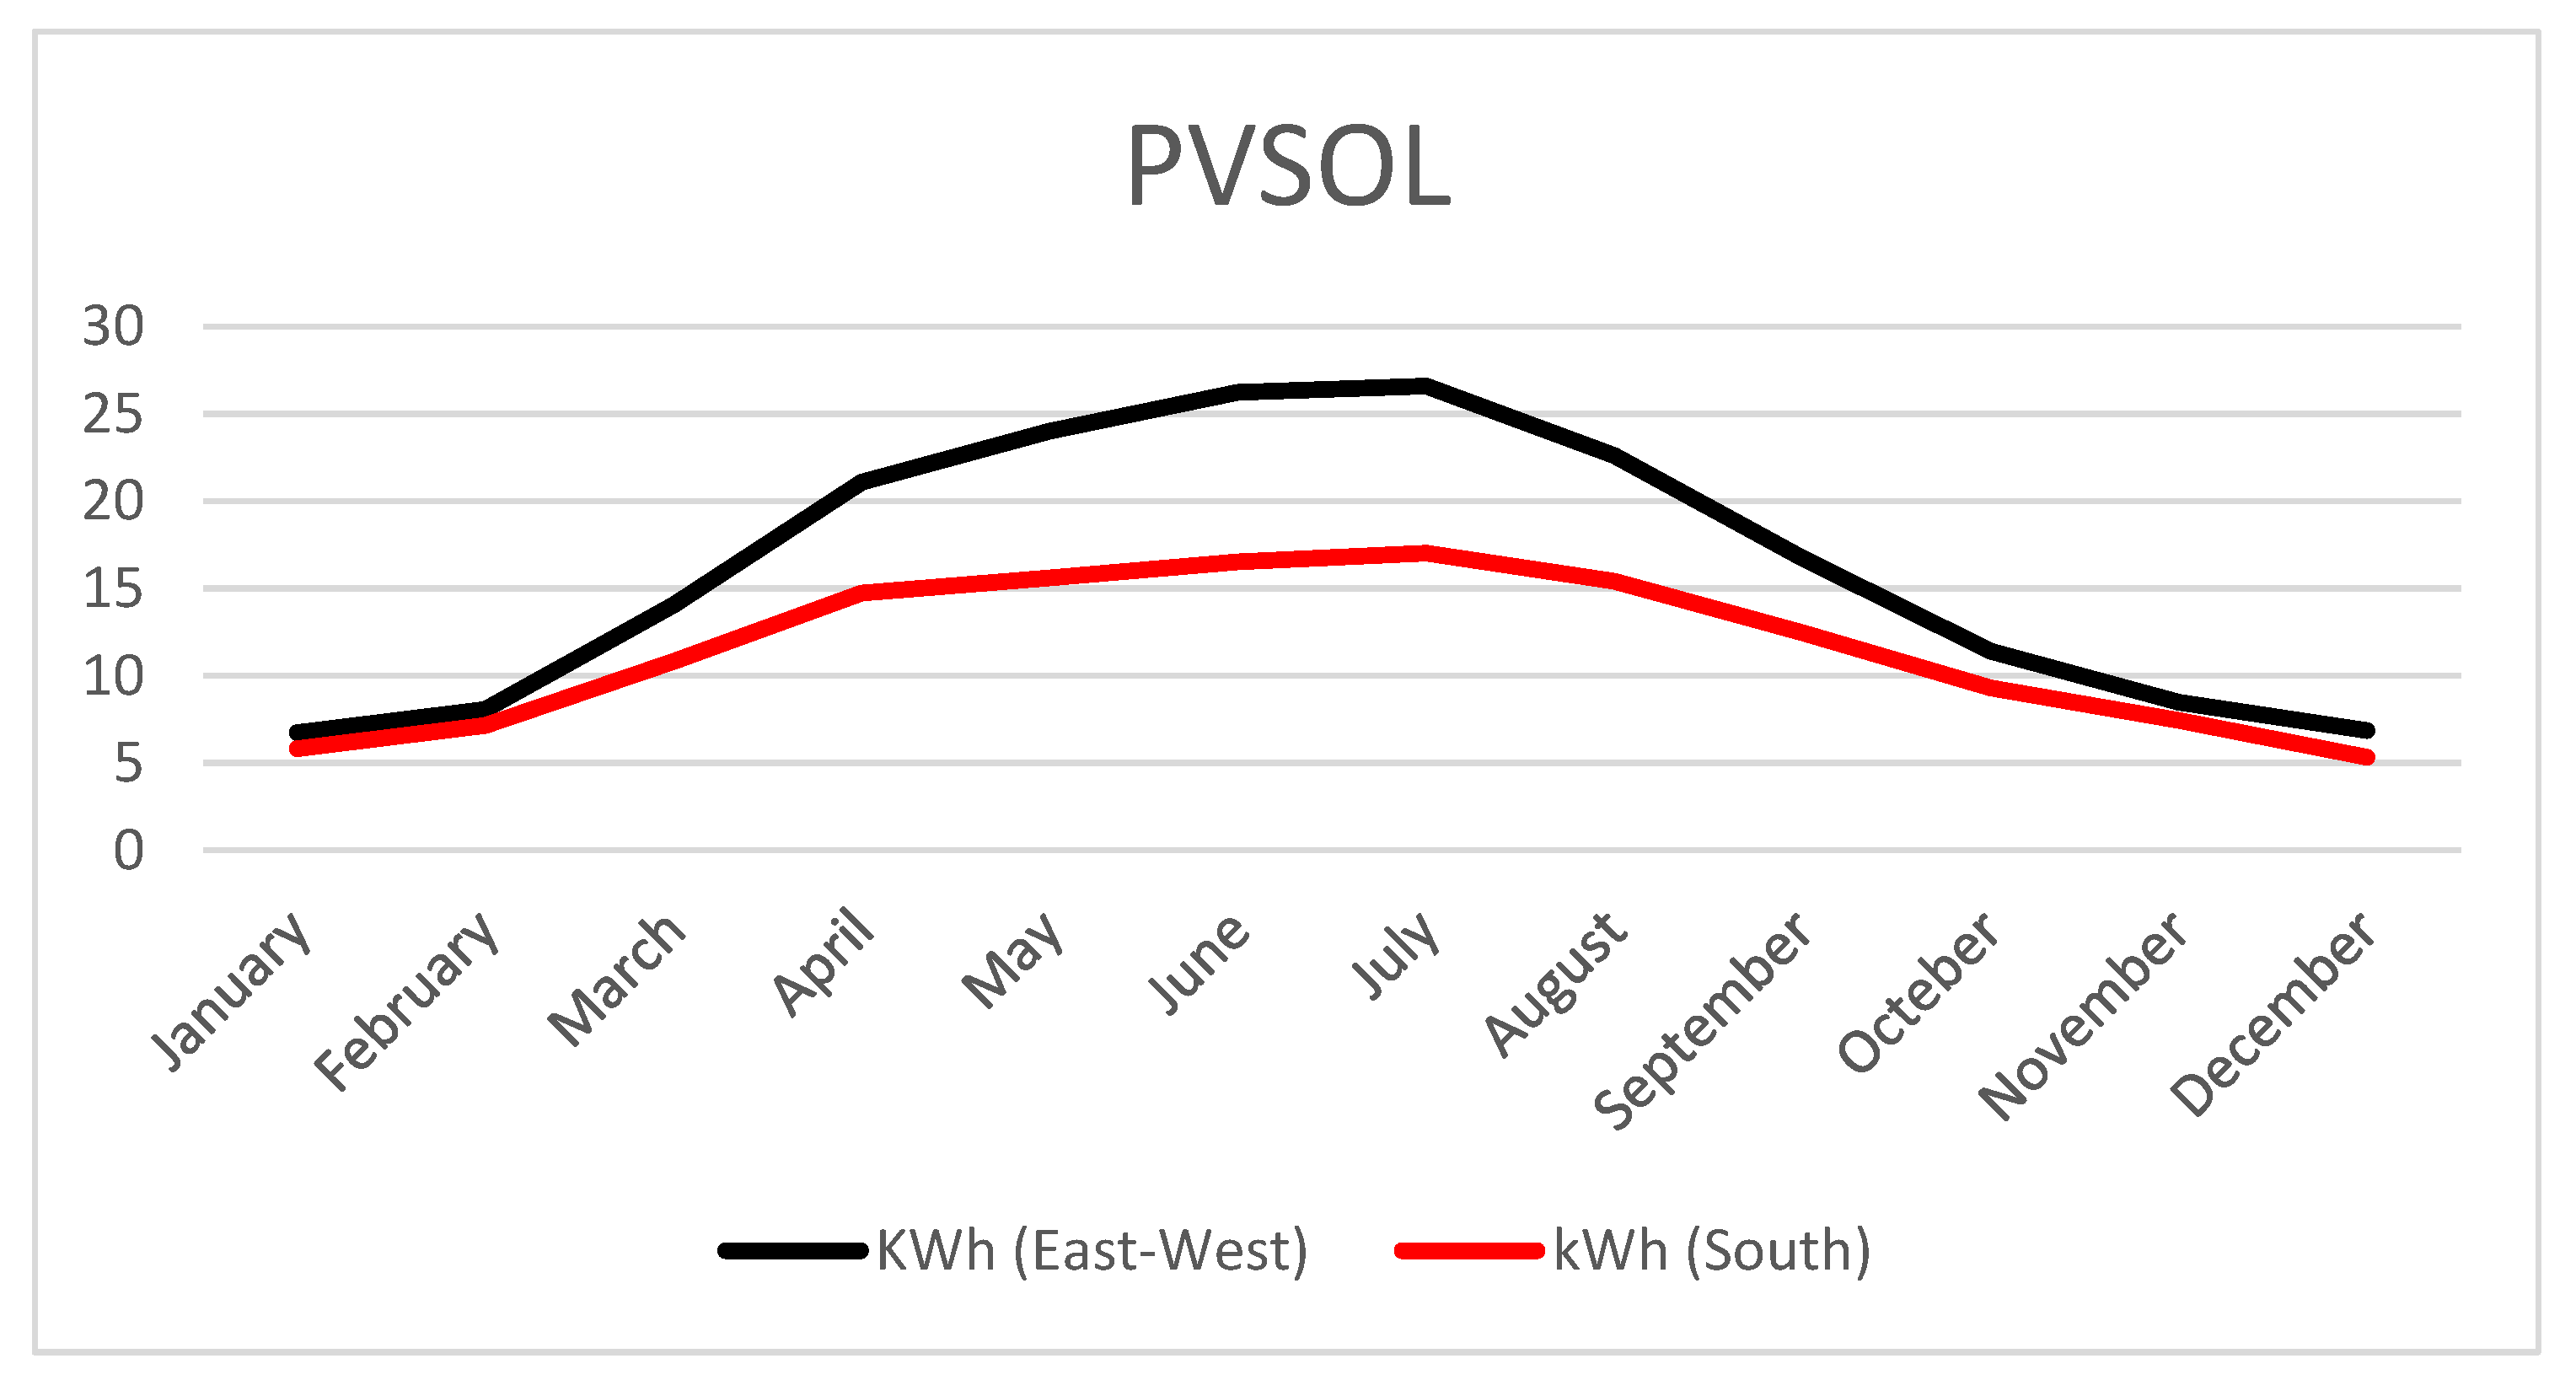
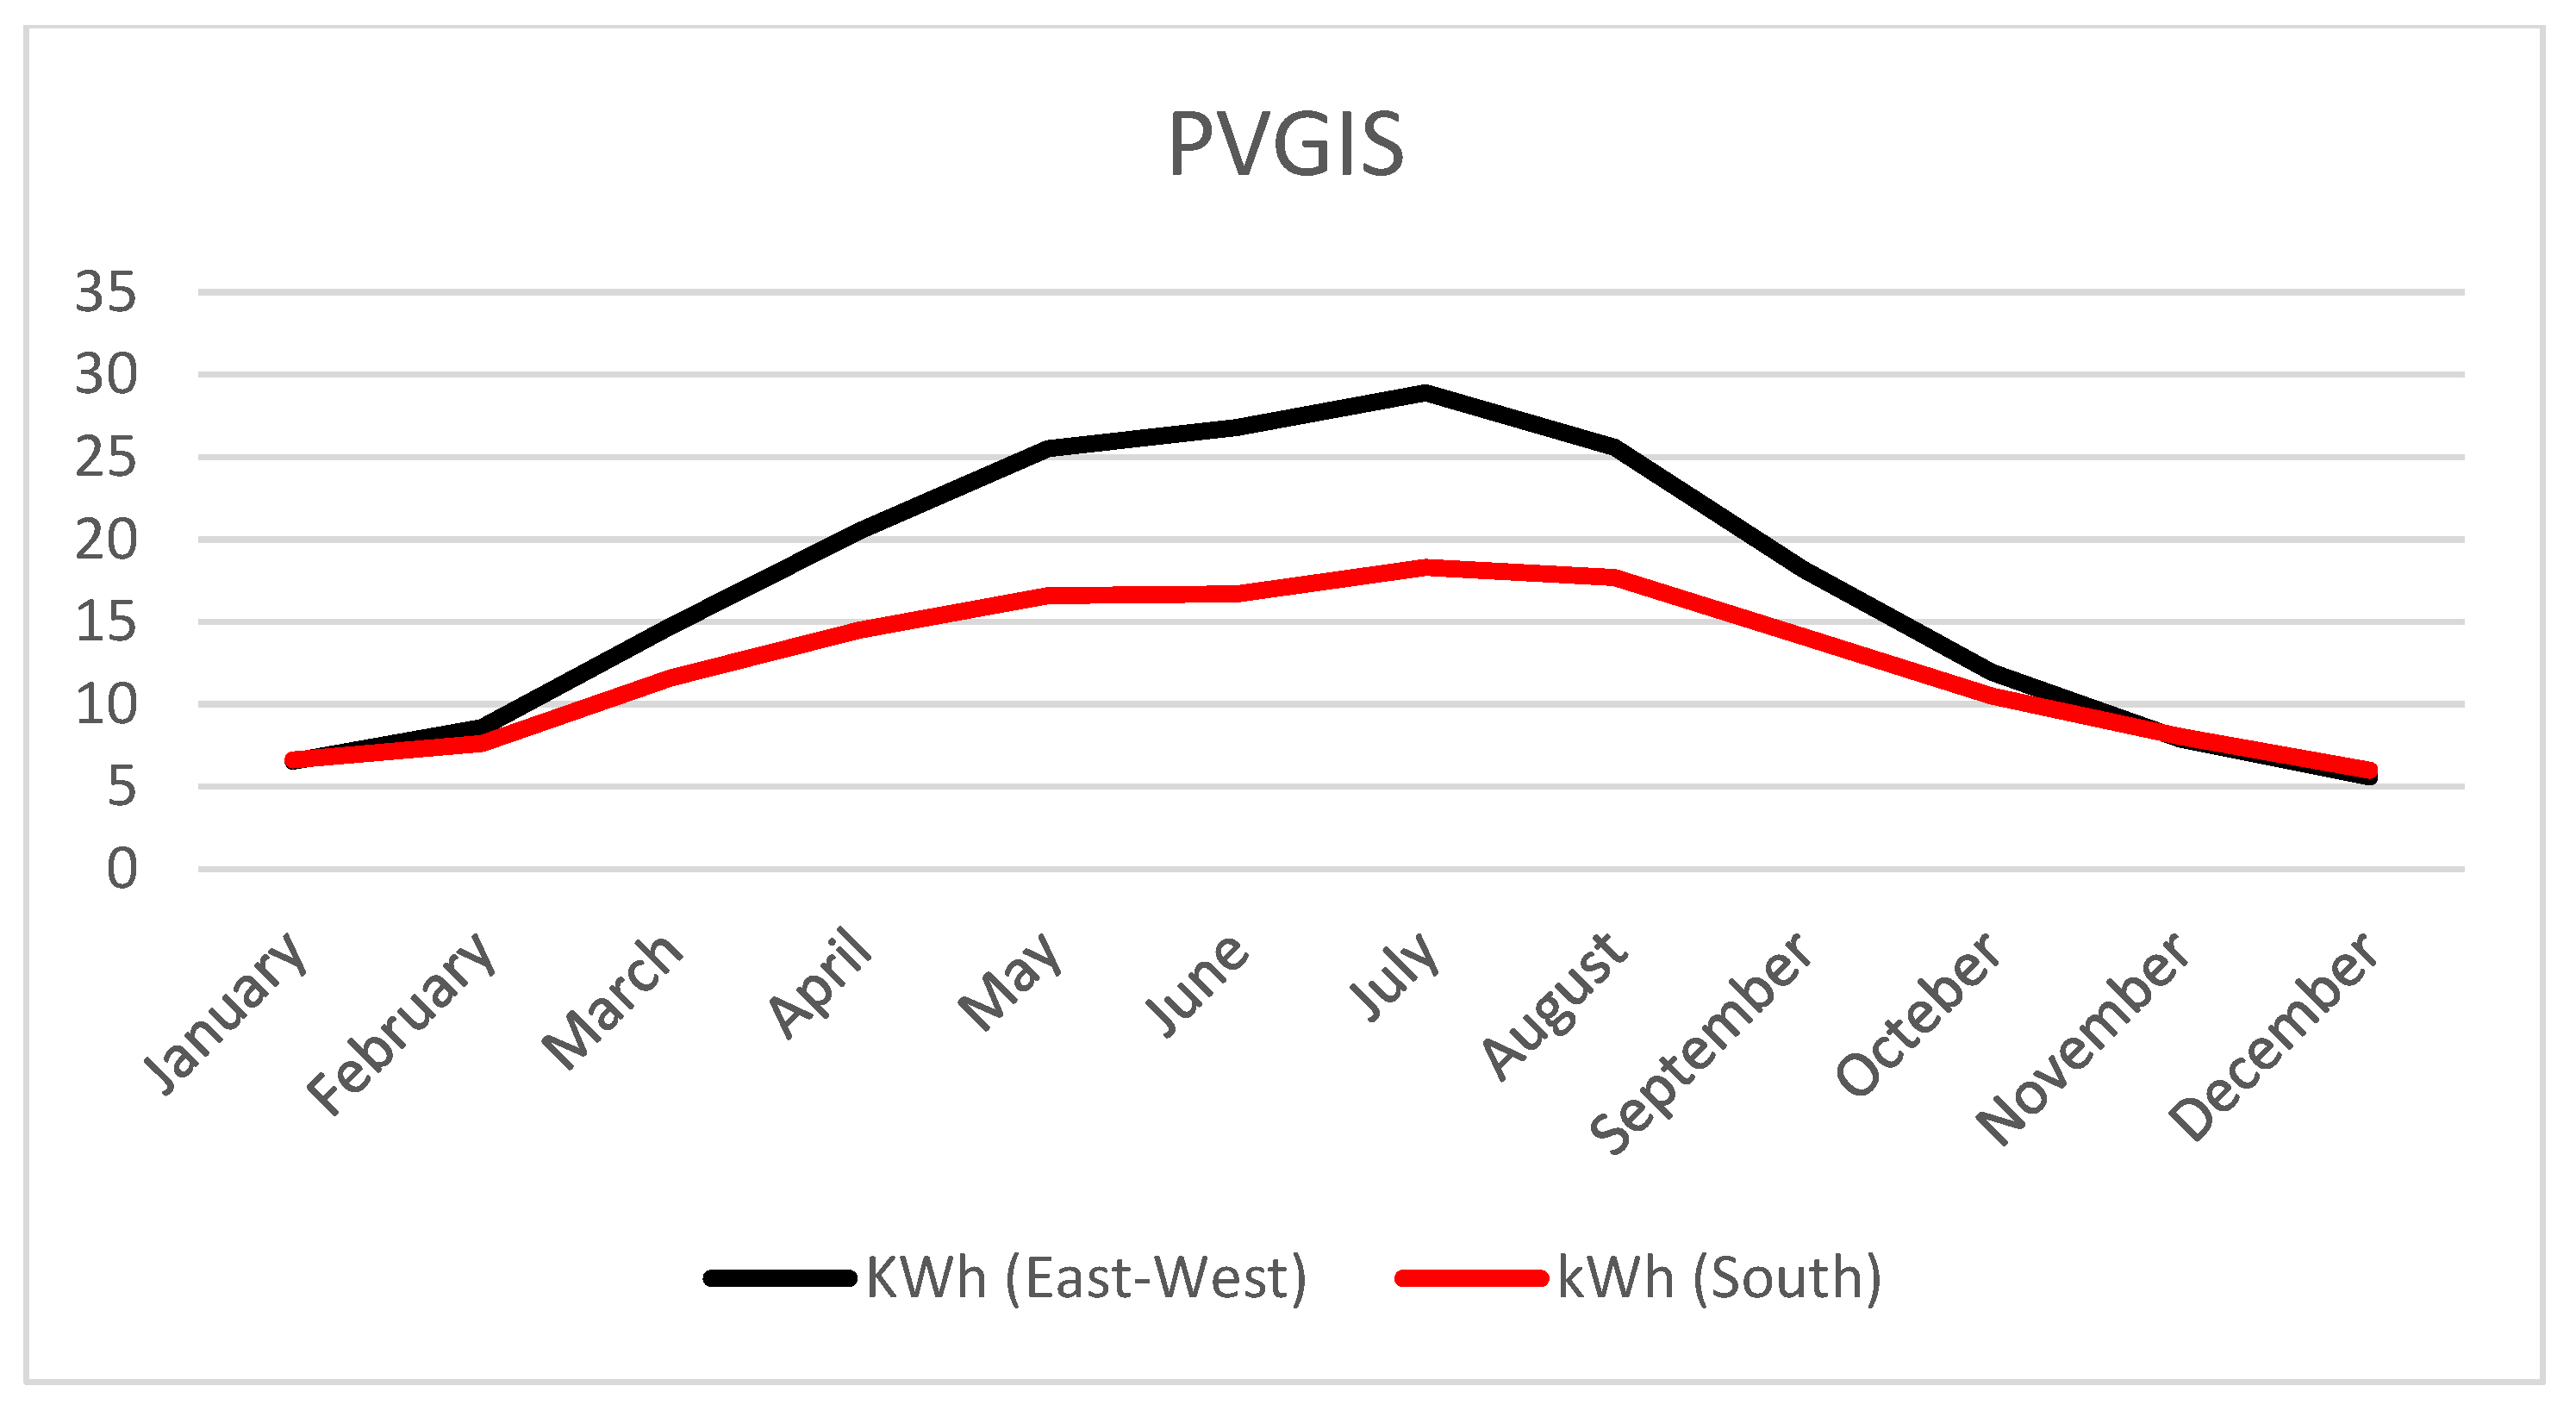
| By Month with PVSOL Energy Production Comparison | By Month with PVGIS Energy Production Comparison | ||||
|---|---|---|---|---|---|
| Moon | KWh (East–West) | kWh (South) | Moon | KWh (East–West) | kWh (South) |
| January | 6.74 | 5.81 | January | 6.54 | 6.62 |
| February | 8.07 | 7.16 | February | 8.58 | 7.61 |
| March | 14.06 | 10.83 | March | 14.72 | 11.6 |
| April | 21.08 | 14.73 | April | 20.5 | 14.5 |
| May | 24.02 | 15.61 | May | 25.5 | 16.6 |
| June | 26.24 | 16.52 | June | 26.8 | 16.7 |
| July | 26.59 | 17.02 | July | 28.9 | 18.3 |
| August | 22.6 | 15.42 | August | 25.6 | 17.7 |
| September | 16.73 | 12.47 | September | 18.18 | 14.1 |
| October | 11.4 | 9.30 | October | 11.94 | 10.5 |
| November | 8.49 | 7.45 | November | 7.87 | 8.04 |
| December | 6.86 | 5.33 | December | 5.58 | 5.99 |
| Total | 192.88 | 137.63 | Total | 200.71 | 148.26 |
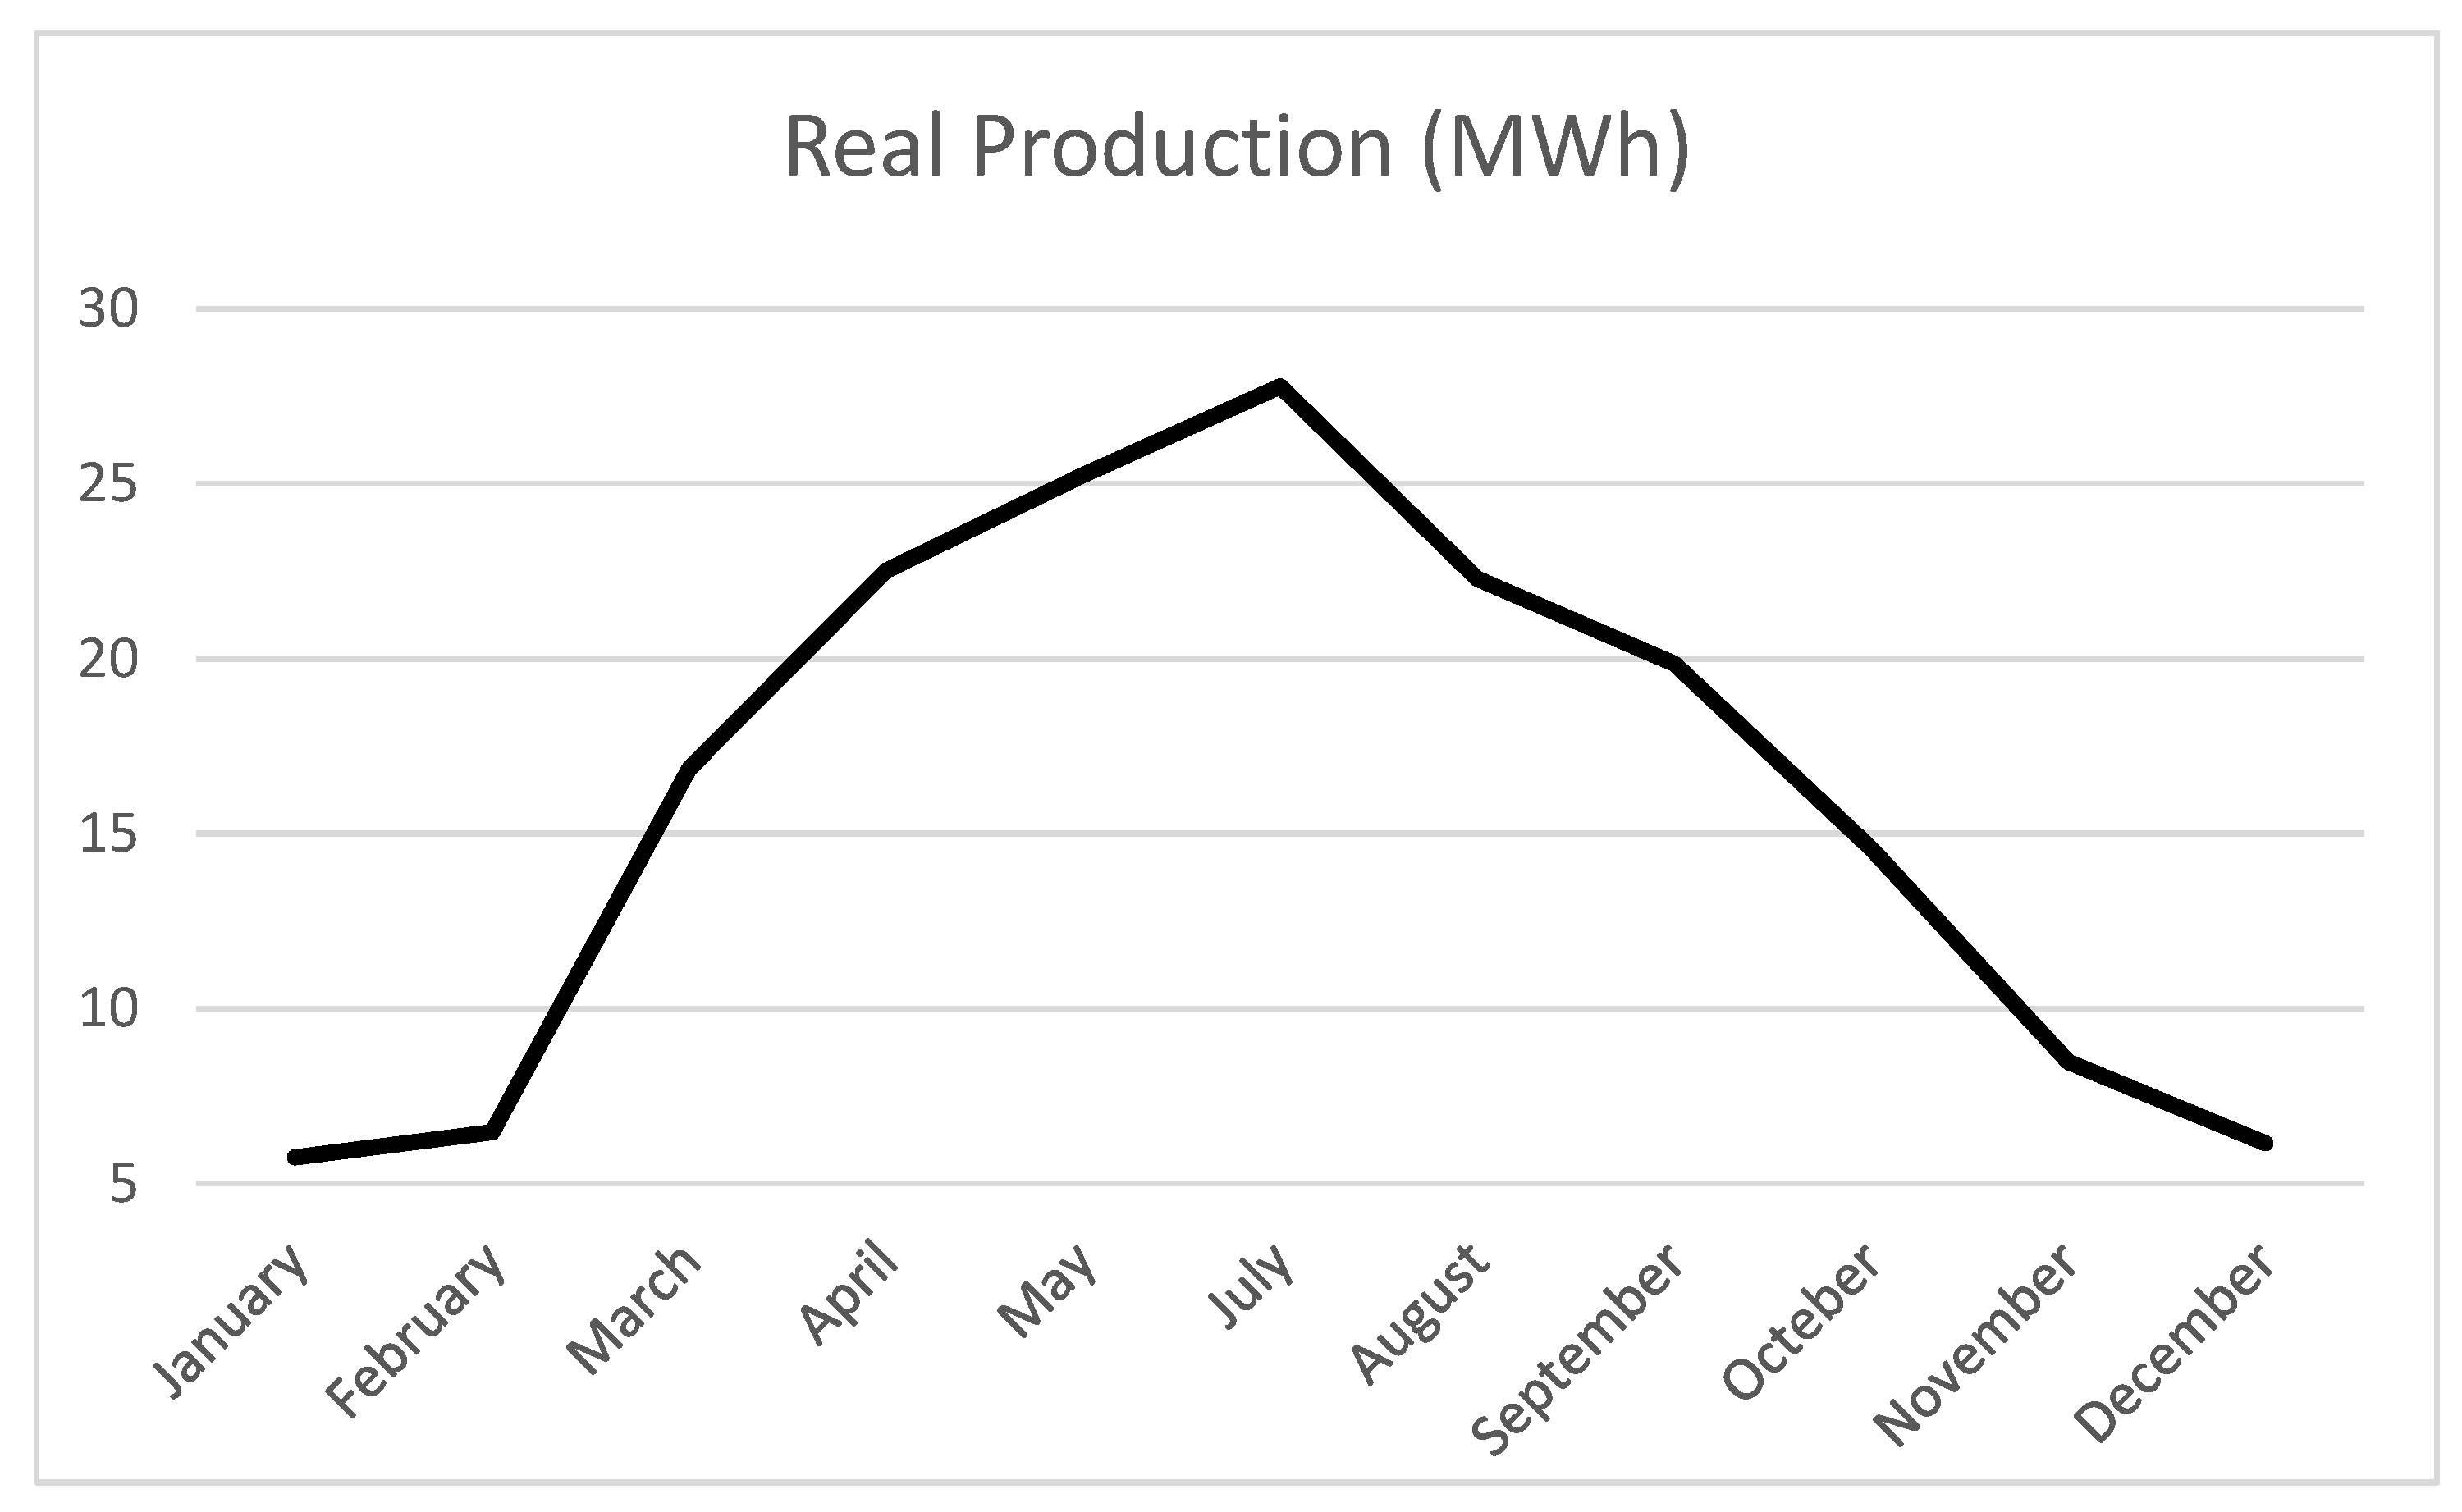
| Month | Real Production (MWh) |
|---|---|
| January | 5.75 |
| February | 6.47 |
| March | 16.85 |
| April | 22.52 |
| May | 25.25 |
| July | 27.78 |
| August | 22.28 |
| September | 19.85 |
| October | 14.57 |
| November | 8.47 |
| December | 6.15 |
| Total | 202.85 |
| Asset | Piece | Unit Price | Total Cost | |
|---|---|---|---|---|
| Structure 1 | Inverter | 25 | 1133.33 | USD 50,433.25 |
| Optimizer | 650 | 34 | ||
| Structure 2 | Micro-inverter | 650 | 94 | USD 61,100.00 |
| Difference | USD 10,666.75 | |||
Disclaimer/Publisher’s Note: The statements, opinions and data contained in all publications are solely those of the individual author(s) and contributor(s) and not of MDPI and/or the editor(s). MDPI and/or the editor(s) disclaim responsibility for any injury to people or property resulting from any ideas, methods, instructions or products referred to in the content. |
© 2023 by the authors. Licensee MDPI, Basel, Switzerland. This article is an open access article distributed under the terms and conditions of the Creative Commons Attribution (CC BY) license (https://creativecommons.org/licenses/by/4.0/).
Share and Cite
Alkan, S.; Ates, Y. Pilot Scheme Conceptual Analysis of Rooftop East–West-Oriented Solar Energy System with Optimizer. Energies 2023, 16, 2396. https://doi.org/10.3390/en16052396
Alkan S, Ates Y. Pilot Scheme Conceptual Analysis of Rooftop East–West-Oriented Solar Energy System with Optimizer. Energies. 2023; 16(5):2396. https://doi.org/10.3390/en16052396
Chicago/Turabian StyleAlkan, Savas, and Yavuz Ates. 2023. "Pilot Scheme Conceptual Analysis of Rooftop East–West-Oriented Solar Energy System with Optimizer" Energies 16, no. 5: 2396. https://doi.org/10.3390/en16052396
APA StyleAlkan, S., & Ates, Y. (2023). Pilot Scheme Conceptual Analysis of Rooftop East–West-Oriented Solar Energy System with Optimizer. Energies, 16(5), 2396. https://doi.org/10.3390/en16052396


