Article

Experimental Thermal Behavior of Fibrous Structures for High-Performance Heat Resistant Fire Curtains

1
MEtRICs Research Centre, University of Minho, 4800-058 Guimarães, Portugal
2
2C2T Research Centre, University of Minho, 4800-058 Guimarães, Portugal
3
Fibrenamics Association—Institute for Innovation in Fiber and Composites Materials, University of Minho, 4800-058 Guimarães, Portugal
4
IPC Research Centre, University of Minho, 4800-058 Guimarães, Portugal
5
Mehler Engineered Products Portugal, Lda, 4770-330 Landim, Portugal
6
CMEMS Research Centre, University of Minho, 4800-058 Guimarães, Portugal
*
Author to whom correspondence should be addressed.
Energies 2023, 16(5), 2426; https://doi.org/10.3390/en16052426
Submission received: 28 December 2022 / Revised: 22 February 2023 / Accepted: 1 March 2023 / Published: 3 March 2023

Abstract

:
Fibrous materials are often used in the manufacturing of fire protection devices such as fire curtains. Their optimization and improved performance is still a topic of interest. The present work aims to develop and test a new combination of fibers arranged in various 2D and 3D patterns with coatings. For this purpose, basalt fibers were added into a glass fiber fabric, and wires of a shape memory material (SMM) were inserted into the fabric to create air pockets induced by temperature. In fire curtains, the base structure is a 2D basket pattern, and all combinations were tested with and without a waterborne polyurethane (WPU) coating with inorganic materials. Three different tests were selected to characterize the thermal behavior: fire resistance, ignitability, and smoke production. Fiberglass proved to be the best material to provide thermal resistance in fire curtains, with the outer surface temperature of the fabric below 650 °C at the end of the tests. The SMM wires provided good protection during the initial stages of the test, but a combination of excessive deformation and reduced strength of the fabric resulted in a sudden failure of the structure. Basalt fibers contribute to a reduction of smoke production. It was observed an improvement of up to 10% in the thermal capacity between 1MIX2 (glass fibers fabric with coating, MIX2) and the best commercial curtain evaluated, Commercial3 (glass and steel fibers fabric with coating).

1. Introduction

With a growing concern for human safety, there are high demands for the improvement of protection devices. Considering that 90% of all fire victims are from fires in buildings [1], passive fire protection measures assume great importance as their purpose is to contain or slower the fire spread [2]. In addition, there is a constant search for new methods and materials capable of gathering thermal, fire, and radiation protection abilities. In this quest, fibrous and polymeric materials and their combinations stand out as a great multipurpose solution [3]. In the development of these new materials, tests to characterize their thermal behavior are necessary so that the resultant products may be compared and certified.
Amongst the various applications of fibrous structures, the need for flexible and lightweight heat-resistant structures makes fire curtains the perfect example to highlight the advantages of using fibrous materials in passive fire protection. Fire curtains provide a way of restraining the fire and its hazards, such as heat and smoke, so that people may have time to safely escape while active fire protection elements are deployed to extinguish the fire [4]. Nowadays, their development presents already some positive factors: wider use of fiber materials, the inclusion of various coatings [4], and the existence of extensive normative legislation. However, there is space for improvement in fire durability [5] and the combination of mechanical and thermal properties that results in a lightweight structure with optimum thermal insulation, integrity at high temperatures, and flame resistance. These factors may be accomplished by the use of high-performance heat and flame-resistant fibers such as glass or basalt fibers. Conventional flame-retardant fibers only mean that they are less susceptible to ignition and reduce flame spread [6], which excludes them for applications with a need for high fire resistance.
After the development stage of these products, there is the need to carry out tests to evaluate their performance and choose the best among them. These tests are oriented for the evaluation of thermal behavior according to suitable standards. These are related to the functions that passive fire protection products must perform in fire scenarios. These functions are reaction to fire, fire resistance, and smoke control. Reaction to fire is described by BS EN 13501-1 [7] and is related to the product’s own contribution to the fire by its decomposition. As for fire resistance, its meaning is given by BS 476-20 [8] as the capacity of a product to hold its separating and/or loadbearing function when exposed to a fire. Finally, smoke control is ruled by BS EN 1634-3 [9] and defined as the ability to restrict the smoke passage.
In the particular case of fire curtains, the function with more relevance is fire resistance, as their classification results directly from these tests. Within the various standards available, the most used for fire curtains certification are BS EN 1634-1 [10] and BS EN 13501-2 [11], whose content describes the experimental procedure to fire resistance tests and how to classify them according to the test results, respectively.
Given the framework of the theme, this study presents its relevance in the assessment of the thermal behavior of purpose-developed fibrous structures capable of responding to the identified improvement areas. The test results allow for sample comparison and as an indication of the possible behavior in certification tests. With these, companies guarantee their product performance, and the market obtains a competitive and innovative product with a focus on the increase in human safety.
In this study, three different tests were conducted for the thermal behavior assessment. The fire resistance and thermal insulation test was carried out in a furnace developed to follow the standard BS EN 1363-1 [12]. The smoke production test was performed according to BS EN 13823 [13] in a 1/3-scale built test facility developed. Ignitability tests were also carried out in certified equipment that followed the standard ANSI/UL 94 [14].
The results obtained highlight the differences between the two used fibers for the fabrics, with glass fibers proving to have better thermal resistance than basalt fibers. In addition, all the developed samples received an approximate classification and a similar performance to the tested commercials samples.

2. Materials and Methods

2.1. Passive Fire Protection—Classification Criteria

For each of the passive fire protection functions, there are criteria whose goal is to classify these products according to the test results.
Reaction to fire is characterized by three different criteria: fire behavior, smoke production, and production of flaming particles/droplets whose evaluation results directly in a classification of a product according to standard BS EN 13501-1 [7].
The fire behavior criterion can be further divided into three sub-criteria: fire contribution, flame spread, and ignitability. Each of these has its own test standards, and they all contribute to the classification of A1–A2–B–C–D–E–F, being A1 the best, in respect to fire behavior.
Fire resistance is the main function of fire curtains as it allows for direct comparison between different products. Four main classification criteria may be identified in EN 13501-2 [11], loadbearing capacity (R), integrity (E), thermal insulation (I), and radiation (W). Each letter is followed by the time that the respective criterion or a combination of two is fulfilled. The possible combinations are RE, REI, EI, or EW.
Smoke control has its base in standard BS EN 1634-3 [9] with two associated criteria. Both are related to resistance for the smoke passage, with smoke leakage criterion (S) associated with fire resistance and an additional criterion of stability (D).
With three different functions and various criteria for each, Table 1 summarizes the relevant standards either for evaluation or for test procedures.

2.2. Test Materials

For this study, four different fibrous structures were developed, and each one had the possibility to have a specially developed coating applied. These combinations resulted in eight different samples to evaluate the thermal behavior.
These structures were developed taking into account the state-of-art of fire curtains and high-performance heat and flame-resistant fibers. The combinations resulted in different fibrous structures that can be seen in Table 2, varying in the fabric composition, structure, and coating application.
Two different fabric structures were explored with distinct objectives for each. The basket weave fabric is a common 2D textile structure with the purpose of obtaining a stable and resistant fabric which, in this case, can help to maintain high-temperature integrity.
In regard to the 3D near-net-shape structure, its objective is to create air pockets induced by temperature. This is made through the insertion of SMM wires weft threaded in the fabric. These wires are predefined to move into a helix geometry when heated up, thus creating multiple air pockets in the structure and diminishing the heat transfer.
The developed coating, referred to as MIX2, uses a waterborne polyurethane base (Takelac WS4022, produced by Mitsui Chemicals) with inorganic additives. The additives are alumina in the form of a water-based suspension (Alumina Powder, De-Agglomerated, 0.3 Micron, Allied) and nanoclay Cloisite20A, BYK. The alumina is in the form of an aqueous suspension, being 80% alumina residue after drying. These additives are responsible for improving fire durability through heat barrier mechanisms such as char formation. The char deposited in the fire curtain surface grants better insulation capabilities while also decreasing the gaseous supply to the fire [19]. The full coating composition can be observed in Table 3.
Several coating processes were tested for the application on fire curtains. The selected procedure was based on the application of the coating by soaking the fabric in a bath, followed by squeezing the excess coating with a pair of rollers with controlled pressure application, designated as the foulard process [20].
In regard to the FN curtain type, the coating application did not follow this process as the SMM presence does not allow it. As such, it was applied manually with a sponge, which did not grant uniformity in the coating application.
Considering that the test facilities used do not fully comply with all the requirements from their standards, comparative assessments were the solution for evaluating the developed products against the commercial ones available. In Table 4, the composition of the three commercial samples evaluated can be seen. From Commercial1 to Commercial3, components were added to improve their performance. Commercial1 only had a fabric of glass fiber; in Commercial2, steel fibers were added, and, finally, in Commercial3, a coating was applied to the structure from Commercial2.

2.3. Test Facilities

For the selected tests, three different facilities were used. Considering the available equipment, two test facilities were developed for fire resistance and for smoke production tests. As for the ignitability tests, a testing facility was already available to use, which follows the ANSI/UL 94 standard [14]. However, with minimal modifications, this equipment could also be used in accordance with BS EN 11925-2 [18].

2.3.1. Test Facility for Fire Resistance and Thermal Insulation

The fire resistance and thermal insulation testing procedure is defined by BS EN 1634-1 [10], which states that the testing equipment to be used must follow the indications from DIN EN 1363-1 [12].
The test rig is a large-scale unit. For the purpose of the current work, a laboratory scale was designed and manufactured in order to follow as close as possible the temperature/time curve represented in Equation (1).
T = 345 log10 (8t + 1) + 20
The test facility is shown in Figure 1. A reactor, heated by a 7 kW electrical coil embedded in the ceramic walls, acts as the heat source, whose temperature is controlled by PID. Compressed air (3) is supplied into the reactor to keep the pressure at the desired value, measured through an inclined manometer (1). Between the reactor and the manometer, a water-cooled heat exchanger (2) lowers the temperature. The sample is placed on the top aperture (4), and the thermocouples (6) are mounted flush to the upper and lower surfaces. An exhaust duct (5) clears the fumes. In order to prevent damage, the maximum temperature is limited to 1050 °C.

2.3.2. Test Facility for Smoke Production and Flaming Particles

The test for smoke production and flaming particles is part of the reaction to fire function and is characterized in the single-burning item test (SBI). The equipment features and test procedure are comprehensively described in BS EN 13823 [13]. In order to obtain the necessary classification parameters, the equipment must be able to quantify the smoke production and visualize flaming droplets.
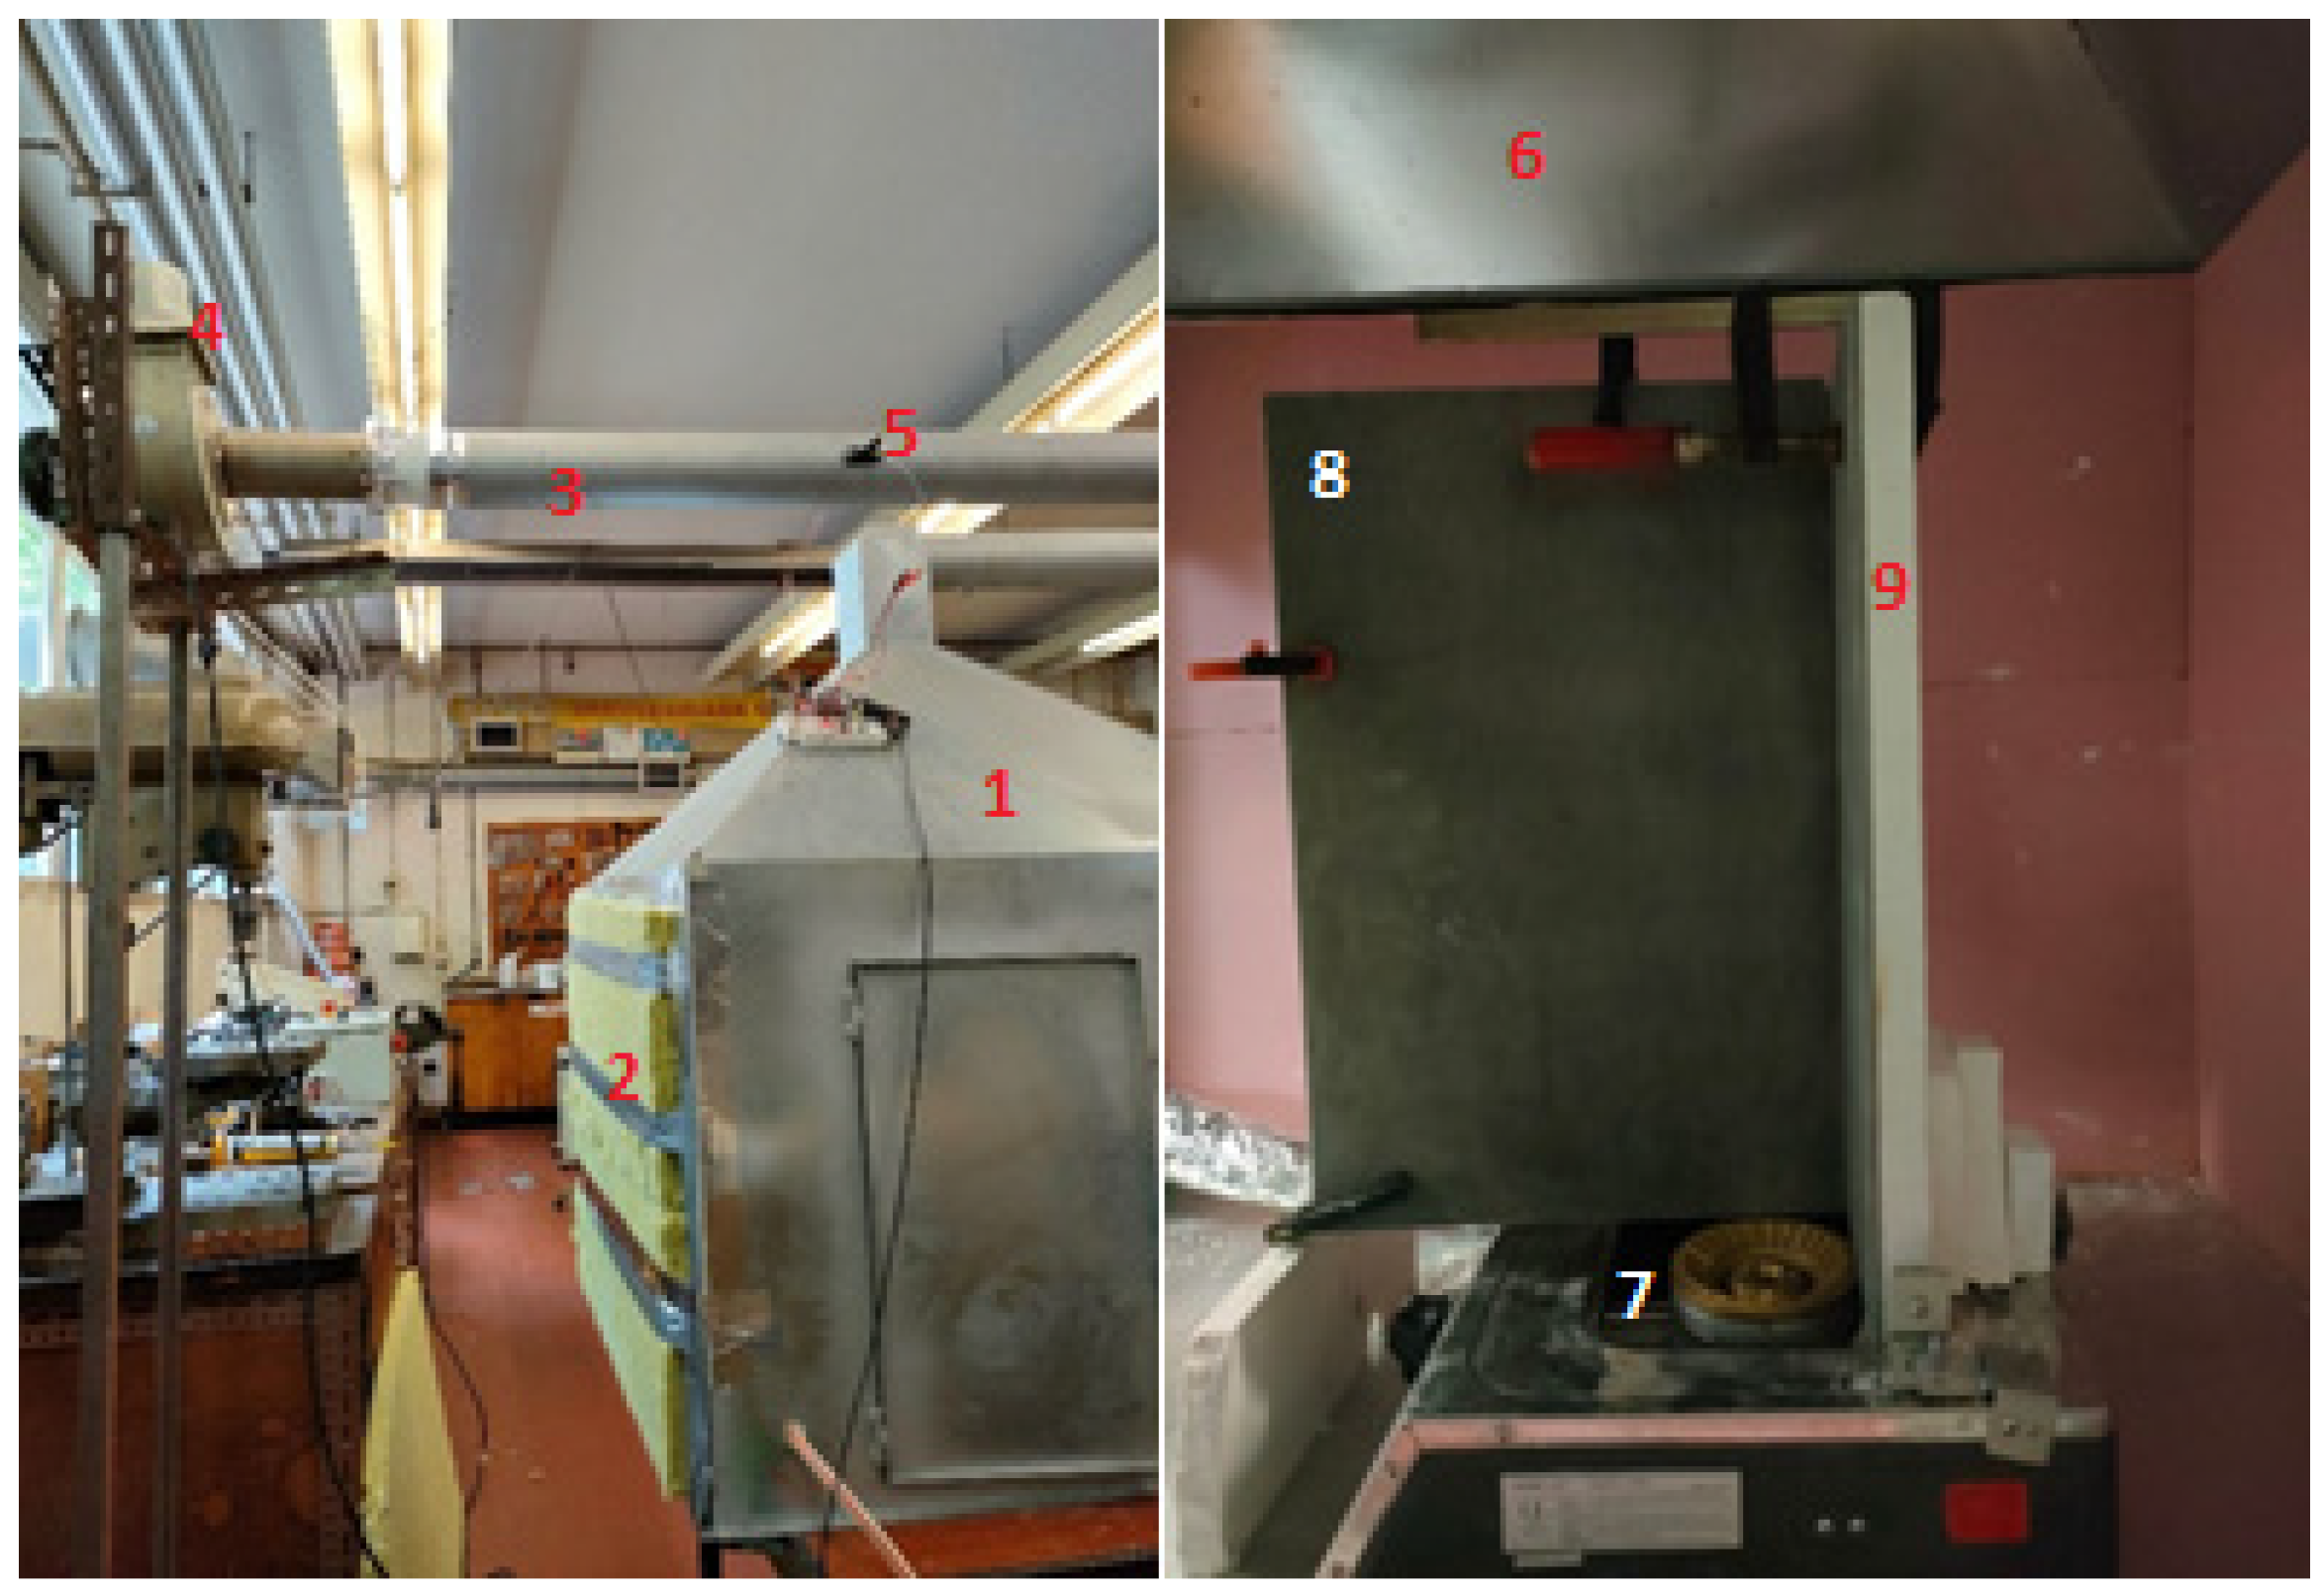
Considering the available space in the laboratory and the need to follow closely the ruling standard, a test facility was designed and built to a 1/3 scale. The sample dimensions, the burner power, and the extraction flow rate were adjusted in order to maintain similarity. The test facility is shown in Figure 2. The testing chamber (1), which contains the specimens, is insulated with rock wool (2), and a layer of ceramic material is applied on the inner wall. The fumes are exhausted through a duct (3) by means of a ventilator (4). In the exhaust duct, a light source and a photo sensor are paced across a diameter (5), enabling the measurement of the smoke concentration. On the inside, the duct (6) collects the smoke generated by the sample (8) that is placed on top of backboards (9). A 4 kW propane burner (7) ignites the samples.

2.3.3. Test Facility for Ignitability

Similar to the smoke production test, the ignitability test is also a criterion for reaction to fire, and its purpose is to measure how easily a product can be ignited. The adopted standard for the test is BS EN ISO 11925-2 [18]. However, the test was carried out in equipment complying with ANSI/UL 94 [14]. The main difference between these standards lies in the specimen dimensions. As for other differences, application angle, and time, the equipment can be adapted in order to do the test with the chosen standard. As such, the specimen dimensions and equipment were used according to ANSI/UL 94 [14], and the test procedure as the parameters evaluated were according to BS EN ISO 11925-2 [18]. Figure 3 depicts the experimental technique. The sample (1) is clamped vertically (2) inside the chamber and is ignited by a gas burner (3) at 45°. The timer (4) controls the duration of the experiment.

3. Results

3.1. Fire Resistance and Thermal Insulation Tests

The results from fire resistance and thermal insulation tests are presented in three groups: uncoated, coated, and commercial.
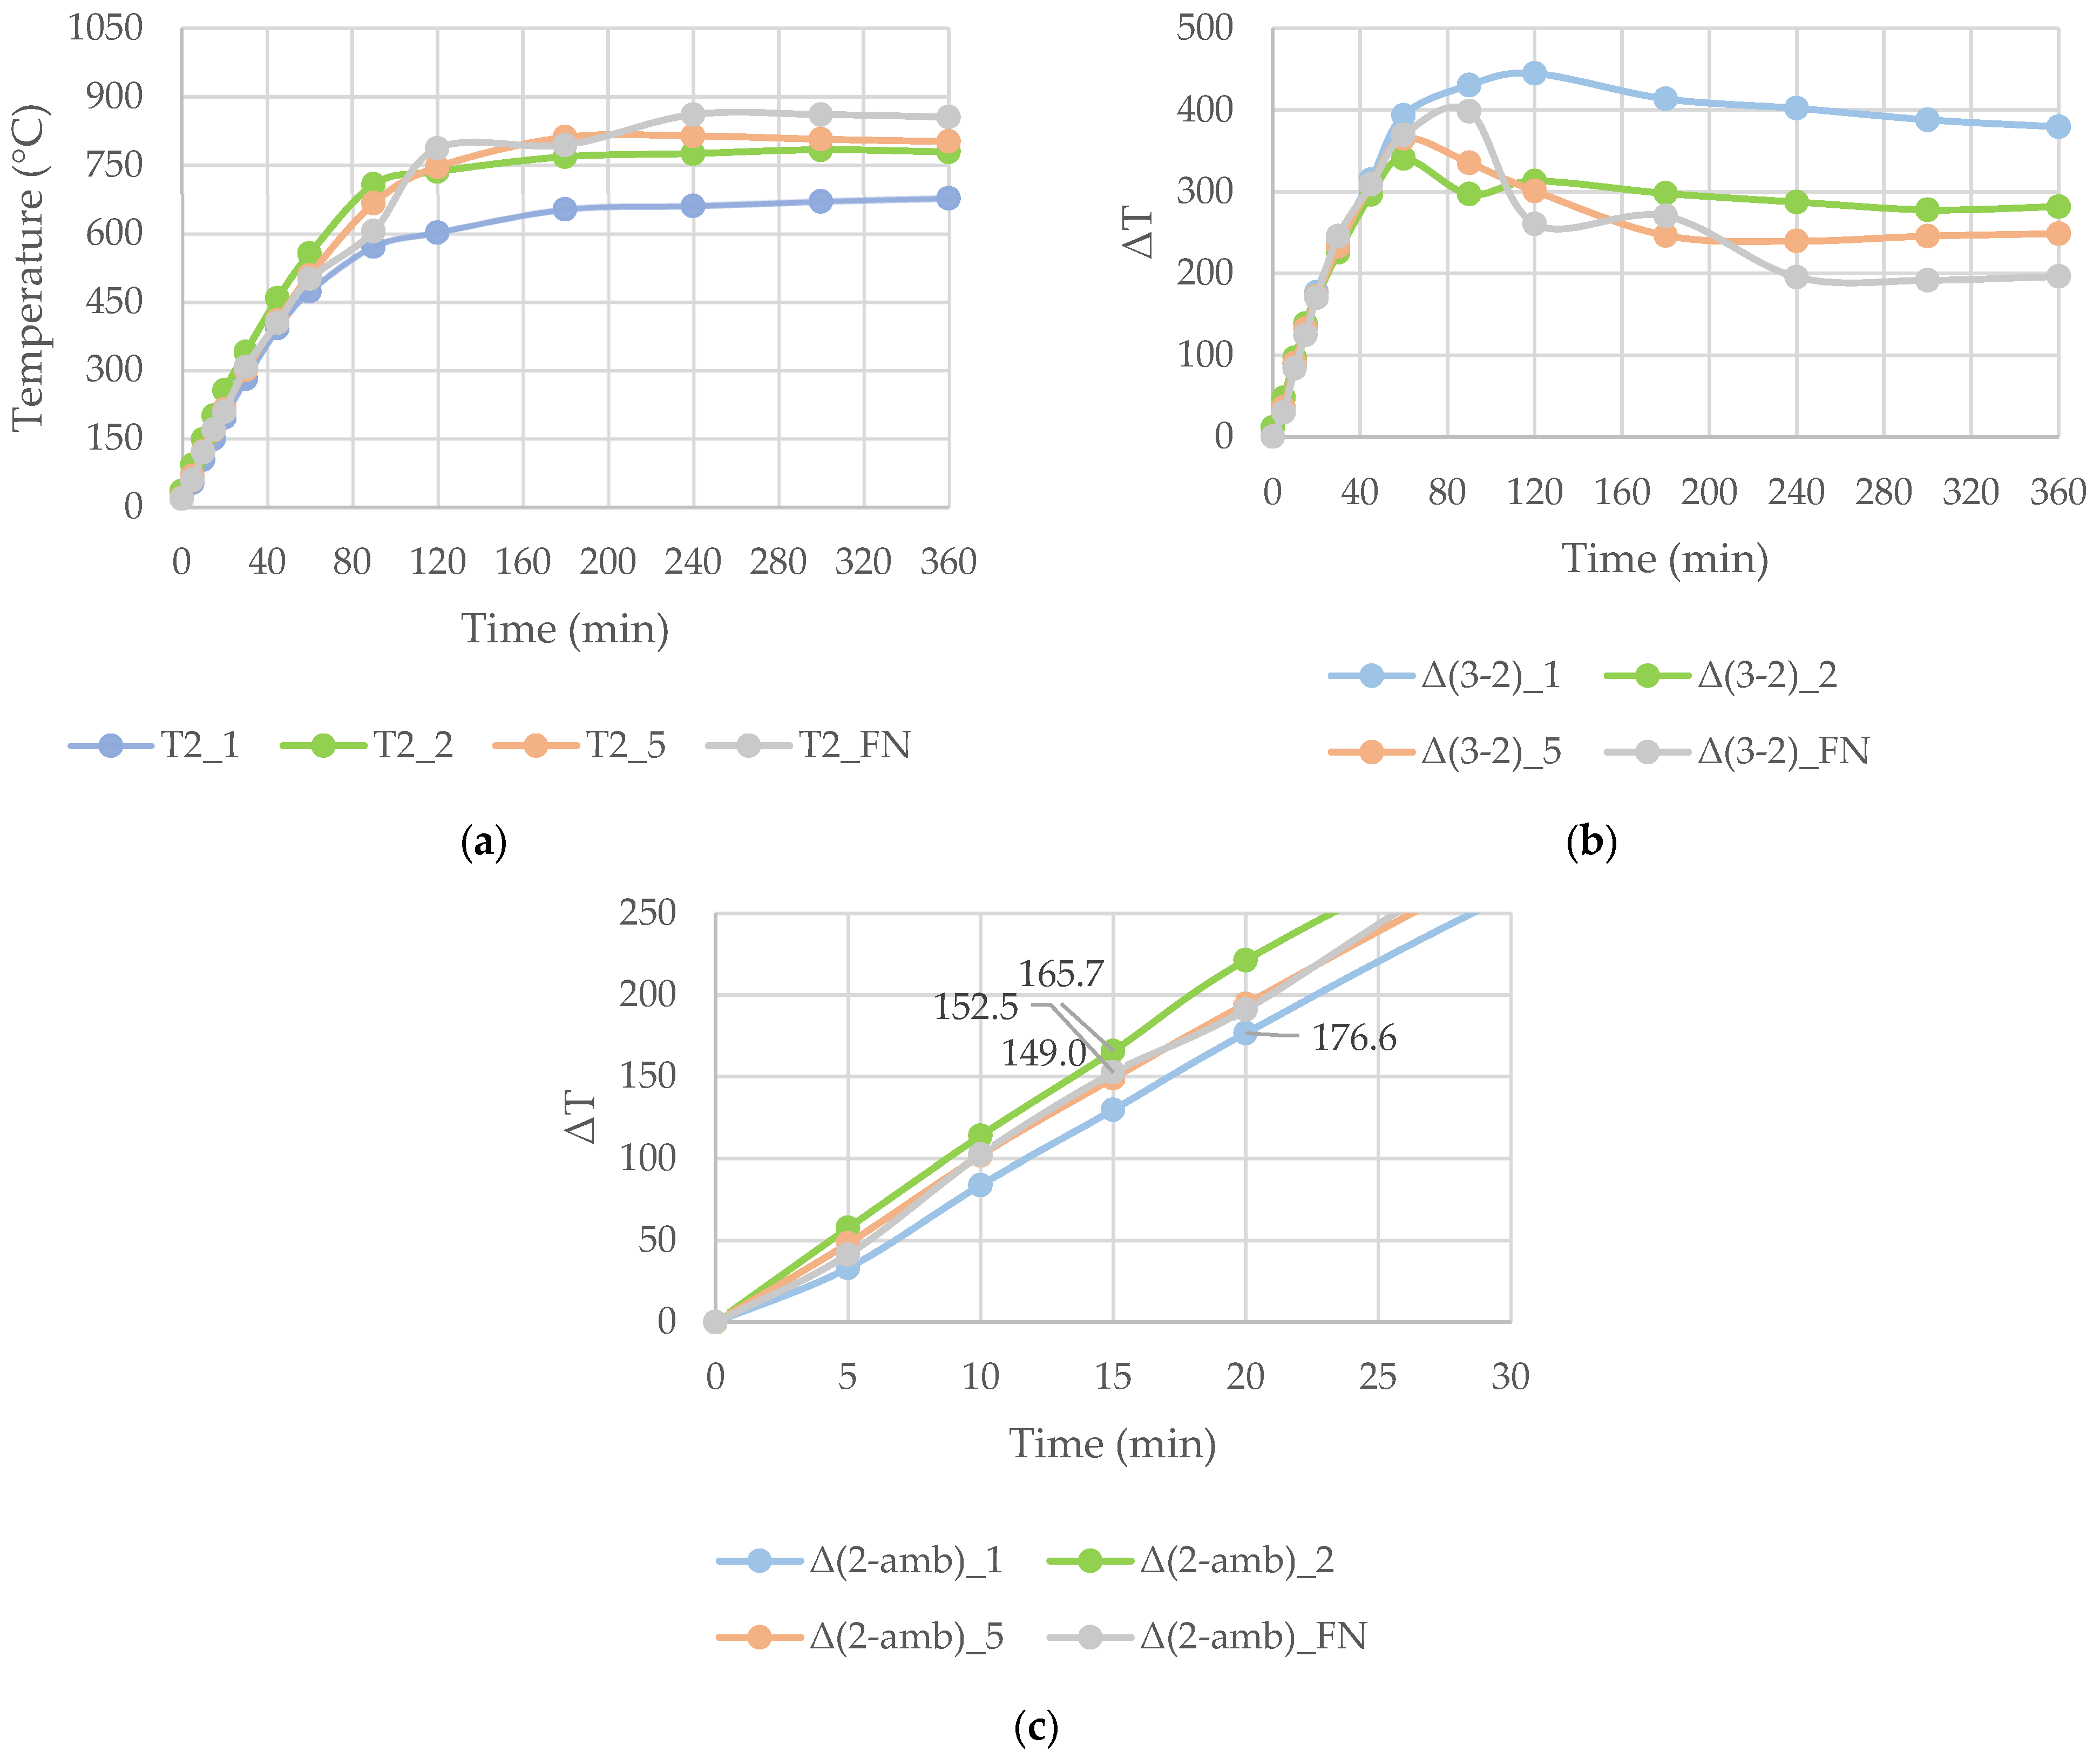
For each group, the results include the outer surface temperature, acquired with the thermocouple T2; the thermal capacity, that is, the difference between the T3 (internal thermocouple of the furnace) and T2; and the thermal insulation according to EN 13501-2 [11]. This evaluates the time it takes for the temperature difference between T2 and the ambient to reach 180 °C. In the graphs, darker colors with triangles represent coated samples, and lighter colors with circles represent uncoated samples.
For each sample, two fire resistance tests were done, and the results were identified by the evaluation parameter and the test sample designation. Due to the limited number of tests, it was decided to use and present the results whose values reproduced the best test conditions.

3.1.1. Uncoated Samples

In Figure 4a, the outer surface temperature of uncoated samples is presented. It is possible to see that in the first 60 min, the four samples had similar behavior with the exception of sample 2, which showed a systematically higher temperature. After this period, sample 1 clearly presented the best performance with the maximum temperature always below 700 °C, while all the others exceeded 750 °C. It is also possible to observe that samples 2_1 and 5_2 showed similar results, with the 2 being slightly better in the last 240 min of the test. Finally, the FN, although with good results in the first 90 min, failed to perform in the latter stages, which was associated with its damage.
The thermal capacity is presented in Figure 4b for the uncoated samples. The higher this difference, the better the fire curtain’s performance, as it would reduce the heat flux to the unexposed side. As for the outer surface temperature, in the first 60 min, the temperature difference was nearly the same for all samples. After this, sample 1 presented the best results, reaching a maximum difference of 445 °C at 120 min and maintaining it around 400 °C all the way to the end. As for the other three samples, the FN performed poorly at 191 °C, and sample 5 was slightly worse than 2 after 90 min. The worst behavior was observed with the FN sample, with a good performance in the first 90 min of the test and rapidly decreasing after that, reaching in the latter stages the lowest difference, around 200 °C.
The thermal insulation for the uncoated samples is shown in Figure 4c. The relevant value for this criterion is the time length with a ΔT below 180 °C. This provides the insulation time reference to the fire curtain. The graph is limited for the 30 min of the test, as the best sample, 1, only held this difference for 20 min with a value of 176.6 °C at this time. All the other samples failed before 15 min, with sample 2 presenting the worst value, having already reached 165.7 °C at this time, and 5 and FN with similar values, 149.0 °C and 152.5 °C, respectively, with 5 achieving the best result of these two.

3.1.2. Coated Samples

In Figure 5a, the outer surface temperature, T2, of the coated samples throughout the test is presented. 1MIX2 showed, arguably, the best performance during the 6 h, with a maximum outer surface temperature of 631.0 °C at the end of the test (360 min). As for the others, in the first 60 min of the test, FNMIX2 had the worst results, being the fastest one to achieve 500 °C, and in this period, 2MIX2 had the best results of the three. However, in the last 240 min of the test, FNMIX2 showed the lowest temperature of these three, with 631.0 °C in the final of the test. The 2MIX2 and 5MIX2 samples achieved similar results during the test, with 5MIX2 being slightly better as it ended with 770.8 °C in comparison with the 792.1 °C for 2MIX2.
The thermal capacity of the coated samples is represented in Figure 5b and as the temperature evolution of the furnace (inner side) is the same for all tests, the trend is similar to that of the outer surface temperature. Sample 1MIX2 had the best result with a maximum temperature difference of 488.1 °C at 90 min, and the others had their maximum of 417 °C for FNMIX2 at this same time, 395.2 °C for the 5MIX2 at 60 min and 393.6 °C for 2MIX2 also at 60 min. In this way, the FNMIX2 was second best with a value close to 1MIX2 at the 240 min mark, while being the worst until the 60 min mark of the test. Regarding the difference between 2MIX2 and 5MIX2, the values were similar all over the test, with 5MIX2 being slightly better overall.
The thermal insulation results for the coated samples are depicted in Figure 5c. The three samples of planar fibrous structure, 1MIX2, 2MIX2, and 5MIX2, complied with EN 13501-2 [11] requirements until approximately 20 min, with a temperature at this time of 156.5 °C, 161.7 °C and 177.8 °C, respectively. As such, these samples could obtain the 20 min reference for the insulation capacity while the sample of three-dimensional fibrous structure type, FNMIX2, only complied for 15 min, with already a relatively high temperature at this point, 171.5 °C.
The best test specimen in this criterion was 1MIX2, followed by 2MIX and 5MIX2, with the worst being the FNMIX2.

3.1.3. Commercial Samples

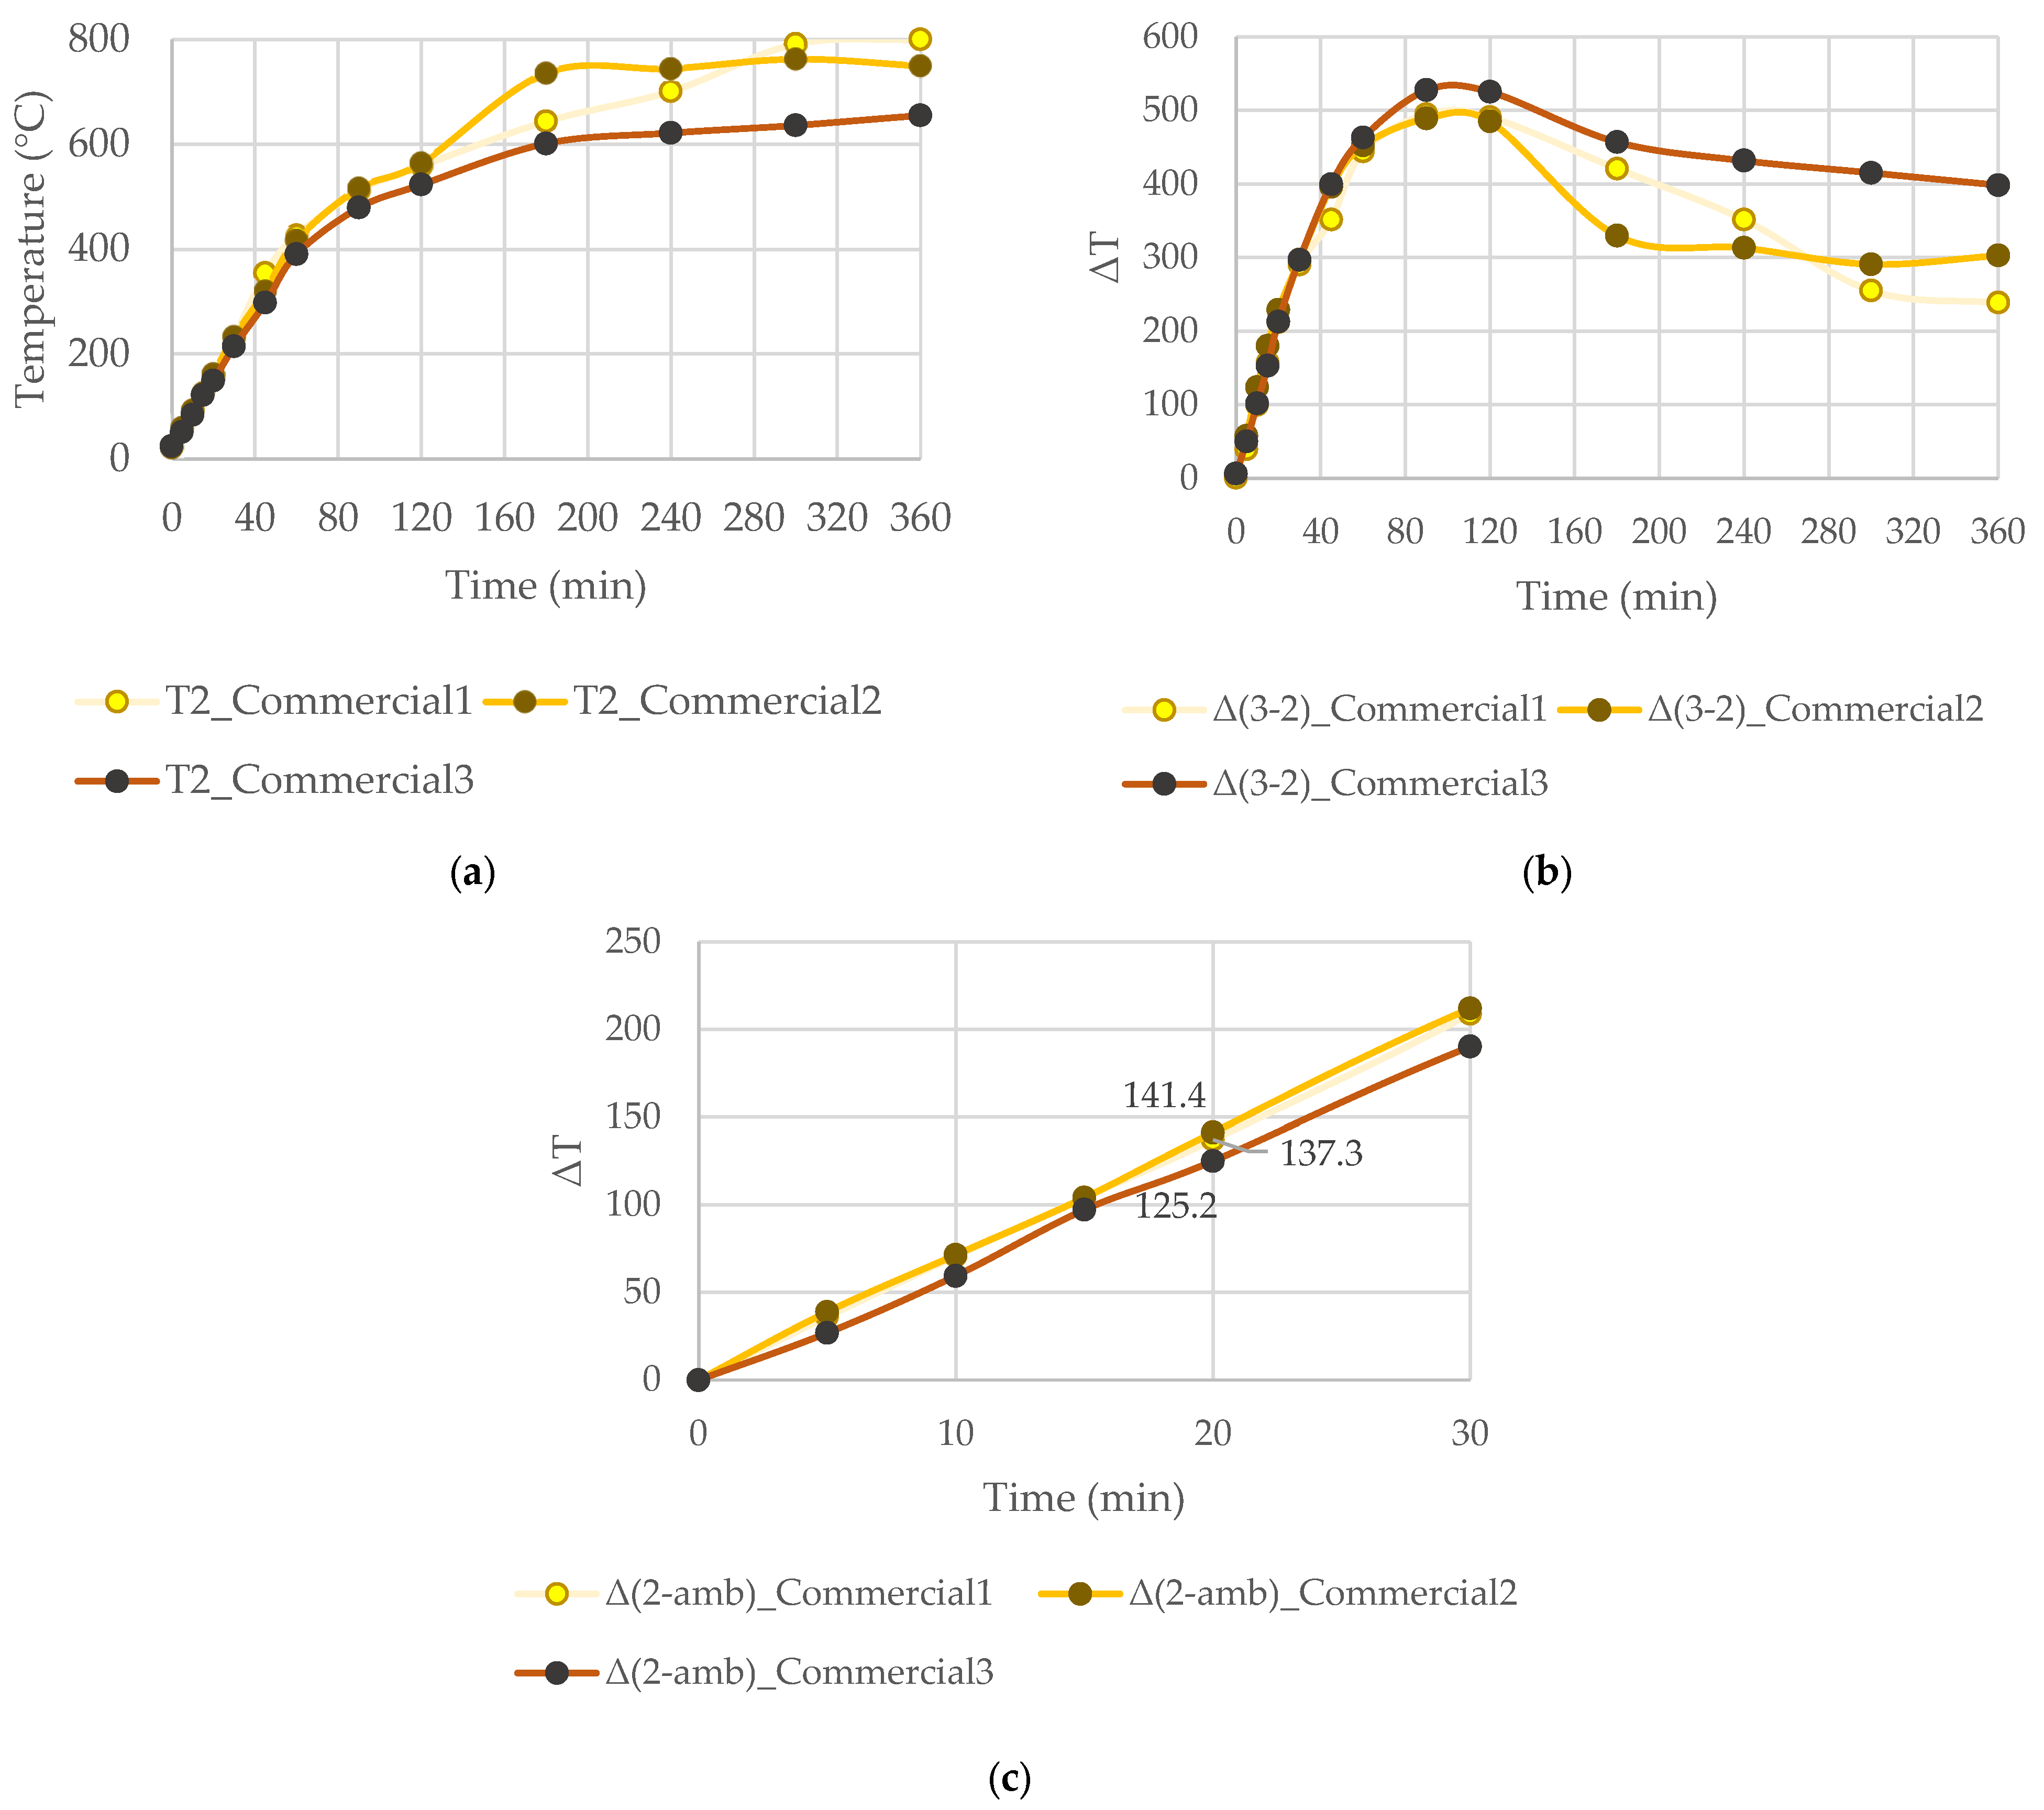
The outer surface temperature (T2) registered for the commercial samples is shown in Figure 6a. Commercial3 exhibited the best performance all over the test, reaching a maximum temperature of 654.9 °C at the end. As for Commercial1 and Commercial2, the first had the lowest outer temperature of these two until 260 min of the test, although there was some damage to the test specimen. In this way, in the final stage of the test, the temperature reached 799.8 °C while Commercial2, with the worst performance up to 240 min, ended at 749.5 °C, a value lower than that for Commercial1.
Regarding the thermal capacity, Figure 6b, a similar trend over time can be observed, with Commercial3 having the largest difference between the outer and inner surface, 527.1 °C at 90 min, Commercial2 at 488.7 °C and Commercial1 at 494.5 °C. However, at the final stage of the test, the Commercial1 sample showed a sharp loss of performance, being the worst.
The thermal insulation is shown in Figure 6c, and all the commercial samples achieve the 20 min certification. Commercial3 can almost achieve the 30 min, having a value of only 125.2 °C at the 20 min, while Commercial1 and Commercial2 have close values of 137.3 °C and 141.4 °C, respectively.

3.2. Ignitability Tests

The parameters recorded during the ignitability test are shown in Table 5. It is possible to see that all samples had perfect scores, except for FNMIX2, as in the edge exposure the flame propagated to the top in 8 s.

3.3. Test Results for Smoke Production and Flamming Particles/Droplets

The results relevant for the smoke production and flaming particles/droplets test are the same as those identified by EN 13823 [13]: (a) average of smoke production rate (SPR_av), (b) total smoke production (TSP), (c) smoke growth rate (SMOGRA(all)), (d) lateral flame spread (LFS) and flaming particles observation, (e) total smoke production for the period of 120 s ≤ t ≤ 720 s (TSP600s), and (f) smoke growth rate index (SMOGRA). As mentioned before, these values are calculated through the procedure from EN 13823 [13].
The results are sorted into uncoated and coated samples so that, as in the other tests, besides the analysis of the different sample types, one can also study the coating performance.
The same color choice as the one for the graphs with the fire resistance test results are applied, with blue for type 1, green for 2, orange for 5, and grey for FN. The results concerning the samples with coating are shown with a darker hue of the same color.
The average smoke production rate graph allows us to understand the smoke production behavior throughout the test while averaging the results so that a smoother expression of the values may be possible. As for the total smoke production graph, the total amount of smoke generated is observed at the different stages of the test.
In the last graph, the smoke growth rate represents the ratio of the specimen’s average smoke production rate and the time of its occurrence. From it, one can infer the growth rate and then calculate its index, an important criterion that, together with the total smoke production in the first 600 s of the main burner exposure, allows for the “s” additional classification according to the standard EN 13501-1 [7].
It should be noted that for the smoke growth rate according to EN 13823 [13] standard, there are two conditions used to calculate these values. One is to calculate only for TSP(t) values greater than 6 m2 and another one for SPR_av greater than 0.1 m2/s. In order to get results for this parameter and compare the different samples, the SPR_av condition was suppressed.

3.3.1. Uncoated Samples

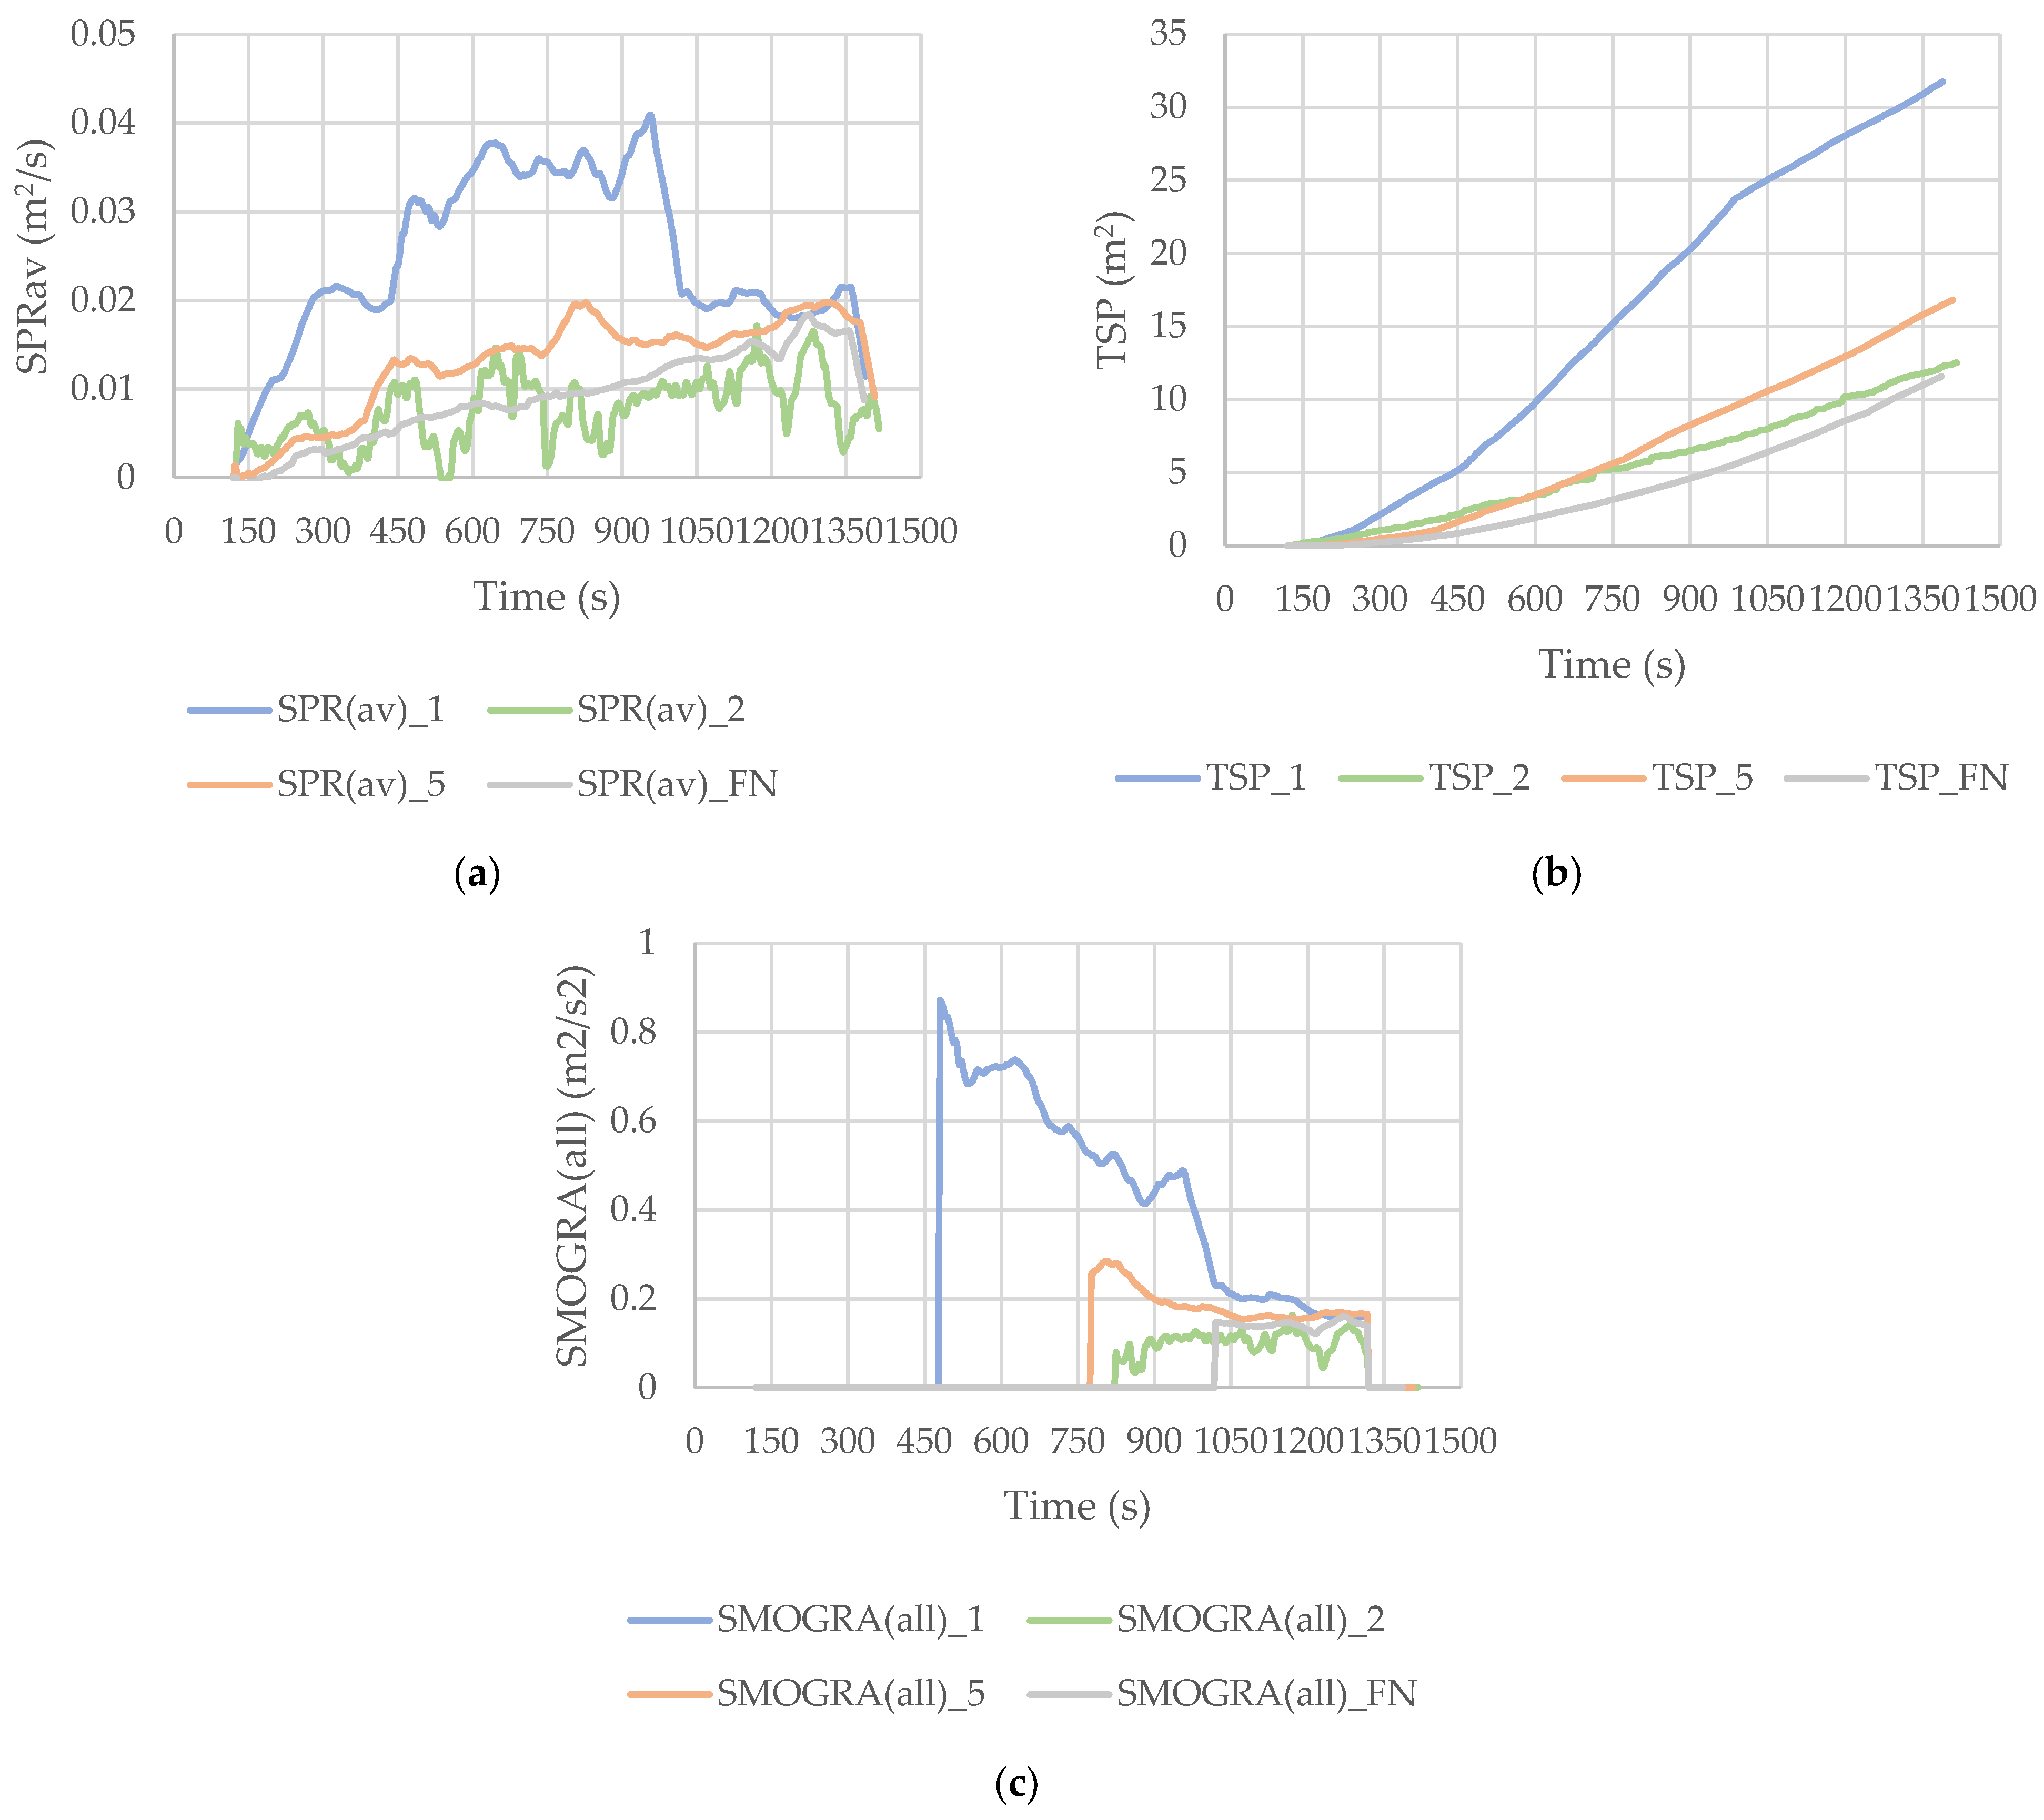
The average smoke production rate of the uncoated samples is shown in Figure 7a. It is possible to observe the high smoke production rate of sample 1 throughout the test in comparison to others, with a maximum of around 0.04 m2/s. With respect to the other samples, the values are close to each one, with 5 being the worst of these, followed by the FN and 2.
For sample 2, even averaged values were very unstable, which may be due to instabilities in the combustion process.
In Figure 7b, the total smoke production of uncoated specimens is shown, with the worst result being that of sample 1, followed by 5, 2, and FN with maximum values of 32 m2, 16 m2, 13 m2, and 11 m2, respectively.
The smoke growth rate of the uncoated samples is presented in Figure 7c. This graph indicates the moment when smoke was detected in the exhaust duct and triggered the detector. The results show that sample 1 was the first to exceed the threshold, at around 470 s, while the same event for samples 5 and 2 occurred at approximately 800 s. Finally, sample FN triggered at 1020 s. At any rate, the results for sample 1 were much higher than for any other, which are very close to each other.

3.3.2. Coated Samples

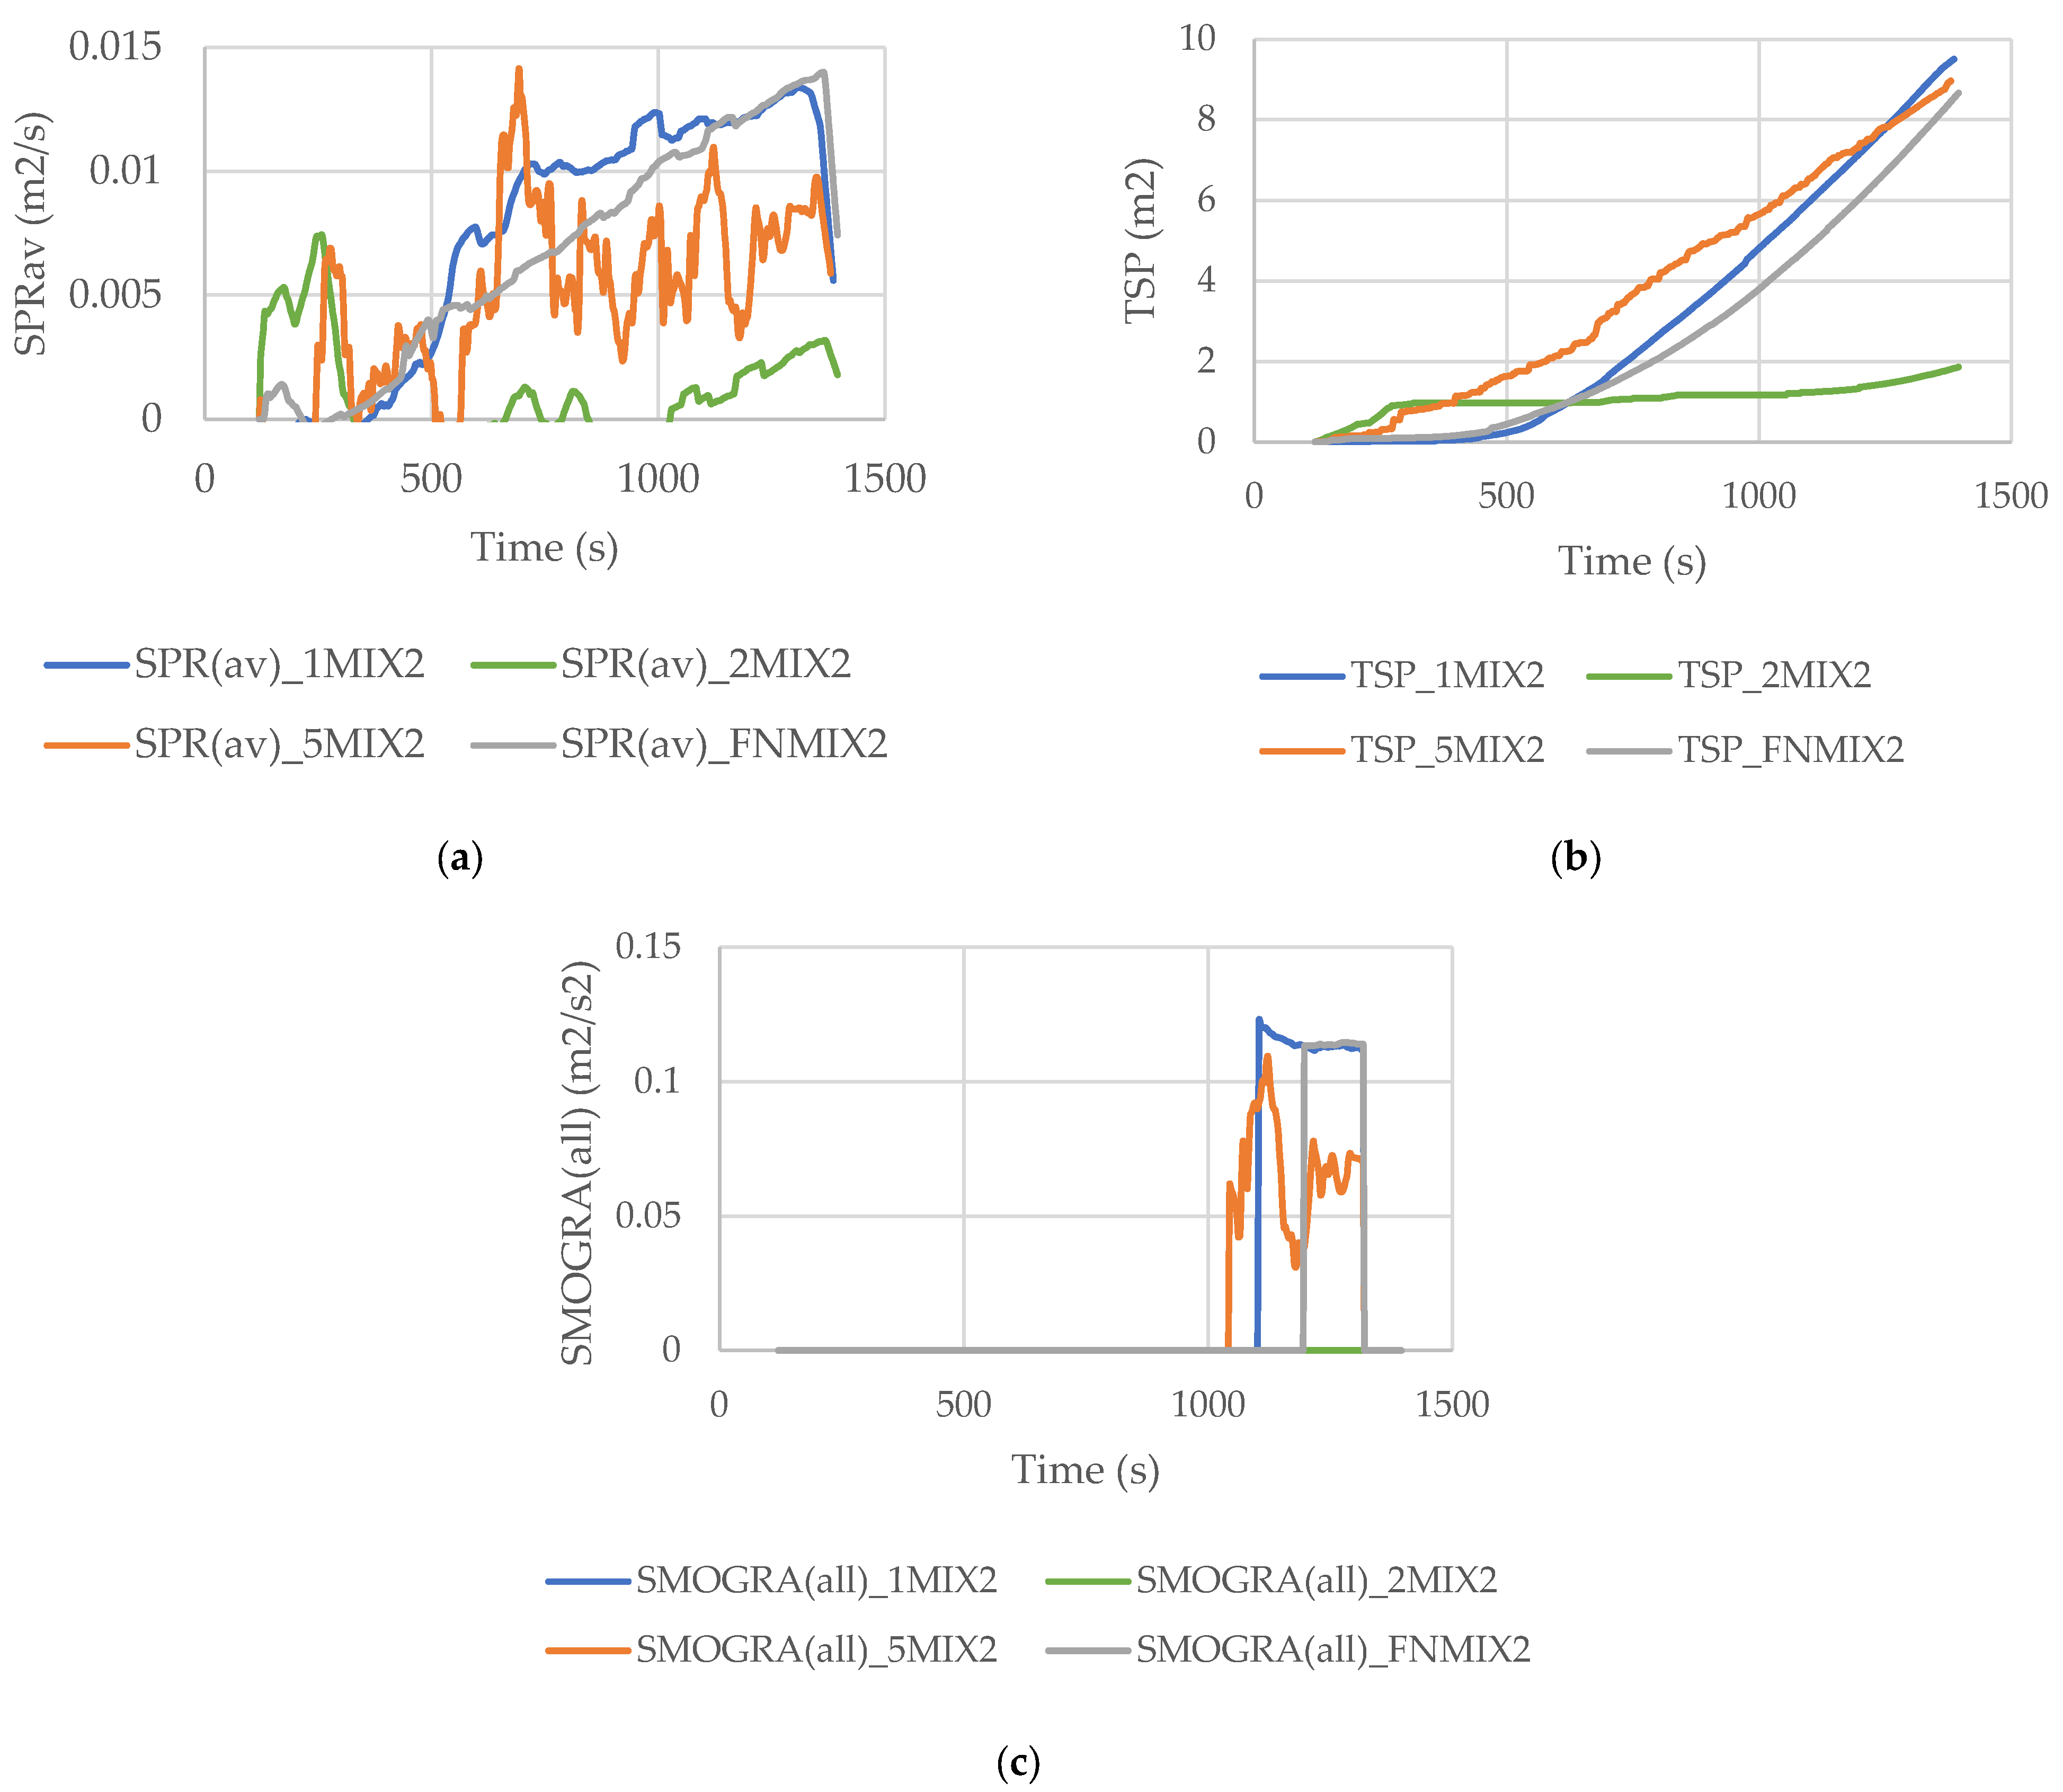
The results for the average smoke production rate are shown in Figure 8a. It is observed that sample 2MIX2 had the best overall behavior in spite of the initial high values. Samples 1MIX2 and FNMIX2 had similar values, with the FNMIX2 being slightly better.
As for the 5MIX2 specimen, the highly unstable results made more difficult the comparison of the results, but it is still possible to observe a better behavior in relation to 1MIX2 and FNMIX2.
Regarding the total smoke production of the coated samples, Figure 8b, such as in the SPRav behavior, 2MIX2 yielded lower values, and 5MIX2 is a little better than FNMIX2. However, 5MIX2 had the worst overall result in the test. The data shows that the worst specimen had a maximum of approximately 9 m2 of total smoke production, while the best had a maximum of just 2 m2.
In Figure 8c, the smoke growth rate for the coated samples is presented. In this case, even suppressing that of the threshold 2MIX2 did not surpass both of them, achieving a value of zero in this parameter. As for 1MIX2 and FNMIX2, the values were very close, but the FNMIX2 only surpassed the threshold 100 s later than 1MIX2. Finally, 5MIX2 presented an unstable behavior but with values always lower than the ones for 1MIX2 and 5MIX2.

4. Discussions and Comparisons

4.1. Discussions of Results

4.1.1. Fire Resistance and Thermal Insulation

This section is divided into five parts. The first presents the results from the uncoated samples, followed by the analysis of the coated samples. The third part concerns the discussion between these two and the effect of the coating. Subsequently, the commercial samples are analyzed, and finally, an overall discussion of the results of the fire resistance and thermal insulation test is presented.
  • Uncoated samples:
Regarding the uncoated samples, the best thermal performance (lowest outer surface temperature, the highest difference between the outer and inner surface temperatures, and longest time until the difference of the outer surface and ambient temperature exceeded 180 °C) of the test specimens is attributed to the sample 1 with a clear advantage over the others. The main difference between this one and the others was in the fabric material, being solely composed of glass fibers. This is an indicator that glass fiber is the best material in terms of fire resistance and thermal insulation. This is explained by the higher emissivity [21] and lower thermal conductivity at high temperatures [22].
With respect to the samples with the addition of the basalt fibers as a reinforcement, samples 2 and 5, the decrease in the thermal performance was evident when compared with sample 1.
Comparing the behavior of samples 2 and 5, there was not a large difference in the results obtained. However, slightly better performance could be observed in the initial part of the test for sample 5, which has 50% basalt fibers plus 50% glass fibers weft threaded. On the contrary, in the final part of the test, sample 2, which has 100% basalt fibers weft threaded, had the best results. This behavior can be explained by the predominant good performance of the glass fibers in the initial stage, yet an effect not so visible in the last stage of the test due to the loss of integrity. In this part, the better mechanical properties granted by basalt fibers are essential to maintain the integrity of the fabric structure and explain the slightly better performance for the sample with more basalt fibers, the 2, in the last part of the test.
As for the FN, good thermal resistance was observed in the first 90 min of the test, followed by a rapidly declining performance until the end, obtaining the worst results. This is due to the SMM wires’ deformation. In fact, while the glass fibers held their position, their performance was guaranteed by them. However, with the deformation of the SMM wires after 100 °C, openings started to appear in the fabric, pushing the threaded glass fibers beyond their limit, thus greatly contributing to the damage of the sample at high temperatures.
  • Coated samples:
As the difference between the uncoated and the coated samples was the coating application, the thermal behavior between them was expected to be the same, with the exception of the qualitative parameters. This happened to be true for the best-performing sample, 1MIX2, where a large difference could be seen in comparison to the others. However, the difference between samples 2 and 5 was even smaller than without the coating. Nonetheless, sample 5 ended up with a slightly better result than sample 2, an unexpected behavior taking into consideration their performance when uncoated. The expected higher integrity conferred by a higher percentage of basalt fibers did not translate into the best performance for sample 2 in comparison to sample 5 at the end of the test. Nevertheless, at this final stage of the test the difference between them started to diminish, with the sample 2 coming very close to the sample 5 results. Thus, if the test had a longer duration, it would be reasonable to assume that sample 2 could end up with better performance than 5.
The largest difference when compared with the uncoated samples was observed for the sample with the SMM wires, FNMIX2, where good results were observed throughout the test with the exception of the first 60 min. This can be explained by the presence of a coating that did not allow the movement of the SMM wires. This lack of deformation, although it prevented the formation of the desired air pockets, had a beneficial effect on the performance of the fabric as the SMM wires did not shred the glass fibers, which was a feature in the uncoated sample. However, during the early stage of the test, the relatively poor performance can be explained by the method of application of the coating on the fabric. The manual application of the coating caused a non-uniform distribution of the coating through the fabric and may have influenced this first part of the test when the service temperature was below 200 °C.
  • Coating performance:
As expected, the coating positively influenced the samples’ performance. Between samples 1 and 1MIX2, it is even possible to observe a difference of approximately 50 °C during the last 270 min of the test.
Even with the service temperature being approximately 200 °C, the performance was improved all over the test. The lower damage at the beginning of the test due to the protection guaranteed by the coating allowed for a longer period of the integrity of the test specimen, thus prolonging the action of the fabric.
The main differences observed with the coating application are identified in the qualitative parameters of the test. The parameters of color change, smell, smoke, and weight loss had large differences in the values obtained, especially for the smoke and the weight loss percentage. This indicates that the largest percentage of the total weight lost by the test specimen belongs to the coating and that the smoke produced at an earlier time of the test was caused mainly by the deterioration of the coating.
  • Commercial samples:
The commercial samples showed a behavior that is in agreement with that already outlined for the developed samples. So, the two main explanations for the improvement of the performance from Commercial1 to Commercial2 and, finally, to Commercial3, are the introduction of the reinforcement fibers and the coating application. The reinforcement fibers helped maintain the integrity of the specimen until the end of the test so that the fabric could maintain its function. As for the applied coating, an overall better performance was also observed. With the application of the coating, it was once more noticed that there was a high weight loss, proving that most of the weight loss came from the coating and that the early smoke is also caused by this element.
  • Overall analysis:
The results for the fire resistance and thermal insulation tests are explained by the fabric materials, the fibrous structure, and the coating application.
Glass fibers improved the fire resistance and thermal insulation due the reduction in thermal conductivity with temperature and a higher emissivity when compared with basalt fibers.
Basalt fibers maintained the fabric’s integrity during longer due to their better mechanical properties at high temperatures.
The deformation of the SMM wires, introduced to create a 3D near-net-shape fibrous structure, damaged the fabric by pushing aside the threaded fibers, thus creating openings.
The application of the coating contributed to an overall improvement of the product and gave origin to a small amount of smoke at an earlier stage and mass loss.

4.1.2. Ignitability

The results show that the samples were non-flammable as they were neither damaged nor ignited. This is an expected behavior due to the properties of the glass fiber that are non-combustible. In terms of the difference in relation to the coating on the samples, the result of the flame application was more visible as the coating burned, and, for the edge flame attack in FNMIX2, the flame traveled to the top of the test specimen. However, the flame did not actually propagate through the fabric; instead, it just burned through the coating, thus not damaging the fabric. This behavior was due to the way the coating was applied in this sample. In fact, as the SMM presence did not allow the normal application procedure, the coating was applied with less uniformity through the fabric, which facilitated flame propagation through the sample.

4.1.3. Smoke Production and Flaming Particles/Droplets

This section is organized into three parts. The first presents the results from the uncoated samples, followed by the analysis of the coated samples. Finally, the third part concerns the discussion about the coating performance.
For the smoke growth rate results analysis, it is necessary to keep in mind that there are thresholds in the calculations. So, the data presented are only those which exceed them, with the exception of SPRav(t) > 0.1 m2/s because, if this were to be considered, the amount of data would be too small, which would limit the scope for discussion.
Uncoated samples:
Amongst the uncoated samples, it is noticeable the poor result of sample 1 (worst), which was constituted only by glass fibers. On the contrary, FN, which was constituted of glass fiber at warp and weft but with the addition of SMM fibers, showed the best results. This behavior may be explained by the severe deformation of the FN sample, which prevented the direct flame application throughout the whole test. As for the samples with basalt, 2 and 5, better results were obtained when compared with sample 1. This indicates a possible advantage of the basalt fibers. In agreement with this, slightly better results were obtained for 2, that with 100% basalt fibers at the weft, in comparison to 5, with 50% glass fibers plus 50% basalt fibers at the weft. This observation for the basalt may be due to the characteristics of the fabric production as different chemicals may be added to the basalt fibers and to the glass fibers to improve the workability. This will result in a difference in the smoke production between them.
Coated samples:
With the data for coated samples, the analysis is not as linear as for the uncoated ones. Nevertheless, the best sample was the 2MIX2, which even achieved a SMOGRA index of zero. As such, the conclusion could be similar to the uncoated ones with respect to the lower amount of smoke caused by the basalt fibers. However, the poor result of sample 5MIX2 for the total smoke produced in the first 600 s of exposure, makes it difficult to conclude that. Yet, due to such unstable data obtained for the sample 5MIX2, it is difficult to prove such a comparison. Nonetheless, the conclusions are still the same for the smoke production rate and smoke growth rate, where 5MIX2 had the second-best value, right next to 2MIX2.
Regarding the instabilities observed with the 5MIX2 test, the cause may also be attributed to the combustion process. In addition, the light transmission and detection system could play a part in such observations.
Samples 1MIX2 and FNMIX2 produced results in close proximity. This was expected because both had similar composition in respect to the use of glass fibers. Nevertheless, FNMIX2 yielded the best values of the two, as result of the deformation of SMM fibers in the test specimen. This did not allow the correct measurement throughout the whole test, even with the sample staying rightly clamped in the corner. This deformation also allowed the flame to spread laterally.
Coating performance:
With respect to the coating performance, it can be seen that, unlike what one would expect, all of the values obtained for the coating samples were lower than those from the uncoated ones.
Bearing in mind the fire resistance test results, it was expected that the smoke caused by the coating disintegration would be noticeable and have a negative effect on the test. However, that did not happen, and the smoke production due to the coating was lower, with a very small period of production. This did not cause any noticeable result, and the coating may even have prevented the production of a large amount of smoke from the test specimen causing the differences observed, thus improving the results in these tests.
The only noticeable negative effect of the coating application in this test was allowing the flame to spread further by propagating throughout the coating itself, as it happened in the ignitability test.

4.2. Comparative Analysis

In order to grade the designed solutions by their performance and decide the most promising, so that they may proceed to certification and enter the fire curtains market, a tool is necessary capable of gathering all the results and differentiating them by their importance. To do so, first, all the tests on the fire curtains samples, including some for mechanical performance, were gathered, and the most important evaluation criteria were defined for each one. Then, a weight for each test was discussed and attributed, considering the importance of each criterion for the fire curtain designation and performance.
From the discussion, more weight was attributed to the tests related to thermal behavior, with a special emphasis on that responsible for fire curtains characterization, giving a total of 0.65. This was split into 0.45 for the fire resistance and thermal insulation, 0.10 for the ignitability, and an additional 0.10 to smoke production. All the other experiments, of mechanical and heat performance, were valued at 0.20 and 0.15, respectively.
With all this, a weight decision tree was created, that made it possible to calculate the weight of each evaluation parameter according to its importance within the test and the weight of it in relation to the others experiments.
Finally, a classification of the fire curtains samples, from 1 to 8 (because there are 8 samples), for each evaluation parameter was given, and this value was multiplied by the respective weight. The completed matrix, with the weight and ranking, allowed us calculating the final sum for each sample. These values can be seen in Table 6.
The best sample for fire curtains was 1MIX2, followed by 2MIX2 and 5MIX2 with the best values by far in relation to the others.

5. Conclusions

The thermal behavior characterization of fire curtain structures was used to evaluate the performance of new innovative fire curtains, based on the utilization of a special coating and possible use of basalt fibers reinforcement, depending on the desired attribute, of insulation or integrity. Based on the work done on the development of fire curtains application, several conclusions can be drawn.
The glass fiber provided good fire resistance together with better thermal insulation than basalt fibers. This advantage is a direct consequence of the lower thermal conductivity at high temperatures [22], and the higher emissivity of glass fibers [21]. However, the smoke production is increased with its use, which may be the result of additives used to facilitate the weaving.
The combination of glass and basalt fibers did not present significant improvements in the thermal behavior, with the possibility that the low emissivity of the basalt fibers was the dominant factor for this parameter.
The SMM fibers were used with the purpose of creating a 3D fibrous structure with individual air pockets that would be used to reduce heat transfer, thus improving thermal insulation capacity. However, in all the tests made, the deformation of the SMM did not work as planned, damaging the fabric in the fire resistance test by pushing apart the glass fibers. This chain of events pushed the structure out of the mounting position in the smoke production test and not producing any advantage in the ignitability test. Overall, the expected effect of the air pockets on the thermal behavior could not be properly evaluated due to the wires’ excessive deformation.
The application of a fiber coating extended its integrity, hence increasing the thermal insulation ability of the fabric.
With the comparison between the fire curtains developed in this work and the commercially available (Commercial), it was possible to observe the small difference between their thermal performance. The increasing of features observed throughout each of the three Commercial curtains also resulted in an increase in performance. With only the fabric in mind, the results indicated a better performance for sample 1 in relation to Commercial1, which supports the choices made to the fabric itself. However, with the steel fibers and coating application, Commercial3 surpassed sample Commercial2, which indicates that improvements in the coating could be studied so that a greater difference may be obtained from its application.

Author Contributions

Conceptualization, C.V. and D.S. (Delfim Soares); methodology, C.P. and R.F.; validation, E.S. and D.S. (Dionísio Silveira); investigation, D.C., J.B. and D.R.; writing—original draft preparation, D.C., J.B. and D.R.; writing—review and editing, C.V., D.S. (Delfim Soares), R.F. and C.P.; funding acquisition, C.V.; supervision, C.V., D.S. (Delfim Soares) and E.S. All authors have read and agreed to the published version of the manuscript.

Funding

This work was co-financed by Compete 2020, Portugal 2020, and the European Union through the European Regional Development Fund—FEDER within the scope of the project ThermFire4Woven—Development of advanced fibrous structures with fibrous surface treatments and coatings with high thermal efficiency and flame resistance for high value-added applications (POCI-01-0247-FEDER-033637). This work was supported by FCT within the Projects Scope UIBD/EMS/04077/2020 (METRICS); UIDB/04436/2020 (CMEMS); UIDB/05256/2020 (IPC); UIDP/05256/2020 (IPC); UID/CTM/00264/2021 (2C2T) and UIDP/00264/2020 (2C2T).

Data Availability Statement

Not applicable.

Conflicts of Interest

The authors declare no conflict of interest.

References

  1. Brushlinsky, N.; Sokolov, S.; Hall, J.; Wagner, P. World Fire Statistics—Report No 10 Second Edition; World Fire Statistics: Ljubljana, Slovenia, 2005. [Google Scholar]
  2. Mróz, K.; Hager, I.; Korniejenko, K. Material Solutions for Passive Fire Protection of Buildings and Structures and Their Performances Testing. Procedia Eng. 2016, 151, 284–291. [Google Scholar] [CrossRef] [Green Version]
  3. Kilinc, F.S. Handbook of Fire Resistant Textiles; Woodhead Pub: Cambridge, UK, 2013. [Google Scholar]
  4. Nedryshkin, O.; Gravit, M.; Lyapin, A.; Voronin, V. Overview of fire curtains in construction. MATEC Web Conf. 2016, 86, 04052. [Google Scholar] [CrossRef] [Green Version]
  5. Nikitina, M.; Ustinov, A.; Kiseleva, V.; Babikov, I. New fire retardant compositions for fire-resistant automatic curtains. MATEC Web Conf. 2018, 245, 11004. [Google Scholar] [CrossRef]
  6. Horrocks, A.R. Technical fibres for heat and flame protection. In Handbook of Technical Textiles: Technical Textile Applications; Woodhead Pub: Cambridge, UK, 2016; pp. 237–270. [Google Scholar]
  7. BS EN 13501-1:2007+A1:2009; Fire Classification of Construction Products and Building Elements—Part 1: Classification Using Data from Reaction to Fire Tests. British Standards Institution: London, UK, 2009.
  8. BS 476-20:1987; Fire Tests on Building Materials and Structures—Part 20: Method for Determination of the Fire Resistance of Elements of Construction (General Principles). British Standards Institution: London, UK, 1987.
  9. BS EN 1634-3:2001; Fire Resistance Tests for Door and Shutter Assemblies—Part 3: Smoke Control Doors and Shutters. British Standards Institution: London, UK, 2001.
  10. BS EN 1634-1:2014+A1:2018; Fire Resistance and Smoke Control Tests for Door and Shutter Assemblies, Openable Windows and Elements of Building Hardware—Part 1: Fire Resistance Test for Door and Shutter Assemblies and Openable Windows. British Standards Institution: London, UK, 2018; p. 38.
  11. BS EN 13501-2:2003; Fire Classification of Construction Products and Building Elements—Part 2: Classification Using Data from Fire Resistance Tests, Excluding Ventilation Services. British Standards Institution: London, UK, 2003.
  12. DIN EN 1363-1:2012; Fire Resistance Tests—Part 1: General Requirements. British Standards Institution: London, UK, 2012.
  13. BS EN 13823:2010+A1:2014; Reaction to Fire Tests for Building Products—Building Products Excluding Floorings Exposed to the Thermal Attack by a Single Burning Item. British Standards Institution: London, UK, 2014.
  14. ANSI/UL 94:2014; Tests for Flammability of Plastic Materials for Parts in Devices and Appliances. American National Standards Institute: New York, NY, USA, 2014.
  15. BS EN 13501-4:2007+A1:2009; Fire Classification of Construction Products and Building Elements—Part 4: Classification Using Data from Fire Resistance Tests on Components of Smoke Control Systems. British Standards Institution: London, UK, 2009.
  16. EN ISO 1182:2020; Reaction to Fire Tests for Products—Non-Combustibility Test. International Organization for Standardization: Geneva, Switzerland, 2020.
  17. EN ISO 1716:2018; Reaction to Fire Tests for Products—Determination of the Gross Heat of Combustion (Calorific Value). International Organization for Standardization: Geneva, Switzerland, 2018.
  18. BS EN ISO 11925-2:2010; Reaction to Fire Tests—Ignitability of Products Subjected to Direct Impingement of Flame—Part 2: Single-Flame Source Test. British Standards Institution: London, UK, 2010.
  19. Li, X.; Yang, Z.; Yao, J.; Zhang, Y. Organic Nano-Montmorillonite for Simultaneously Improving the Flame Retardancy, Thermal Stability, and Mechanical Properties of Intumescent Flame-Retardant Silicone Rubber Composites. J. Macromol. Sci. Part B 2015, 54, 1282–1296. [Google Scholar] [CrossRef]
  20. Giessmann, A. Foulard technology and impregnation or double-side coating without edge coating. Coating 2008, 41, 2–5. [Google Scholar]
  21. Bhat, T.; Chevali, V.; Liu, X.; Feih, S.; Mouritz, A.P. Fire performance of basalt fibre composites under tensile loading. In Proceedings of the 16th European Conference on Composite Materials, ECCM 2014, Seville, Spain, 22–26 June 2014. [Google Scholar]
  22. Benichou, N.; Sultan, M. Fire Resistance of Lightweight Wood-Framed Assemblies: State-of-the-Art Report; Institute for Research in Construction: Ottawa, ON, Canada, 1999. [Google Scholar]
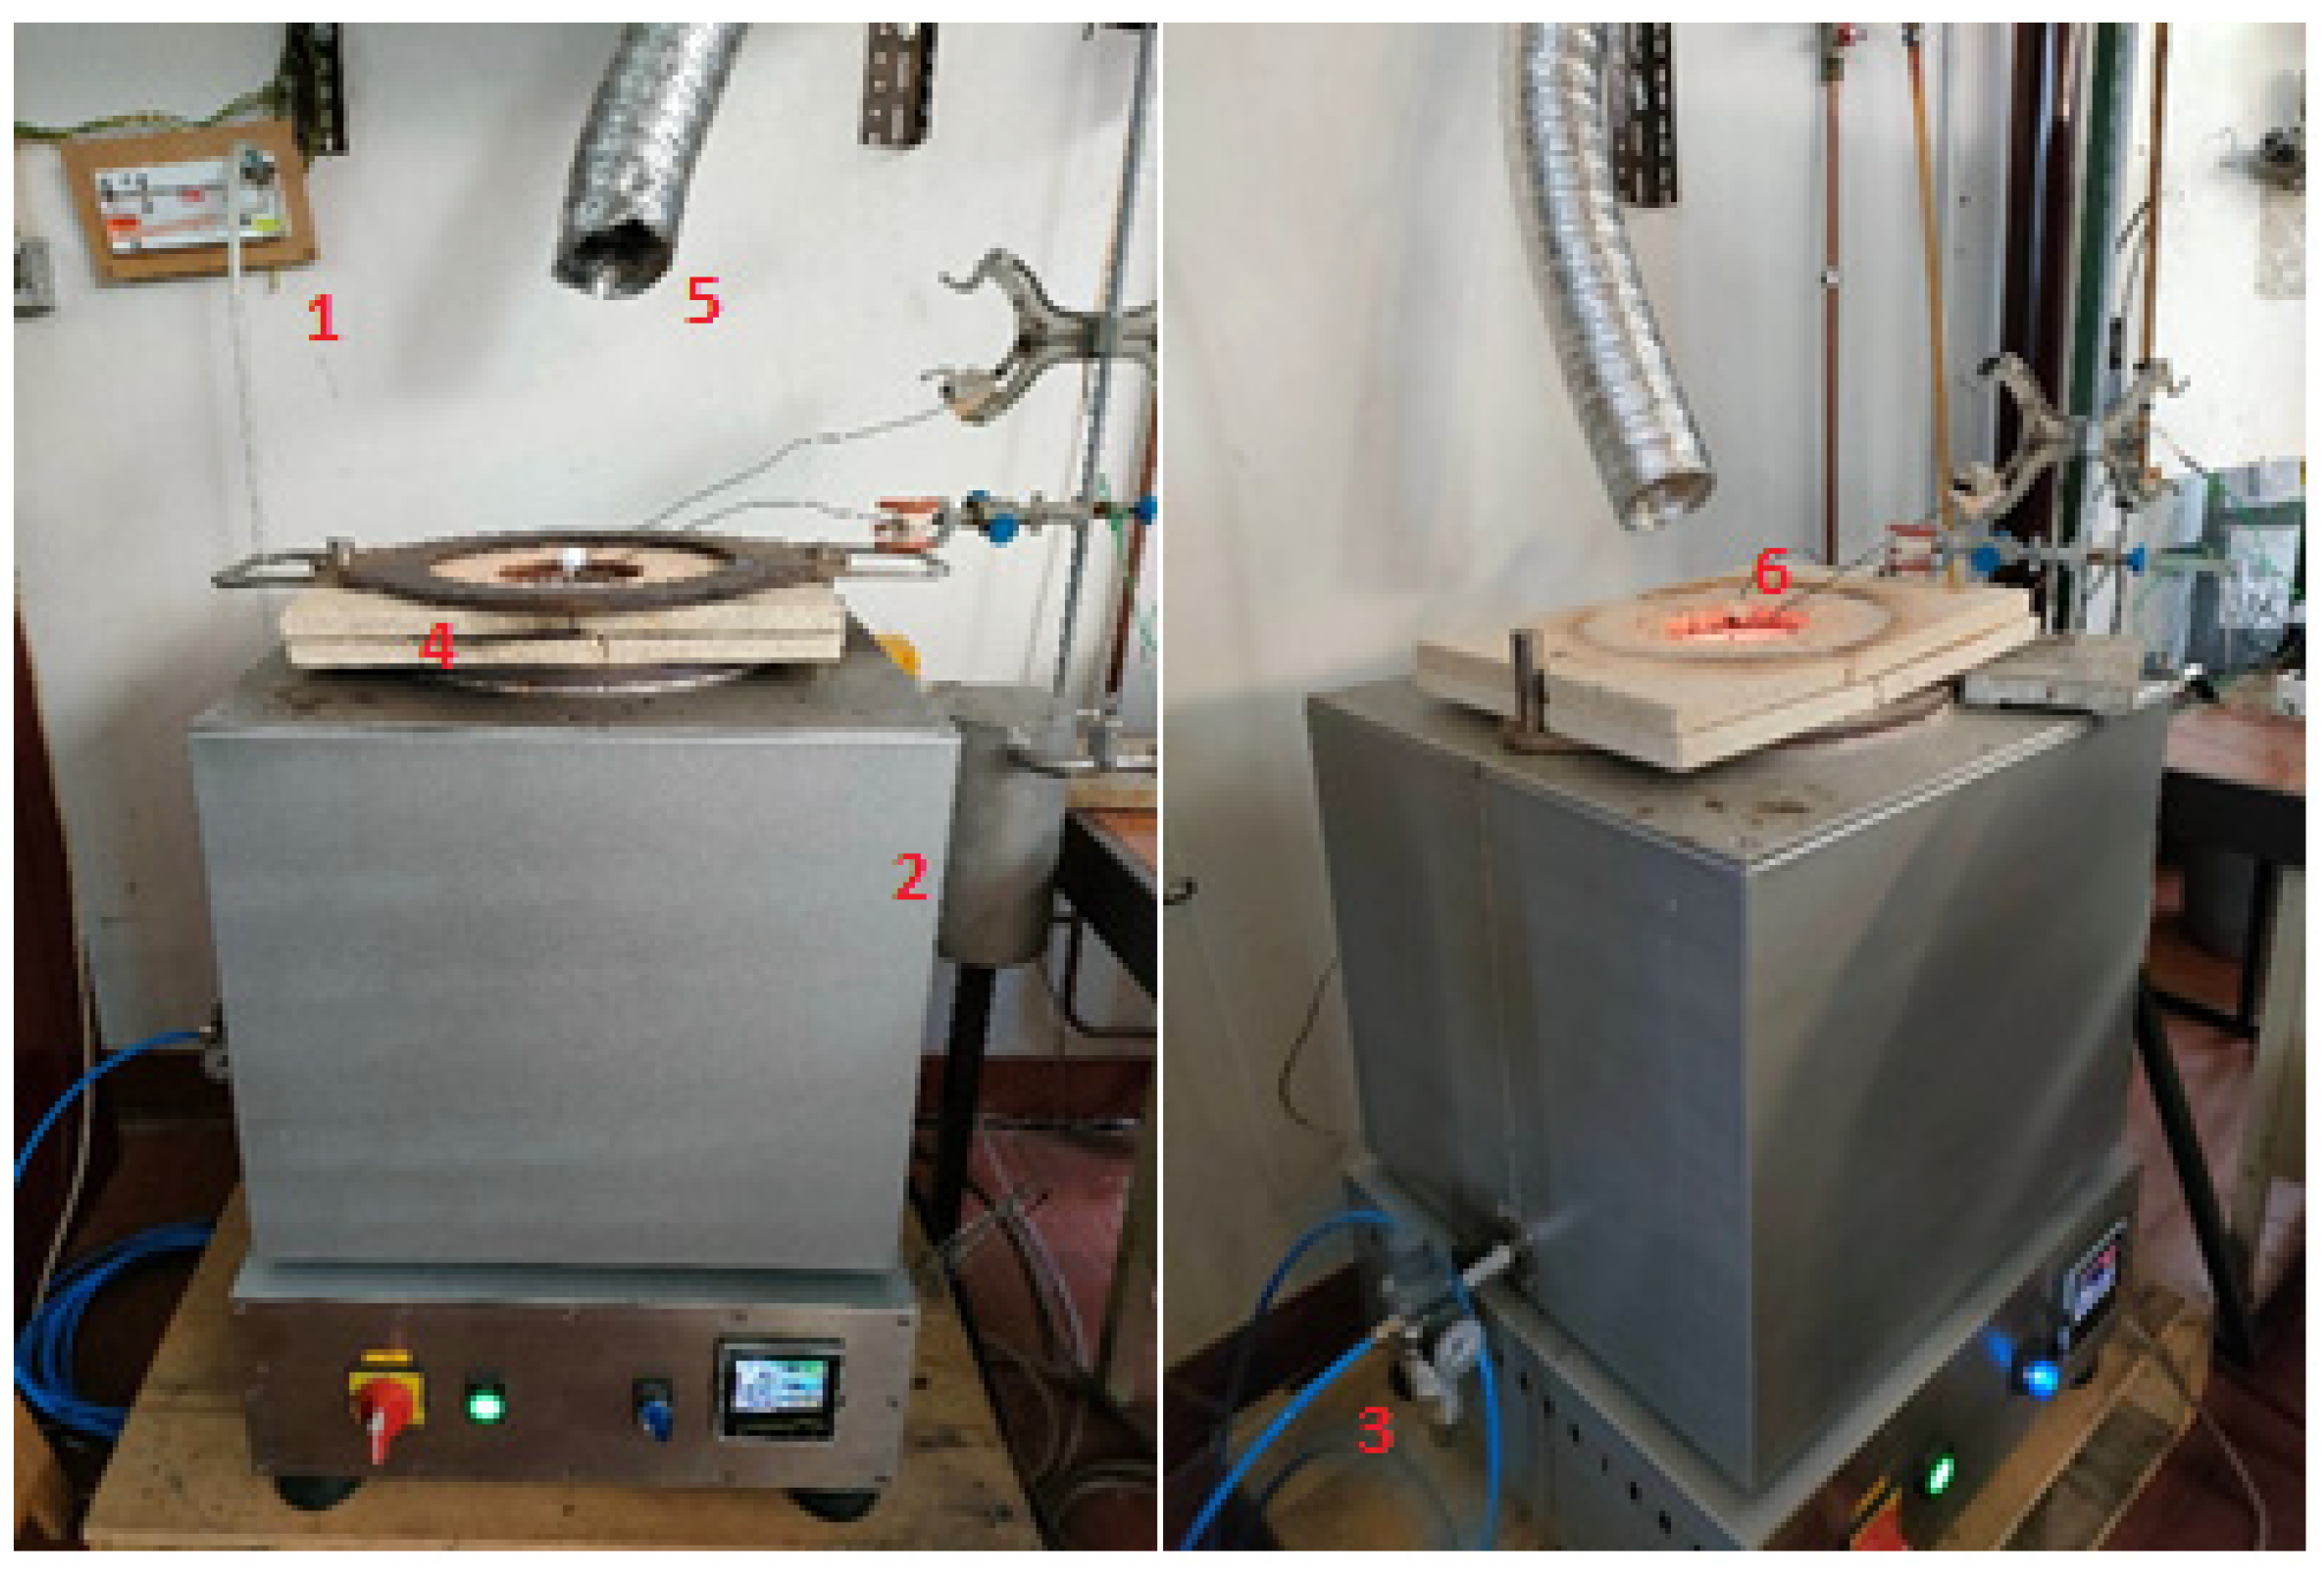
Figure 1. Developed test rig and its elements for fire resistance test.
Energies 16 02426 g001
Figure 2. Main components of the smoke production test facility.
Energies 16 02426 g002
Figure 3. Test chamber of the used equipment for ignitability tests.
Energies 16 02426 g003
Figure 4. Test results from fire resistance and thermal insulation test to the uncoated samples (1, 2, 5 and FN): (a) Outer surface temperature; (b) Thermal capacity (temperature difference between outer and inner surface); (c) Thermal insulation (temperature difference between ambient and outer surface) characterized according to the standard EN 13501-2 [11].
Energies 16 02426 g004
Figure 5. Test results from fire resistance and thermal insulation test to the coated samples (1MIX2, 2MIX2, 5MIX2, and FNMIX2): (a) Outer surface temperature; (b) Thermal capacity (temperature difference between outer and inner surface); (c) Thermal insulation (temperature difference between ambient and outer surface) characterized according to the standard EN 13501-2 [11].
Energies 16 02426 g005
Figure 6. Test results from fire resistance and thermal insulation test to the commercial samples (Commercial1, Commercial2, and Commercial3): (a) Outer surface temperature; (b) Thermal capacity (temperature difference between outer and inner surface); (c) Thermal insulation (temperature difference between ambient and outer surface) characterized according to the standard EN 13501-2 [11].
Energies 16 02426 g006
Figure 7. Test results from smoke production test to the uncoated samples (1, 2, 5, and FN) as specified by BS EN 13823 [13]: (a) Average of smoke production rate of the specimen (SPRav(t)); (b) Total smoke production of the specimen (TSP(t)); (c) Smoke growth rate of the specimen.
Energies 16 02426 g007
Figure 8. Test results from smoke production test to the coated samples (1MIX2, 2MIX2, 5MIX2, and FNMIX2) as specified by BS EN 13823 [13]: (a) Average of smoke production rate of the specimen (SPRav(t)); (b) Total smoke production of the specimen (TSP(t)); (c) Smoke growth rate of the specimen.
Energies 16 02426 g008
Table 1. Summary of the classification criteria for elements of passive fire protection [7,9,10,11,12,13,15,16,17,18].
FunctionCriterionClassification SymbolClassification StandardTest Standard
Reaction to fireFire behaviorFire contributionA1–A2–B–C–D–E–FEN 13501-1EN ISO 1182
EN ISO 1716
Flame spreadEN ISO 11925-2
EN 13823
IgnitabilityEN ISO 11925-2
Smoke productions1–s2–s3EN 13823
Flaming particles/droplets productiond0–d1–d2EN 13823
EN ISO 11925-2
Fire resistanceLoadbearing capacityREN 13501-2EN 1634-1
IntegrityE
Thermal insulationI
RadiationW
Smoke controlSmoke leakageSa
Sm
EN 13501-4EN 1634-3
StabilityD
DH
EN 1634-1
Table 2. Final samples designation for fire curtains varying in structure, materials combination, and coating.
Sample125FN1MIX22MIX25MIX2FNMIX2
Choice
Fibrous structure type2D-Basket weave2D-Basket weave2D-Basket weave3D near-net-shape2D-Basket weave2D-Basket weave2D-Basket weave3D near-net-shape
Warp materialGFGFGFGFGFGFGFGF
Weft materialGFBFGF (50%) + BF (50%)GFGFBFGF (50%) + BF (50%)GF
Active material---SMM---SMM
Coating applied----MIX2MIX2MIX2MIX2
Legend: BF—Basalt fiber; GF—Glass fiber; SMM—Shape memory material; MIX2—Designation of the developed coating.
Table 3. Composition of the developed coating, MIX2.
DesignationPolymer MatrixInorganic Additives
MIX2WPUNanoclay (2–5%) + Alumina 0.3 μm (25/75)
Table 4. Commercial samples’ overall composition.
Commercial Sample DesignationFibrous Structure TypeFabric MaterialsCoating
Commercial12D Woven fabricGFNo
Commercial22D Woven fabricGF + SFNo
Commercial32D Woven fabricGF + SFYes
Legend: GF—Glass fiber; SF—Steel fiber.
Table 5. Ignitability test results.
Sample125FN1MIX22MIX25MIX2FNMIX2
Parameter
Exposure time (s)3030303030303030
Ignition of the sampleNoNoNoNoNoNoNoNo
Cotton ignitionNoNoNoNoNoNoNoNo
Flaming particles/dropletsNoNoNoNoNoNoNoNo
Time to reach the top (s)-------8
Table 6. Evaluation value obtained for each test sample.
125FN1MIX22MIX25MIX5FNMIX2
5.0203.5083.7083.5286.8036.6336.1384.145
Disclaimer/Publisher’s Note: The statements, opinions and data contained in all publications are solely those of the individual author(s) and contributor(s) and not of MDPI and/or the editor(s). MDPI and/or the editor(s) disclaim responsibility for any injury to people or property resulting from any ideas, methods, instructions or products referred to in the content.