Abstract
China’s Yangtze River Basin has an increasingly strong demand for crude oil. As a seaborne import port for crude oil, Ningbo-Zhoushan Port is under pressure to undertake the transshipment of crude oil to various oil terminals in the Yangtze River Basin. To alleviate the stress of crude oil transportation in Ningbo-Zhoushan Port, the port operator proposed the crude oil sea–river transshipment scheme in Nantong Port. Therefore, this paper aims to verify the feasibility of this scheme. We used the discrete event system modeling and entity relationship diagram method to construct the hierarchical and concept models of the Yangtze River Basin’s crude oil sea–river transportation system. Furthermore, we developed corresponding simulation modules on the Witness platform and carried out a simulation experiment of the crude oil sea–river transfer scheme. In the experiment, we analyzed the influence of the transshipment ratio on berth utilization, waiting time, and sailing time of other ports by adjusting the parameter of the transshipment ratio. The experimental results show that when the transshipment rate reaches 100%, the utilization rates of loading and unloading berth in Nantong Port are 4% and 13%, respectively, which evidences that Nantong Port has transshipment potential. At the same time, the simulation experiment’s statistical indicators, such as the utilization rate of oil berths, the queuing time of oil tankers, and the sailing time, not only confirm the feasibility of the crude oil sea–river transshipment scheme of Nantong Port but also confirm that the scheme is helpful to improve crude oil transportation efficiency. The simulation results benefit the port operation decision, and the established model and simulation module can be encapsulated and reused.
1. Introduction
With the rapid development of the economy, energy issues have become the world’s focus. With greater industrialization, China’s total energy demand will only increase [1]. Energy is indispensable to world economic development, and crude oil plays a vital role in the energy market. The China National Petroleum Corporation (CNPC), in its 2019 outlook, forecasted oil demand at 705 million tons or about 16.5 mb/d in 2030 [2]. According to the 2019–2020 Blue Book of China’s Oil and Gas Industry Development Analysis and Prospect Report, China ranks among the top in crude oil imports and consumption [3]. At the same time, the crude oil transportation system is essential for every country in providing industrial production materials and promoting economic development [4]. Therefore, the transportation of crude oil has received more and more attention. Pipeline transport often occurs between inland countries with relatively small transport volumes. In contrast, due to its cost economy, maritime transport is more critical to the global crude oil trade [5]. Judging from the published literature on crude oil transportation, most researchers focus on pipeline or ocean transportation risks and safety issues. In contrast, the literature on inland transportation of crude oil is minimal.
The Yangtze River Basin is a significant manufacturing base in China, covering nine provinces and two municipalities. Many main manufacturing parks and petroleum and petrochemical industries are along the Yangtze River [6]. With the economic development of the Yangtze River Basin, the demand for crude oil continues to grow, and the task of crude oil transportation is becoming more and more difficult. With many ships sailing on it yearly, the Yangtze River Basin plays a vital role in China’s inland river transportation industry [7]. Therefore, the waterway transportation system for imported crude oil mainly uses tankers as logistics transportation carriers and crude oil ports as logistics transportation nodes. Crude oil is often transferred through large coastal crude oil ports and then transported to various places of demand in the Yangtze River Basin, which makes the transshipment of crude oil by sea–river a practical problem to be solved urgently. Although transshipment is a critical component in a multimodal transportation system, research on transfer is still relatively rare. Some scholars pay attention to transit in the field of public transport. Some apply graph theory, and some establish a set of mixed logit models or a route selection model to study passenger public transport transfer [8,9,10,11]. In recent years, some scholars have also begun to focus on transfer in freight transportation. A multi-agent simulation model, including an improved strategy for crane scheduling, with a terminal rail–rail transshipment yard has been achieved [12]. The efficiency of LCL transshipment at terminals has also attracted the attention of scholars. Using the DEA-AHP model, scholars built an evaluation index system of LCL transshipment efficiency [13]. According to the literature reviewed, sea–river transfer has not yet attracted the attention of scholars.
In recent years, the development of the Yangtze River Basin has attracted more and more attention from researchers. Some scholars have studied moisture transport [14,15] and the energy consumption of residential buildings in the Yangtze River Basin [16,17]. Others are concerned about the carbon emissions of culture and related manufacturing industries [18] and energy efficiency assessment [6] in the Yangtze River Basin. Other scholars have studied the living environment of the cabin of water transport ships [7] in the Yangtze River Basin and the sensitivity assessment of the parameters of the rice ORYZA model [19]. According to the literature, only some people have paid attention to transportation in the Yangtze River Basin. Therefore, studying the waterway transportation of crude oil in the Yangtze River Basin is of great practical significance and reference value.
This paper aims to verify the feasibility of the proposed sea–river transshipment scheme in Nantong Port through modeling and simulation experiments. The experimental results show that the transshipment scheme not only alleviates the congestion problem of transshipment in Ningbo Zhoushan Port, but also improves the efficiency of crude oil transshipment, proving the scheme’s feasibility. At the same time, the transfer proportion of crude oil in Nantong Port has different effects on the waiting time, sailing time, berth utilization, and other indicators of oil tankers at the transfer and consumption nodes. The contribution of this paper can provide a reference for planning and decision-making in the future development of the Yangtze River crude oil sea–river transshipment. At the same time, the use of discrete system modeling methods and object-oriented simulation technology to solve the decision-making of macro-complex systems is also a valuable attempt. The remainder of the paper is structured as follows. System modeling methods and simulation software tools are presented in Section 2. System modeling and simulation experiments are illustrated in Section 3 and Section 4, followed by results and discussions in Section 5. Section 6 concludes the paper.
2. System Modeling Methods and Simulation Software Tools
2.1. System Modeling Methods
Enhancing the performance of various systems through modeling and optimization has been the focus of a large volume of published studies. Various studies have employed system dynamics modeling to choose the commercial complex’s location or optimize the design’s sustainability. However, their scope remains at sectoral, regional, or economy-broad levels with external market, demographic, or government drivers [20,21,22]. A Petri net model of an automated manufacturing system allows us to analyze the tool’s characteristics, such as cycle time and deadlock situation [23]. However, Petri nets show some limitations when modeling is complicated or schedules are dynamic. In the artificial neural network model, the relationship between dependent and independent variables (i.e., input and output data) is determined by MODEFLOW simulation results with no account of the physical conditions of the problem [24]. Some scholars also built a mathematical model based on the berth allocation of terminals and solved it with the CPLEX software [25,26,27].
Since the simulation software used in our laboratory was developed based on discrete event system modeling, we adopted discrete event system modeling and entity relationship diagram methods in this paper. A discrete event system (DES) is an operational research technique that can be used to simulate behaviors of complex systems and create models that represent real-world systems with the incorporation of resource constraints and entities with specific attributes [28,29]. Every decision can trigger a future event, which might change the system’s state once it occurs [30]. Model-based methods play a role in interoperability between systems and multi-disciplinary design methods for complex discrete event systems [31]. Scholars have developed DES models of transportation to evaluate transportation capacity and aid in capacity planning [32]. These models show how to model problems in various domains using discrete events system specifications (DESSs). DESSs use a modular description for the models. DESSs offer two types of models: atomic and coupled [33]. Scholars deal with complex problems using DESSs, allowing the reuse of tested models, improving the simulations’ safety, and reducing development times [34].
An entity–relationship diagram (ERD) is usually used to design database schema. The advantages of ERD are simplicity and its representation of information entities in a real-world way. All the relationships among entities, except for generalization and aggregation, are referred to as associations. The association relationship often represents interactions among entities [35]. Alternative views of the database model, which reflect real-world objects, can be defined based on the entities and relationships of the model [36,37,38]. In brief, the ERD is the central diagrammatic representation of a conceptual data model that reflects users’ data requirements in a database system [39]. In this paper, we used the ERD method in the Yangtze River crude oil transshipment system to establish the system’s concept and process model and developed the crude oil transfer system’s model and simulation module in the Yangtze River on the Witness platform.
2.2. Simulation Software Tools
Recently, discrete event simulation modeling has become a popular method to predict complex system performances, particularly random ones. Simulation can prevent time and budget wastage by gaining a beneficial understanding of the likely performance of a whole system. Thus, the design of simulation experiments plays a vital role in influencing future decision making [40]. In this paper, we used Witness, a simulation software we have used for many years. Witness is Lanner’s commercial off-the-shelf discrete event simulation software tool. These simulations facilitate intermodal transport route design by allowing the experimental analysis of what-if scenarios.
3. System Modeling
3.1. System Description
The crude oil transportation system in the Yangtze River is mainly composed of petrochemical enterprises and port oil terminals along the Yangtze River waterway. The transportation means are ships of different ship types, and the transportation method is water transportation. Therefore, the elements within the boundary of the system studied in this paper are described as follows.
3.1.1. Crude Oil Transportation Nodes
In the crude oil transportation system, the transportation nodes refer to the starting point and endpoint of crude oil transportation, and the port oil terminal is where the transit is during the transportation process. The geographical locations of each node are shown in Figure 1.
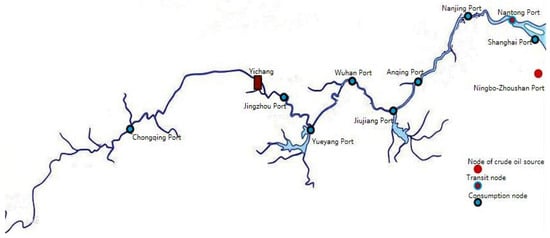
Figure 1.
Crude oil transportation nodes in the Yangtze River Basin.
- The starting point of crude oil transportation
The starting point of the natural oil transportation system in the Yangtze River is the large seaport in the lower reaches of the Yangtze River, which is used to berth large marine tankers and receive and unload imported crude oil. It consists of marine tanker berths, river tanker berths, and ship waiting areas. The starting point of crude oil transportation is an essential physical element in the process, which ensures the input of the system’s supply of goods and is the basis for the system’s regular operation.
- 2.
- Crude oil transportation transit point
Due to the water depth limitation of the channel, oil tankers with more than 10,000 tons can only sail in the lower reaches of the Yangtze River. However, the larger the tanker type, the lower the unit transportation cost of crude oil, so there are crude oil transfer nodes. The transfer node consists of the unloading berth for large oil tankers entering the river, the loading berth for small oil tankers, and the waiting area.
- 3.
- Crude oil transportation terminal
The location of petrochemical enterprises usually has an oil product terminal, the endpoint of crude oil transportation in the system, and the node of simple oil demand. The terminal of crude oil transportation consists of unloading berths, tanker waiting areas, and crude oil storage depots.
3.1.2. Crude Oil Logistics Equipment
- The crude oil loading and unloading equipment
Crude oil loading and unloading equipment is mainly based on the oil transfer arm and includes pipelines and other auxiliary equipment. Oil tanks are the primary containers for storing crude oil.
- 2.
- Means of transport
Oil tankers are essential tools for providing transportation services. According to the “Development Plan of the Yangtze River Golden Waterway Ship Type”, it can be seen that the representative ship type for Yangtze River trunk oil is 3000–5000 tons. However, the carrying capacity of crude oil tankers is usually more significant than that of product oil tankers, and the loading capacity of crude oil tankers is usually 3000–8000 tons.
3.1.3. Crude Oil Demand and Transportation
- Crude oil demand
Crude oil demand is the fundamental factor driving the operation of the crude oil transportation system. Without demand, there is no transportation activity. The processing capacity of petrochemical enterprises, the inventory level of ports, and the demand for crude oil at each consumption node are different, which will also affect the transportation volume of each transportation route.
- 2.
- Transportation organization
Large marine tankers mainly import crude oil, and many terminals have corresponding loading and unloading capabilities, so one-way transshipment is inevitable. In the subsequent transportation process, considering factors such as transportation cost, water depth of the channel, and port resources, a sea–river transshipment can also be carried out. Therefore, the number of transfers, nodes, and proportions are different, constituting different transportation organization methods.
- 3.
- Transportation plan
The crude oil transportation system’s network structure and transportation organization are complex. In the transportation network of crude oil, imported crude oil is first transported to coastal ports by sea tankers, then transferred to inland port tankers, and finally transported to the place of demand. On the other hand, crude oil can also be transported directly through the coastal ports. Different transit modes and ports constitute completely different transport network structures. Other network structures directly affect transportation efficiency, speed, and cost. Secondly, the system is affected by many random factors regarding transportation organization. For example, the arrival time of ships is uncertain, and the interval time is unexpected; the loading volume of boats needs to be fully standardized, and the loading volume of the same ship type also fluctuates randomly within a specific range. Seasons, weather, policies, and other factors also directly affect the decision making of the transportation organization scheme.
Currently, the transportation of crude oil in the Yangtze River forms the basic layout of loading and unloading imported crude oil at Ningbo-Zhoushan Port and two-way transshipment at large oil terminals along the Yangtze River. At present, there are two alternative transfer options. Through investigating the current situation of crude oil in the Yangtze River basin, we found that the crude oil transfer plan is to transfer crude oil at Ningbo-Zhoushan Port and then directly transfer crude oil to various crude oil terminals along the Yangtze River by small tankers. We call this Scenario A. There are problems in this scheme, such as terminal and berth congestion in Ningbo Zhoushan Port and the long waiting time for an oil tanker. Based on analyzing the port resources, geographical location, and traffic conditions in the Yangtze River basin, the port operator put forward transshipment plan B. This scheme first transports crude oil from Ningbo-Zhoushan Port to Nantong Port for the second transfer and then supplies it to other oil enterprises along the Yangtze River through inland tankers. The specific transportation plan is shown in Figure 2.
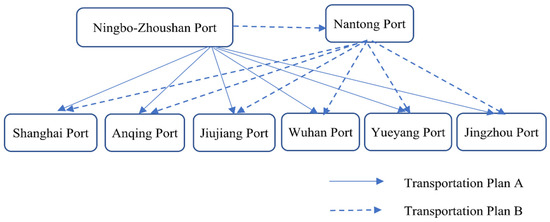
Figure 2.
Crude oil transportation scheme in the Yangtze River Basin.
3.2. Hierarchical Model of the System
To build a system simulation model from top to bottom with system thinking, first, create a hierarchical model of the system and then make the logical dynamic relationship at each level of the system. Hierarchical models determine the level at which the model studies system problems.
This paper focuses on researching the crude oil transportation network in the Yangtze River Basin from the system’s perspective. We regard the port oil depots and petrochemical enterprises of the transportation network as transportation nodes and the Yangtze River waterway and tanker routes as transportation routes. In the crude oil transportation system in the Yangtze River, the crude oil loading and unloading operation is an integral part of the system activation process because it affects the waiting time and berth utilization of oil tankers.
Therefore, this paper considers the activities of crude oil transshipment, oil tanker navigation, crude oil loading, and unloading in the natural oil transportation system in the Yangtze River. This paper adopts the analytical thinking of system science, starting from the top of the system, from top to bottom, and gradually analyzes and describes the composition or components of the system. The established hierarchical model of the transportation system for crude oil in the Yangtze River Basin is shown in Figure 3.
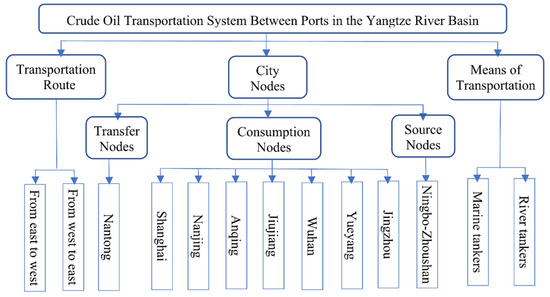
Figure 3.
A hierarchical model of the transportation system for crude oil in the Yangtze River.
3.3. Conceptual Model
3.3.1. Entity–Relationship Diagram
The entity–relationship diagram (ERD) modeling method is suitable for establishing a conceptual simulation model, which describes the entities, connections, and their corresponding attributes in the simulation model. It then combines them into a complete conceptual model for analyzing each component’s logical relationship and activity flow within the system.
An ERD is a block diagram describing the relationship between various entities in the simulation object and the entity’s attributes. The key to ERD design is whether it can correctly analyze the dynamic behavior of the research object and every objective object involved in each process. It also needs to explore the system’s information transmission method, which requires an in-depth system analysis.
In combination with the above system analysis, we abstracted each identified target object in the system as an entity in the ERD and summarized multiple entities with the same attributes as an entity type. Each valid characteristic was abstracted to describe an entity as a property of the entity. Activities connected each associated entity, and the actions between them were abstracted as links in the ERD.
The specific formal expression of ERD is: use a rectangular box to represent entities, which are classified as similar entities and named according to the entity type; use a diamond box to illustrate connections and use connecting lines to connect related entities; attributes are represented by elliptical tubes; inside the box, fill in the attribute name and connect it to the corresponding entity with a wire.
3.3.2. Entities and Their Properties
The active entities in the crude oil transportation system in the Yangtze River Basin include crude oil, marine tankers, oil tankers entering the river, Ningbo-Zhoushan Port, Nantong Port, Nanjing Port, Shanghai Port, Anqing Port, Jiujiang Port, Wuhan Port, Yueyang Port, Jingzhou Port, and various port anchorages. Among them, Nantong Port, which is an alternative port for transit, has the same attributes in the process, and Nanjing Port, which undertakes the task of crude oil transit and transportation in practice, is regarded as a transit node; the rest of the ports are considered consumption nodes.
3.3.3. Relationships and Properties of Entities
The ERD of the crude oil transportation system in the Yangtze River is shown in Figure 4.
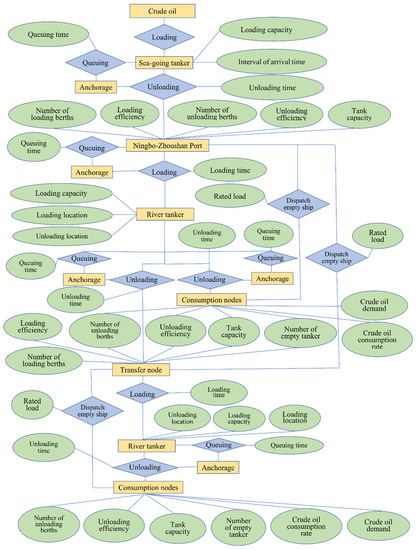
Figure 4.
The ERD conceptual model of the Yangtze River’s crude oil sea–river transfer system.
3.3.4. Crude Oil Sea–River Transfer Process
As seen in Figure 4, the ERD conceptual model of the crude oil waterway transportation system in the Yangtze River takes ships as the carrier of crude oil and also the essential activity entity in the system. We divide the whole transportation process into three sub-processes:
- The first sub-process, namely one-way transportation, refers to the transport of imported crude oil to Ningbo-Zhoushan Port by sea tanker, which is a necessary stage for all processes;
- The second sub-process is divided into two cases, one is that the crude oil from Ningbo-Zhoushan port is directed to the consumption node by river ships, and the other is that the crude oil of Ningbo is directed to the transfer node by river ships;
- The third sub-process is that the crude oil at the transit node is transported to the consumption node via the river.
The original crude oil transfer scheme A in this paper includes the first and second sub-processes, while the operation process of transfer scheme B to be verified in this paper includes the three sub-processes mentioned above.
Each loading and unloading operation is associated with the queuing operation of the tanker at the anchorage. Whether the tanker enters the queuing process depends on the attributes of the port node where the loading and unloading operation is carried out, including the number of berths, loading and unloading efficiency, and the capacity of oil storage tanks.
In addition to the critical transportation operation process in the system, there are also connections between consumption nodes, transit nodes, and Ningbo Zhoushan Port, dispatching empty ships. The occurrence of open vessel dispatching activities depends on the crude oil consumption rate and demand at the consumption node. Only empty ships can carry out the transportation process of crude oil transshipment into the river, and empty ships will be dispatched only when there is demand.
4. Simulation Model and Experiments
4.1. Transportation Organization
We established a simulation model of the crude oil transportation system in the Yangtze River Basin based on Witness simulation software. The model includes nine port city nodes in the middle and upper reaches of the Yangtze River, namely Nantong, Shanghai, Ningbo, Anqing, Nanjing, Jiujiang, Wuhan, Yueyang, and Jingzhou. We divided urban nodes into crude oil source, transit, and consumption nodes. The specific traffic organization between urban nodes is shown in Figure 5.
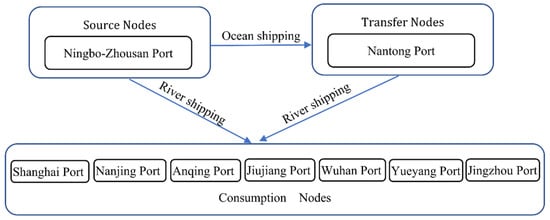
Figure 5.
Classification, relationship, and transportation organization among city nodes.
4.2. Modules for Simulation Models
Among the port city nodes along the river, Nantong Port has 27 special berths for oil products, which can handle and load 100,000-ton large oil tankers. The terminal resources are sufficient, so Nantong Port was selected as the transit node. It can be seen from Figure 5 that crude oil required for consumption nodes along the river can be transferred directly from Ningbo-Zhoushan Port, or from Ningbo-Zhoushan Port to Nantong Port, and then from Nantong Port to each consumption node.
In addition to the city node module, the simulation model includes a path module, a ship management module, and a data statistics module. The components of the simulation model are shown in Figure 6.
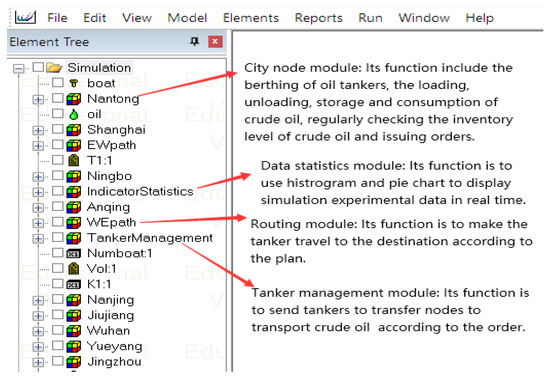
Figure 6.
Module library in the system simulation model.
Figure 6 shows the types of module libraries and their respective functions in the simulation model of crude oil transit in the Yangtze River basin. The path module library is composed mainly of two sub-path modules from east to west (Ewpath in Figure 6) and west to east (WEpath in Figure 6). The urban node module library consists of 9 modules (Nantong, Shanghai, Ningbo, Anqing, Nanjing, Jiujiang, Wuhan, Yueyang, and Jingzhou).
4.3. Visualization of Simulation Models
Visualization is the specific manifestation of a model. After the internal logical structure of each module in the simulation model and the relationship between the modules are edited, the visible part of each module needs to be arranged and adjusted on the simulation interface to meet the model visualization requirements. The simulation model is shown in Figure 7.
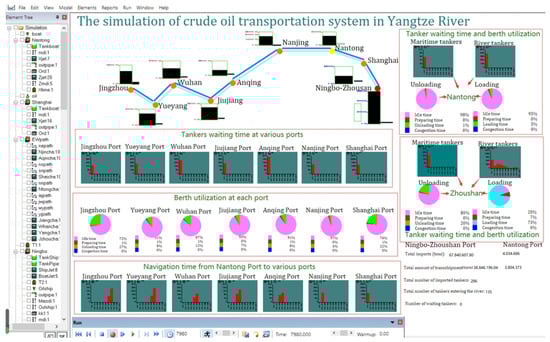
Figure 7.
Graphical visualization of the system simulation model.
Figure 7 is a real-time screenshot of the simulation process. Witness software displays the operation status of each element in the simulation model in the form of a pie chart or histogram. From the red rectangular boxes on the right and the middle of Figure 7, we can observe the real-time changes in the ship waiting for time and berth utilization rate of the transit nodes (Nantong Port, Ningbo-Zhoushan Port) and consumption nodes (Jinzhou Port, Yueyang Port, and other ports). From the middle-lower red rectangles in Figure 7, we can also observe the changes in the sailing time of the ship from Nantong Port to other ports in the Yangtze River basin.
4.4. Transfer Scheme B for the Simulation Experiment
The existing operation of the Yangtze River waterway transportation system for crude oil is transshipment plan A: after the crude oil is unloaded in the Ningbo-Zhoushan port, the crude oil is directly transported to the crude oil terminals in the Yangtze River Basin by the oil tanker entering the river, or via sea–river transshipment through Nan-jing Port, and then transported to crude oil terminals in the middle and upper reaches of the Yangtze River. However, the limited transshipment capacity of Nanjing Port makes the waiting time for oil tankers long.
Through the investigation and analysis of the resource allocation of crude oil terminals in the Yangtze River Basin, we found that Nantong Port is adjacent to the Yellow Sea in the east, and the Yangtze River in the southwest has an advantageous geographical location. Nantong Port is pivotal in the combined transportation of oceans and rivers, and its channel conditions are also relatively superior. Nantong Port has 27 petrochemical loading and unloading berths, a maximum berthing capacity of 100,000 tons, and a petrochemical storage tank volume of more than 2 million cubic meters. It is the most extensive petrochemical product storage and transportation base in the lower reaches of the Yangtze River. In addition, the crude oil handling and storage capacity of Nantong Port are superior to other crude oil terminals in the Yangtze River Basin. Therefore, the port operator proposed plan B for the sea–river transshipment of crude oil at Nantong Port. We conducted a simulation test on project B transshipment.
4.5. Experimental Conditions
4.5.1. Simulation Time
Considering the influence of weather conditions and holidays, the simulation time was set to 7980 h.
4.5.2. The Time Interval between the Arrival of Ships
Time interval refers to the gap between the arrival time of different ships. Since the time interval of ship arrival follows a negative exponential distribution, we used the Yangtze River import crude oil demand data to estimate the average time interval. In addition, we used random variables to express the number of ships at the oil terminal of Ningbo-Zhoushan Port.
4.5.3. The Loading Capacity of Imported Tankers
A very large crude carrier (VLCC) usually transports imported crude oil with a loading capacity of about 200,000 to 300,000 tons. Therefore, the loading capacity of the imported tanker was set to follow the truncated normal distribution of 200,000 to 300,000 tons.
4.5.4. The Loading Capacity of the Transshipment Tanker
According to the ship type development plan of the Yangtze River Golden Channel, the typical type of Yangtze River Petroleum has a loading capacity of 3000 to 5000 tons. Since the carrying capacity of crude oil tankers exceeds that of product tankers, we set a truncated normal distribution of 3000–8000 tons of inland oil tankers.
4.6. Variation Factors of Experiments and Evaluation Parameters of Transportation Systems
4.6.1. Setting of Change Factor
In this paper, we designed five groups of simulation experiments (A, B, C, D, E). The variation factor of the investigation was the proportion of crude oil transshipment ships at the transit node (Nantong Port), the values of which were 20%, 40%, 60%, 80%, and 100%, respectively.
4.6.2. Evaluation Index Setting
This experiment used ship waiting time, berth utilization rate, crude oil import, and transshipment volume as evaluation indicators. Affected by the change factor, these indicators reflect the operation status of each node.
The calculation formula for ship waiting time (T) is:
In Formula (1), T1 represents the arrival and departure time of the ships in port and waiting for arrival and departure, T2 represents the loading and unloading time of the ships in port and waiting for arrival and out, and T3 represents the time of the target ship sailing to the port.
We can use Formula (2) to calculate the utilization rate of the berth.
In Formula (2), t1 represents the berthing time of the berth, and t2 represents the operation time of the berth. In the daily statistics of ports, this method is also used to calculate the berth utilization rate of ports [41].
The crude oil’s import and transshipment volumes are usually related to the loading and unloading volumes of crude oil.
5. Analysis and Discussion of Test Results
5.1. Tankers Waiting Time and Berth Utilization at the Transfer Node
5.1.1. Experimental Results and Statistics
From the output results of the five sets of simulation tests, the waiting time of tankers in Nantong Port was almost unchanged, so this paper counts the indicators that did change. The data indicators of tankers’ waiting time and berth utilization at the transshipment nodes (Ningbo-Zhoushan Port and Nantong Port) are shown in Table 1.

Table 1.
Tankers waiting time and berth utilization rate of transfer nodes.
5.1.2. Index Analysis and Discussion
As can be seen from Table 1, the unloading operation test results show that compared with other ports, Ningbo Zhoushan Port has a higher utilization rate of loading berth and a longer waiting time for oil tankers. In contrast, the unloading berth resources of Ningbo-Zhoushan Port and the loading and unloading berth of Nantong Port are relatively sufficient. Secondly, with the increase in the proportion of Nantong’s transshipment, the waiting time and berth utilization rate of ships in Ningbo Port decreased significantly. In contrast, the utilization rate of berths in Nantong Port gradually increased, and the highest was only 13%.
The data in Table 1 show that the berth utilization rate of Ningbo-Zhoushan Port decreased from 75% to 49% as the transfer proportion of Nantong Port increased from 20% to 100%. The simulation results show that transfer scheme B can help alleviate the congestion of berths in Ningbo-Zhoushan Port, and the transfer proportion in the scheme has different degrees of influence on the operation indicators of Ningbo Zhoushan Port.
Therefore, the data indicators in Table 1 show that the shipping berth transshipment capacity of Ningbo-Zhoushan Port is fully utilized at this stage. At the same time, Nantong Port is fully equipped with transshipment capacity and has much room for development.
5.2. Tankers Waiting Time and Berth Utilization at the Consumer Node
5.2.1. Experimental Results and Statistics
The difference between the consumption and the transfer node is that there is no oil loading operation, only crude oil unloading operation at the consumption node. Therefore, the data output of the five groups of experiments includes the ship waiting time and berth utilization during the crude oil unloading operation at each consuming node. The simulation results show that the waiting time and berth utilization rate of the four consumption nodes of Shanghai Port, Nanjing Port, Jiujiang Port, and Yueyang Port were almost unchanged. For the consumption nodes such as Anqing Port, Wuhan Port, and Jingzhou Port, statistics were calculated for the variable ship waiting times and berth utilization index values, as shown in Table 2.
Table 2.
The tanker waiting times and consumption nodes’ berth utilization ratios.
5.2.2. Index Analysis and Discussion
Horizontally, it can be seen from Table 2 that among the three consumption nodes, Jingzhou Port has the highest indicators. The waiting times and berth utilization rates of ships in all nodes except Jingzhou Port are generally low. There is no congestion phenomenon, indicating that the consumption node of the terminal resources is sufficient to meet the current crude oil transportation needs. From a vertical perspective, it can be seen from Table 2 that the indicator values of the three consumption nodes changed slightly.
From statistical Table 2 of the experimental results, it can be seen that with the transfer proportion increasing from 20% to 100%, the unloading waiting time of Jingzhou Port increased from 15.25 h to 27.37 h, and the berth utilization rate of Wuhan Port increased from 12% to 16%. In the port indicators of the consumption nodes, these changes are relatively noticeable.
Therefore, the transfer ratio difference did not significantly increase the loading and unloading pressure of each consumption node (i.e., the crude oil terminal of the port) along the Yangtze River, which further evidences the feasibility of the Nantong Port transfer plan.
5.3. The Sailing Time of the Tanker
5.3.1. Experimental Results and Statistics
From the results of the five sets of simulation tests, the sailing time to the other six consumer nodes shows a downward trend among the seven consumer nodes, except that the transit time from the transit node to Shanghai Port is about 4.6 h. For details, see statistics Table 3.
Table 3.
Sailing time of the oil tanker from the transfer node to each consumption node.
5.3.2. Index Analysis and Discussion
From statistical Table 3 of the experimental results, it can be seen that with the increase of the transfer ratio from 20% to 100%, the cruise time of the tanker in Nanjing Port decreased from 14.8 h to 10.92 h, and the sailing time of the tanker in other ports also decreased to varying degrees.
It can be seen from Table 3 that with the increase in proportion of crude oil transshipped at Nantong Port, the voyage time from the transit node to each consumption node gradually decreased, so the transportation efficiency of crude oil in the Yangtze River Basin was improved. At the same time, the transshipment of crude oil at Nantong Port can also reduce the transportation distance of small-sized oil tankers. The data indicators of transshipment nodes also indicate that Nantong Port has abundant transshipment resources and strong transshipment capabilities. In this case, increasing the proportion of crude oil transshipment in Nantong Port can reduce the transportation cost of crude oil in the Yangtze River Basin.
5.4. Sensitivity Analysis of Simulation Experiment
The software Witness has a built-in powerful simulation engine and various representation methods of the running status of model elements, such as pie and column charts in Figure 7. Witness’s sensitivity analysis function can enable users to see the running status of various parts of the system model in real-time, clearly show the congestion link in the process, and provide an essential basis for the system’s optimization design and management decisions. The robustness measurement of the system in this experiment included three indicators, namely tanker waiting time, berth utilization at transfer and customer nodes, and tanker sailing time from the transfer node to each consumption node. The changes in these three indicators by adjusting the proportion of crude oil transfer ships are shown in Table 1, Table 2 and Table 3.
5.5. Simulation Results and Suggestions
Facing the activities of the crude oil transportation system in the Yangtze River Basin, we built a simulation model of the crude oil sea–river transfer system in the Yangtze River Basin, conducted a simulation test, and analyzed the data output from the experiment in this paper. Based on the analysis and discussion of the above experimental statistics, simulation results are as follows:
- Scheme B, proposed by the port operator to transfer crude oil at Nantong Port, was found to be feasible. The operation simulation test results of Scheme B show that as the transfer of Nantong Port increased from 20% to 100%, the berth utilization rate of Ningbo-Zhoushan Port decreased from 75% to 49%, and the loading waiting time of Ningbo-Zhoushan Port reduced from 37.42 h to 17.57 h, which evidences that Scheme B helped alleviate the congestion problem of Ningbo-Zhoushan Port in the original Scheme A;
- Scheme B of transferring crude oil at Nantong Port improves operation efficiency. The transfer ratio of crude oil in Nantong Port significantly impacts port tanker waiting time and the consumption node port berth utilization ratio. For example, with the transfer promotion increasing from 20% to 100%, the unloading waiting time of Jingzhou Port increased from 15.25 h to 27.37 h, and the berth utilization rate of Wuhan Port increased from 12% to 16%;
- The increase in the proportion of crude oil in Nantong Port also led to a significant decline in the sailing time of the oil tanker from the transfer node to each consumption node. For example, with the increase in transfer ratio from 20% to 100%, the tanker’s sailing time at Yueyang Port decreased from 61.09 h to 55.52 h.
Based on the above results, we propose corresponding suggestions as follows:
- There is a transportation bottleneck in the Yangtze River’s crude oil transshipment system, which occurs in the loading link of Ningbo-Zhoushan Port, and the utilization rate of berths is high, resulting in congestion. To improve the transshipment capacity of the system and meet the growing demand for crude oil, we should strengthen the construction of Ningbo-Zhoushan port infrastructure;
- We should fully utilize the resources and sea–river transfer capacity of crude oil of Nantong Port. We suggest increasing the transfer proportion of crude oil in Nantong Port, relieving the pressure of crude oil transfer in Ningbo Zhoushan Port, and improving the efficiency of crude oil transfer in the Yangtze River Basin. With the developments of recent years, Nantong Port has been able to undertake the transshipment of crude oil ships in the middle and upper reaches of the Yangtze River.
6. Conclusions and Prospect
This paper aims to verify the feasibility of the crude oil sea–river transshipment scheme proposed by the port operator in Nantong Port. Therefore, we take the sea–river transportation system of crude oil in the Yangtze River basin of China as the research object and apply a discrete event system and entity relationship diagram to build the system hierarchy, concept, and process model. Based on these models and the first-hand data of the team, we made the simulation model of the transfer system with the simulation software Witness, determined the operation status indicators of each node in the transfer system, and carried out the simulation experiment by setting different transfer proportions and other experimental parameters.
The modeling process and simulation results show that using the discrete event system and entity relationship diagram are appropriate to build the system model. It is feasible to carry out the crude oil sea–river transfer scheme in Nantong Port. This transshipment scheme not only alleviates the transshipment pressure of Ningbo-Zhoushan Port but also improves the operational efficiency of the crude oil sea–river transshipment system. At the same time, the increase in the transfer ratio of crude oil in Nantong Port also led to a significant decline in the sailing time of the oil tanker from the transfer node to each consumption node.
Researchers engaged in discrete event system control or interested in developing modeling and simulation methods will find this paper very valuable in their research. The contributions of this paper can provide a reference for the planning and decision-making of the future development of the Yangtze River crude oil sea–river intermodal transport. At the same time, it is also a valuable attempt to solve the decision-making problem of macro-complex systems by using the discrete system modeling method and object-oriented simulation technology. This paper will also help researchers in crude oil transfer logistics and provide examples for research topics.
The sea–river transportation system of crude oil is vast and complex. This paper focuses on the simulation and verification of the transfer scheme, but the optimization of the transport route and the scheduling of facilities and resources such as berths were not involved, which will be the next research direction. There is excellent potential for ports to achieve energy transport and management [42]. We expect more and more scholars to participate in researching the practical theme of port energy transport planning.
Author Contributions
Y.Y. contributed significantly to the analysis and manuscript preparation, performed the simulation experiment and data analyses, and wrote the manuscript. Q.Z. contributed to the conception of the study and provided simulation software, computing and data resources, and other analysis tools. All authors have read and agreed to the published version of the manuscript.
Funding
This research received no external funding.
Data Availability Statement
The datasets used and analyzed during the current study are available from the corresponding author upon reasonable request.
Acknowledgments
The authors would like to thank the ports in the Yangtze River Basin for providing the experimental data and the colleagues in the Modeling and Simulation Laboratory for Bulk Cargo Intermodal Transportation for their support.
Conflicts of Interest
The authors declare no conflict of interest.
References
- Rao, C.; Zhang, Y.; Wen, J.; Xiao, X.; Goh, M. Energy demand forecasting in China: A support vector regression-compositional data second exponential smoothing model. Energy 2023, 263, 125955. [Google Scholar] [CrossRef]
- Ur Rehman, O.; Ali, Y. Optimality study of China’s crude oil imports through China Pakistan economic corridor using fuzzy TOPSIS and Cost-Benefit analysis. Transp. Res. Part E Logist. Transp. Rev. 2021, 148, 102246. [Google Scholar] [CrossRef]
- Guo, Y.; Zhang, S.; Liu, Y. Research on Risk Features and Prediction of China’s Crude Oil Futures Market Based on Machine Learning. Front. Energy Res. 2022, 10, 741018. [Google Scholar] [CrossRef]
- Fei, Y.; Chen, J.; Wan, Z.; Shu, Y.; Xu, L.; Li, H.; Bai, Y.; Zheng, T. Crude oil maritime transportation: Market fluctuation characteristics and the impact of critical events. Energy Rep. 2020, 6, 518–529. [Google Scholar] [CrossRef]
- Peng, P.; Yang, Y.; Cheng, S.; Lu, F.; Yuan, Z. Hub-and-spoke structure: Characterizing the global crude oil transport network with mass vessel trajectories. Energy 2019, 168, 966–974. [Google Scholar] [CrossRef]
- Shi, L.; Liu, S.; Bao, M. Empirical analysis on manufacturing energy efficiency of Yangtze River Basin under environmental constraints and its impactors. Alex. Eng. J. 2021, 60, 5147–5155. [Google Scholar] [CrossRef]
- Xie, D.; Li, K. Comprehensive Evaluation of Thermal Comfort in Ship Cabins: A Case Study of Ships in Yangtze River Basin, China. Buildings 2022, 12, 1766. [Google Scholar] [CrossRef]
- Mishra, S.; Welch, T.F.; Torrens, P.M.; Fu, C.; Zhu, H.; Knaap, E. A tool for measuring and visualizing transit stop, route and transfer center connectivity in a multimodal transportation network. Public Transp. 2014, 7, 77–99. [Google Scholar] [CrossRef]
- Schakenbos, R.; Paix, L.L.; Nijenstein, S.; Geurs, K.T. Valuation of a transfer in a multimodal public transport trip. Transp. Policy 2016, 46, 72–81. [Google Scholar] [CrossRef]
- Nielsen, O.A.; Eltved, M.; Anderson, M.K.; Prato, C.G. Relevance of detailed transfer attributes in large-scale multimodal route choice models for metropolitan public transport passengers. Transp. Res. Part A Policy Pract. 2021, 147, 76–92. [Google Scholar] [CrossRef]
- Qu, Y.; Bektaş, T.; Bennell, J. Sustainability SI: Multimode Multicommodity Network Design Model for Intermodal Freight Transportation with Transfer and Emission Costs. Netw. Spat. Econ. 2014, 16, 303–329. [Google Scholar] [CrossRef]
- Abourraja, M.N.; Oudani, M.; Samiri, M.Y.; Boudebous, D.; El Fazziki, A.; Najib, M.; Bouain, A.; Rouky, N. A Multi-Agent Based Simulation Model for Rail–Rail Transshipment: An Engineering Approach for Gantry Crane Scheduling. IEEE Access 2017, 5, 13142–13156. [Google Scholar] [CrossRef]
- Wei, Q.; Xu, Y.; Li, C.; Zhang, Y. Efficiency Evaluation of LCL Transshipment at Port Railway Container Intermodal Terminal. J. Coast. Res. 2019, 83, 456. [Google Scholar] [CrossRef]
- Wang, N.; Zeng, X.-M.; Guo, W.-D.; Chen, C.; You, W.; Zheng, Y.; Zhu, J. Quantitative diagnosis of moisture sources and transport pathways for summer precipitation over the mid-lower Yangtze River Basin. J. Hydrol. 2018, 559, 252–265. [Google Scholar] [CrossRef]
- Dong, L.; Xu, X.; Zhao, T.; Ren, H. Linkage between moisture transport over the Yangtze River Basin and a critical area of the Tibetan Plateau during the Meiyu. Clim. Dyn. 2019, 53, 2643–2662. [Google Scholar] [CrossRef]
- Meng, X.; Yu, W.; Zheng, C.; Wang, D.; Cao, X. Path Analysis of Energy-Saving Technology in Yangtze River Basin Based on Multi-Objective and Multi-Parameter Optimisation. J. Therm. Sci. 2019, 28, 1164–1175. [Google Scholar] [CrossRef]
- Tang, W.; Zhang, X.; Bai, X.; Zhang, L.; Yuan, M.; Li, B.; Liang, R. Prediction and evaluation of air conditioner energy consumption of residential buildings in the Yangtze River Basin. J. Build. Eng. 2023, 65, 105714. [Google Scholar] [CrossRef]
- Zhao, X.; Zhang, X. Research on the Evaluation and Regional Differences in Carbon Emissions Efficiency of Cultural and Related Manufacturing Industries in China’s Yangtze River Basin. Sustainability 2022, 14, 579. [Google Scholar] [CrossRef]
- Yu, Q.; Cui, Y.; Liu, L. Assessment of the parameter sensitivity for the ORYZA model at the regional scale—A case study in the Yangtze River Basin. Environ. Model. Softw. 2023, 159, 105575. [Google Scholar] [CrossRef]
- Žibert, M.; Prevolšek, B.; Pažek, K.; Rozman, Č.; Škraba, A. Developing a diversification strategy of non-agricultural activities on farms using system dynamics modeling: A case study of Slovenia. Kybernetes 2021, 51, 33–56. [Google Scholar] [CrossRef]
- Guo, B.; Zhang, B.; Li, Y.; Gupta, P. Modeling and Simulation of Consumer Preference Decision for Commercial Complex Location Based on System Dynamics. Sci. Program. 2022, 2022, 1846254. [Google Scholar] [CrossRef]
- Christensen, T.; Panoutsou, C. Advanced Biofuel Value Chains through System Dynamics Modelling and Competitive Priorities. Energies 2022, 15, 627. [Google Scholar] [CrossRef]
- Kim, C.; Lee, T.-E. Modeling and simulation of automated manufacturing systems for evaluation of complex schedules. Int. J. Prod. Res. 2013, 51, 3734–3747. [Google Scholar] [CrossRef]
- Moridi, A.; Tabatabaie, M.R.M.; Esmaeelzade, S. Holistic Approach to Sustainable Groundwater Management in Semi-arid Regions. Int. J. Environ. Res. 2018, 12, 347–355. [Google Scholar] [CrossRef]
- Venturini, G.; Iris, Ç.; Kontovas, C.A.; Larsen, A. The multi-port berth allocation problem with speed optimization and emission considerations. Transp. Res. Part D Transp. Environ. 2017, 54, 142–159. [Google Scholar] [CrossRef]
- Iris, Ç.; Pacino, D.; Ropke, S.; Larsen, A. Integrated Berth Allocation and Quay Crane Assignment Problem: Set partitioning models and computational results. Transp. Res. Part E Logist. Transp. Rev. 2015, 81, 75–97. [Google Scholar] [CrossRef]
- Iris, C.; Lam, J. Recoverable robustness in weekly berth and quay crane planning. Transp. Res. Part B Methodol. 2019, 122, 365–389. [Google Scholar] [CrossRef]
- Fun, W.H.; Tan, E.H.; Khalid, R.; Sararaks, S.; Tang, K.F.; Ab Rahim, I.; Md Sharif, S.; Jawahir, S.; Sibert, R.M.Y.; Nawawi, M.K.M. Applying Discrete Event Simulation to Reduce Patient Wait Times and Crowding: The Case of a Specialist Outpatient Clinic with Dual Practice System. Healthcare 2022, 10, 189. [Google Scholar] [CrossRef]
- Zhang, X. Application of discrete event simulation in health care: A systematic review. BMC Health Serv. Res. 2018, 18, 687. [Google Scholar] [CrossRef]
- Arnau, Q.; Barrena, E.; Panadero, J.; de la Torre, R.; Juan, A.A. A biased-randomized discrete-event heuristic for coordinated multi-vehicle container transport across interconnected networks. Eur. J. Oper. Res. 2022, 302, 348–362. [Google Scholar] [CrossRef]
- Sprock, T.; Bock, C. SysML Models for Discrete Event Logistics Systems. J. Res. Natl. Inst. Stand. Technol. 2020, 125, 125023. [Google Scholar] [CrossRef] [PubMed]
- Turner, A.P.; Sama, M.P.; McNeill, L.S.G.; Dvorak, J.S.; Mark, T.; Montross, M.D. A discrete event simulation model for analysis of farm scale grain transportation systems. Comput. Electron. Agric. 2019, 167, 105040. [Google Scholar] [CrossRef]
- Capocchi, L.; Santucci, J.-F. Discrete Event Modeling and Simulation for Reinforcement Learning System Design. Information 2022, 13, 121. [Google Scholar] [CrossRef]
- Tavanpour, M.; Kazi, B.U.; Wainer, G. Discrete Event Systems Specifications Modelling and Simulation of Wireless Networking Applications. J. Simul. 2020, 16, 1–25. [Google Scholar] [CrossRef]
- Chen, K.-Y.; Lu, S.-S. A Petri-net and entity-relationship diagram based object-oriented design method for manufacturing systems control. Int. J. Comput. Integr. Manuf. 1997, 10, 17–28. [Google Scholar] [CrossRef]
- Feng-Yang, K. A methodolgy for deriving an entity-relationship model based on a data flow diagram. J. Syst. Softw. 1994, 24, 139–154. [Google Scholar] [CrossRef]
- Purchase, H.C.; Welland, R.; McGill, M.; Colpoys, L. Comprehension of diagram syntax: An empirical study of entity relationship notations. Int. J. Hum.-Comput. Stud. 2004, 61, 187–203. [Google Scholar] [CrossRef]
- Yoshizumi, T.; Kirishima, T.; Goto, T.; Tsuchida, K.; Yaku, T. A graph grammar for entity relationship diagrams. In Proceedings of the 2016 IEEE 14th International Conference on Industrial Informatics (INDIN), Poitiers, France, 18–21 July 2016; pp. 810–815. [Google Scholar]
- Cagiltay, N.E.; Tokdemir, G.; Kilic, O.; Topalli, D. Performing and analyzing non-formal inspections of entity relationship diagram (ERD). J. Syst. Softw. 2013, 86, 2184–2195. [Google Scholar] [CrossRef]
- Chen, J.C.; Chen, T.-L.; Teng, Y.-C. Meta-model-based simulation optimization for automated guided vehicle systems under different charging mechanisms. Simul. Model. Pract. Theory 2021, 106, 102208. [Google Scholar] [CrossRef]
- Tao, D. Discuss the determination method of berth utilization rate. Port Eng. Technol. 2015, 52, 21–25. [Google Scholar] [CrossRef]
- Iris, Ç.; Lam, J.S.L. A review of energy efficiency in ports: Operational strategies, technologies and energy management systems. Renew. Sustain. Energy Rev. 2019, 112, 170–182. [Google Scholar] [CrossRef]


Disclaimer/Publisher’s Note: The statements, opinions and data contained in all publications are solely those of the individual author(s) and contributor(s) and not of MDPI and/or the editor(s). MDPI and/or the editor(s) disclaim responsibility for any injury to people or property resulting from any ideas, methods, instructions or products referred to in the content. |
© 2023 by the authors. Licensee MDPI, Basel, Switzerland. This article is an open access article distributed under the terms and conditions of the Creative Commons Attribution (CC BY) license (https://creativecommons.org/licenses/by/4.0/).