Abstract
Evaporation of a sessile drop is ubiquitous in nature and has many industrial applications. Despite extensive studies over recent decades, a critical issue, i.e., how temperature varies near contact lines, remains elusive. In this work, we report to date the first direct experimental measurement showing the microscopic temperature distribution near contact lines of an evaporating pinned sessile drop. Using a fluorescence-based thermometry, we find that the temperature at the free interface near contact lines varies drastically along the radial direction, engendering a concentric fringe pattern that evolves over the evaporation lifespan. The formation of such fringe patterns is attributed to a combined mechanism of locally enhanced evaporative cooling at the drop edge and the development of interfacial convective vortices due to Bénard-Marangoni instability. We also study the evaporation dynamics at different initial contact angles and find that the characteristics of this fringe pattern vary as the initial contact angle decreases. Our experimental investigation and theoretical analysis in this work reveal insights to the understanding of droplet evaporation dynamics in various heat transfer systems.
1. Introduction
The evaporation of sessile drops plays an important role in a great diversity of applications, ranging from thermal managements in HVAC & R systems [1,2,3,4,5], inkjet printing [6,7], biological tissue engineering [8,9,10], fabrication of microelectronics [11,12,13], to spraying of herbicides and pesticides in agriculture [14]. Because of its relevance in these applications, the evaporation of sessile drops has been the subject of extensive experimental and theoretical studies. Its evaporation dynamics in various scenarios, such as isothermal or heated [15], placed on an insulating or conductive substrate [16], exposed to natural or forced convection [17], under micro-gravitational or terrestrial condition [18,19], have been investigated in past decades. The physics associated with this phenomenon consists of diffusive and convective flows for pure vapor transport, the Hertz-Knudsen-Langmuir description for vapor transport kinetics across the liquid-gas interface [20], the pining criterion of the contact line [21,22], interfacial cooling resulting from the absorbed latent heat, cellular thermos-buoyancy convection, and its companied instabilities (e.g., hydrothermal waves and 3D Bénard-Marangoni instabilities) [23,24]. Due to the complexity of the physics involved, state-of-the-art understanding of the evaporation of sessile drops is still limited, making it an unresolved problem from both fundamental and application viewpoints.
Much research work has been reported to characterize the evaporation dynamics of drops, such as the local evaporation rate and the contact angle. Of special difficulty is how to characterize experimentally the temperature profile at the liquid-gas interface due to its rapid changes both spatially and temporally. It is well known that the maximum evaporative cooling occurs near the drop edge (which is on the triple phase contact line) [25,26], where liquid is also heated faster via thermal conduction from the substrate underneath, engendering a paradox as to how exactly the temperature varies at the drop edge. Studies have shown that the temperature can vary dramatically near the drop edge since heat transfer in the vicinity of the contact line varies most wildly there and can constitute up to 50% of the total heat transfer [27,28]. Infrared thermography allows a direct visualization of thermal processes at the liquid-gas interface [29,30]. However, existing infrared thermographic results have only recorded the temperature profile of the whole (or central) interface, where multiple polychromatic (indicating the local temperature) vortexes were observed [31,32]. Thermocouples with micrometer-sized probes have also been applied to detect interface temperature variation [33]. Since the size of thermocouples is comparable to that of the drop edge, placing thermocouples may disturb the local curvature and thus affect the interface temperature. To the best of our knowledge, temperature profiles at the drop edge are still inaccessible with any of the experimental methods reported.
In this work, we adopted a microscopic fluorescence-based thermometry to visualize the temperature at the liquid-gas interface near the drop edge, allowing temporally and spatially resolved insight into the local temperature change. For the case where a sessile water drop evaporates on a heated smooth substrate during the evaporation stage with pinned contact lines, a fluorescence fringe pattern consisting of multiple concentric rings was observed at the drop edge, with their size and location evolving over time, based on which the transit local temperature profile can be determined. The evolution of such a temperature profile is later attributed to the interplay of locally enhanced evaporative cooling at the drop edge, and the development of interfacial convective vortices due to Bénard-Marangoni instability. The phenomena reported in this work and our proposed physics model qualitatively agree with existing theoretical models [24,34] and are also consistent with many reported experimental works [35].
2. Materials and Methods
We designed an experimental setup to probe the temperature profile at the liquid-gas interface near the edge of an evaporating drop on a heated substrate, as illustrated schematically in Figure 1. The experimental setup consisted of a heated substrate on which a liquid drop underwent evaporation, a hot plate that controlled the substrate temperature, and two synchronized cameras together with optical accessories for visualization and image recoding. The liquid drop consisted of deionized (DI) water mixed with a diluted fluorescence dye, Rhodamine B (Sigma-Aldrich (St. Louis, MO, USA), 0.05 mM), whose emission intensity was strongly temperature-dependent. The substrate was made from a commercially available copper plate with a thickness of 1 mm and a square cut of 3 × 3 cm2. After fine polishing and grinding, the substrate was cleaned following a standard protocol comprising rinses with acetone, ethanol, isopropyl alcohol, and DI water, and finally dried under nitrogen gas flow. The prepared substrate was then bonded to the hot plate, whose temperature was modulated by a PID controller. Two synchronized cameras with microscopic objectives were applied to monitor the evaporation process of the examined drop from both top-view and side-view. A fluorescence-based thermometry used to calculate the temperature at the liquid-gas interface of the evaporating drop was captured from the top-view using a sCMOS camera with a quantum efficiency of over 95%, allowing to detect a trial variation in light intensity. A monochromatic light source (green, wavelength λex ≈ 532 nm) was used to illuminate the liquid-gas interface and excite the fluorescence light (red, wavelength nm). The camera from the side-view was a common charge-coupled device (CCD) camera used to capture the geometry of drops in the visible spectrum. All the experimental images captured by these two cameras were stored on a personal computer for later analyses. Based on the intensity of emitted red fluorescence light, we could calculate the temperature field of the liquid-gas interface based on the calibrated correlation between local temperature and fluorescence intensity.
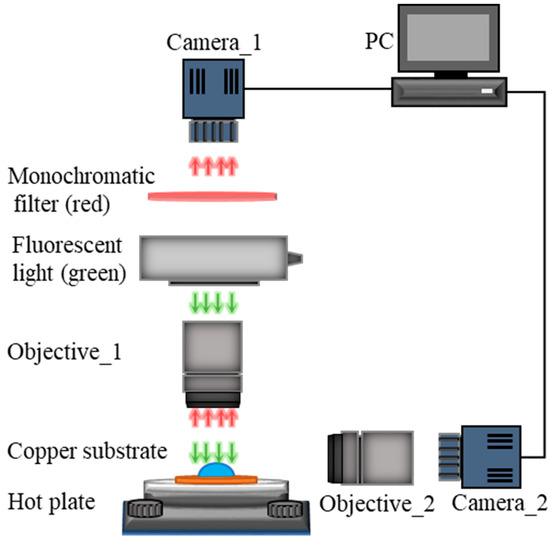
Figure 1.
Schematics of the experiment setup used to probe the temperature profile at the liquid-gas interface of an evaporating sessile drop.
During the experiments, a drop of the fixed volume of 6.7 ± 0.1 µL was gently deposited onto the heated substrate using a micropipette, and the uncertainty was obtained based on 30 independent measurements. The shape of drops was treated as a spherical cap as the static Bond number << 1, with ρ, g, h, and σ, being the density of water, the gravitational acceleration, the height of drops, and the surface tension of water to air, respectively. Drops and the substrate were exposed to the ambient, with a relative humidity of RH = 65 ± 5% at a room temperature of = 18 ± 0.5 °C as measured by the thermohygrometer. Accordingly, the evaporation process could be treated as a combined diffusive and natural convective mass (water molecules) transport. The initial temperature of drops was maintained at , and the moment of deposition was considered as the onset of evaporation, i.e., t = 0 s. The substrate temperature was set and maintained at = 55 ± 0.1 °C using the PID controller integrated in the hot plate. Since (with and being the thermal resistance of the substrate and liquid drops, respectively) and the substrate was bonded to a large hot plate, we can neglect temperature variation across the substrate surface, by assuming that the evaporation occurs on a substrate having an infinite heat capacity at a constant temperature. In this work, we only study the evaporation stage when the contact line is preserved, while the height and shape of the drop change both spatially and temporally.
3. Results
From the image sequences captured by Camera_1 of top-view, we observed that a bright fluorescence fringe pattern emerged near the drop edge and evolved over time, as shown in Figure 2. The fluorescence intensity changed correspondingly to the local temperature of the drop, with brighter color for lower temperature and darker color for higher temperature (see calibrated results shown in Figure 3a). However, the change in fluorescence intensity across the central drop was insignificant. The location of the contact radius in Figure 2a–e can be identified at the location where the fluorescence intensity suddenly became vanishingly small. Note that the fluorescence fringe pattern was not exactly symmetric due to the non-ideal experimental condition. In the highlighted region (at the drop edge) of Figure 2a, more details about the time-sequential fringe pattern at five distinctive stages are shown in Figure 2b–f. At the beginning of evaporation, the fluorescence intensity was almost uniform across the whole liquid-gas interface, as shown in Figure 2b. Later, the drop edge started to glow, generating a bright single fringe (type I) that expanded inward as evaporation proceeded, as shown in Figure 2c. Then, thinner and brighter fringes (type II) emerged on top of the type I fringe and drifted inward while the initial type I fringe continued to expand. More type II fringes drifted inward and became brighter, forming a complex fringe pattern comprised of one type I fringe (bright and wide) and multiple type II fringes (brightest and sharp) as shown in Figure 2d. Subsequently, the type I fringe ceased to expand, and meanwhile, the type II fringes became darker and undetectable, as shown in Figure 2e. Finally, the type I fringe started to shrink from the inner region and is now approaching complete diminishment. Instead, a dark fringe replaced the type I fringe, as shown in Figure 2f. Note that the average fluorescence intensity decreased as the evaporation proceeded and the dye concentration increased. Thus, the brightness of Figure 2e,f was enhanced with time. Also, right after the last stage, the contact line began to unpin.
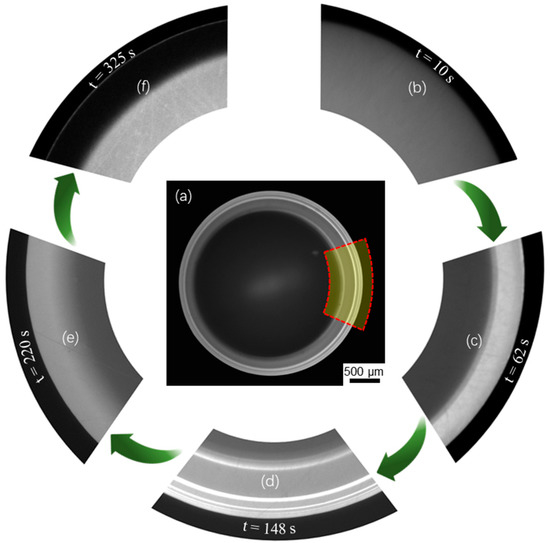
Figure 2.
Evaporation dynamics of an evaporating sessile water drop from the top view. (a) a fluorescence fringe pattern of the whole drop captured at an instant (t = 148 s), where the grey value is used to indicate local temperature. (b–f) the captured images in the selected region as highlighted in (a), showing the evolution of the fringe pattern at five distinctive stages corresponding to t = 10 s, 62 s, 148 s, 220 s and 325 s.
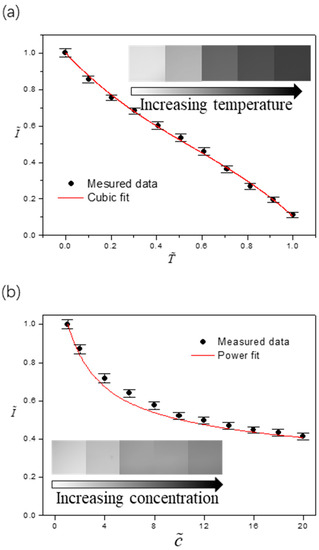
Figure 3.
Characterized dependence of the fluorescence intensity on (a) temperature and on (b) concentration of the fluorescence dye. The error bars were obtained from five independent measurements.
Based on direct experimental calibrations, we found that the fluorescence intensity was independent of the thickness of the liquid layer and its configuration. As the local fluorescence intensity is temperature-dependent, the pattern comprising of dark and bright fringes is thus intrinsically representing the temperature variation at the liquid-gas interface. However, note that the concentration of fluorescence dye kept increasing as the evaporation proceeded and more solvent (water) was lost. Accordingly, the fluorescence intensity also changed due to global or local concentration enrichment of the fluorescence dye. To extract the temperature information based on the fluorescence fringe pattern, we have to eliminate the effect of concentration and construct a correlation that gives the fluorescence intensity as a sole function of the temperature.
Figure 3a,b shows the dependence of dimensionless fluorescence intensity on dimensionless temperature and dimensionless concentration , respectively. These dimensionless quantities are defined as , and where TMin = 12.1 ± 0.1 °C (the dew point at and room relative humidity), TMax = 61.3 ± 0.1 °C (the maximum temperature chosen for the calibration), c0 = 0.05 mM is the initial concentration of the fluorescence dye, and IMax is the maximum fluorescence intensity obtained at TMin and c0. Within the range of interest, the emission intensity decreases monotonically when the liquid is heated or the fluorescence dye gets more concentrated. The difference, however, is that temperature varies at different locations on the liquid-gas interface (local), whereas the concentration of the fluorescence dye is uniform across the whole drop (global) except at the last stage when the “coffee-ring” effect existed. Accordingly, we can decouple the effects of two factors by assuming , meaning that the concentration dependence of fluorescence intensity is superimposed on that of the temperature. Based on the calibration results, we obtain [36,37] and by using the least square fitting method.
Figure 4 shows both the side-view and (magnified) top-view sequential evaporation dynamics for a sessile drop with an initial contact angle of θ0 = 87.3 ± 0.2° and an initial volume V0. From the side-view captured images as shown in Figure 4a, we can see the decrease in the contact angle, and we calculate from the change in the contact angle θ(t) using (where with r being the contact radius. Note that r is preserved during the evaporation stage of our interest. Meanwhile, from the top-view captured images, as shown in Figure 4b, we can obtain the fluorescence intensity profiles along the radial direction.
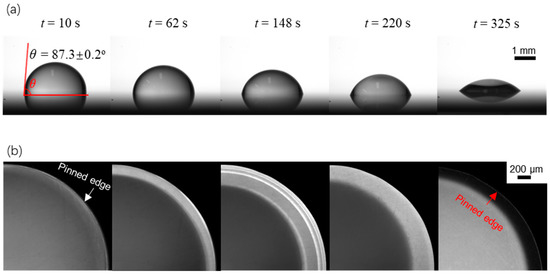
Figure 4.
Evaporation dynamics of an evaporating sessile water drop on a surface with an initial contact angle of θ0 = 87.3 ± 0.2°. (a) side-view images showing variation of the drop contact angle with time; (b) top-view images showing variation of the fluorescence intensity over time.
Figure 5a shows the temporal global concentration enrichment due to the solvent loss as evaporation proceeds, with a power fitting of . Figure 5b shows the radial fluorescence intensity profiles at five different stages after a noise removal process by the Savitzky-Golay method was applied. By inserting into the fitting result of , we can eliminate the concentration dependence of fluorescence intensity, yielding a direct correlation where the radial variation of fluorescence intensity is solely due to the change of local temperature, i.e., . Accordingly, the temperature profiles at the liquid-gas interface and their evolution over time can be obtained, and the results are depicted in Figure 5c. From the extracted temperature profiles, we found that the temperature at the drop edge changes drastically over time, whereas the temperature changes in the central drop are insignificant. At the incipient stage (t = 10 s) of evaporation, the temperature at the liquid-gas interface is determined by the energy balance between conduction from the substrate base and interfacial evaporative cooling. From the former, the apex of the liquid-gas interface is at a lower temperature than the rest as thermal resistance is locally proportional to the liquid layer thickness. From the latter, however, the drop edge is of lower temperature due to the high heat transfer rate at the triple-phase line. Note that when θc ≈ π/2, the evaporative interfacial cooling is almost uniform along the liquid-gas interface due to spherical symmetry, as reported in the literature [26,34]. Accordingly, the interfacial temperature is slightly lower at the apex and drop edge, while some place between them has a higher temperature.
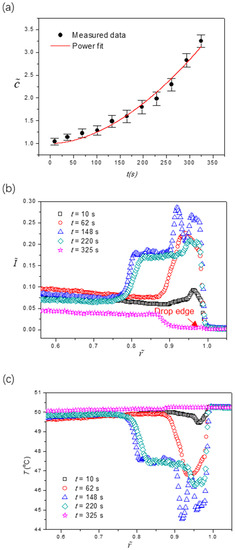
Figure 5.
(a) global concentration enrichment of the fluorescent dye calculated based on the dynamic drop volume from Figure 4a; (b) profiles of the fluorescence intensity along the radial direction obtained from Figure 4b; (c) extracted temperature profiles along the radial direction at five different stages. The contact angle of the surface is θ0 = 87.3 ± 0.2°.
Figure 6 shows schematically the evolution of the fringe pattern when the contact angle decreases as evaporation proceeds. As shown in Figure 6a, the droplet at t = 62 s has a relatively large contact angle. The benefit from faster conduction is overtaken by the locally enhanced interfacial evaporative cooling at the drop edge [25,26], yielding a bright cooling region (type I fringe). Meanwhile, a Marangoni flow moving from the drop edge to the apex is generated along the liquid-gas interface, whereas liquid inside the drop flows to the drop edge to replenish the liquid consumed by evaporation [38,39]. As the flow drifts inward along the liquid-gas interface, the cooling region starts to expand. Also, we can anticipate that the cooling region will become warmer during its expansion as the benefit of nonuniform evaporative cooling is diffused to a larger region. Subsequently, at t = 148 s the droplet with the contact angle kept decreasing as shown schematically in Figure 6b, an appreciable temperature gradient is built along the vertical direction when the liquid-gas interface above is of lower temperature while the liquid layer underneath is of high temperature. The system becomes unstable because of Bénard-Marangoni instability. Accordingly, multiple convective vortices are formed, and their spatial configuration evolves as evaporation proceeds [34,35]. Interfacial evaporative cooling is compromised by these convective vortices, which transport warm liquid upwards from the heated bottom layer. Cooling spots (type II fringe) emerge between every two adjacent vortices where the effect of circulating warm liquid is minor. Note that spots on the liquid-gas interface from the section-view are concentric rings on a truncated spherical cap from the top-view. Subsequently, at t = 220 s (see Figure 2e and Figure 4), local evaporative flux decreases and becomes more uniform as the contact angle decreases. The cooling region starts to shrink, and cooling spots gradually become undetectable. Finally, at t = 325 s, as shown schematically in Figure 6c, local evaporative flux becomes small and uniform when the contact angle decreases to a critical value. The liquid-gas interface has a uniformly warm temperature. However, as the fluorescence dye (solute) concentrates near the perimeter due to the “coffee-ring” effect as shown in Figure 6d [26,40], which decreases the local fluorescence intensity and thus the calculated temperature, a dark ring is formed, as shown in Figure 2f and the last image of Figure 4b.
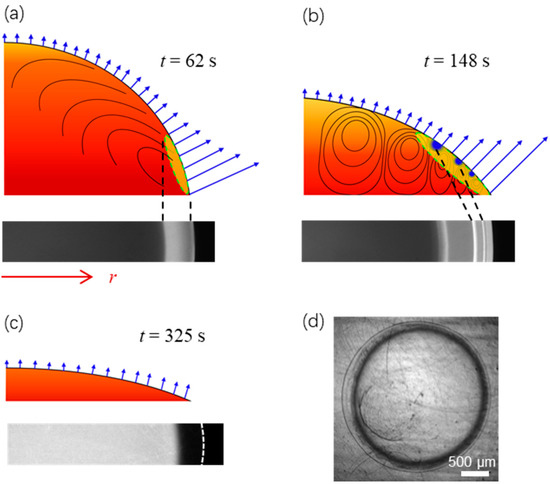
Figure 6.
Schematic of the evaporation dynamics and the formation of cooling region in (a) (yellow within the dashed circle, type I fringe), cooling spots in (b) (blue, type II fringes), and the dark ring in (c,d) (due to the “coffee-ring” effect). The contact angle of the surface is of θ0 = 87.3 ± 0.2°.
To further validate our proposed mechanism in the last paragraph, we also studied the evaporation dynamics of sessile drops on two other surfaces with different wettabilities under the same working conditions. Since the drop edge would become undetectable when θ0 > π/2, the two surfaces under consideration were more hydrophilic than the previous one (θ0 = 87.3°). These surfaces were fabricated using oxygen plasma treatment on the smooth copper substrates for 15 s and 200 s, respectively, which had an initial contact angle of 59.9° and 32.5°, respectively. Figure 7 and Figure 8 show the evaporation dynamics and extracted temperature profiles of sessile drops on these two surfaces. We found that the fluorescence intensity (or temperature) profile was the response of the non-uniform evaporative cooling and flow regime near the liquid-gas interface to the contact angle. The five fluorescence fringe patterns were at least partially missing as the initial contact angle became smaller. In particular, the most distinguishable pattern, which consists of multiple type II fringes atop one continuous type I fringe, disappears if the initial contact angle is smaller than a critical value of around 40°. Also, we noticed that the influence of the “coffee-ring” effect was quite different for three wettabilities by comparing the last images of Figure 4b and Figure 7c,d. For the large initial contact angle, the benefit (increasing fluorescence intensity) of the non-uniform evaporative cooling is overcome by the condensed fluorescence dye, leaving a dark ring near the drop edge. For the small initial contact angle, the non-uniform evaporative cooling occurs only at the last stage, yielding a bright ring near the drop edge.
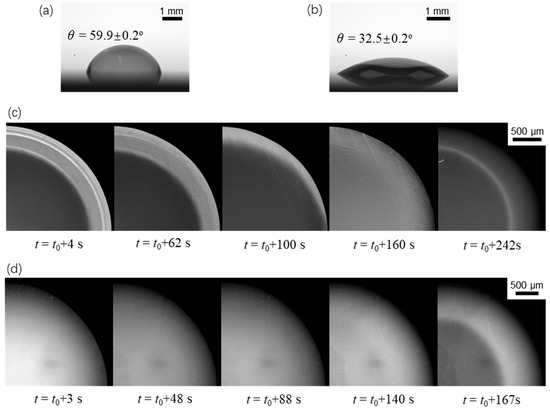
Figure 7.
Evaporation dynamics of an evaporating sessile water drop on surfaces with two different initial contact angles. (a) θ = 59.9 ± 0.2° and (b) θ = 32.5 ± 0.1° show the contact angles of two drops right after loading onto the substrate. (c,d) are top-view images on the corresponding surfaces showing variation of the fluorescence intensity.
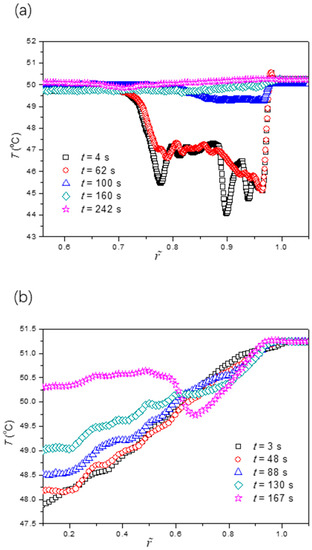
Figure 8.
Extracted temperature profiles along the radial direction for cases of the initial contact angle of the surface (a) θ = 59.9 ± 0.2° and (b) θ = 32.5 ± 0.1°.
4. Conclusions Remarks
In this work, we measured temperature profiles of the free interface at the drop edge when a drop on a heated substrate evaporates with pinned contact lines for the first time. Different from what is reported in the literature, we found that the temperature variation and its evolution are much more drastic and complicated. Temperature profiles with multiple peaks and valleys were extracted based on the measured fluorescence fringe patterns, which consist of concentric rings. The physics underlying why the temperature profile varies in such a regime is attributed to the interplay of locally enhanced evaporative cooling at the drop edge and interfacial convective vortices due to Bénard-Marangoni instability.
The experimental findings and our proposed mechanism represent an important advance in our understanding of drop evaporation dynamics, enabling new rational designs for multiple applications.
Author Contributions
Conceptualization, X.Z. and Y.Z.; methodology, X.Z., D.W. and Y.Z.; formal analysis, X.Z., D.W. and Y.Z.; investigation, X.Z. and Y.Z.; writing—original draft preparation, X.Z. and Y.Z.; writing—review and editing, X.Z. and Y.Z.; supervision, Y.Z.; funding acquisition, Y.Z. and D.W. All authors have read and agreed to the published version of the manuscript.
Funding
This research was funded by the National Natural Science Foundation of China (No. 52276079, 52206101) to Y.Z. and D.W., the Experiments for Space Exploration Program and the Qian Xuesen Laboratory, China Academy of Space Technology (Grant No. TKTSPY-2020-01-01) to Y.Z., Open Fund of Key Laboratory of Icing and Anti/De-icing (Grant No. IADL20200103) to Y.Z., National Key R&D Program of China (Grant No. 2020YFF0303901).
Data Availability Statement
Data sharing not applicable.
Conflicts of Interest
The authors declare no conflict of interest.
References
- Erbil, H.Y. Evaporation of pure liquid sessile and spherical suspended drops: A review. Adv. Colloid Interface Sci. 2012, 170, 67–86. [Google Scholar] [CrossRef] [PubMed]
- Chen, R.-H.; Chow, L.C.; Navedo, J.E. Effects of spray characteristics on critical heat flux in subcooled water spray cooling. Int. J. Heat Mass Transf. 2002, 45, 4033–4043. [Google Scholar] [CrossRef]
- Wiedenheft, K.F.; Guo, H.A.; Qu, X.; Boreyko, J.B.; Liu, F.; Zhang, K.; Eid, F.; Choudhury, A.; Li, Z.; Chen, C.-H. Hotspot cooling with jumping-drop vapor chambers. Appl. Phys. Lett. 2017, 110, 141601. [Google Scholar] [CrossRef]
- Zhao, Y.; Yan, Z.; Zhang, H.; Yang, C.; Cheng, P. Promote anti-/de-frosting by suppressing directional ice bridging. Int. J. Heat Mass Transf. 2021, 165, 120609. [Google Scholar] [CrossRef]
- Zhao, Y.; Guo, Q.; Lin, T.; Cheng, P. A review of recent literature on icing phenomena: Transport mechanisms, their modulations and controls. Int. J. Heat Mass Transf. 2020, 159, 120074. [Google Scholar] [CrossRef]
- Deegan, R.D.; Bakajin, O.; Dupont, T.F.; Huber, G.; Nagel, S.R.; Witten, T.A. Capillary flow as the cause of ring stains from dried liquid drops. Nature 1997, 389, 827–829. [Google Scholar] [CrossRef]
- Yunker, P.J.; Still, T.; Lohr, M.A.; Yodh, A.G. Suppression of the coffee-ring effect by shape-dependent capillary interactions. Nature 2011, 476, 308–311. [Google Scholar] [CrossRef]
- Accardo, A.; Gentile, F.; Mecarini, F.; De Angelis, F.; Burghammer, M.; Di Fabrizio, E.; Riekel, C. In Situ X-ray Scattering Studies of Protein Solution Droplets Drying on Micro- and Nanopatterned Superhydrophobic PMMA Surfaces. Langmuir 2010, 26, 15057–15064. [Google Scholar] [CrossRef]
- Jing, J.; Reed, J.; Huang, J.; Hu, X.; Clarke, V.; Edington, J.; Housman, D.; Anantharaman, T.S.; Huff, E.J.; Mishra, B.; et al. Automated high resolution optical mapping using arrayed, fluid-fixed DNA molecules. Proc. Natl. Acad. Sci. USA 1998, 95, 8046. [Google Scholar] [CrossRef]
- Smalyukh, I.I.; Zribi, O.V.; Butler, J.C.; Lavrentovich, O.D.; Wong, G.C.L. Structure and Dynamics of Liquid Crystalline Pattern Formation in Drying Droplets of DNA. Phys. Rev. Lett. 2006, 96, 177801. [Google Scholar] [CrossRef]
- Goh, G.L.; Saengchairat, N.; Agarwala, S.; Yeong, W.Y.; Tran, T. Sessile droplets containing carbon nanotubes: A study of evaporation dynamics and CNT alignment for printed electronics. Nanoscale 2019, 11, 10603–10614. [Google Scholar] [CrossRef]
- Kolegov, K.S.; Barash, L.Y. Applying droplets and films in evaporative lithography. Adv. Colloid Interface Sci. 2020, 285, 102271. [Google Scholar] [CrossRef]
- Zhao, Y.; Yang, C.; Cheng, P. Freezing of a nanofluid droplet: From a pointy tip to flat plateau. Appl. Phys. Lett. 2021, 118, 141602. [Google Scholar] [CrossRef]
- Zang, D.; Tarafdar, S.; Tarasevich, Y.Y.; Dutta Choudhury, M.; Dutta, T. Evaporation of a Droplet: From physics to applications. Phys. Rep. 2019, 804, 1–56. [Google Scholar] [CrossRef]
- Zhu, J.-L.; Shi, W.-Y.; Feng, L. Bénard-Marangoni instability in sessile droplet evaporating at constant contact angle mode on heated substrate. Int. J. Heat Mass Transf. 2019, 134, 784–795. [Google Scholar] [CrossRef]
- Ristenpart, W.D.; Kim, P.G.; Domingues, C.; Wan, J.; Stone, H.A. Influence of Substrate Conductivity on Circulation Reversal in Evaporating Drops. Phys. Rev. Lett. 2007, 99, 234502. [Google Scholar] [CrossRef]
- Buffone, C. Evaporating sessile drops subject to crosswind. Int. J. Therm. Sci. 2019, 144, 1–10. [Google Scholar] [CrossRef]
- Zhu, G.; Wei, T.; Duan, F. Chapter 18—Hydrothermal Waves. In Droplet Wetting and Evaporation; Brutin, D., Ed.; Academic Press: Oxford, UK, 2015; pp. 251–275. [Google Scholar]
- Zhong, X.; Duan, F. Stable Hydrothermal Waves at Steady State Evaporating Droplet Surface. Sci. Rep. 2017, 7, 16219. [Google Scholar] [CrossRef]
- Persad, A.H.; Ward, C.A. Expressions for the Evaporation and Condensation Coefficients in the Hertz-Knudsen Relation. Chem. Rev. 2016, 116, 7727–7767. [Google Scholar] [CrossRef]
- Herbaut, R.; Dervaux, J.; Brunet, P.; Royon, L.; Limat, L. A criterion for the pinning and depinning of an advancing contact line on a cold substrate. Eur. Phys. J. Spec. Top. 2020, 229, 1867–1880. [Google Scholar] [CrossRef]
- Clavijo, C.E.; Crockett, J.; Maynes, D. Wenzel to Cassie transition during droplet impingement on a superhydrophobic surface. Phys. Rev. Fluids 2016, 1, 073902. [Google Scholar] [CrossRef]
- Sefiane, K.; Moffat, J.R.; Matar, O.K.; Craster, R.V. Self-excited hydrothermal waves in evaporating sessile drops. Appl. Phys. Lett. 2008, 93, 074103. [Google Scholar] [CrossRef]
- Karapetsas, G.; Matar, O.K.; Valluri, P.; Sefiane, K. Convective Rolls and Hydrothermal Waves in Evaporating Sessile Drops. Langmuir 2012, 28, 11433–11439. [Google Scholar] [CrossRef] [PubMed]
- Hu, H.; Larson, R.G. Evaporation of a Sessile Droplet on a Substrate. J. Phys. Chem. B 2002, 106, 1334–1344. [Google Scholar] [CrossRef]
- Deegan, R.D.; Bakajin, O.; Dupont, T.F.; Huber, G.; Nagel, S.R.; Witten, T.A. Contact line deposits in an evaporating drop. Phys. Rev. E 2000, 62, 756–765. [Google Scholar] [CrossRef]
- Herbert, S.; Fischer, S.; Gambaryan-Roisman, T.; Stephan, P. Local heat transfer and phase change phenomena during single drop impingement on a hot surface. Int. J. Heat Mass Transf. 2013, 61, 605–614. [Google Scholar] [CrossRef]
- Liang, G.; Mudawar, I. Review of drop impact on heated walls. Int. J. Heat Mass Transf. 2017, 106, 103–126. [Google Scholar] [CrossRef]
- Bjelobrk, N.; Girard, H.-L.; Bengaluru Subramanyam, S.; Kwon, H.-M.; Quéré, D.; Varanasi, K.K. Thermocapillary motion on lubricant-impregnated surfaces. Phys. Rev. Fluids 2016, 1, 063902. [Google Scholar] [CrossRef]
- Semenov, S.; Carle, F.; Medale, M.; Brutin, D. 3D unsteady computations of evaporative instabilities in a sessile drop of ethanol on a heated substrate. Appl. Phys. Lett. 2017, 111, 241602. [Google Scholar] [CrossRef]
- Brutin, D.; Sobac, B.; Rigollet, F.; Le Niliot, C. Infrared visualization of thermal motion inside a sessile drop deposited onto a heated surface. Exp. Therm. Fluid Sci. 2011, 35, 521–530. [Google Scholar] [CrossRef]
- Girard, F.; Antoni, M.; Sefiane, K. Infrared Thermography Investigation of an Evaporating Sessile Water Droplet on Heated Substrates. Langmuir 2010, 26, 4576–4580. [Google Scholar] [CrossRef]
- Ward, C.A.; Duan, F. Turbulent transition of thermocapillary flow induced by water evaporation. Phys. Rev. E 2004, 69, 056308. [Google Scholar] [CrossRef]
- Semenov, S.; Carle, F.; Medale, M.; Brutin, D. Boundary conditions for a one-sided numerical model of evaporative instabilities in sessile drops of ethanol on heated substrates. Phys. Rev. E 2017, 96, 063113. [Google Scholar] [CrossRef]
- Ye, S.; Zhang, L.; Wu, C.-M.; Li, Y.-R.; Liu, Q.-S. Experimental investigation of evaporation dynamic of sessile droplets in pure vapor environment with low pressures. Int. J. Therm. Sci. 2020, 149, 106213. [Google Scholar] [CrossRef]
- Zhao, Y.; Zhao, C.; He, J.; Zhou, Y.; Yang, C. Collective effects on thermophoresis of colloids: A microfluidic study within the framework of DLVO theory. Soft Matter 2013, 9, 7726–7734. [Google Scholar] [CrossRef]
- Shah, J.J.; Gaitan, M.; Geist, J. Generalized Temperature Measurement Equations for Rhodamine B Dye Solution and Its Application to Microfluidics. Anal. Chem. 2009, 81, 8260–8263. [Google Scholar] [CrossRef]
- Diddens, C.; Kuerten, J.G.M.; van der Geld, C.W.M.; Wijshoff, H.M.A. Modeling the evaporation of sessile multi-component droplets. J. Colloid Interface Sci. 2017, 487, 426–436. [Google Scholar] [CrossRef]
- Zhang, K.; Ma, L.; Xu, X.; Luo, J.; Guo, D. Temperature distribution along the surface of evaporating droplets. Phys. Rev. E 2014, 89, 032404. [Google Scholar] [CrossRef]
- Hu, H.; Larson, R.G. Marangoni Effect Reverses Coffee-Ring Depositions. J. Phys. Chem. B 2006, 110, 7090–7094. [Google Scholar] [CrossRef]


Disclaimer/Publisher’s Note: The statements, opinions and data contained in all publications are solely those of the individual author(s) and contributor(s) and not of MDPI and/or the editor(s). MDPI and/or the editor(s) disclaim responsibility for any injury to people or property resulting from any ideas, methods, instructions or products referred to in the content. |
© 2023 by the authors. Licensee MDPI, Basel, Switzerland. This article is an open access article distributed under the terms and conditions of the Creative Commons Attribution (CC BY) license (https://creativecommons.org/licenses/by/4.0/).