Review

Increasing Growth of Renewable Energy: A State of Art

1
Department of Industrial Engineering, Yonsei University, 50 Yonsei-ro, Sinchon-dong, Seodaemun-gu, Seoul 03722, Republic of Korea
2
Center for Transdisciplinary Research (CFTR), Saveetha Dental College, Saveetha Institute of Medical and Technical Sciences, Saveetha University, 162, Poonamallee High Road, Velappanchavadi, Chennai 600077, Tamil Nadu, India
*
Author to whom correspondence should be addressed.
Energies 2023, 16(6), 2665; https://doi.org/10.3390/en16062665
Submission received: 3 January 2023 / Revised: 15 February 2023 / Accepted: 16 February 2023 / Published: 12 March 2023

Abstract

:
The growth of renewable energy actively takes part in decarbonizing the fossil-fuel-based energy system. It reduces carbon emissions, carbon footprint, and greenhouse gas emissions and increases clean energy. The usage of renewable resources reduces and solves several problems, such as increasing temperature, carbon footprint, greenhouse gas emissions, and energy waste. Every sector contributes to increasing the above-mentioned factors in the environment. One of the main reasons for this biodegradation and climate change is energy resources. Using renewable energy instead of fossil fuel can solve the problem. This paper aims to find open research problems about the application of renewable energy and to initiate new innovative ideas regarding renewable energy. A detailed state of the art includes trends for renewable energy resources, their theoretical evolution, and practical implementations. Methodologies used for decision analysis in renewable energy are discussed in detail. The time frame for this analysis of renewable energy is 2010 to >2022. An extensive literature review finds a huge research scope in applying renewable energy in other research, such as logistics, smart production management, and advanced inventory management. Then, major changes in the profit/cost of that system due to renewable energy can be analyzed. This research proposes some innovative new ideas related cost formulas for renewable energy for the corresponding open problems.

1. Introduction

Energy demand is increasing every year along with corresponding economic growth. Or, it can be said that increasing economic growth increases the energy demand worldwide. The economic growth and energy market demand are well-connected. The cumulative annual growth is predicted to be 0.8% by 2030 and by 0.1% by 2050 [1]. The predicted decreasing demand pattern of the traditional energy is because of the increasing use of renewable energy (RE). The traditional energy is because of fossil fuel. The main difference between fossils fuel energy and RE is the conversion of energy from one form to another due to burning. For example, the conversion is from chemical energy to electric energy for coal power plants, whereas heat engine converts chemical energy to mechanical energy. This conversion of energy losses a mass balance, which will be saved for RE [2]. Of course, the capturing and the storing RE requires several technological supports, and the technological development supports these [3] energy conversions. The increasing demand for alternative energy resources increases the research quotient in the field of RE.
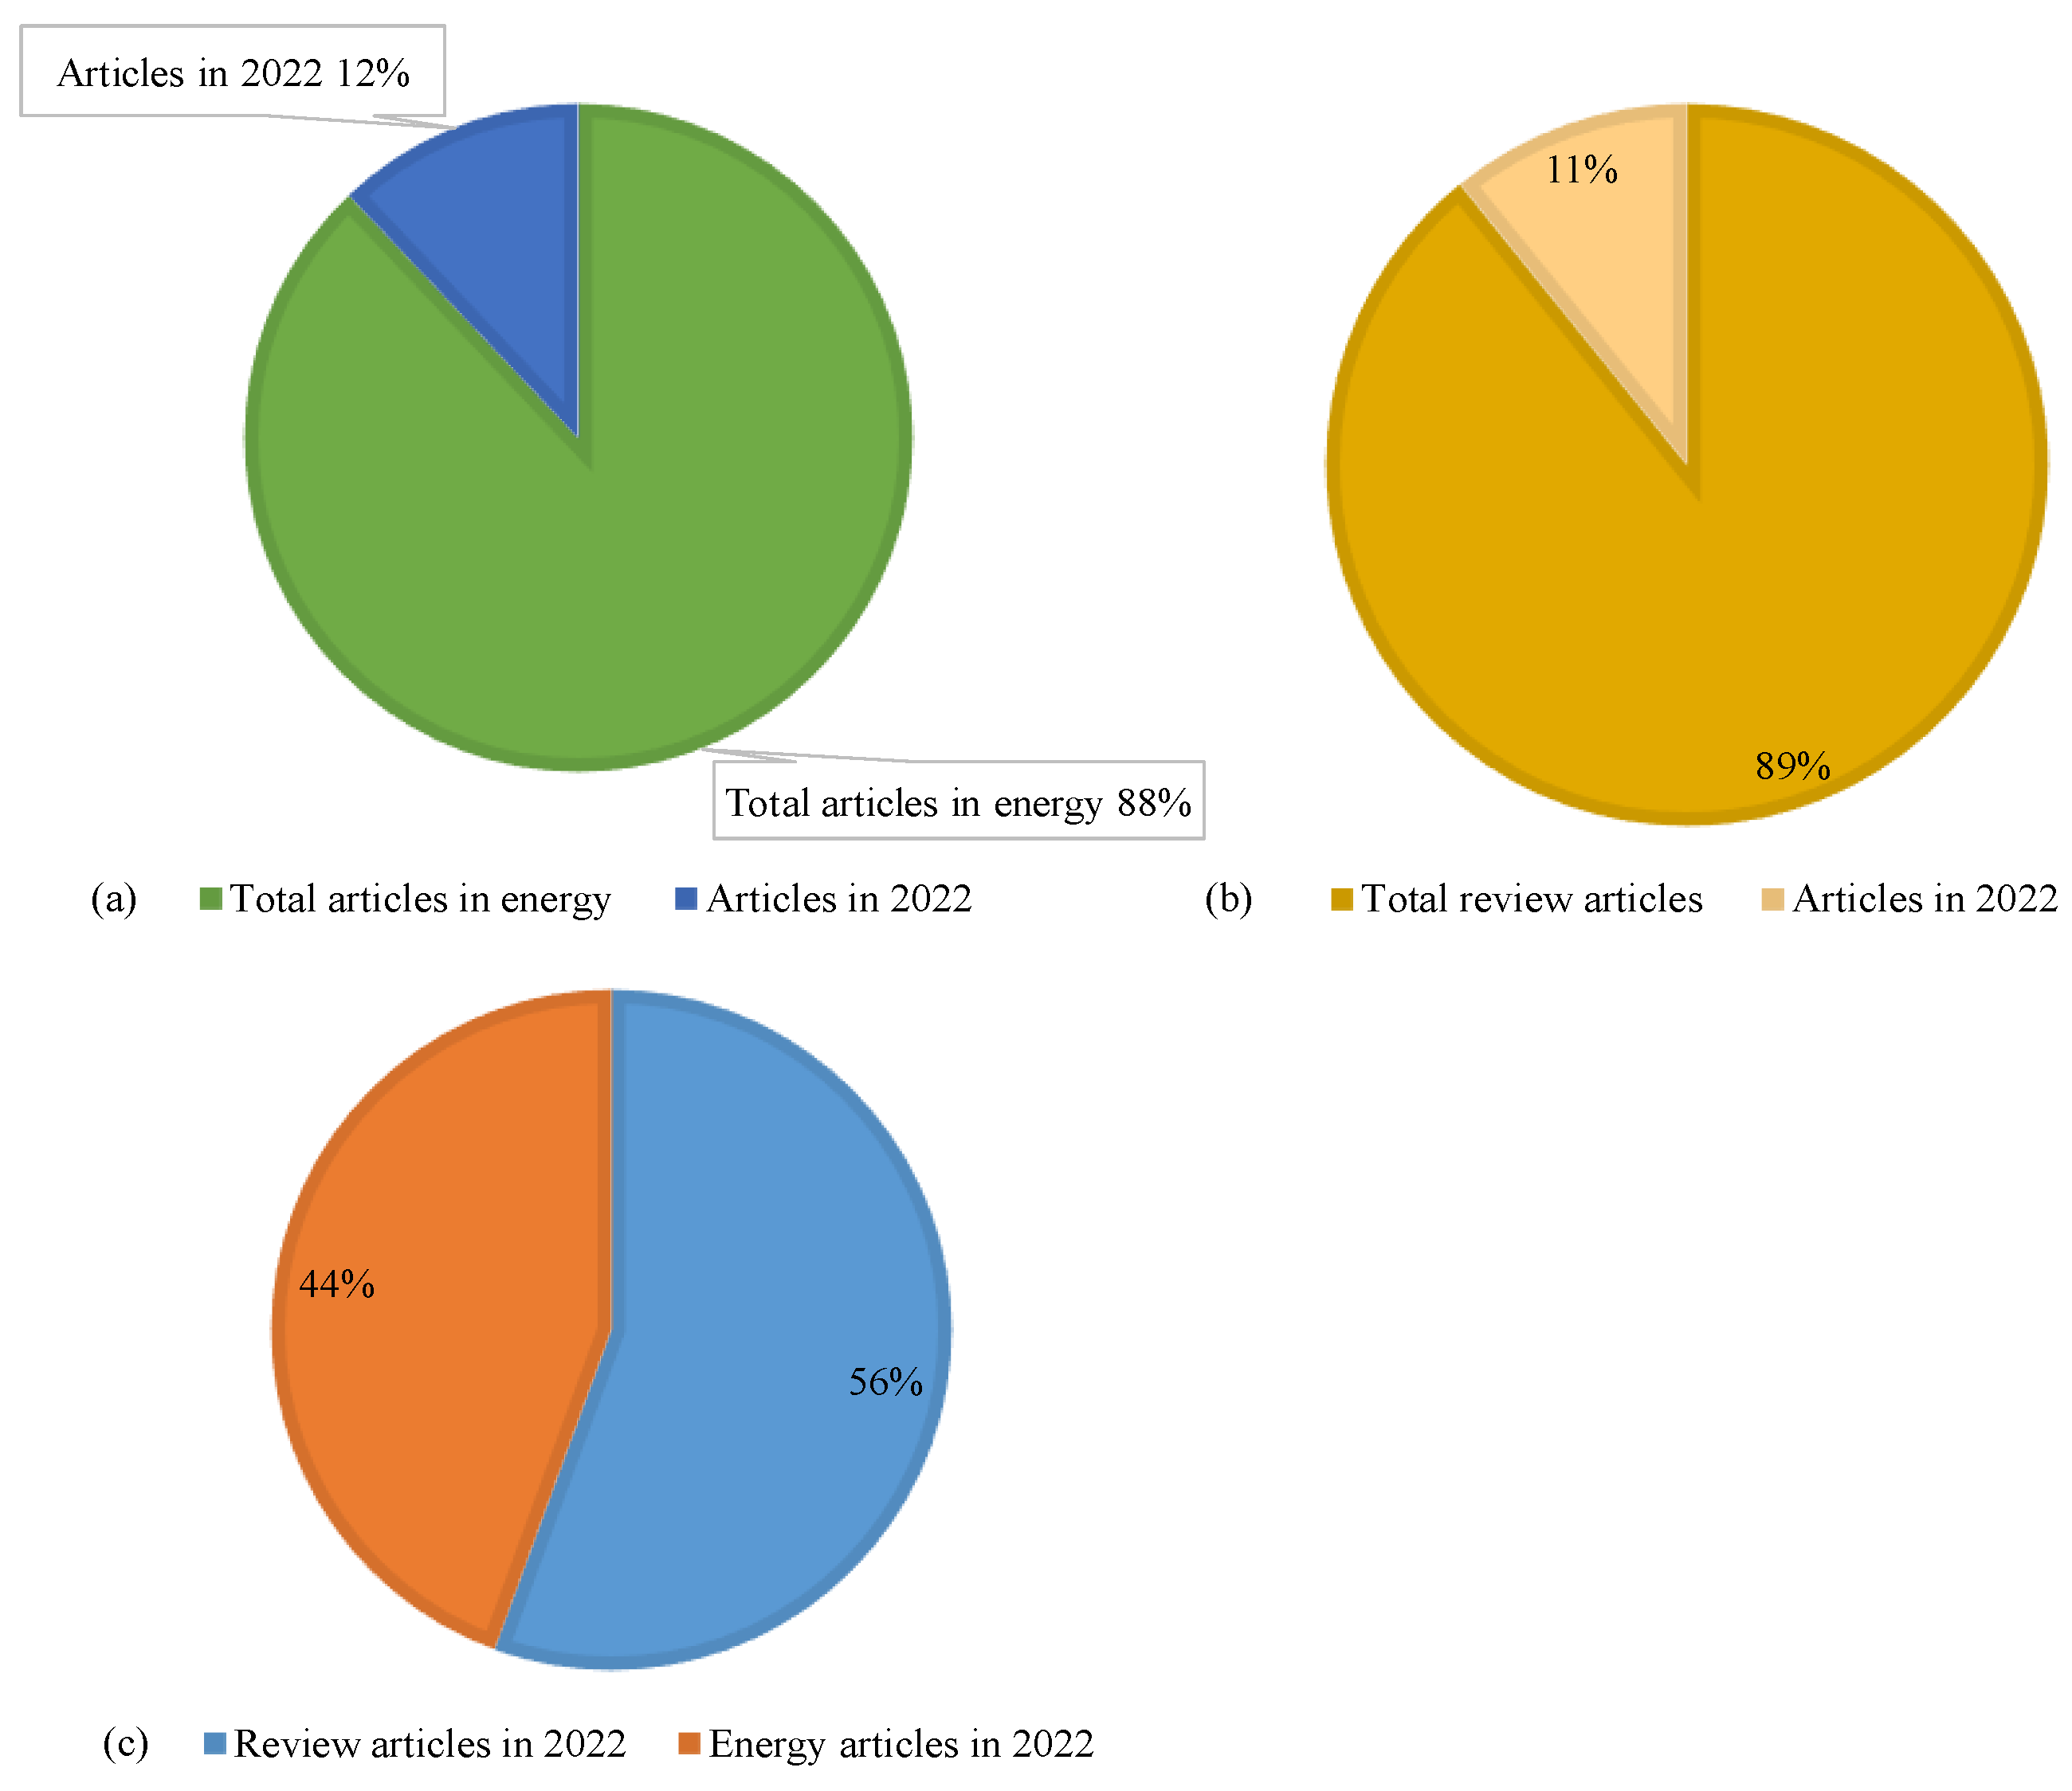
Figure 1 shows the research trend for energy utilization in data centers. Research contains state of arts, reviews, algorithms, data analyses, empirical studies, book chapters, conference proceedings, and research encyclopedias. The graph goes straight up from 2019. 12% of the papers of total articles were published in 2022 (Figure 2a). These statistics show that energy sector is gaining attention. Thus, this study provides a state of art of the changing pattern of research in RE.
More than 3.4 million (sciencedirect.com on 19.12.2022 at 2.30 pm KST) review articles have been published from 2010 to >2023 and 507,786 in 2022, combining all research fields (Figure 2b). As in Figure 2c, 56% of the total research articles is the review articles whereas 44% review article is published in the energy sector. This gives a clear idea about the importance of the review articles in the energy sector. The research in the field of RE is progressive. A lot of new directions are invented as sources of RE as wind energy from vehicles [4], waste animal fat [5], and perennial grasses [6].
What if another research area uses RE for its energy resources for decarbonization?
For example, blockchain technology (BT) is currently an growing sector in technology under decentralized system like RE in energy. Blockchain contributes to securing transactions of data through the internet. These data can be any type, such as product-related information, money transaction, or conversation. Saxena and Sarkar [7] proved the way of using BT for a retailing industry in their management system to replenish products always. They accessed this technology by using radio-frequency identification (RFID). The missing link in the whole discussion of BT in the retail industry is that this BT consumes a lot of energy as BT requires an internet server setting. Storage of a huge amount of data in the server requires a lot of space and energy to keep it running whole day-night. Digital data is increasing day by day due to increasing access to internet traffic [8]. A huge portion of the energy market is from the digital industry. How do the theoretical model and product flow change after using RE for this type of RFID technology or BT, or how does the use of RT affect the system’s profit? Research is important in the retail industry or supply chain management (SCM).
The above discussions explain a possible application of RE in other research sectors. Blockchain is definitely not a research area of development of RE, but it is a research area of application of RE. This study focuses on the application of RE. The purpose of this study is to explain possibilities of RE applications in other research sectors as supply chain, production, cross-docking, and logistics.

1.1. Necessity of the Study

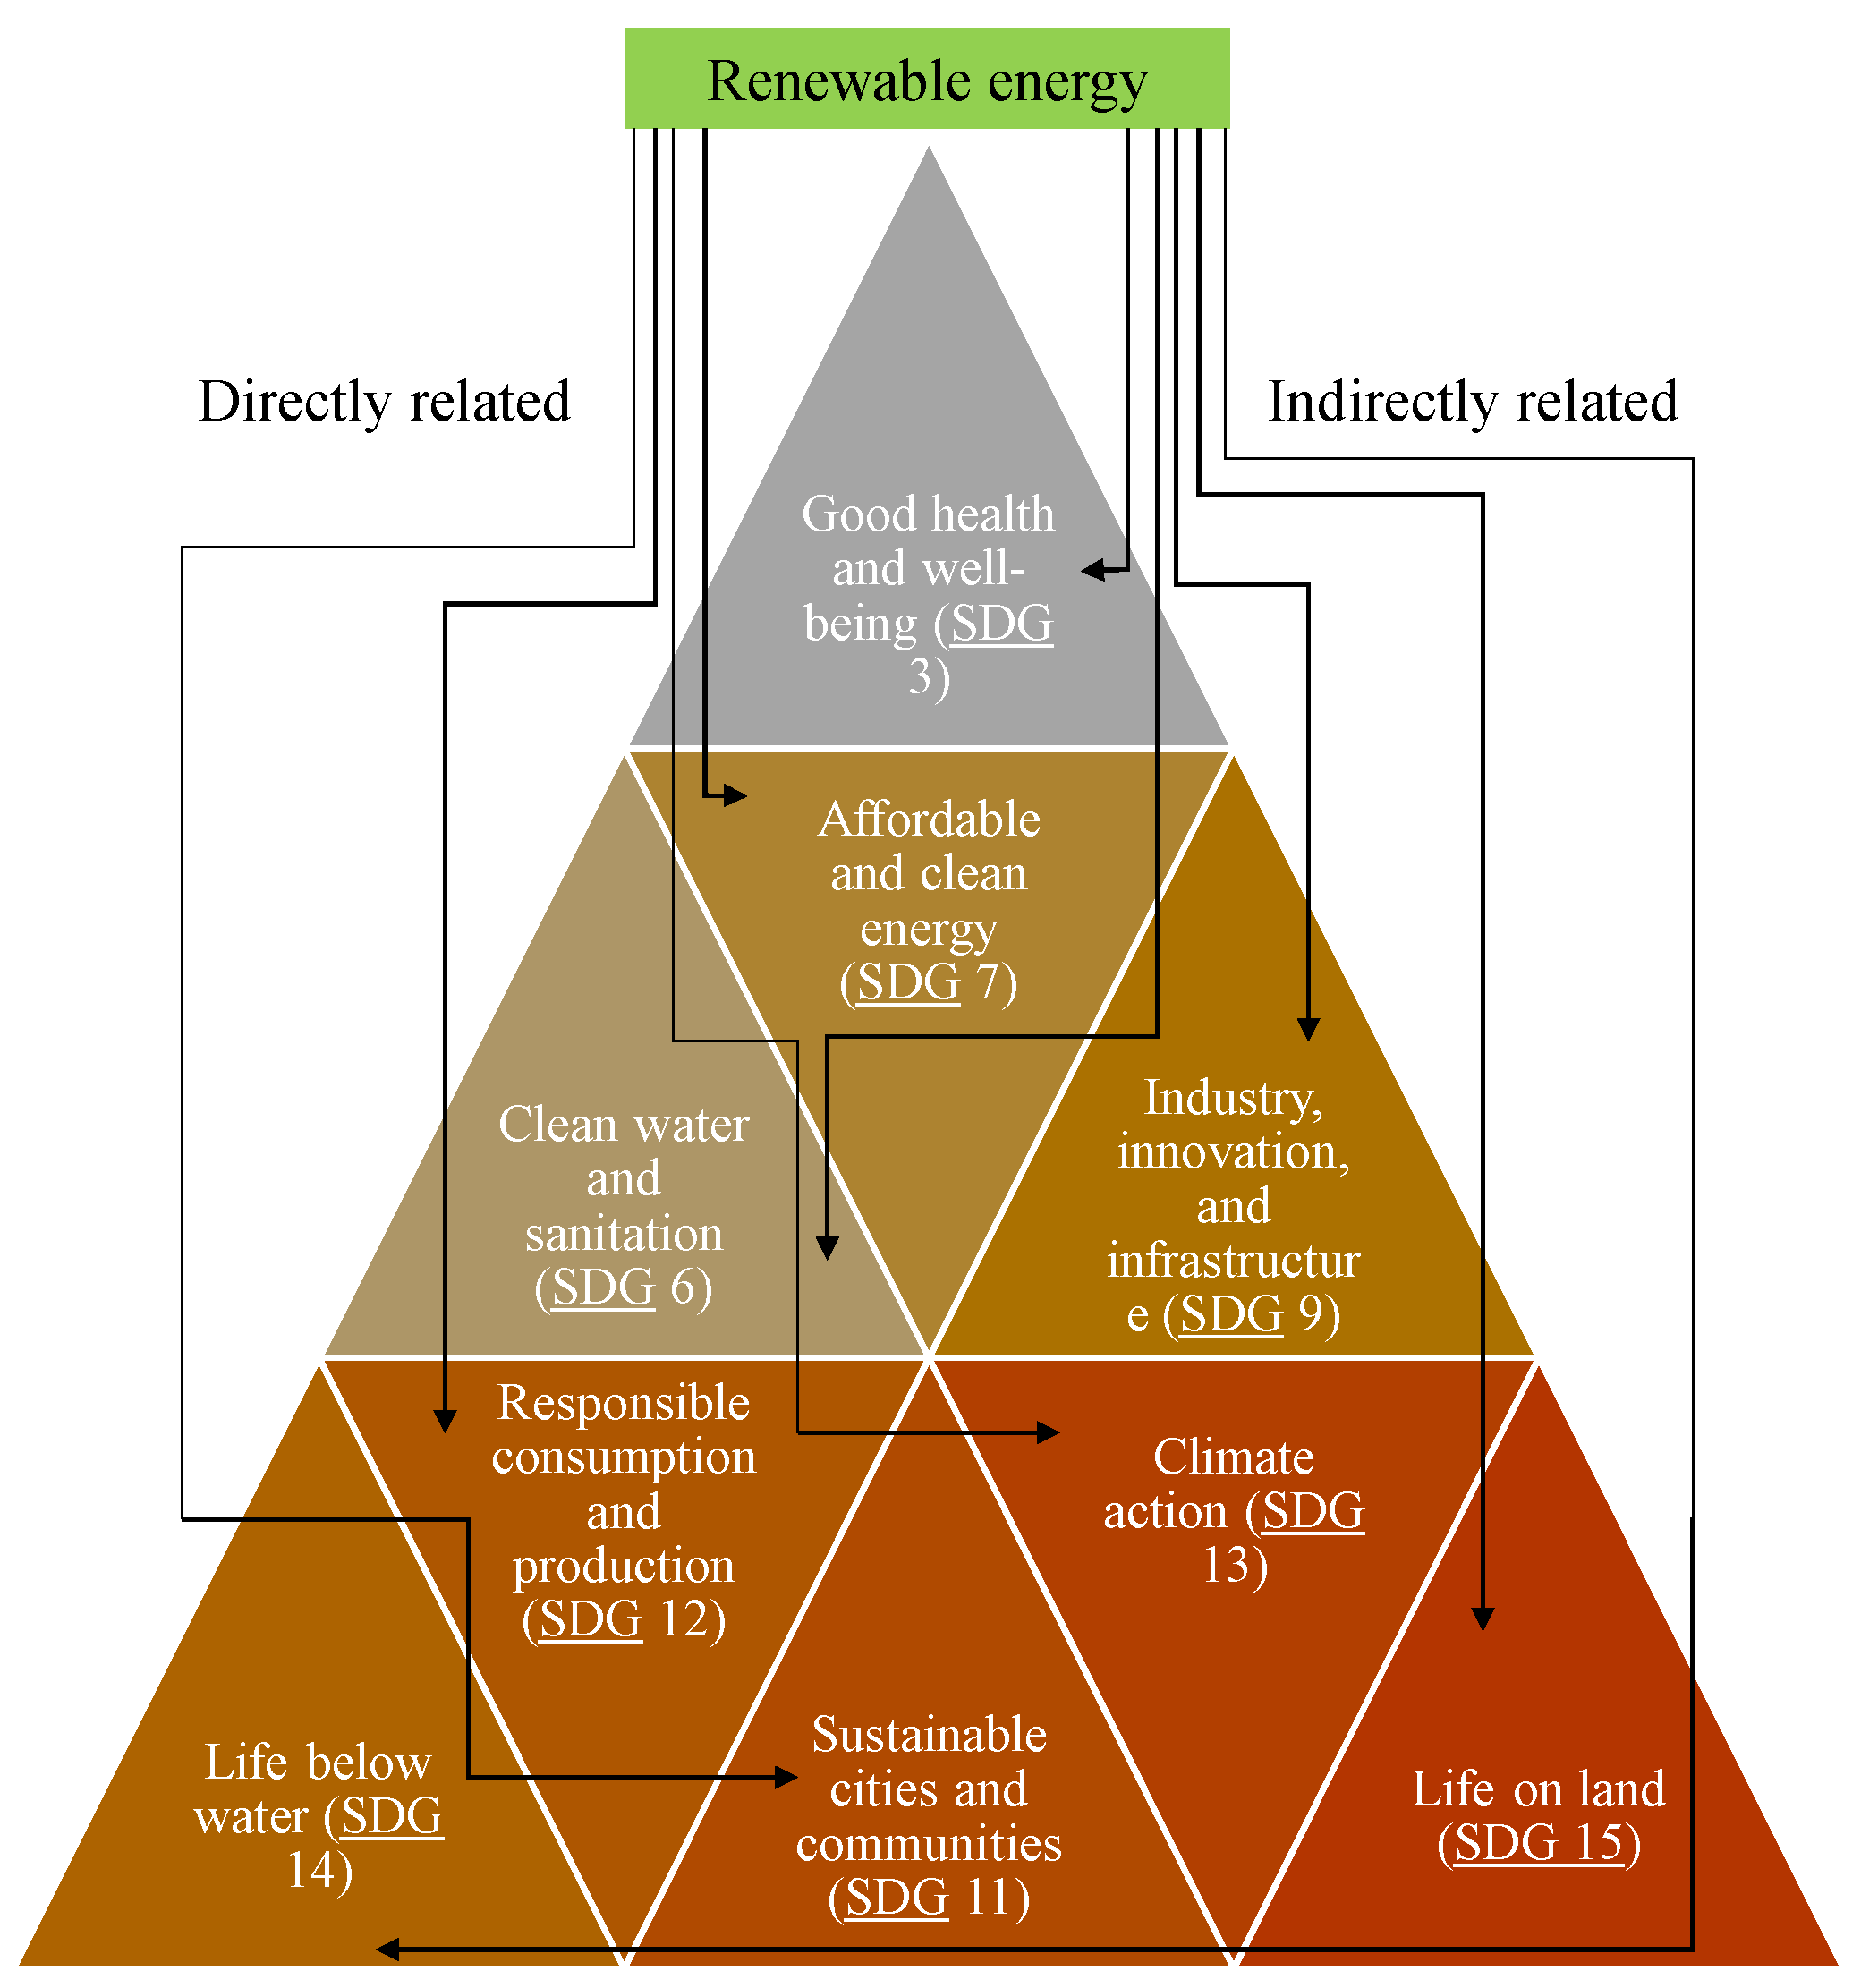
The question is why it is now important to explore the applicability of RE in different areas of research apart from the particular RE field. The answer is the agenda of sustainable development goals (SDGs) is active and SDGs have a goal to achieve by 2030. SDGs have 17 goals, and the major goals are related to the environment [9]. Figure 3 provides the related SDGs with RE, whereas SDGs 7, 11, 12, and 13 are directly associated with RE. It can be described as clean energy (SDG 7) is the purpose, responsible consumption (SDG 12) is the objective, climate action (SDG 13) is the necessity, and sustainable communities (SDG 11) is the applicability of the RE. For the indirect relationship of RE with SDGs, climate change, land and water pollution relatively affect life on land (SDG 15), life below water (SDG 14), clean water sources (SDG 6), and develop a new renewable energy industry (SDG 9). These continuously affect society, people, and their lifestyle (SDG 3). Thus, as an effect of the contributions of RE in decarbonization and waste reduction, it helps to achieve other SDGs.
When those many elements are interconnected, their effect on economic growth is visible. The use of RE is comparatively new as an economic driver, but it positively affects the economy, environment, and society. It is now important to explore how the active use of RE in different sectors works out. Is it cost-effective for the industry to use, or does it put a burden on the industry and causes inflation? The next section thus provides a research gap based on a discussion.

1.2. Research Gap and Contributions of This Study

Studies should focus on research for the applicability of RE in SCM, manufacturing, production, inventory management, cross-docking, and logistics. There is a big research gap in the literature on RE.
  • Studies about the effects of the application of energy exist for circular economy [10,11], manufacturing industry [12], electric vehicle [13], and SCM [14]. However, they are either review articles in that particular field or energy SCM [15]. Review articles provide general discussions about the benefit of RE. Studies about RE discuss the development model of RE, not the application model of RE. This study provides open problems based on the application of RE. These open problems raise a few questions, and researchers can solve these research problems to find meaningful insights.
  • There is no doubt that RE is a promising sector for both academia [16,17] and industry [18]. Industrial growth is not though the main topic of this review, but the review will be incomplete without discussing industrial development for RE. For that, the rest of the study examines a few important growths of RE for the industrial growth. However, the application of RE for academic research is lacking. More application-based research only can find shortcomings and difficulties of the RE application for management. Then, problem-solving procedures can be developed to solve these shortcomings and difficulties. Based on those findings, management can build their future agendas [19], causes and effects [20], and a data-driven model for the RE application.
  • Few review articles are methodology-based, and few are algorithm-based [21]. Few research articles are found for the transportation industry [22,23] and energy SCM (ESCM) [15]. They formulated research models with the application of RE and optimized decision variables in the presence of RE. This study provides some outlines of formulas that describe the use of RE within a system.
The discussions imply that there should be more research focusing on the applicability of using RE for other industries. This study provides the state of the art for RE from 2010 to the present. The symbol > 2022 represents a continuation of the year 2022, not the duration 2010–2022. For that reason, the statistics for the year 2023 comes in the graph. Two of the research article search engines are Google Scholar and ScienceDirect. There are 10,200,000 search results from Google Scholar and 392,356 results from ScienceDirect [16,17] (accessed on 12th December 2022 at 7.45 pm KST). There are a lot of research papers in RE. Section-wise structure of this study is given in the next section.

1.3. Structure of This Study

The rest of the study is designed as follows: Section 2 provides a literature review on the current research trend of RE; Section 3 discusses a detailed analysis of different RE resources, corresponding research, and application of RE; Section 4 provides the methodologies those used in the study for RE decision making; Section 5 gives a detail discussions of findings and its managerial insights; Section 6 provides open problems for readers, and Section 7 provides concluding remarks on this study. Finally, related references have been listed.
A detail literature review on the current research trend of RE is given in the next section.

2. Literature Review

Intensive research tendency in a research field implies that the development in that particular research field is important with respect to time. An increasing number of research papers on RE proves that RE is a necessary field of research to explore more for the betterment of humankind. The reasons behind this intense research in RE are several and though challenging, like (i) climate change, (ii) global warming, (iii) environmental degradation, and (iv) resources crisis. These four are very much interconnected with each other. Fossils fuel energy resources emit too much carbon into the environment, increasing the earth’s average temperature. These two phenomena increase the greenhouse gases (GHG) in the environment, which causes global warming. As a result, the climate is changing slowly. The effects of climate change are vividly experienced in different parts of the world. For example, exceptionally heavy ice clashed on the Alps while Greenland experienced rain instead of snow in September [18]. The report [18] showed 2022 experienced the first triple-dip cooling La Niña of the 21st century and will continue until the first half of 2023. La Niña is a natural cooling effect that causes strong wind, rain, and storms.
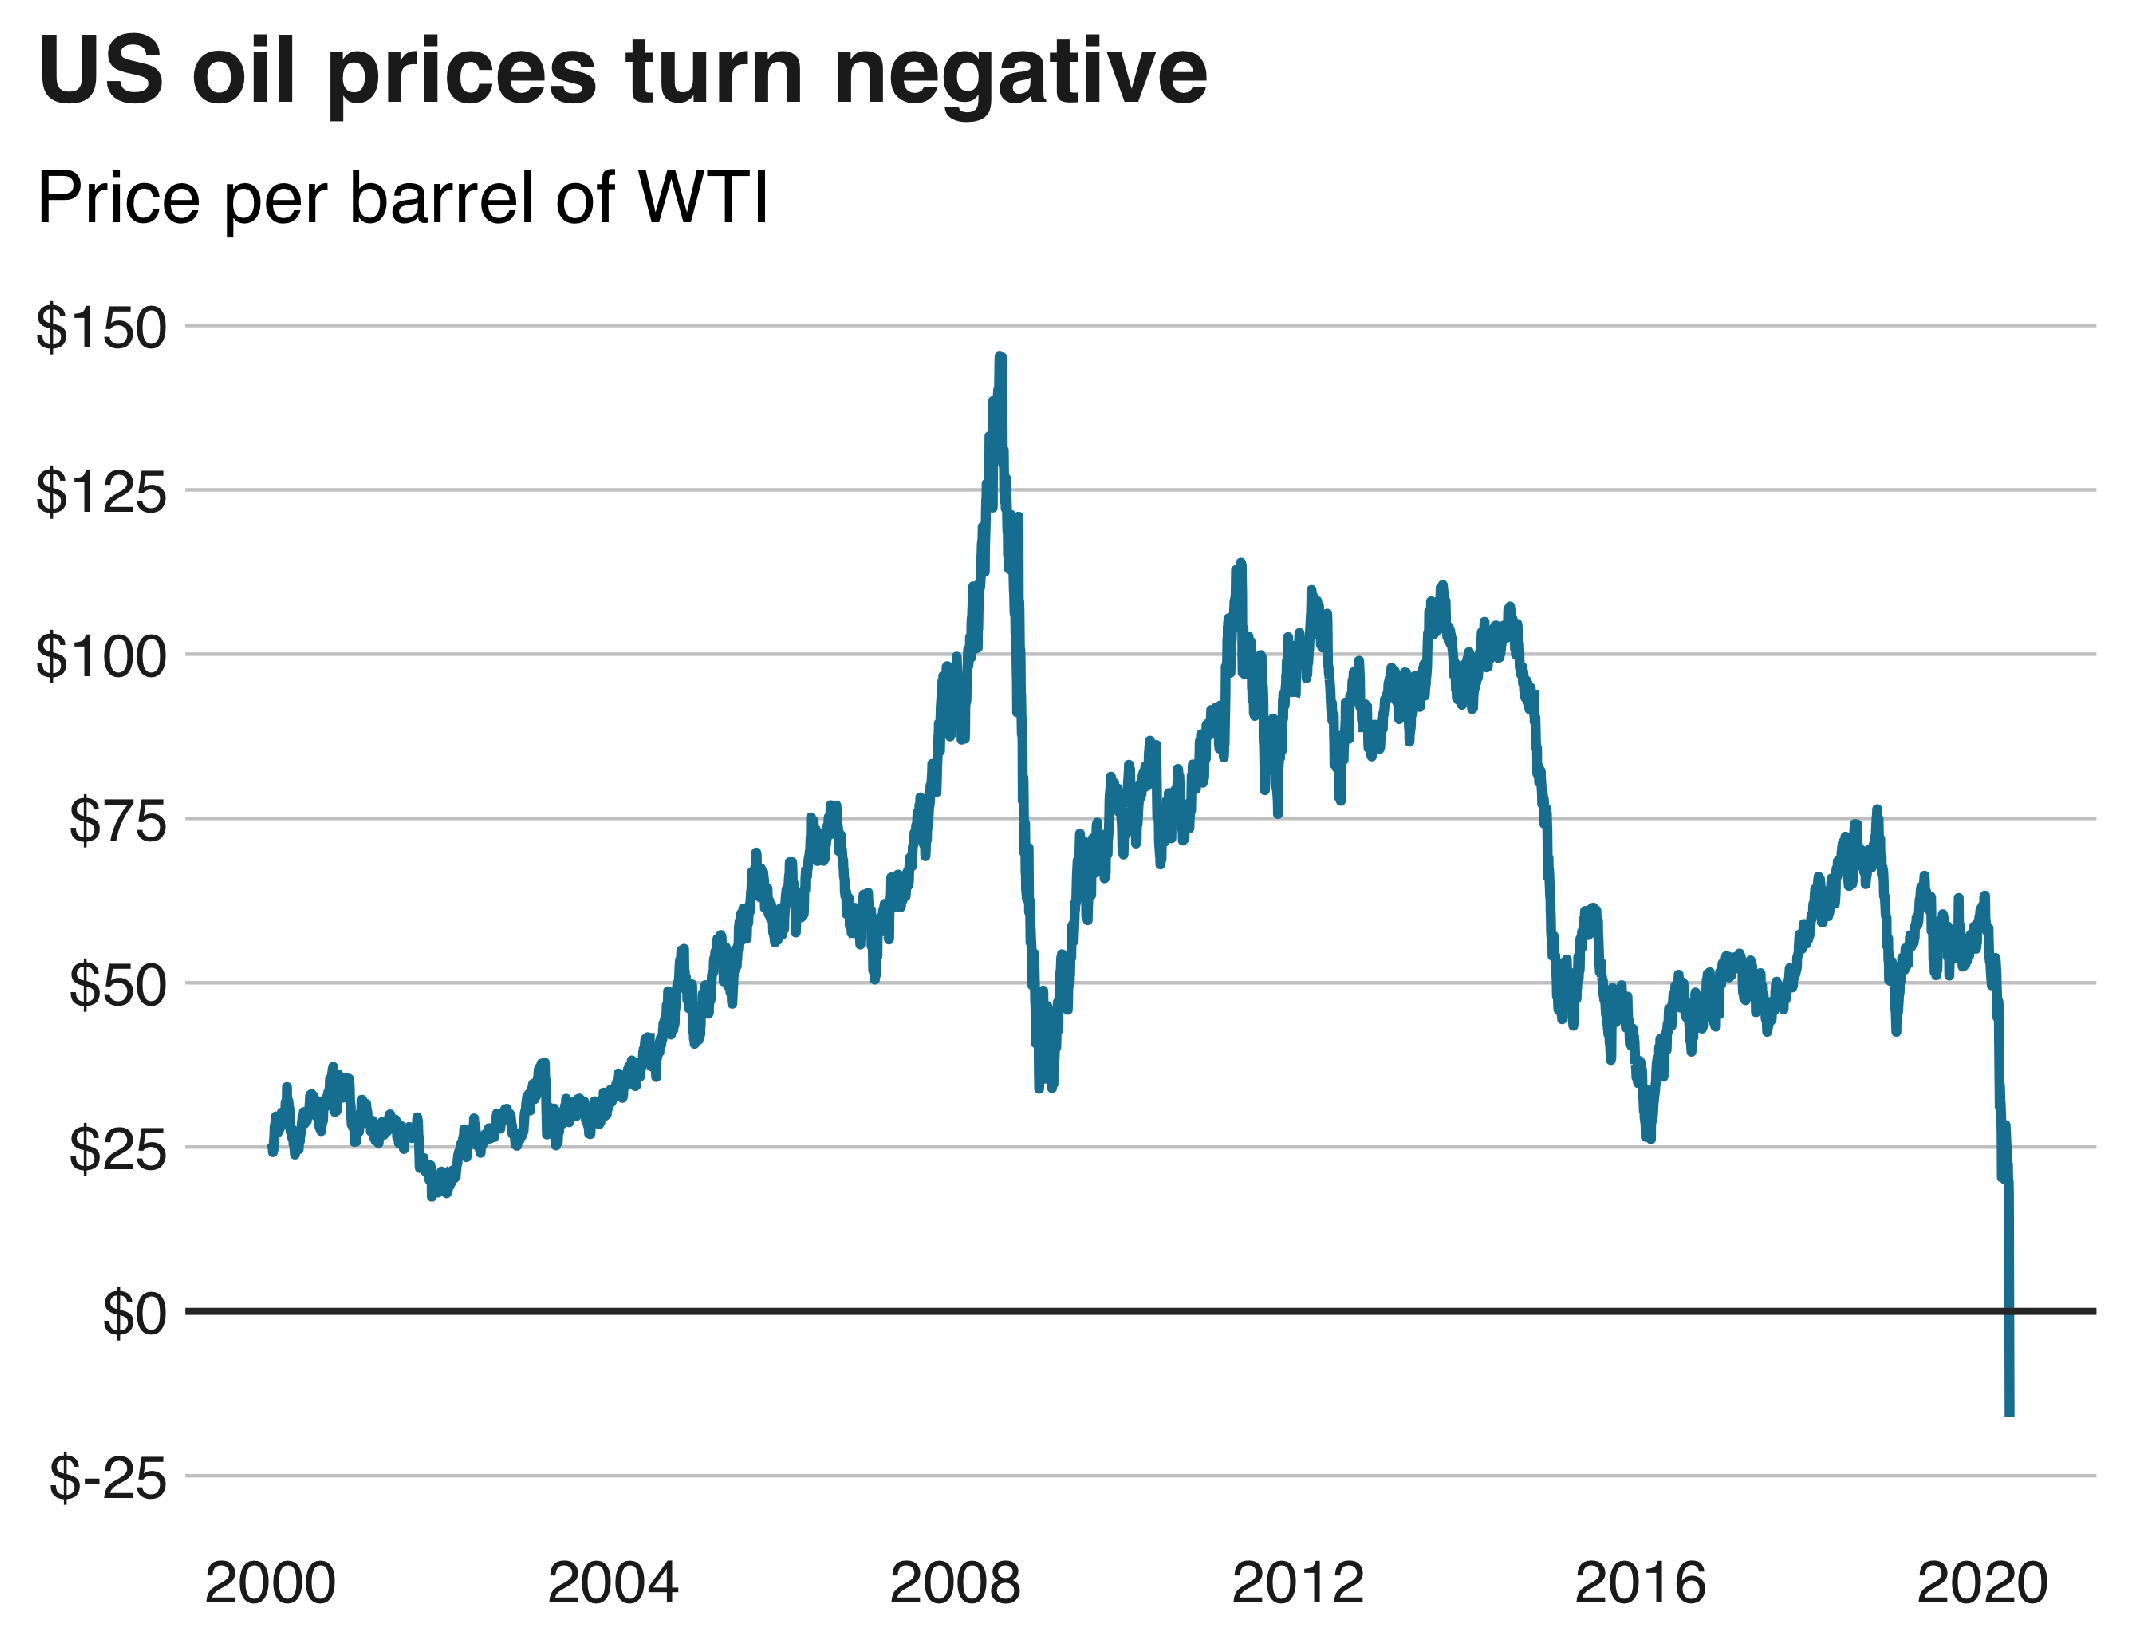
Hence, the RE is important because it does not use fossil fuels and does not emit carbon. This decarbonization has direct impacts on those four factors. That is why the priority of RE is to reduce carbon and GHG emissions in the environment. The following sections provide a clear idea about the RE research tendency. During COVID-19 crisis duration, the traditional energy as oil’s price went to negative because of no use of oil throughout the globe (Figure 4). This is the exceptional situation, which happened during COVID-19 [24].

2.1. Theoretical Development in RE

A lot of theoretical development happens for RE [16]. Review, discussions, state-of-art, and a few models on the core RE areas are found. Interesting mathematical modeling on renewable ESCM was explained by Sarkar and Seo [15]. They considered an SCM where the supplier supplied solid waste to the manufacturer. The manufacturer used CHP (Conversion process by Heat and power Process) to convert wastes to RE. They found that a large-scale energy plant had more development cost than other costs of the system, and a cooperation policy between retailer-manufacturer was profitable. Both the supply chain players in the ESCM had equal power distribution in the management process. However, there is still a doubt on the capacity of RE that it cannot produce 100% energy of the demand capacity or the power of RE cannot be enough to support a system independently. Then, the next question is about renewable energy sources (RES) quality. Groissböck et al. [20] worked on the quality of RES and found two scenarios. A too-high reverse margin increases the system capacity, and a too-low reverse margin decreases the capacity so much that it becomes unreliable. Mastrocinque et al. [21] surveyed through question-answer and made a dataset for different countries. Based on the judgment, they formulated a priority-based mathematical function. Using a multicriteria decision method (MCDM), they ranked sub-criteria for choosing an alternative energy resource.
Han and Kim [23] formulated a mathematical model to find the optimum total cost of a multiobjective function. They used the triple bottom line (TBL) approach to making sustainable energy consumption. However, research and statistics showed that RE is still unable to meet the energy consumption demand. Ustinov and Shafhatov [25] provided a combination of wave energy resources and off shore wind energy sources. According to them, the shadow effect on joint operation increased the no-failure rate by 3%. A model was explained by Bakeer et al. [26], which could increase the microgrid frequency. They discussed an ultralocal model that could control the load frequency used for microgrids.

2.2. Methodological Development in RE

Villacreses et al. [27] proved by simulation that MCDMs were very efficient in locating the place to implement RE with less disturbance of nature. Research on the combination of two different types of REs is now getting attention currently. Ustinov and Shafhatov [25] developed a methodology for combined wave and offshore wind energy and showed that could be solved by “program complex of automated structural and logical modeling of systems (PC Arbitr)”. They analyzed reliability factors for the combined RES. Another study [28] used an adaptive simulated annealing particle swarm algorithm to minimize the operations cost of hybrid wind-solar-hydrogen energy storage. They saved up to 28% of the cost of the operation using their proposed algorithm.
Another methodology, named CORDEX-CORE Simulations, was used to analyze the climate effect on RE (solar and wind) in West Africa. Ndiaye et al. [29] found that there are relations between regional and global climate models. A regional model was affected by three global models. They predicted that solar power will be decreased (−2% & −4%), whereas wind energy power will be increased (20% & 40%) in future (Near future 2021–2050; Far future 2071–2100). There is a big question for prediction models and empirical studies about how much those models are reliable. Because those models are based on data analysis, the reliability of those data sources is questionable. Michiorri et al. [30] discussed the importance of using metadata as a source of data and formed the taxonomy. The digitalization of RE is possible when metadata is incorporated perfectly.

2.3. Managerial Decision Making in RE

Tahri et al. [31] examined an interesting experiment on solar energy use in the bitumen industry. They tested for both short- and long-term periods and found that solar energy increased rheological performance until it was used for a long term, precisely more than one month of the period. Another interesting decision-making analysis was about the use of RE (wind and solar) in one of the world heritage sites, the Galápagos Islands. Potential analysis of Villacreses et al. [27] found that Baltra Island could be one of the possibilities for installing solar energy. Increasing the use of RES increases byproducts as well. Odzijewicz et al. [32] proposed a study discussing the utilization of the byproduct fly-ash from biomass combustion. They provided decisions to check chemical properties thoroughly and decided to use in which industry.
As there is a tendency that RE is expansive, for setup at least, the question is, can small manufacturing enterprises (SME) use and survive by using RE? Can it be beneficial for them? Zimon et al. [33] investigated these scenario during COVID-19 situation, between 2019 and 2020. They found that conservative strategy as financial policy among aggressive, moderate, and conservative strategies was selected by SMEs. This financial policy selection was driven by the pandemic situation, as financial and operating cycles were reduced remarkably during that period. This situation increased the liquidity in the market along with inventory turnover. By any means, active participation and support of the government play a major role in stabilizing the financial market and spreading RE.
Miskiewicz [34] explained the government’s influence on achieving SDG 7, affordable and clean energy. The contribution of participation and improvement of e-governance in RE growth was more than fourfold, which was massive. Whereas the industry participation in RE had growth of two-fifth-fold and the trade participation in RE growth was too little, one-tenth-fold. Interestingly, democracy, i.e., society contribution, was almost negligible for SDG 7 goal. These analyses were made by data analysis using the taxonomy method and regression analysis. Countries with more e-governance had more SDG 7 index.

3. Renewable Energy Resources and Their Usage

Many research articles study RE resources, their benefit, methodologies, and applicability. The following renewable energy resources are discussed as
  • Solar energy
  • Wind energy
  • Bioenergy
  • Hydraulic energy
  • Waste to energy and Hydrogen energy
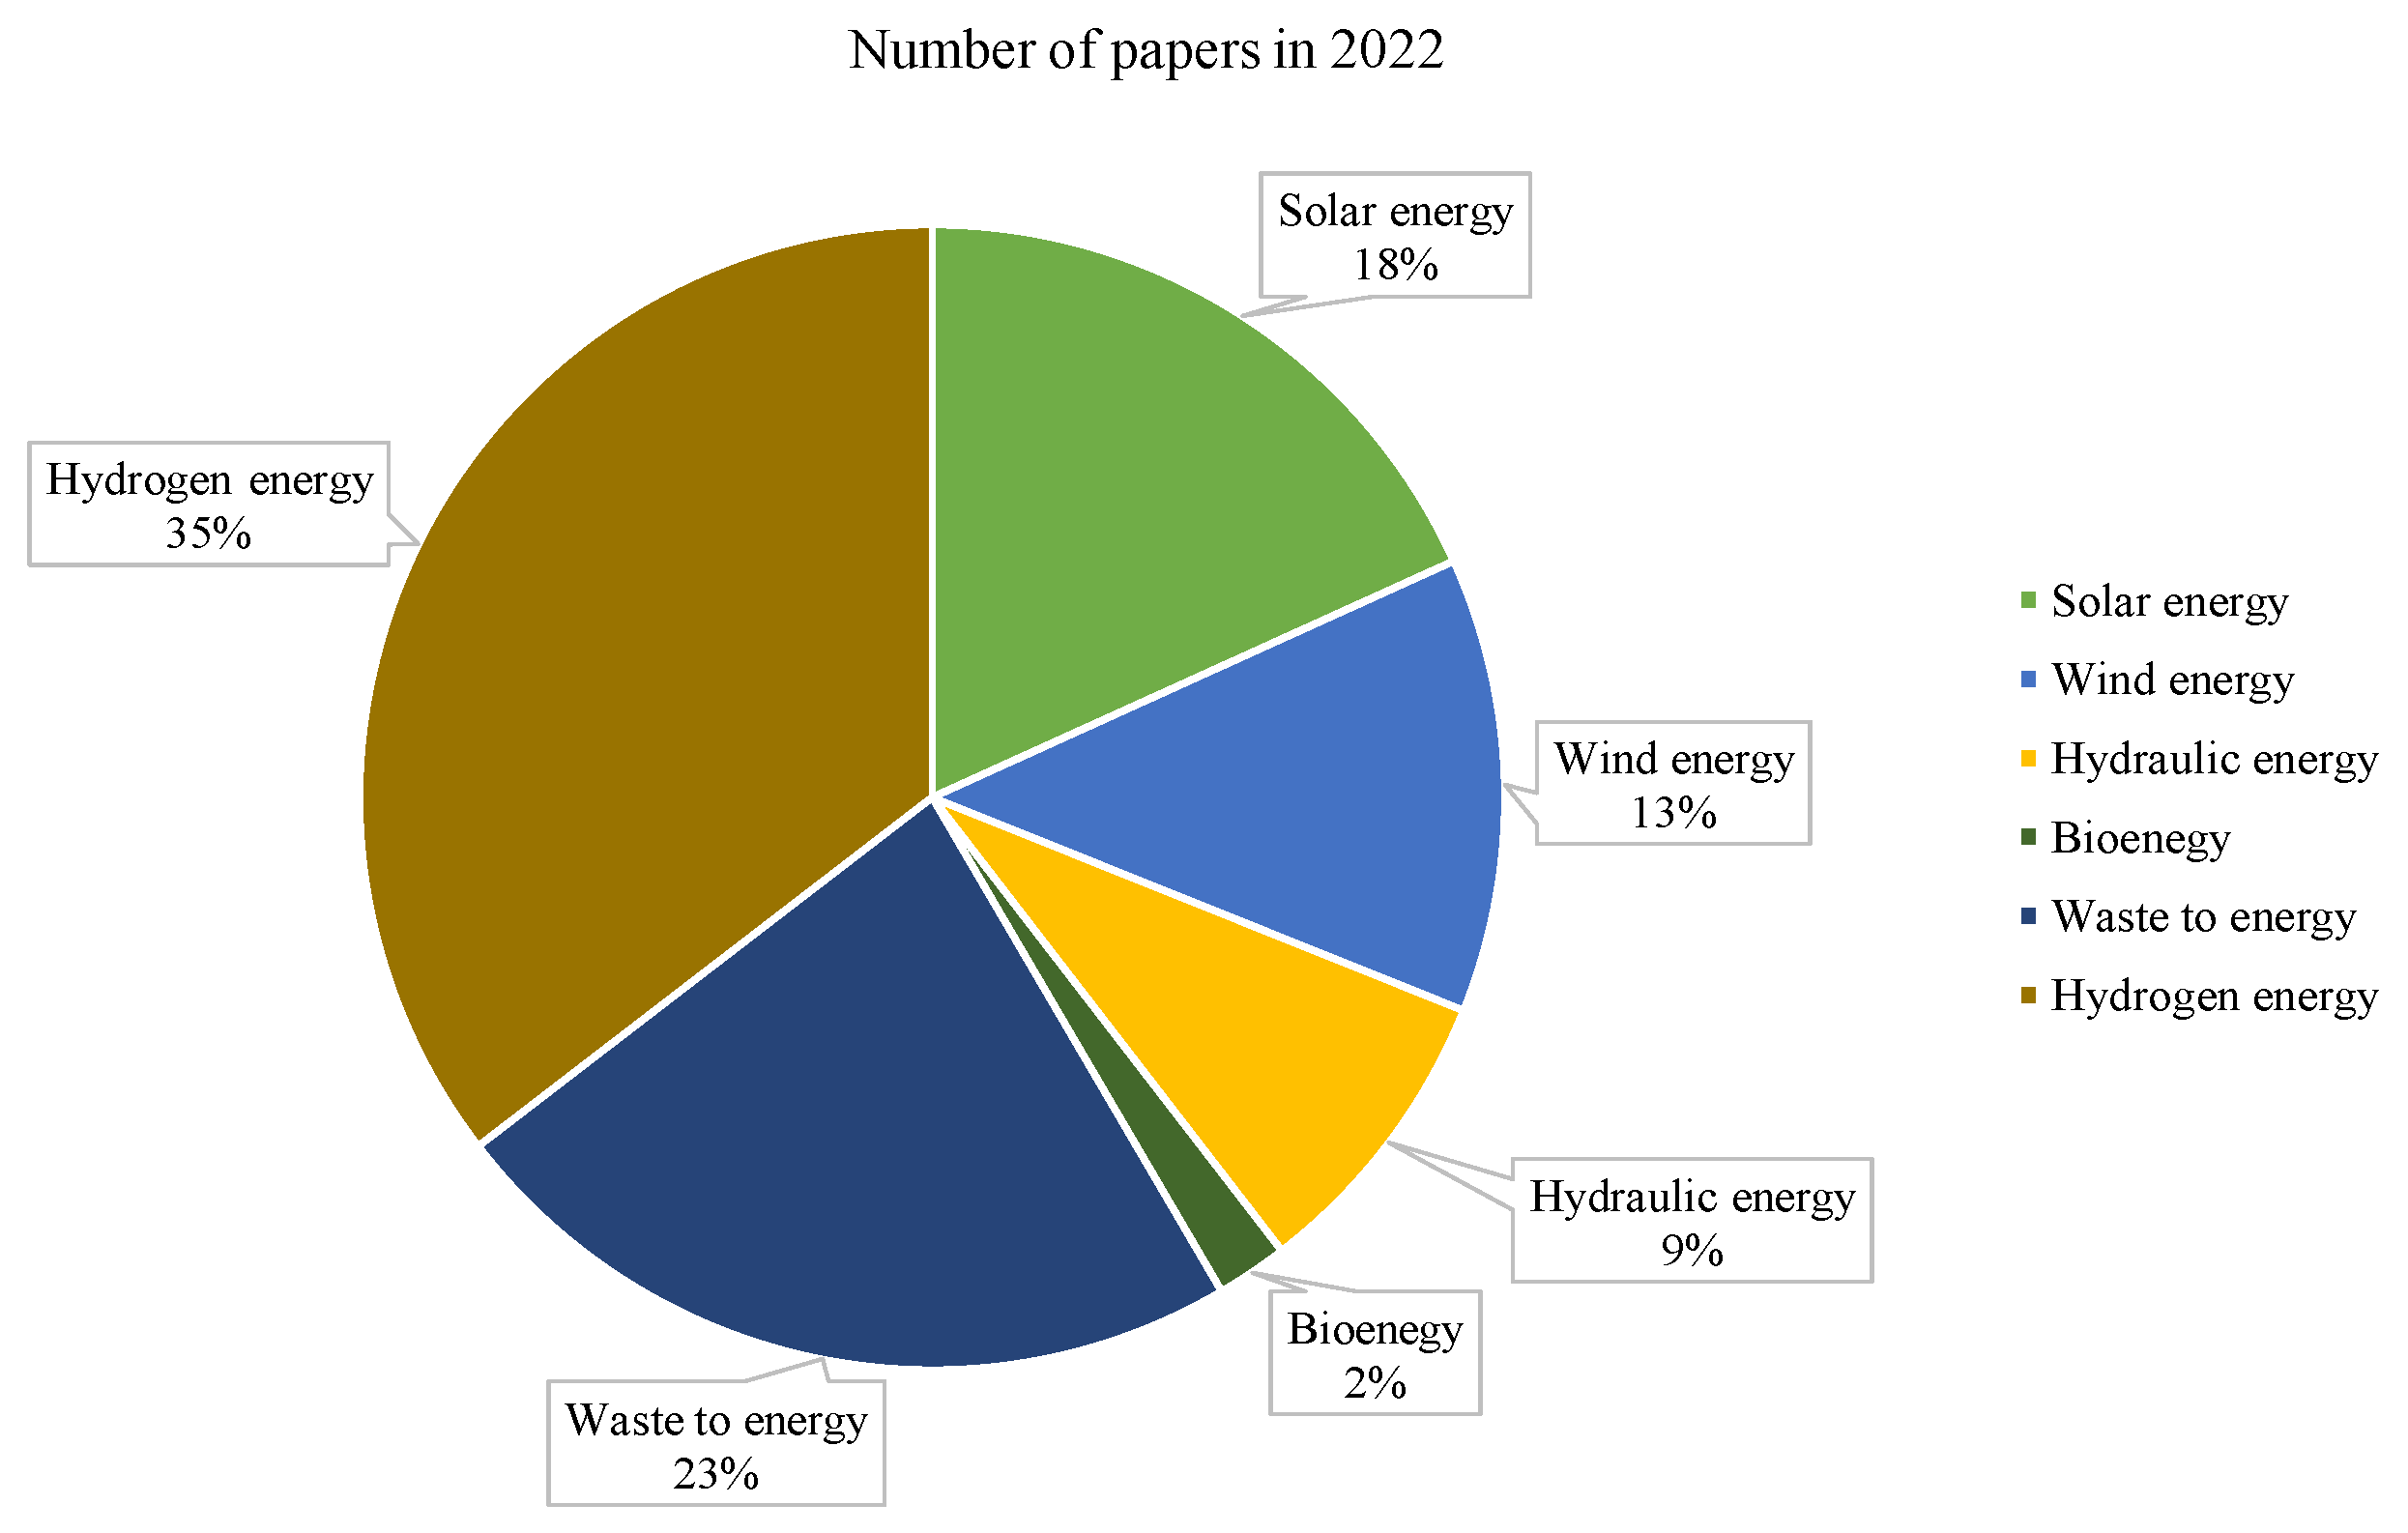
Figure 5 shows that hydrogen energy is the most referred area of RE, followed by waste to energy, solar energy, wind energy, hydraulic energy, and bioenergy. Data have been accessed through ScienceDirect [16]. Table 1 provides contributions of different researches on RE.
Statistics show that electricity demand increases by 3% during the first half of 2022 compare to 2021. The invasion of Russia in Ukraine in February 2022 had a big impact on electricity growth worldwide. In the meantime, RE increases [35] by 416 terawatt hours, which is more than the increased energy demand. Report [36] says that 70% of this increased energy demand will be fulfilled by RE, led by solar and wind, followed by hydropower. A senior electricity analyst Wiatros-Motyka [37] says [36] in a report that “The growth in wind and solar in the first half of 2022 prevented a 4% increase in fossil generation. This avoided $40 billion in fuel costs and 230 Mt CO2 in emissions”. A report from World Economic Forum [35] in October 2022 says, “New wind and solar met 92 percent of electricity demand in China, 81 percent in the U.S., and 23 percent in India”. This statistic is based on data analysis from over 70 nations. The following sections discuss the above RE resources. Each discussion is designed with a few basics of the corresponding RE, their academic contributions, practical implementations, and limitations.
Table 1. Contribution of different authors.
ArticlesRenewable EnergyContributionOpen Problems
SolarWindBioHydraulicWasteHydrogenCase StudyReviewModelManagementMethodology
Köktürk and Tokuç [38]Smart gridTurkeyTurkeyYesYes
Watson et al. [39]BatteryCanada
Ai et al. [40]StorageWind turbinesYesYes
Liu et al. [41]Rail vehiclesYes
Yu et al. [42]ExcavatorYesYesMin-size test
Yang et al. [43]EHH systemPower systemYesYes
Yang et al. [44]Electric vehicleYesYesFuzzyYes
Wei et al. [45]Wind turbinesYesSimulation
Abaecherli et al. [46]Indust. wasteMathematicalYesMILP
Zhang et al. [47]Policy Opt.ChinaYes
Mohammadi and McGowan [48]Brayton cycleYesYes
Puttachai et al. [49]Bi-direc. caus.GermanyYes
Lee et al. [50]Hybrid systemChem. conver.YesYes
Misganaw and Teffera [51]solidEthiopiaPotentialYes
Apak et al. [52]Power plantYesYesYesYes
Le et al. [53]YesYesYes
Wei et al. [54]YesYesYes
Kumar et al. [55]State-of-artIndiaSWOT analysisYes
Behar et al. [56]Copper miningYes
Xu et al. [57]Solar collectorSimulation
Lobaccaro et al. [58]Urban planningYesYesYes
Kong et al. [59]Waste waterRecoveryAnMBR
Kong et al. [60]Waste waterRecoveryAnMBR
Afzal et al. [61]Energy deviceOptimizationYesYes
Masera et al. [62]Dairy industryEurope
Xiao et al. [63]Food industryExperimental
Gao et al. [64]IntermittencyChinaCostYes
Bahar et al. [65]AnalysisTunisiaYes
Govindan [66]BarriersIndiaMCDMYes
Kong et al. [67]Waste waterElectricityYes
Jain and Tembhurkar [68]Fly ashWaste waterYes
Zou et al. [69]Food wasteEnz. pretre.Yes
Li et al. [70]NanotechnologyEnergy storageYes
Chang et al. [71]Anti-icingO & M costsYes
SWOT–Strengths, weaknesses, opportunities, and threats; ME–Metaheuristic algorithms; MCDM–Multicriteria decision making; O & M–Operational and maintenance; AnMBR–Anaerobic membrane bioreactor; Enz. pretre.–Enzymatic pretreatment; EHH–Electrohydraulic hybrid; Indust.–Industrial; MILP–Mixed-integer linear programming; Bi-direc. caus.–Bidirectional causality; Chem. conver.–Chemical conversion; Opt.–Optimization.

3.1. Solar Energy

The use of solar energy is not new in mankind. It starts with a magnifying glass in the 7th century B.C., whereas NASA used the first photovoltaic-based spacecraft in 1964 [72]. The development is in the experimental stage anymore; rather, it meets energy demands in daily life. In 2012, solar energy capacity was 100 GW, whereas the growth suppresses 1 TW (1 TW = 1000 GW) in 2022 [73]. This growth is almost doubled in the last three years, since 2018, and it is predicted to reach 2.3 TW by 2025 [74].
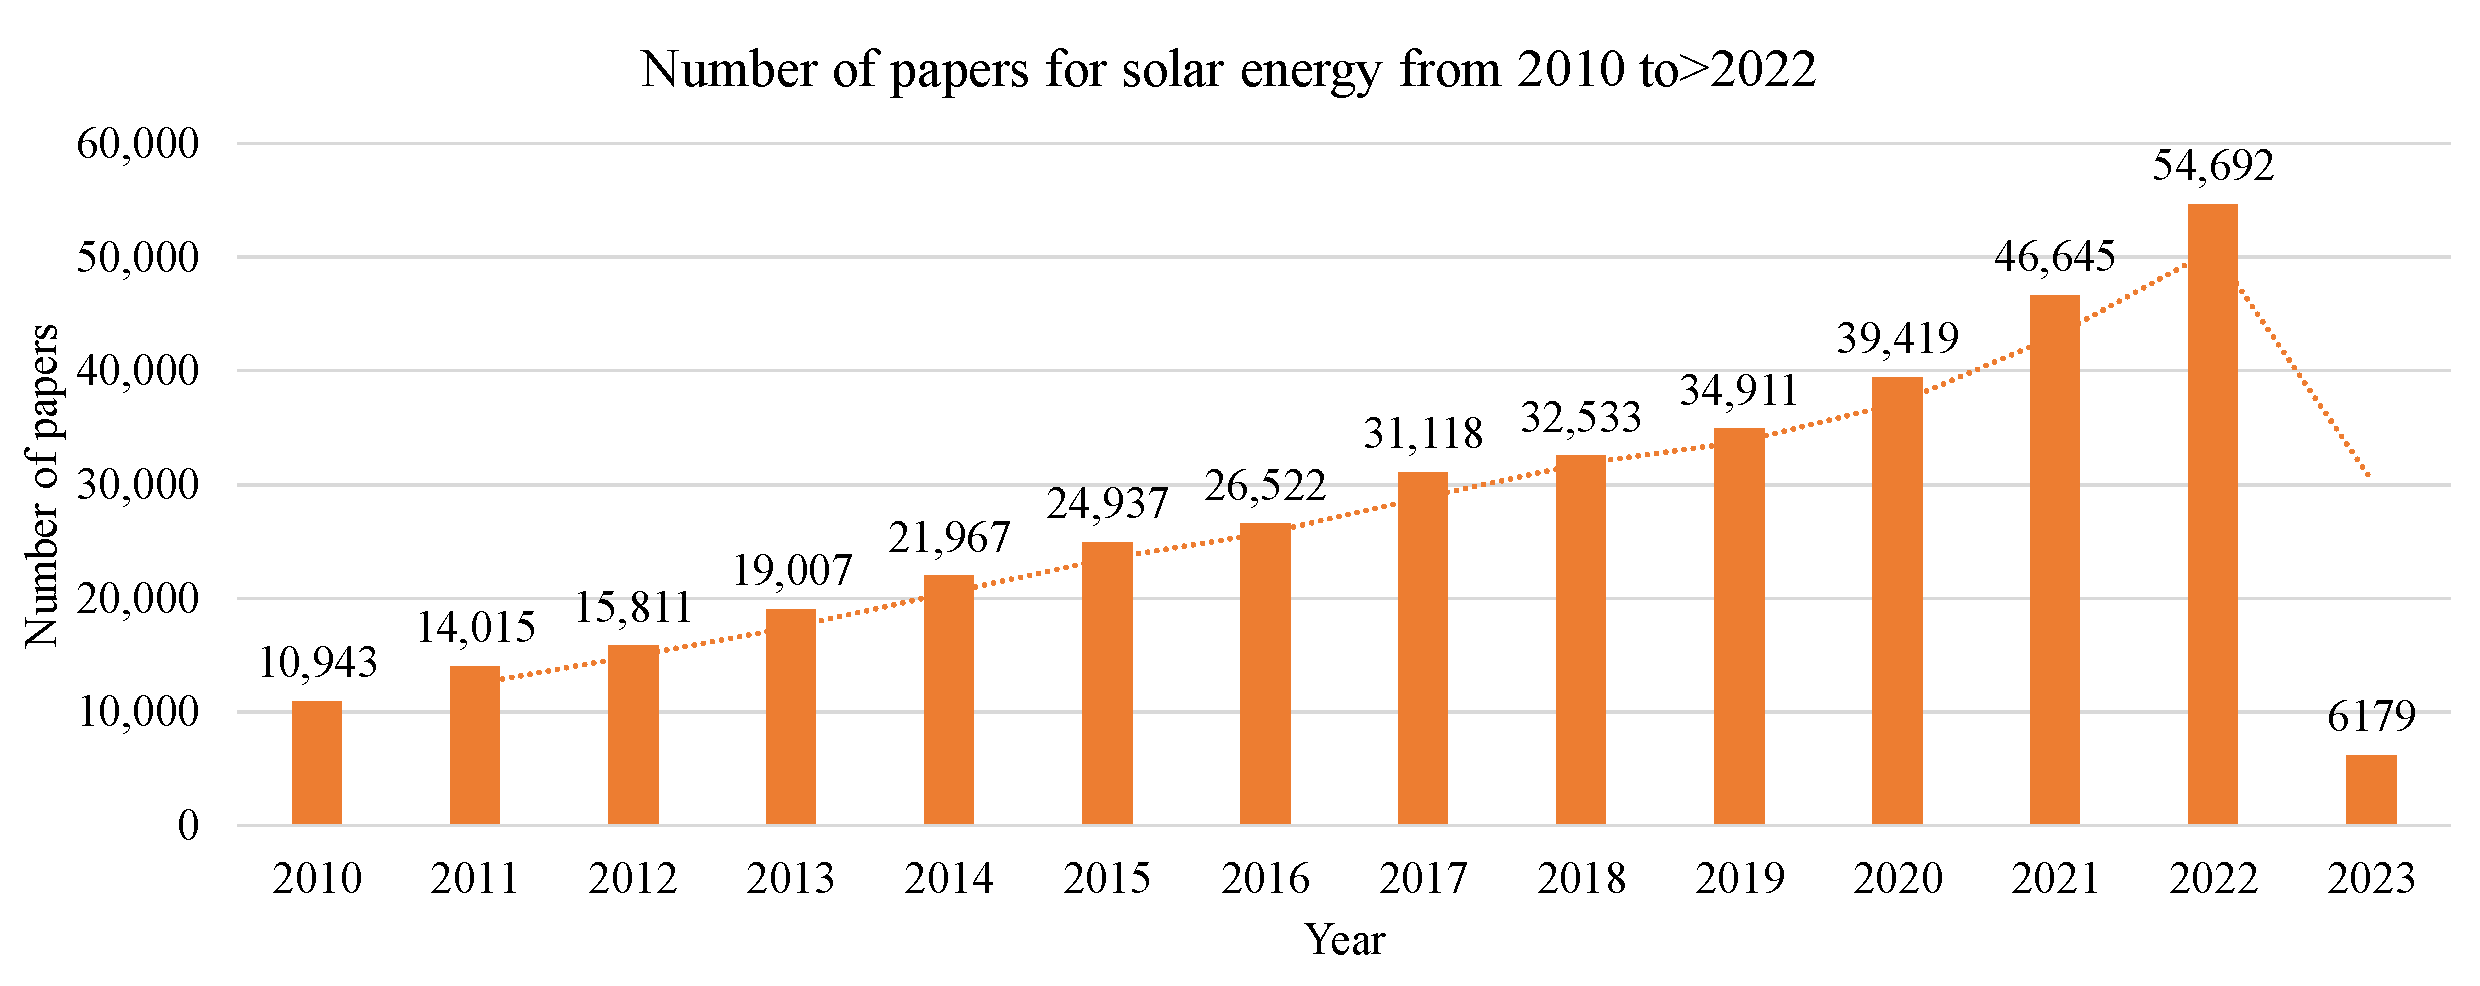
Graph (Figure 6) shows that trends in research on solar energy increase over the year. Until 2020, the moving average curve was flattened and steady. The graph got a hike since 2021 in a different area of application. Abdelrazik et al. [75] discussed the potential of adopting solar energy in Africa. They explained that Africa is a great source of photovoltaic power from the sun but faces a lot of challenges for RE due to financial, human, and technological resources. Hao et al. [76] analyzed the performance of solar power systems for heating, cooling, and power storage system with a combination of sunbeam splitting. Similarly, a thermochemical reactor used the biomimetic bone porous structure (Shi et al. [77]) to improve solar energy conversion. They proved that this method helped to maintain the flow between energy and energy flow within the reactor. That process improved 2.17% solar energy storage efficiency and 8.97% methane conversion.
Mannepalli et al. [78] developed an article to store excess solar energy using a battery energy storage system (BESS). They optimized the deployment of BESS with a multiobjective constraint optimization. Lei et al. [79] developed an interesting study that used solar energy for recycling the water vapor evaporated from the coal power station. They found solar energy increased the boiler’s thermal efficiency by 94.44% for the process of heating the feedwater point. Balachandran and Swaminathan [80] provided insights on indoor cooking by utilizing solar power. They claimed that a solar cooker with technical features helps faster cooking by transferring quick solar energy. Abdullah-Al-Mahbub et al. [81] proposed that solar energy can solve the electricity problems in the rural area of Bangladesh. Solar energy is a dominant RE in Bangladesh, with 532.5 MW. There are plenty of studies, particularly on solar energy and energy supply chain management (ESCM). Still, the question is how the other research fields can use the concept of solar energy.
Not only in academic research, but development, in reality, is also more attractive. China keeps the lead on using solar power and has become the largest solar energy market in both thermal energy and photovoltaics. They use solar energy for satellite panels, heating processes, and many others [82,83]. China has built its solar value chain with both huge production and consumption. The top progressive counties in solar energy are China, U.S., Japan, India, Germany, Italy, U.K., France, Australia, and Pakistan. Japan has the world’s largest solar park having a capacity of 63.2 GW, whereas as a developing country, solar energy is used for heating and water purification [84]. Applications of solar energy, in reality, are so interesting and tech-based. Maldives uses floating solar panels in resorts to provide electricity for tourists. The Netherlands has an almost 70,000 km bike road covered with glasses (photovoltaic cells) to generate energy. U.S. uses solar energy-based carports that can recharge parked cars [85].
Even less effective, but there are a few problems with using full-capacitor solar energy. First is the gloomy weather. Less sunlight, winter, or rainy seasons presents difficulties for a fully solar energy-operated facility. However, this is a temporary problem for countries with high exposure to sunlight. An energy storage facility can solve this problem. Solar energy can be stored in a storage facility like a battery. Countries with less sunlight can use energy-sharing policies from other countries. Second is the space for the solar facility. A solar setup is expensive and requires a certain space. Changing places is not a flexible economic option for solar energy.

3.2. Wind Energy

The growth of wind energy is gradually increasing every year, and corresponding research articles are growing as well (Figure 7). The history of using wind energy is very old (maybe B.C.), but commercial use started around the 11th century. People began to use windmills for food production in the Middle East. Around the 1800s, Dutch and U.S. people used small wind turbines for farms and cattle ranches [86]. Wind power production reached 31,000 MW around the 2000s [87]. Two types of wind energy are in progress: one is land-based wind energy, and the other one is offshore wind energy. Land-based wind energy projects are built on land. 99% of wind energy projects are based on private lands [88]. In comparison, offshore wind energy projects are built in water (generally seawater). It has fewer conflicts than onshore wind projects due to land issues.
Research finds several issues related to wind energy and provides tentative solutions for those problems. Frantál et al. [89] discussed land issues associated with increasing wind energy. They compared the Czech Republic and Spain and found that most conflicts happened because of local civic protest, resident-municipality opposition, and interfering neighbor administration. Based on interviews and information, they suggested that more power to municipalities can solve the land issue conflicts faster. Hu et al. [4] represented an interesting study on convective wind energy from the multi-lane highway. They established that the efficiency of wind energy capture devices (WECD) from the highway is 28.2% under certain conditions. This wind energy was generated by vehicles. A case study from South Korea (Lee et al. [90]) showed that general people support offshore wind projects more than land-based projects. Based on the survey, they found that people’s willingness to pay (WTP) per household ($3.1 per month) for the offshore project could be beneficial for $744.3 million per year. The authors suggested that the government should improve the public connection for more information about offshore wind projects, and projects should be built by paying tax. Not only these, but also research studies of device development for low-speed wind Younis et al. [91] and optimal wind energy distribution using reinforcement learning (RL) are going on for wind energy. The distribution of wind energy networking was studied by Zhu et al. [92], and they proposed an RL for wind energy networking. Shortcomings found in this present research are the lack of a combination of two or more research fields. For example, how can an inventory management sector use wind energy to maximize their profit, or if the inventory manager uses wind power, how much it costs for the system?
Wind energy is one of the fastest-growing renewable energy resources. It grows from 0.5 TW in 2000 to 27.4 TW in 2021 and estimates to install 353 MW capacity in 2022 for wind energy [93,94]. Costs of offshore wind energy are incredibly higher than onshore firms, but costs have been reduced over the years. Wind energy is mainly used for producing electricity. China is the leading position for onshore wind energy production, followed by the U.S. for offshore wind energy, Germany for onshore wind energy, India has a capacity of almost 40,8000 MW, and Spain [95]. However, there are a few obstacles to wind energy. One of them is the uncertainty of wind power, which divides wind energy into two parts offshore and onshore. Offshore wind energy solves many shortcomings of wind energy, like wind speed, on-site space problems, and aesthetic impact on people. Meanwhile, the uncertain weather of the sea questions the safety of the offshore wind energy plant. Increasing average temperature causes the increment of sea level, which is a big threat to offshore wind energy plants.

3.3. Bioenergy

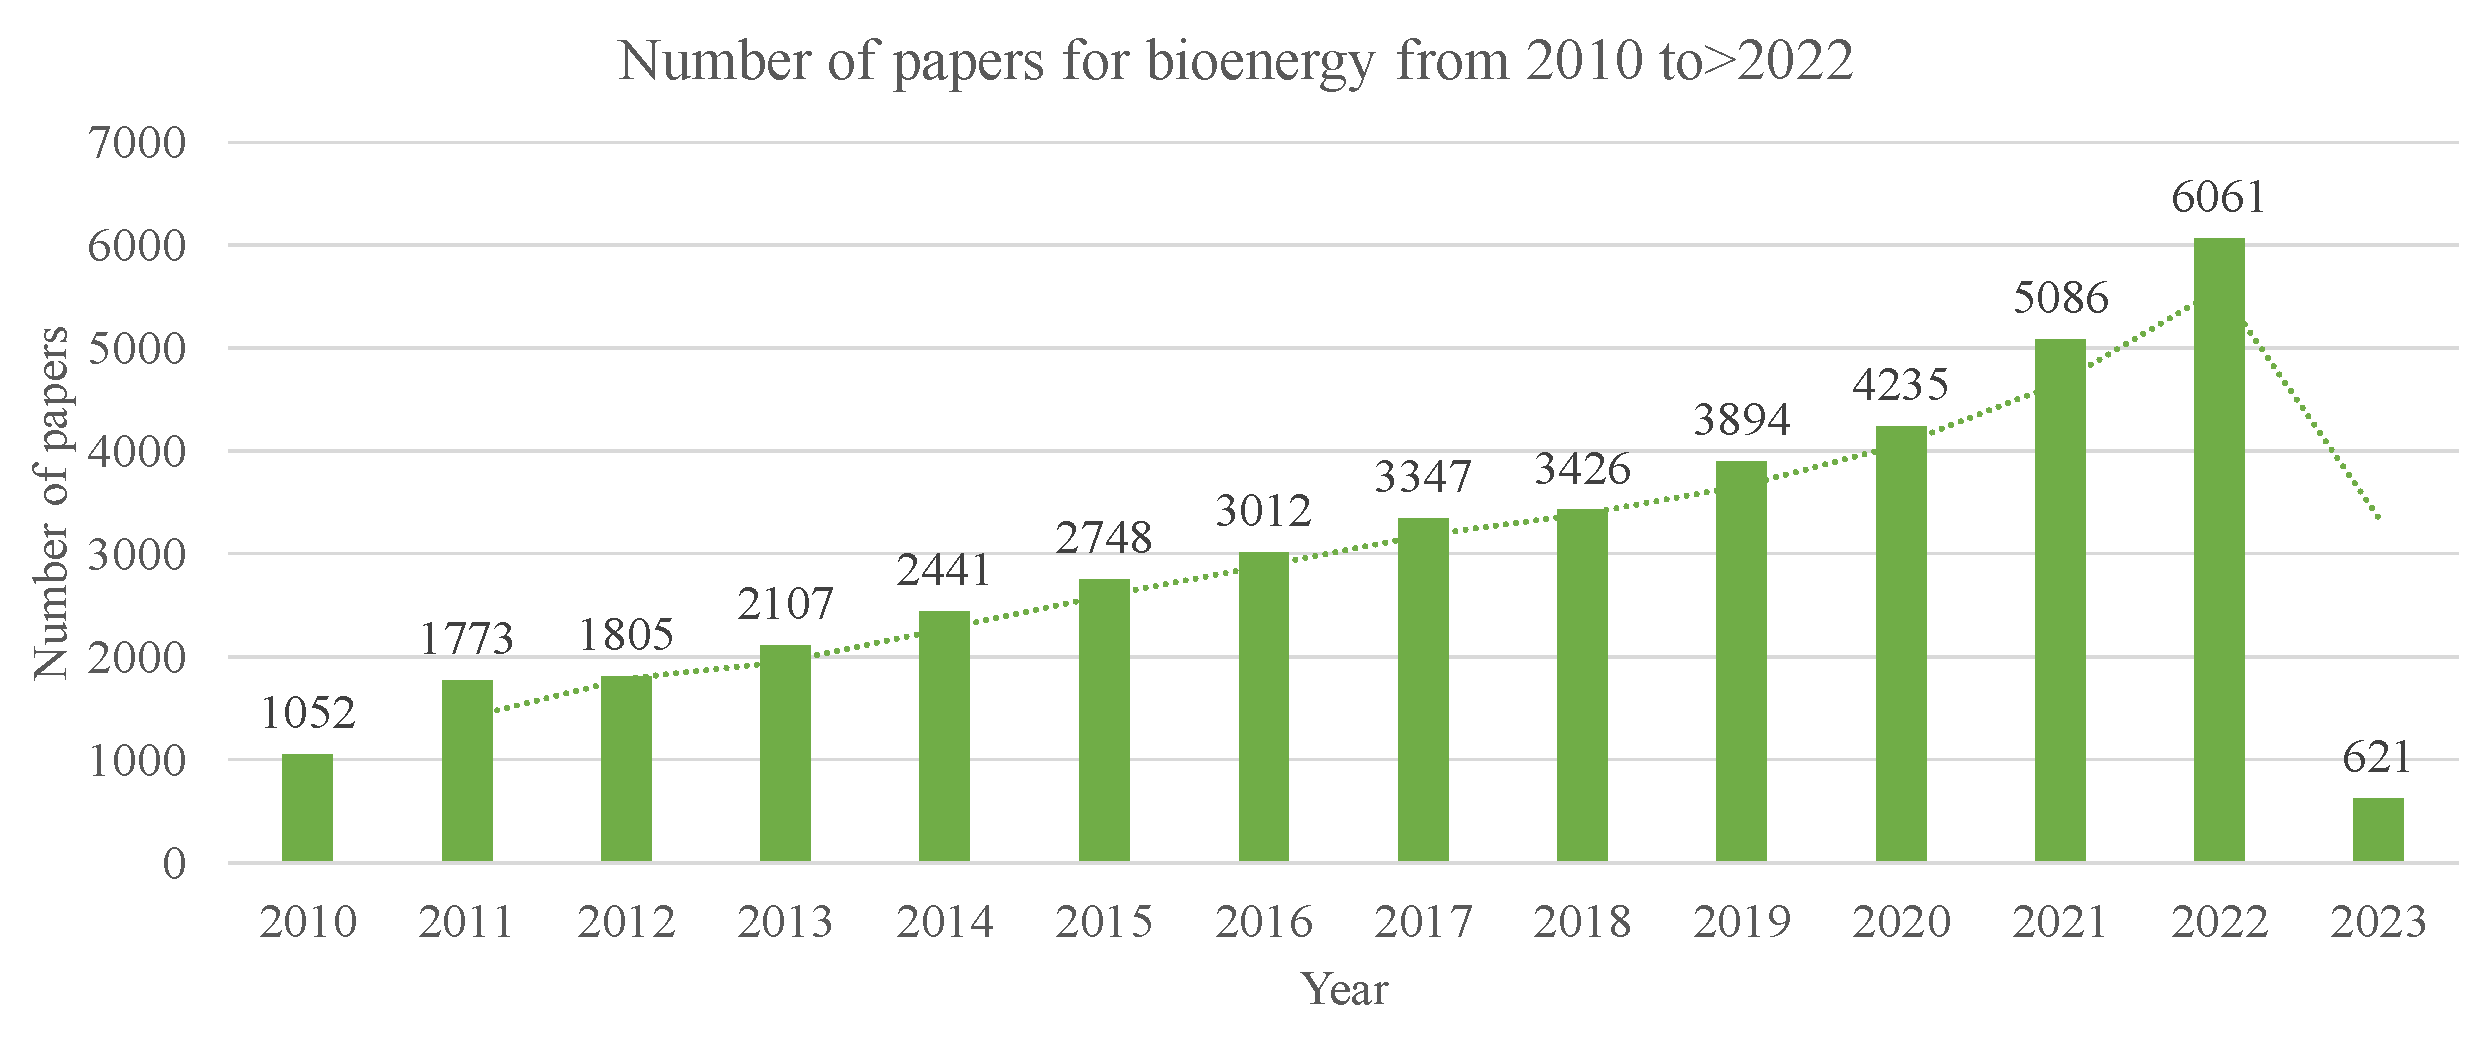
Bioenergy is one of the promising renewable energies [96], which is produced from biomass (Figure 8). 55% of the total RE comes from bioenergy. Different kinds of bioenergies are biofuel (first, second, third, and fourth generation), biodiesel, and biopower. First-generation biofuel is made from edible biomass. However, it starts to affect the food supply chain worldwide. Then the second-generation biofuel starts to make from nonedible biomass. Still, it affects the wildlife food chain. The third-generation biofuel is made from algae. The third-generation biofuel is more dense, low-cost, and highly energy-efficient. However, it requires a high source of energy to generate lipids. Thus, the fourth-generation biofuel, whose biomass is modified microalgae, comes into the picture. These algae are highly efficient in absorbing C O 2 and enhance production fuel [97]. Papilo et al. [98] gave a review in Indonesia, where palm oil was used for bioenergy. Liu et al. [99] discussed a relation between ecological footprint and bioenergy and its effect on the economy. They reviewed the connection using the quantile-on-quantile methodology. Liu et al. [6] explained a prediction on the climate change effect on bioenergy, where the biomass was perennial grass. Few studies are found in bioenergy literature, which is used in other sectors as well.
The government’s support for the growth of RE is inevitable. The potential of government policies was discussed by Wang et al. [100] for bioenergy development. Vu et al. [101] discussed biofuel exploitation from Euphorbia plants. That study was conducted in Vietnam as those plants are available in Vietnam more in quantity. Sathre and Gustavsson [102] analyzed the life cycle of heavy trucks for emissions from different RE sources. They found that a combination of carbon capture with bioelectricity has negative carbon emissions. In one study of the biodiesel supply chain, a waste animal fat-based biodiesel supply chain was illustrated by Bhuniya et al. [103] under an uncertain environment. Singh et al. [104] found process to reduce e-waste (end-of-life products) from a production system through reverse logistics. Mridha et al. [105] explained a system failure situation for a multibioenergy supply chain, whereas they discussed the improvement procedure of impure biofuel within a biofuel supply chain in another study [106]. As advertisement policy is a good opportunity to reach customers, a study by Singh et al. [107] discussed the policy under transportation disruption for a biodiesel supply chain network.
Sweden has their forest as their resource for bioenergy, as 69% of the land area is forest. The country uses bioenergy for heating for both private and commercial purposes [94]. Biokerosene is used for biojet for air travel, starting from 2021, and is projected to increase biojet fuel demand up to 7% by 2030. The maximum use of biomass is in the traditional section, that, in rural areas, where biomass is used instead of biogas. These are used for household cooking. The next most active sector for biomass consumption is industry, followed by electricity, heat, building, and agriculture [108]. Industries, which have combustion engines, use more bioenergy than vehicles. Instead, vehicles rely on batteries and electric motors. This is because bioenergy does not have as much capacity as fossil fuel. Moreover, first- and second-generation biofuels are not much ecofriendly due to biomass. Those biomasses have a direct effect on the food supply chain and biodiversity. This problem is solved partially by third- and fourth-generation biofuels.

3.4. Hydraulic Energy

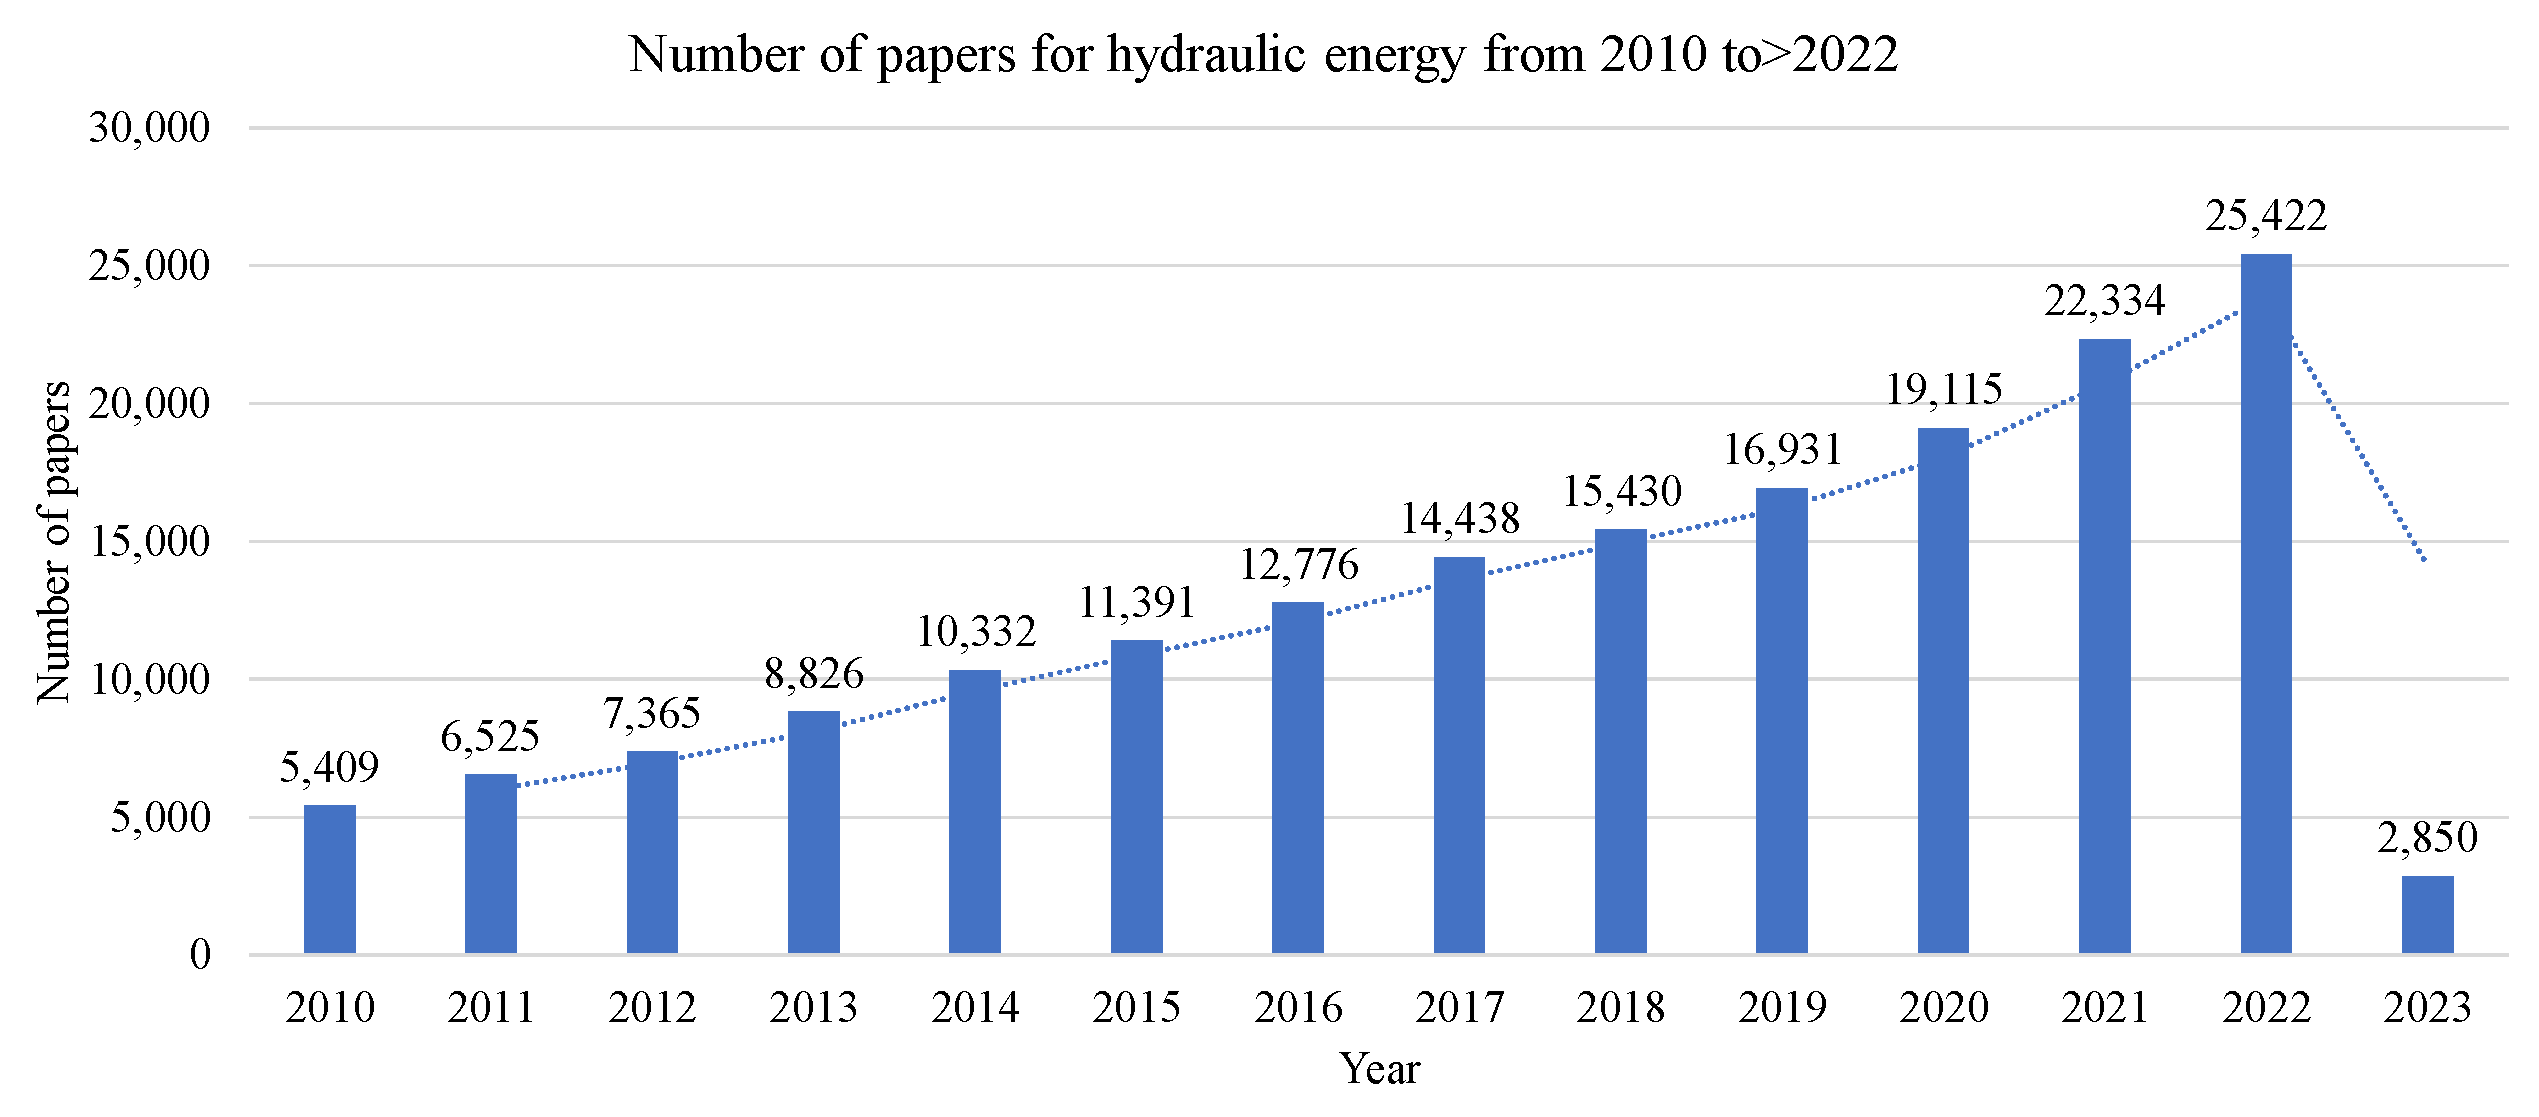
Hydraulic energy is a RE where the force of water is used to make the energy. It is mostly used to produce electric energy from the kinetic energy of water. Figure 9 shows the research paper publication for hydraulic energy. The graph is increasing, but it is steady growth. The Spread of RE usage depends on the activity of people as well. Available information about RE in a public forum is important for that. Detailed available information will make society understand the benefit of RE over traditional fuels. This aspect was discussed by Meirinhos et al. [109] for the city of Angolan, Central Africa. The city was excessively dependent on oil and caused too much emissions. That study found that hydraulic and biofuel are the two most promising RE. The tidal force is another significant resource of hydraulic energy. Yin et al. [110] designed a turbine H that could increase the tidal energy conversion. Their case study analysis using linear matrix inequality (LMI) showed that the energy efficiency of the proposed turbine was up to 40%.
Hočevar et al. [111] explained a long history of hydropower in Slovenia. Slovenia successfully maintained underwater life priority amid the hydroelectric power in the Sava river. That study predicted a need for hydro energy storage by 2027 due to the high demand for energy by 2030. Hydropower is generated from hydraulic turbines, which implies the quality of the turbine and its capacity affect the energy production. However, hydro energy production depends on the quality of the turbines. Caricimi et al. [112] explained sixteen factors related to a turbine for consideration when selecting turbines. These qualities consisted performance of the turbine, equipment costs, and generator costs. They used AHP and fuzzy algorithms to determine turbines to support small companies. Safety issue for the hydraulic power plant was studied by Bütüner et al. [113]. They used machine learning to predict safety and predicted 96.45% success with a standard deviation < 1%.
A lot of counties use hydraulic energy for generating energy. Sweden is the first among them who uses hydropower for generating electricity. Sweden establishes a support system “Electricity Certificate System” for electricity production. That support system ensures that the energy sources must come from renewable resources like air, tide, geothermal, etc. 43% electricity comes from hydraulic energy [94]. Chi et al. [114] proposed a novel approach of using rooftop rainwater for indoor air ventilation. They claimed that the ventilation device could have 46% energy saving potential of the corresponding building. Another work was proposed by Iyer et al. [115] that described the use of hydraulic power for room heating purposes. They showed that the mass balance loss could be saved for the direct conversion of wind energy to heat energy. They verified that this medium will be fruitful for windy places and could replace electricity issues. Hydraulic energy plant situates near reservoirs, which is generally not near to locality. As natural water sources are not suitable for producing energy, artificial water reservoirs are mandatory for hydraulic energy plants to store a huge amount of water. The number of efficient reservoirs is less, and building these reservoirs is expensive. Moreover, this whole process affects the water life, especially fish mitigation. A big threat to the hydraulic energy plant is drought. Intense climate change causes less rainfall and increases drought situations in several countries. 2022 hits a record high for extreme temperature, lower rainfall, and highest heat waves. This situation affects the water level of reservoirs and other local water resources.

3.5. Waste to Energy and Hydrogen Energy

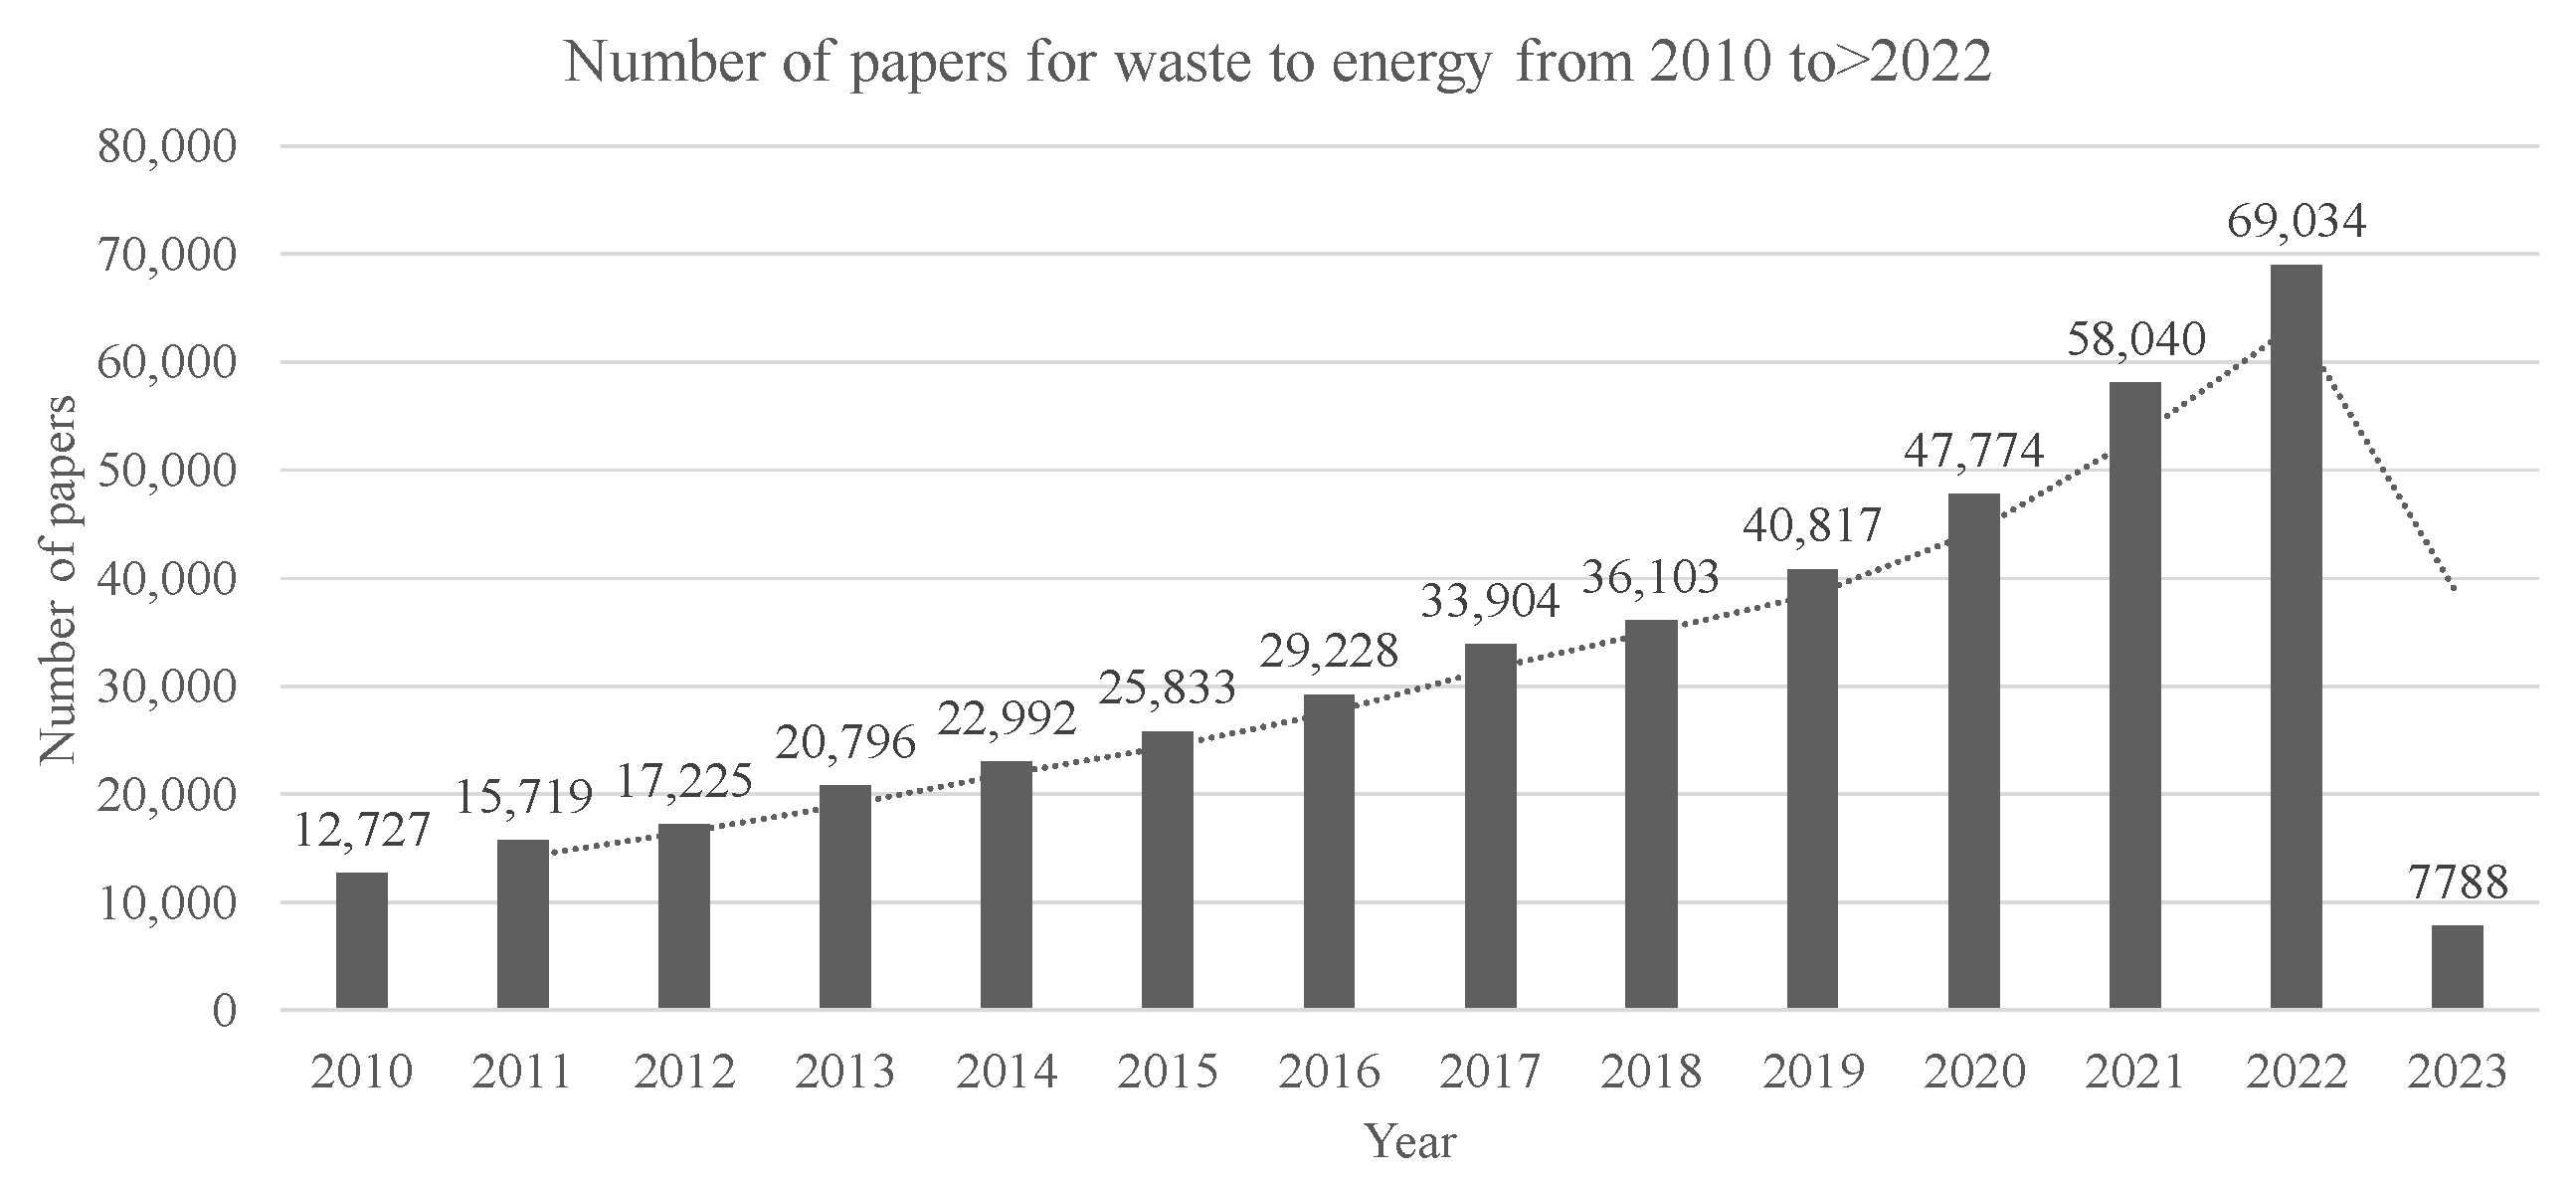
Waste to energy conversion reduces waste as well as produces energy. Without increasing waste and pollution, waste is used as a promising RE source. There are a lot of different types of waste as food waste, solid waste, municipal waste, and organic waste [116]. Conversion equivalency between waste and fossil fuel sources can be represented as: 1 t oil ≃ 4 t wastes and 1 t coal ≃ 2 t wastes [117]. Waste to energy conversion has a huge impact on waste management as well as a circular economy. The reason for the impact on circular economy is that the circular economy transfers waste to a new product and waste to energy does the same by converting waste mass balance to energy. Generally, heat or/and electricity are produced from wastes. Figure 10 shows a steady graph for the research in the area of waste to energy.
Misganaw et al. [51] explained a waste to energy scenario from Ethiopia. The country has a huge difference between energy demand and energy production. Waste was detected as a suitable RE resource for Ethiopia, and mass burning had a huge effect. They proved that municipal waste mass burning with recycling facilities produced less energy than just mass burning; the difference is almost 6%. That implied that if recyclable wastes were discarded from waste and used for energy production, that produced nearly 6% less energy than consideration of all waste as energy sources. Caferra et al. [118] surveyed public opinion on the waste to energy program, their participation in this program, and a few other questions. They found that waste to energy plants could be a good substitute for land-filling and burning wastes. However, still, there was a lack of infrastructure, technology, and a well-designed waste management policy. Yadav et al. [119] discussed waste reduction from byproducts of a production system. Their pollution reduction policy reduced 25.5% more pollution than other policies.
Biowaste (biomass) has a huge influence on the circular economy. A study found that [120] artificial neural network (ANN) provided higher heating value (HHV) from biomass. The application of wind energy is not as vast as solar energy. Studies showed that the location of waste in energy plants is an important factor to consider. Silva et al. [121] explained the most influencing factors as social, legal, environmental, and transportation facility. Local factors, locality (rural or urban) and intention of people of that area had too much influence. Any legal problems for land use and authority issues with local people were other big problems for an energy plant. The facility of water supply and transportation were two other factors in choosing a location for waste to energy plants. There is more than 2179 number of waste to energy plant throughout the globe. In Sweden, only 1% of the total waste are used for landfill, 47% of the total waste is used for recycling, and the rest, 52%, waste are used for producing energy. The country uses this waste for energy for home heating purposes, whereas the U.K. only recycles 44% of the total waste [122]. In contrast, the main drawback of waste to energy is a proper separation method of mixed waste, especially municipal waste. Municipal waste is one of the sources of waste raw materials for waste to energy plants. The incineration of these wastes causes huge carbon emissions in comparison with the relative energy produced from that corresponding incineration. This incineration process, sometimes called a ‘mass burn,’ destroys recoverable resources. Another new trend is going on for international waste trade. Developed countries send their waste to developing countries.
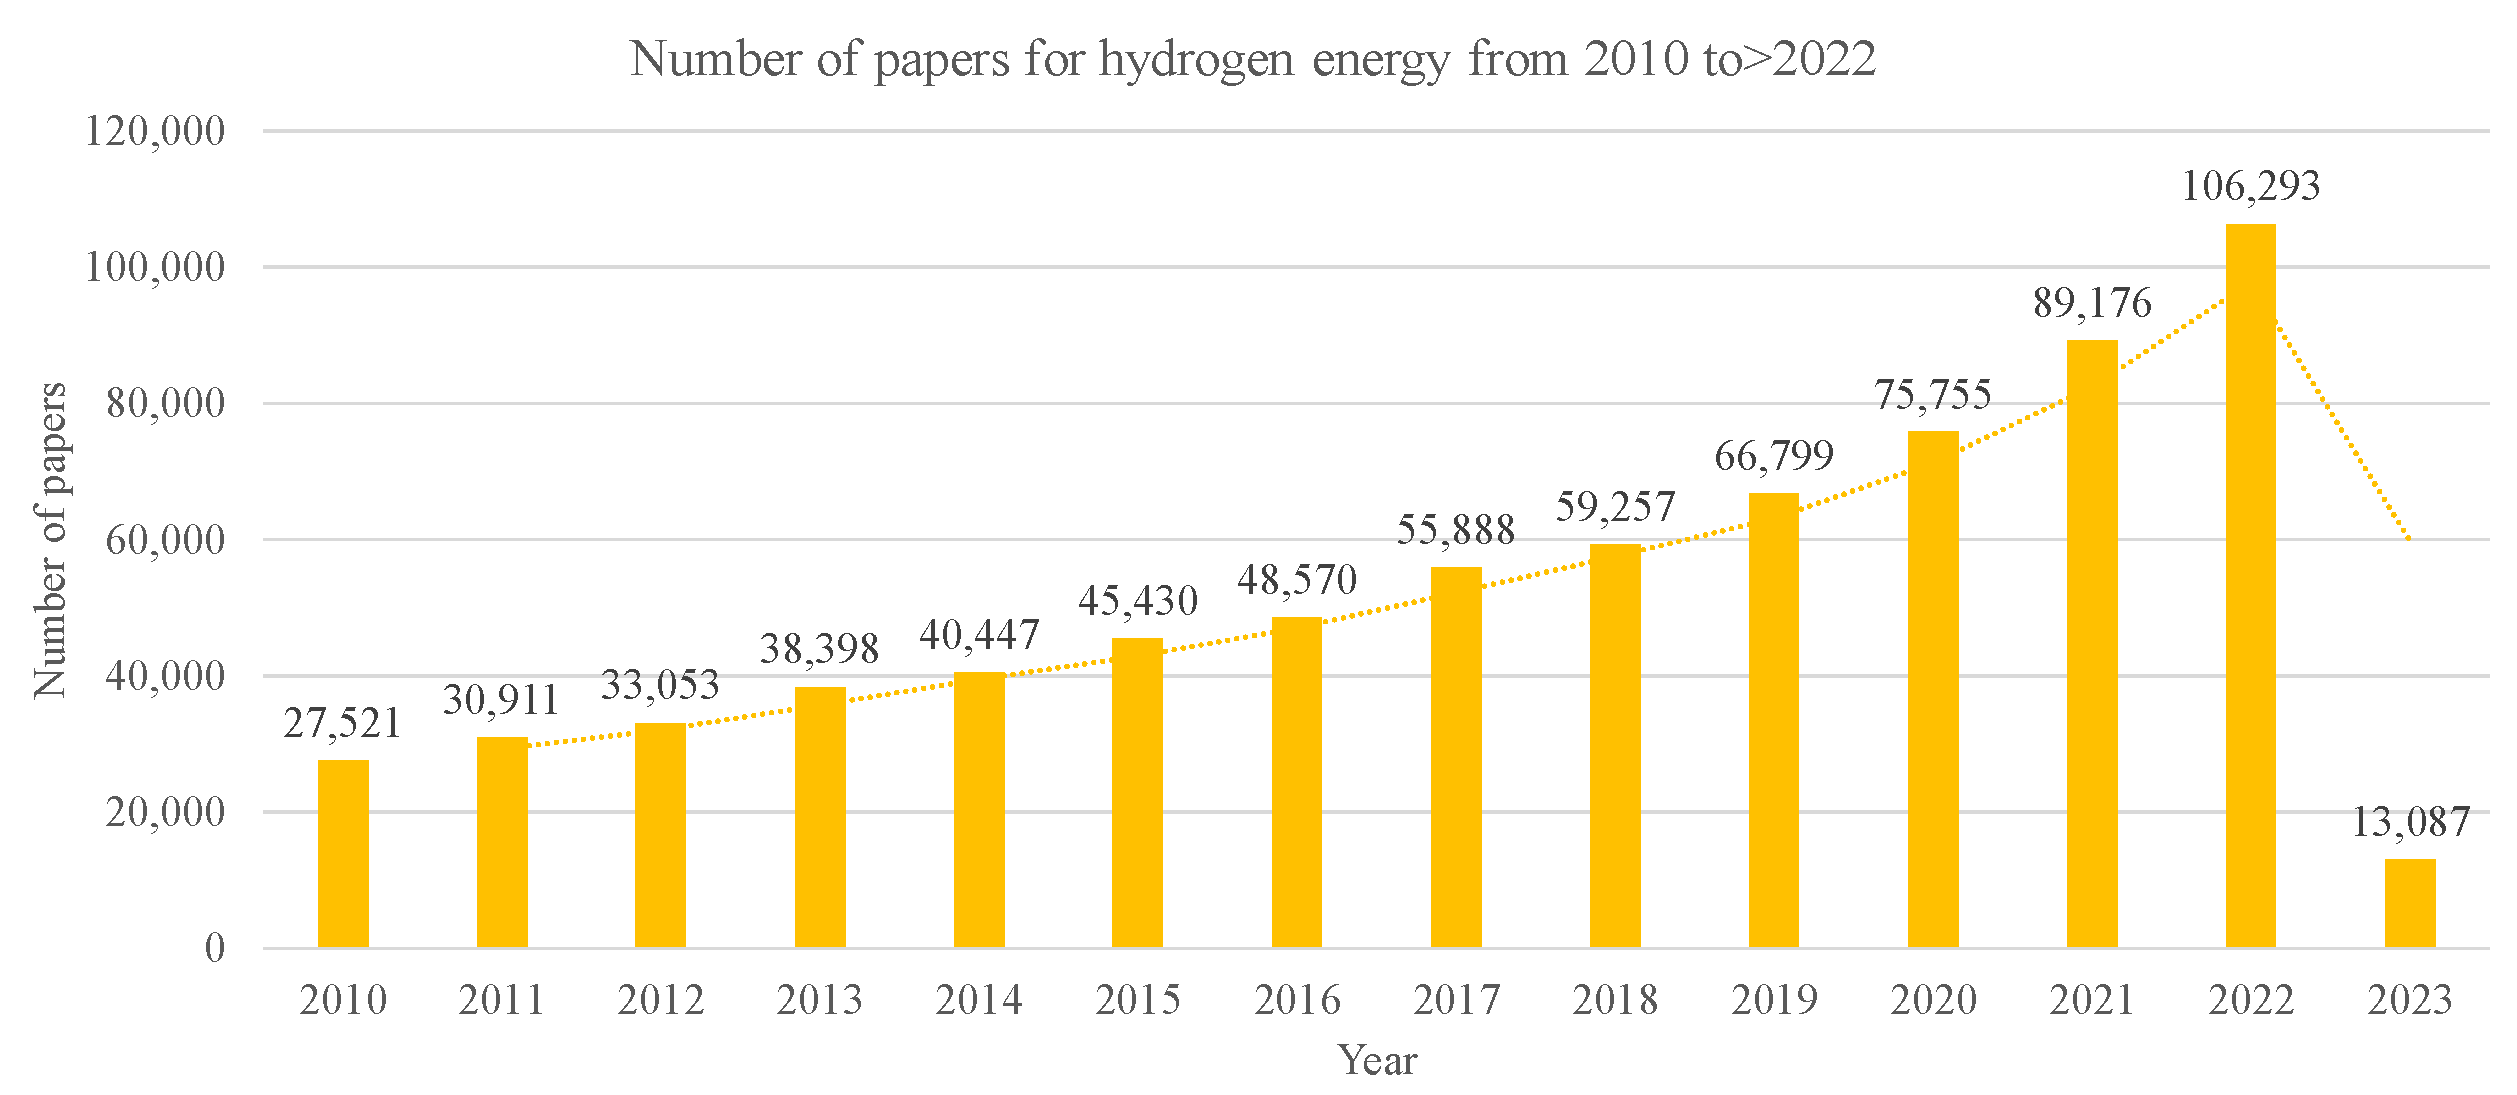
Hydrogen energy is the most-researched RE in the literature of RE. Figure 11 shows an increasing graph of hydrogen energy, and this growth becomes higher after 2019. Government subsidy [47] is the secure option for money flow to avoid loss. They suggested a few criteria to optimize a policy, like product quality increase and execution of hustle-free transportation. But the extraction of hydrogen is a costly process. This makes hydrogen energy expensive and requires a huge amount of investment. Besides, hydrogen is volatile in nature. It is both light in weight and inflammable. Hydrogen can be stored in liquid form. Thus, the hydrogen storage process is more complex than any fossil fuel. The transport of hydrogen energy is difficult due to the complex storage regulations and procedures.
Analyzing methodologies in detail is not the objective of this study. However, methodologies are the backbone of any research. This study explores the most used methodologies for RE. The next section gives a glimpse of the review.

4. Most Used Methodologies in Renewable Energy

Some methodologies support RE decision-making easily. Table 2 gives a glimpse of how articles used a different methodology. Irsyad et al. [123] gave an extensive review of research methodologies like Bottom-up energy modeling (BEM), System thinking approach (STA), Decision support analysis (DSA), and Life cycle thinking (LCT). Kim et al. [124] provided a detailed review of various methodologies such as Multiobjective programming (MOP), Multiattribute utility theory (MAUT), Analytical hierarchy process (AHP), Hierarchical decision model (HDM), Preference ranking organization method For enrichment evaluation (PROMETHEE), Elimination and choice translating reality (ELECTRE), and Decision support systems (DSS). Zig-Bee technology (ZBT), AHP, Monte Carlo method (MCM), Grey fuzzy integer programming (GFIP), Hybrid optimization by genetic algorithms (HOGA), Artificial neural network (ANN), Analytical neural process (ANP), Genetic algorithms (GA), Game theory approach, and Data envelopment analysis (DEA). Multicriteria decision analysis (MCDA) is the most famous methodology among all Wang et al. [125]. Different MCDA methods are used based on the criteria of the model.
Mardani et al. [128] discussed five types of methodologies as techniques for order of preference by similarity to ideal solution (TOPSIS) & Fuzzy-TOPSIS (F-TOPSIS), ANP, VlseKriterijuska Optimizacija I Komoromisno Resenje (VIKOR), AHP & F-AHP, and PROMETHEE. Strantzali and Aravossis [134] analyzed different decision support methods such as LCA, cost–benefit analysis (CBA), and MCDA. Bortoluzzi et al. [139] discussed a bibliometric analysis for the use of MCDA for RE models. Pan and Wang [126] showed from a case study in China that type-2 fuzzy sets were used for decision making. Wu et al. [135] used a data-driven interval approach using type-e fuzzy number for decision making for RE, whereas Dincer and Yuksel [136] hybrid methods such as DEMATEL and TOPSIS. Ezbakhe and Perez-Foguet [137] used an outranking method ELECTRE III and Wu et al. [138] used a distance-based method called Cumulative Prospect Theory (CPT).
Table 3 gives a gist of used methodologies for RE decision-making from 2010 to >2022. It shows that cost–benefit analysis, CBA, is the widely used decision-making method, followed by a decision support system and multiobjective optimization. After reviewing research and research trends in RE, detailed discussions on the review and insights from them are analyzed in the next section.

5. Discussions and Managerial Insights

The discussions of this review are multidimensional. The motivation of this research is to analyze research and data from 2010 to 2022 to show the growth of RE. It is observed from the literature survey that the growth has been steady since 2010, but it started to take a hike in 2020. This is the time when the COVID-19 pandemic happens. This is one of the findings of this study. Discussions analyze different perspectives after the long review process and provide associative insights from that perspective. These insights will be helpful for managerial decisions.

5.1. Applicability of RE in Other Industries

This review finds that there is a lot of opportunities to research about the application of RE in other cross-research areas. The analysis of the entire review on RE found 4–5 research articles, which tried to use RE in different sectors. Those articles formulate an explicit model to show the product in the presence of RE, and find optimum results of the model. It is not worth saying that there are no research articles that do not try to collaborate RE with other sectors. However, the maximum of that is either review or provide a single expression (for example, speed of turbine or consumption rate of RE), which is particularly related to the RE. Thus, there is a wider scope for empirical research and experimental studies as well. The application of RE and the corresponding research model formulation does not exist in the literature. That is the main finding of this review on the application of RE, and this study finds it as a significant research gap in the field of RE.
This research gap can be fulfilled by doing more research on the compatibility of RE in other industries will come out successfully and fruitfully. As the use of RE is so new in the industry, there is a big risk in adopting the policy as a managerial decision. There will always be a high risk of failure in the industry, and a huge loss is associated with it. The academic sector is reliable and beneficial for experimental research and can provide numerically experimental results with concrete theoretical proof. An interdisciplinary research for the compatibility of RE is important for the economic growth of RE, which is still questionable. It is proved that the solar energy cost is cheaper than the traditional energy only for few industries, whereas RE costs are still high for other industries than the basic traditional energy.

5.2. Availability of Renewable Energy Resources

This section discusses how the availability of energy resources affects the production of RE and what happens when the imported energy sources stop supplying. Analysis and insights are given for further improvements of shortcomings of RE production and usage.
The availability of RE resources greatly impacts the production and consumption of RE. Total of 11 counties are leading for the RE system. They are Sweden, Costa Rica, Scotland, Iceland, Germany, Uruguay, Denmark, China, Morocco, New Zealand, and Norway, respectively [140].
  • A lot of energy is used in Sweden than other countries, but still, they have low-key emissions due to RE. Sweden uses their natural resources as hydropower (for electricity) and bioenergy (for heating) [94]. Other available resources are nuclear and wind power.
  • 98% of its total energy is produced in Costa Rica from renewable resources, and available resources are hydro, geothermal, wind, solar, and biomass [140]. They produce more the 98% of the total demand in just the first six months of 2022. Among them, 70.08% is from hydraulic energy, followed by 14.18% from geothermal energy, 13.46% from Bioenergy, 1.42% from thermal energy, and 0.86% is from solar energy [141].
  • RE resources as wind, tidal, hydraulic, and solar energy are used in Scotland. By 2045, they will have a target of net-zero emissions. They produce almost 1.9 TW in the first half of 2022, which is more, almost 30% more than the first half of 2021 [142].
  • The geothermal energy and hydropower are two strong sources of RE in Iceland. They produce almost 100% of the total electricity and heat from RE. 9 out of 10 houses use geothermal energy for heating purposes. They play a key role in the energy and sustainability sector and aim to meet carbon neutrality by 2040 [143].
  • 46% of the total energy from renewable energy resources such as solar and wind power is produced in Germany. Still, they are lacking to reach their target of 80% of the total consumption in 2030 [144]. Uruguay generates 98% of its electricity from RE resources such as hydro, supported by solar, wind, and bioenergy. They have reached this label since 2005. Among them, 31% is from both hydro and wind energy, followed by fossils (24%), biomass (9%), and solar (5%) [145].
  • Denmark uses wind and solar power as resources of RE. 43% of its total electricity consumption is generated by wind energy. China is taking the lead for wind and solar energy, whereas they are the most emitter all around the globe. China is one of the global investors for RE [140].
  • Russia-Ukraine war in 2022 pushes other countries to increase the capacity of RE on their own. This situation occurs as Russia, one of the capacitors of RE, stopped providing natural gas resources to three counties Finland, Poland, and Bulgaria. Europe takes the lead for the increment of this green energy capacity [146].
Discussions show that a strong hold on renewable resources can give a long time benefit. Energy share can support any other unwanted situations, which will help not to go back to the initial stage of fossil fuels. Sharing of RE can help other nations, unable or unwilling to install setups for RE. Researchers [147,148] discussed renewable power share where [148] found that energy share could reduce buyer’s energy cost by 46.2% and increase profit by 62.5%.

5.3. Contributions in Sustainability

RE contributes to sustainability strongly, especially in environmental development. Environmental development is the prime feature of RE. This RE helps humankind to solve a triggering issue, energy resources. As a society depends on fossil fuels too much and energy consumption hits a new record yearly, resource problems come out. RE solves two problems at a time: energy resource issues and emissions issues. Contributions of RE to sustainability are discussed below in detail.

5.3.1. Economic Development

Economic development for the RE sector is growing well, but researchers have different theories on the exact relation between economic growth and RE. In the preliminary stages, RE expenses were too high, so revenue generation was hard. The initial setup, accessories for RE, and other costs were too high. One of the main reasons for that is the detailed project plan and designs. The lack of field experts, product designs, and a master plan for establishing the project are a few reasons for the high price. However, difficulties are reduced over time; for example, the solar energy is already cheaper than coal and fossil fuel [149] in a few industries. The solar energy cost is 15% cheaper than te coal’s price when it was first introduced commercially. The prediction says that it will be cheaper than others for almost all industries by 2050. This turns the table for the RE market and economic growth. As a result, market demand for RE is increasing yearly and making new records [150].

5.3.2. Environmental Development

The main purpose of introducing RE is an environmental factor, and it works fine as well to achieve the decarbonization goal. More than 50% funds for climate change is spend on RE, mostly solar, hydraulic, and wind energies [151]. Countries are doing well in producing RE instead of coal and fossil fuels. Few countries are doing more than good and have reached almost 100% or near the expected target of producing RE [140,141]. Not only producing RE but also utilization and consumption of RE in those counties are high [94,142]. These phenomena show that countries like Sweden, Costa Rica, and others [140] are reaching the target of SDG 7, using clean energy. The fact is that total energy consumption may increase due to industrialization, but the target is to use clean energy to reduce emissions and GHGs. Thus, those energy demands can be consumed by RE, and that is the aim of the RE. The review shows that the progress and growth in both academic and industry sectors are very good to increase the SDG 7 index. One interesting fact is that RES is mostly used for electricity production. Decarbonization in transportation section is harder [152].

5.3.3. Social Development

The well-being of each citizen achieved by their optimum potential is the perspective of social development. It ensures citizens’ social safety, security, mental health, and happiness. Social development indicates qualitative improvement, and the increasing growth of RE has a huge contribution. A steady and constant money flow gives each citizen social security so that they do not worry that much about their daily life and well-being. RE opens up a new industry sector based on renewable resources. This creates a huge job opportunity for different kinds of people. According to a United Nations report, 0.7 million job places increased in 2021, and total job opportunities hit 12.7 million until 2021 [153]. This gives a clear idea that the RE sector is a big hope for a society in the near future, which is sustainable for human health and the environment.
From discussions, it is clear that huge growth in the economic sector is vivid. This growth is mainly in the industrial sectors. There is a lack of research, and more importantly, the applicability of RE in other research fields is not explored yet. Well-explored areas for RE are RE itself as to how algorithms will improve the accuracy of converters or which factors can improve the capacity of the turbine. Few research papers show the applicability of RE through theoretical models in the cross-research field, like optimization of RE consumption in a transportation model and optimum energy conversion as well as production within an energy supply chain. Thus, the next section explores a few open problems combining two or more research fields with RE.

6. Open Problems

After a long and detailed review of RE, its usage, and growth, it is recognized and analyzed things that it can be discussed in detail as a recommendation for open problems. Recent studies take initiatives for emissions reduction. Studies use different types of investments and emissions costs, which are able to reduce carbon emissions effect. A smart production system was studied by Moon et al. [154], where the system emitted carbon emissions. In a similar direction, Kar et al. [155] discussed the emissions reduction policy from a manufacturing farm, whereas [5] used an additional investment for a green environment. Mukherjee et al. [156] estimated flow of products for cross-docking. Mondal et al. [157] discussed a technology sharing contract between two supply chain players for a remanufacturing system without considering any environmental protection.
Energy effects is another research area other than carbon emissions in inventory, SCM, and production management. Few articles discussed energy effects as Mittal and Sarkar [11] examined a random energy price effect under a global SCM. Mishra et al. [158] discussed carbon emissions scenarios for a sustainable inventory management, whereas Bachar et al. [159] considered sustainable energy consumption within a smart manufacturing system. Yadav et al. [160] explained a smart production system under the energy effect, where energy was calculated for each step of the production, whereas Sarkar et al. [161] illustrated an autonomation policy within a smart production system without energy effect. Padiyar et al. [162] described an inflationary environment for an inventory model without considering energy effect. Oryani et al. [163] discussed a natural resource index by analyzing oil, coal, forest, natural gas, and mineral rents. All the above studies examined traditional energy effects for different systems but not for RE.
Different source of energy has different energy efficiency. Wind energy is the most efficient among all renewable energy resources, followed by geothermal energy, hydro energy, nuclear energy, and solar energy. But, according to the usage, the most used renewable energy resources can be ranked as hydraulic energy, solar energy, wind energy, bioenergy, and geothermal energy. The first problem uses solar energy, whereas the second problem uses bioenergy, and the third problem uses hydraulic energy. As they have different efficiency rates, the three formulas use three different energy efficiency rates.
  • A smart warehouse is used for product tracking and storage within an SCM. The warehouse has different shapes [164] based on the area and investment of the manufacturer. The smart warehouse uses a radio-frequency identification (RFID) tracking system to track a product’s movement until it reaches the retailer [165]. The RFID installment in the warehouse requires a huge investment. Thus, the technology-based SCM requires energy for the entire RFID system. Then, what will be the structure of the RFID system’s investment if the warehouse’s entire energy supply is based on solar energy? If the required energy for the system is E kW and α % of the total energy is replaced by solar energy, and each solar panel’s capacity is C p , then the number of solar panels for the projected energy capacity is
    Number of solar panels = 1000 ( E α ) ϵ C p , ϵ is the solar energy efficiency .
    (1 kW = 1000 W; 1 gallon = 33.7 kW) Then, total panel cost = c × Number of solar panels. If c is the unit panel cost, M is the material purchasing cost; then, the total solar cost becomes
    T S C = c × 1000 ( E α ) ϵ C p + M .
    The required space (sq ft.) for installing the solar energy facility is
    S = s × Number of solar panels ,
    s sq ft. is the unit space of one panel. Then, unit solar energy production cost per sq ft. ( $ U S E /W/sq ft.) is
    U S E = T S C S .
    The study [164] has a different warehouse area, and RFID cost depends on the area. Now, the updated RFID cost ( f ( d ) ) for warehouse is
    f ( d ) = c 1 × Number of RFID readers + U S E × Area of the warehouse .
    Modified unit solar energy cost can be calculated for the unit product or the number of the light facility.
  • Carbon emissions reduction from a production system is a nice idea as the production system emits a lot of carbon in the environment [166]. Considering a single carbon cost for emissions from the system due to fossil fuel burning does not make the system sustainable. Bioenergy acts like fossil fuel and has a high capacity like fossil fuel. What will be the mathematical modelling and corresponding profit if the production system uses bioenergy instead of traditional energy? Which system will be more economically profitable?
    If a production system requires E b kW energy and α b % of that total energy is fulfilled by bioenergy, then bioenergy consumption for the production system is
    T E = E b α b ϵ 1 kW , ϵ 1 is the bioenergy energy efficiency , = E b α b ϵ 1 33.7 gallon 6 .
    The manufacturer is buying bioenergy instead of producing. The manufacturer buys one or more bioenergy types from different production companies. If the manufacturer buy bioenergy j at a price U B E j /gallon, then the total cost of using bioenergy becomes
    T B C = j = 1 n U B E j E b α b ϵ 1 33.7 .
    j is the number of biomass types. The capacity of bioenergy depends on the biomass, that is, which type of biomass is used for the bioenergy. Thus, the unit production cost of the bioenergy depending on biomass category j is P B E j , U B E j > P B E j [106,107].
  • Hydraulic energy is widely used in electricity generation. Preservation requires a lot of electricity consumption in the food industry. Many research papers in inventory and SCM require preservation technology [167], but no studies specify electricity consumption and associated costs for electricity use. How will the modeling change when the cost formulation for hydraulic energy will be used particularly for investment?
    If the manufacturer requires total E h kW energy and α h % of that energy is from hydraulic energy, then the required hydraulic energy is
    E h α h ϵ 2 , ϵ 2 is the hydraulic energy efficiency .
    If U h /kW is the unit buying price of hydraulic energy, then the total buying price is U h E h α h ϵ 2 . Now, the manufacturer stores the received energy using the battery. If each battery has B h mW storage capacity, then the number of required batteries is E h α h ϵ 2 B h 1000 (1 mW = 1000 kW). Then, the storage maintenance cost is
    C m E h α h ϵ 2 1000 B h , C m is the unit storage cost .
    Thus, the total cost of the manufacturer for hydraulic energy is
    T H C = U h E h α h ϵ 2 + C m E h α h ϵ 2 1000 B h .
  • RE import and export is a new international trade, and in many energy sectors, China takes the lead, followed by Japan and Germany. There is more than one supplier for wind energy, which implies that a supplier selection is required based on the industry’s criteria with product security [168]. If there is a global supplier selection for wind energy importers, what will be the decision support system for supplier selection? What will be the cost of importing wind energy?
  • Few counties which previously used natural gas go back to coal energy resources because of the Russia–Ukraine war [169]. This situation can happen more often if each country fails to identify its strong renewable energy sources. For example, Sweden can use less solar power; thus, they use hydro, bio, and nuclear energy resources. Instead of importing major help on a continued basis, an independent setup and system with period help will be more beneficial.
  • The above situation explains one of the shortcomings of RE, which is the resources and setup. Economically and technologically established countries can help other economically and technologically viable nations to setup an independent design for RE based on their strong source of energy resources.

7. Conclusions

The rise of RE in last ten years was very promising in different aspects. RE production from the first half of 2022 only suppressed the coal energy by more than 18%, and for nuclear power, this RE generation was more than 75%. Emissions should be reduced as fossil fuel usage was reduced. The result came out in contrast. By the COP27 report, carbon emissions hit a record in 2022 by increasing 1% [170]. Emissions from the U.S. raised by more than 1.5%, whereas the highest 6% is increased in India. Those emissions were caused by coal and oil-based energy resources. In recent years, Total emissions in India is more than EU; however, per capita (Per capita is used as per person for statistical analysis. This is used statistical data related to any population. It is calculated based on the median of a population. It provides accurate comparison when it comes to different countries, populations, and sample type [171].) emissions were much lower [172]. There were other reasons too for increasing emissions rather than increasing RE usage as deforestation, increasing industry waste, and war, which were not in the scope of this study. The good news was that even if the emissions increased, the emissions curve flattened over time. RE usage will increase 8% by 2023, and the majority will be China, E.U., Latin America, and the U.S. Even in 2022, the U.S. tended to downward usage of RE. According to a report, 90% of the world’s electricity is expected from RE by 2050 [173,174].
This paper reviewed many research papers on RE. Among them, few related studies were listed in references. The research pattern in RE showed many research papers in the core field, while research papers in cross-research were few. The reasons behind this finding can be explained in different ways. The most appropriate explanation which can justify the situation is showing the applicability of RE in other research fields requires a mathematical model. A theoretical model can prove the reliability of a concept that is really possible to execute the idea or not. The main hurdle for executing a mathematical model is establishing functions and then the feasibility check of those functions. Cross-checking complex functions is not easy when the concept is entirely new. These objective functions and relevant formulations will be unique in the literature. Thus, authors will have no help from the literature, and then establishing the feasibility of newly-made functions will become hard. Therefore, formulating a mathematical model utilizing RE as an active part of the model in cross-research is an open problem.
No separate future extensions are provided with this study because that is found as the research gap of this review. All suggested open problems can be executed as an extension of this model.

Author Contributions

Conceptualization, methodology, B.S. and R.G.; supervision, validation, investigation, resources, visualization, project administration, and funding acquisition, B.S.; software, formal analysis, data curation, writing—original draft preparation, and writing—review and editing, R.G. All authors have read and agreed to the published version of the manuscript.

Funding

This research received no external funding.

Data Availability Statement

Not applicable.

Conflicts of Interest

The authors declare no conflict of interest.

Abbreviations

The following abbreviations are used in this manuscript:
B.C.Before Christ
U.S.United States
U.K.United Kingdom
USDUnited States Dollar
TWTerawatt
GWGigawatt
RERenewable Energy
BTBlockchain Technology
GHGGreenhouse Gas
E.U.European Union
SCMSupply Chain Management
RFIDRadio-frequency Identification
SDGsSustainable Development Goals
SSCMSustainable Supply Chain Management
CPTCumulative Prospect Theory
ESCMEnergy Supply Chain Management
CHPConversion Process by Heat and Power
RESRenewable Energy Sources
TBLTriple Bottom Line
SMESmall Manufacturing Enterprise
BESSBattery Energy Storage System
WECDWind Energy Captive Device
RLReinforcement Learning
WTPWillingness to Pay
MNILinear Matrix Inequality
ANPAnalytic Network Process
MCDMMulticriteria Decision Method
AHPAnalytic Hierarchy Process
BEMBottom-up Energy Modeling
STASystem Thinking Approach
DSADecision Support Analysis
LCTLife Cycle Thinking
MOPMultiobjective programming
MAUTMultiattribute Utility Theory
HDMHierarchical Decision Model
DSSDecision Support Systems
ZBTZig-Bee Technology
MCMMonte Carlo Method
ANNArtificial Neural Network
GAGenetic Algorithm
MCDAData Envelopment
CBACost Benefit Analysis
CPTCumulative Prospect Theory
GFIPGrey Fuzzy Integer Programming
HOGAHybrid Optimization by Genetic Algorithm
TOPSISTechnique for Order of preference by similarity
ELECTREElimination and Choice Translating Reality
VIKORVlseKriterijuska Optimizacija I Komoromisno Resenje
NASAThe National Aeronautics and Space Administration
PROMETHEEPreference Ranking Organization Method for Enrichment evaluation

References

  1. McKinsey & Company. The Decoupling of GDP and Energy Growth: A CEO Guide. Available online: https://www.mckinsey.com/industries/electric-power-and-natural-gas/our-insights/the-decoupling-of-gdp-and-energy-growth-a-ceo-guide (accessed on 12 December 2022).
  2. Energy Education. Energy Conversion Technology. Available online: https://energyeducation.ca/encyclopedia/Energy_conversion_technology (accessed on 12 December 2022).
  3. World Economic Forum. Energy Transition. How Can We Store Renewable Energy? 4 Technologies That Can Help. April 2021. Available online: https://www.weforum.org/agenda/2021/04/renewable-energy-storage-pumped-batteries-thermal-mechanical/ (accessed on 12 December 2022).
  4. Hu, W.; E, J.; Leng, J.; Zhang, F.; Chen, J.; Ma, Y. Investigation on Harvesting Characteristics of Convective Wind Energy From Vehicle Driving on Multi-Lane Highway. J. Energy 2023, 263, 126062. [Google Scholar] [CrossRef]
  5. Habib, M.S.; Omair, M.; Ramzan, M.B.; Chaudhary, T.N.; Farooq, M.; Sarkar, B. A robust Possibilistic Flexible Programming Approach Toward a Resilient and Cost-Efficient Biodiesel Supply Chain Network. J. Clean. Prod. 2022, 366, 132752. [Google Scholar] [CrossRef]
  6. Liu, W.; Wang, K.; Hao, H.; Yan, Y.; Zhang, H.; Zhang, H.; Peng, C. Predicting Potential Climate Change Impacts of Bioenergy from Perennial Grasses in 2050. Resour. Conserv. Recycl. 2023, 190, 106818. [Google Scholar] [CrossRef]
  7. Saxena, N.; Sarkar, B. How Does the Retailing Industry Decide the Best Replenishment Strategy by Utilizing Technological Support Through Blockchain? J. Retail. Consum. Ser. 2023, 71, 103151. [Google Scholar] [CrossRef]
  8. Lipschutz, S.; Zegers, R.G.T.; Hill, J.; Liddick, S.N.; Noji, S.; Prokop, C.J.; Scott, M.; Solt, M.; Sullivan, C.; Tompkins, J. Digital Data Acquisition for the Low Energy Neutron Detector Array (LENDA). Nucl. Instrum. Meth. Phys. Res. Sect. A Accel. Spectrom. Detect. Assoc. Equip. 2016, 815, 1–6. [Google Scholar] [CrossRef] [Green Version]
  9. United Nations Development Programme. What Are the Sustainable Development Goals? Available online: https://www.undp.org/sustainable-development-goals?utm%5C_source=%5C%5CEN%5C&utm%5C_medium=GSR%5C&utm%5C_content=US%5C_UNDP%5C_PaidSearch%5C_Brand%5C_English%5C&utm%5C_campaign=CENTRAL%5C&c%5C_src=CENTRAL%5C&c%5C%5C%5C_src2=GSR%5C&gcli%5Cd=Cj0KCQiAtICdBhCLARIsALUBFcG5aSYGl1bYgYAFbFpsTOLp38lboK8hOSm1OZl6EpVOfXv0l9RrxYAaAlijEAL%5C%5Cw%5C_wcB (accessed on 19 December 2022).
  10. Fernando, Y.; Tseng, M.L.; Aziz, N.; Ikhsan, R.B.; Wahyuni-TD, I.S. Waste-to-Energy Supply Chain Management on Circular Economy Capability: An Empirical Study. Sustain. Prod. Consump. 2022, 31, 26–38. [Google Scholar] [CrossRef]
  11. Mittal, M.; Sarkar, B. Stochastic Behavior of Exchange Rate on an International Supply Chain Under Random Energy Price. Math. Comput. Simul. 2023, 205, 232–250. [Google Scholar] [CrossRef]
  12. Geng, D.; Evans, S. A Literature Review of Energy Waste in the Manufacturing Industry. Comput. Ind. Eng. 2022, 173, 108713. [Google Scholar] [CrossRef]
  13. Lim, L.K.; Muis, Z.A.; Ho, W.S.; Hashim, H.; Bong, C.P.C. Review of the Energy Forecasting and Scheduling Model for Electric Buses. Energy 2023, 263 Pt D, 125773. [Google Scholar] [CrossRef]
  14. Iqbal, M.W.; Kang, Y.; Jeon, H.W. Zero Waste Strategy for Green Supply Chain Management with Minimization of Energy Consumption. J. Clean. Prod. 2020, 245, 118827. [Google Scholar] [CrossRef]
  15. Sarkar, M.; Seo, Y.W. Renewable energy supply chain management with flexibility and automation in a production system. J. Clean. Prod. 2021, 324, 129149. [Google Scholar] [CrossRef]
  16. ScienceDirect. Available online: https://www.sciencedirect.com/search?qs=renewable%20energy (accessed on 12 December 2022).
  17. Google Scholar. Available online: https://scholar.google.com/scholar?start=0&q=renewable+energy&hl=en&as_sdt=0,5&as_ylo=2010&as_yhi=2023 (accessed on 12 December 2022).
  18. World Meteorological Organization. Eight Warmest Years on Record Witness Upsurge in Climate Change Impacts. November 2021. Available online: https://public.wmo.int/en/media/press-release/eight-warmest-years-record-witness-upsurge-climate-change-impacts (accessed on 20 December 2022).
  19. Sgarbossa, F.; Arena, S.; Tang, O.; Peron, M. Renewable Hydrogen Supply Chains: A Planning Matrix and an Agenda for Future Research. Int. J. Prod. Econ. 2023, 255, 108674. [Google Scholar] [CrossRef]
  20. Groissböck, M.; Gusmão, A. Impact of Renewable Resource Quality on Security of Supply with High Shares of Renewable Energies. Appl. Energy 2020, 277, 115567. [Google Scholar] [CrossRef]
  21. Mastrocinque, E.; Ramírez, E.J.; Honrubia-Escribano, A.; Pham, D.T. An AHP-Based Multi-Criteria Model for Sustainable Supply Chain Development in the Renewable Energy Sector. Exp. Syst. App. 2020, 150, 113321. [Google Scholar] [CrossRef]
  22. Al-Ghussain, L.; Ahmad, A.D.; Abubaker, A.M.; Mohamed, M.A.; Hassan, M.A.; Akafuah, N.K. Optimal Sizing of Country-Scale Renewable Energy Eystems Towards Green Transportation Sector in Developing Countries. Case Stud. Therm. Eng. 2022, 39, 102442. [Google Scholar] [CrossRef]
  23. Han, S.; Kim, J. Optimization-Based Integration and Analysis of a Complex Renewable Energy System for the Transportation Sector. Chem. Eng. Res. Des. 2017, 128, 1–14. [Google Scholar] [CrossRef]
  24. BBC News. US Oil Prices Turn Negative as Demand Dries Up. April 2020. Available online: https://www.bbc.com/news/business-52350082 (accessed on 20 December 2022).
  25. Ustinov, D.N.; Shafhatov, E.R. Assessment of Reliability Indicators of Combined Systems of Offshore Wind Turbines and Wave Energy Converters. Energies 2022, 15, 9630. [Google Scholar] [CrossRef]
  26. Bakeer, A.; Magdy, G.; Chub, A.; Jurado, F.; Rihan, M. Optimal Ultra-Local Model Control Integrated with Load Frequency Control of Renewable Energy Sources Based Microgrids. Energies 2022, 15, 9177. [Google Scholar] [CrossRef]
  27. Villacreses, G.; Jijón, D.; Nicolalde, J.F.; Martínez-Gómez, J.; Betancourt, F. Multicriteria Decision Analysis of Suitable Location for Wind and Photovoltaic Power Plants on the Galápagos Islands. Energies 2023, 16, 29. [Google Scholar] [CrossRef]
  28. Chen, K.; Peng, H.; Gao, Z.; Zhang, J.; Chen, P.; Ruan, J.; Li, B.; Wang, Y. Day-Ahead Operation Analysis of Wind and Solar Power Generation Coupled with Hydrogen Energy Storage System Based on Adaptive Simulated Annealing Particle Swarm Algorithm. Energies 2022, 15, 9581. [Google Scholar] [CrossRef]
  29. Ndiaye, A.; Moussa, M.S.; Dione, C.; Sawadogo, W.; Bliefernicht, J.; Dungall, L.; Kunstmann, H. Projected Changes in Solar PV and Wind Energy Potential over West Africa: An Analysis of CORDEX-CORE Simulations. Energies 2022, 15, 9602. [Google Scholar] [CrossRef]
  30. Michiorri, A.; Sempreviva, A.M.; Philipp, S.; Perez-Lopez, P.; Ferriere, A.; Moser, D. Topic Taxonomy and Metadata to Support Renewable Energy Digitalisation. Energies 2022, 15, 9531. [Google Scholar] [CrossRef]
  31. Tahri, A.; Bouya, M.; Ghazouani, M.; Achak, O.; Chafik, T.; Azdi, K.E.; Boughanbour, S. Impact of Solar Energy Integration on the Rheological and Chemical Properties of Bitumen. Energies 2023, 16, 14. [Google Scholar] [CrossRef]
  32. Odzijewicz, J.I.; Wołejko, E.; Wydro, U.; Wasil, M.; Jabłońska-Trypuć, A. Utilization of Ashes from Biomass Combustion. Energies 2022, 15, 9653. [Google Scholar] [CrossRef]
  33. Zimon, G.; Tarighi, H.; Salehi, M.; Sadowski, A. Assessment of Financial Security of SMEs Operating in the Renewable Energy Industry during COVID-19 Pandemic. Energies 2022, 15, 9627. [Google Scholar] [CrossRef]
  34. Miskiewicz, R. Clean and Affordable Energy within Sustainable Development Goals: The Role of Governance Digitalization. Energies 2022, 15, 9571. [Google Scholar] [CrossRef]
  35. World Economic Forum. Climate Change. ‘Wind and Solar Are Proving Themselves’: Renewables Met Rise in Electricity Demand during First Half of 2022. October 2022. Available online: https://www.weforum.org/agenda/2022/10/wind-and-solar-proving-themselves-renewables-rise-in-electricity-demand-2022/ (accessed on 13 December 2022).
  36. Financial Times. Solar Power Expected to Surpass Coal in 5 Years, IEA Says. Available online: https://www.ft.com/content/98cec49f-6682-4495-b7be-793bf2589c6d (accessed on 13 December 2022).
  37. Ember. Data into Actions. Available online: https://ember-climate.org/ (accessed on 13 December 2022).
  38. Köktürk, G.; Tokuç, A. Vision for Wind Energy with a smart Grid in Izmir. Renew. Sustain. Energy Rev. 2017, 73, 332–345. [Google Scholar] [CrossRef]
  39. Watson, D.; Rebello, E.; Kii, N.; Fincker, T.; Rodgers, M. Demand and Energy Avoidance by a 2 MWh Energy Storage System in a 10 MW Wind Farm. J. Energy Storage 2018, 20, 371–379. [Google Scholar] [CrossRef]
  40. Ai, C.; Zhang, L.; Gao, W.; Yang, G.; Wu, D.; Chen, L.; Chen, W.; Plummer, A. A Review of Energy Storage Technologies in Hydraulic Wind Turbines. Energy Convers. Manag. 2022, 264, 115584. [Google Scholar] [CrossRef]
  41. Liu, H.; Chen, G.; Xie, C.; Li, D.; Wang, J.; Li, S. Research on Energy-saving Characteristics of Battery-Powered Electric-hydrostatic Hydraulic Hybrid Rail Vehicles. Energy 2020, 205, 118079. [Google Scholar] [CrossRef]
  42. Yu, Y.; Do, T.C.; Park, Y.; Ahn, K.K. Energy Saving of Hybrid Hydraulic Excavator with Innovative Powertrain. Energy Convers. Manag. 2021, 244, 114447. [Google Scholar] [CrossRef]
  43. Yang, J.; Liu, B.; Zhang, T.; Hong, J.; Zhang, H. Application of Energy Conversion and Integration Technologies Based on Electro-hydraulic Hybrid Power Systems: A Review. Energy Convers. Manag. 2022, 272, 116372. [Google Scholar] [CrossRef]
  44. Yang, J.; Liu, B.; Zhang, T.; Hong, J.; Zhang, H. Multi-parameter Controlled Mechatronics-electro-hydraulic Power Coupling Electric Vehicle Based on Active Energy Regulation. Energy 2023, 263, 125877. [Google Scholar] [CrossRef]
  45. Wei, G.; Jiani, G.; Lin, Z.; Pengfei, Z.; Die, W.; Lijuan, C.; Chao, A. Bivariate Active Power Control of Energy Storage Hydraulic Wind Turbine. J. Energy Storage 2022, 55, 105433. [Google Scholar] [CrossRef]
  46. Abaecherli, M.L.; García, E.C.; Szijjarto, A.; Hungerbühler, K. Optimized Energy Use Through Systematic Short-term Management of Industrial Waste Incineration. Comput. Chem. Eng. 2017, 104, 241–258. [Google Scholar] [CrossRef]
  47. Zhang, Q.; Chen, W.; Ling, W. Policy Optimization of Hydrogen Energy Industry Considering Government Policy Preference in China. Sustain. Prod. Consum. 2022, 33, 890–902. [Google Scholar] [CrossRef]
  48. Mohammadi, K.; McGowan, J.G. Thermoeconomic Analysis of Multi-stage Recuperative Brayton Cycles: Part II – Waste Energy Recovery Using CO2 and Organic Rankine Power Cycles. Energy Convers. Manag. 2019, 185, 920–934. [Google Scholar] [CrossRef]
  49. Puttachai, W.; Tarkhamtham, P.; Yamaka, W.; Maneejuk, P. Linear and Nonlinear Causal Relationships Between Waste-to-energy and Energy Consumption in Germany. Energy Rep. 2021, 7, 286–292. [Google Scholar] [CrossRef]
  50. Lee, J.; Lin, K.Y.A.; Jung, S.; Kwon, E.E. Hybrid Renewable Energy Systems Involving Thermochemical Conversion Process for Waste-to-energy Strategy. Chem. Eng. J. 2023, 452, 139218. [Google Scholar] [CrossRef]
  51. Misganaw, A.; Teffera, B. An Assessment of the Waste-to-energy Potential of Municipal Solid Wastes in Ethiopia. Bioresour. Technol. Rep. 2022, 19, 101180. [Google Scholar] [CrossRef]
  52. Apak, S.; Atay, E.; Tuncer, G. Renewable Hydrogen Energy and Energy Efficiency in Turkey in the 21st Century. Int. J. Hydrogen Energy 2017, 42, 2446–2452. [Google Scholar] [CrossRef]
  53. Le, S.T.; Nguyen, T.N.; Linforth, S.; Ngo, T.D. Safety Investigation of Hydrogen Energy Storage Systems Using Quantitative Risk Assessment. Int. J. Hydrogen Energy 2023, 48, 2861–2875. [Google Scholar] [CrossRef]
  54. Wei, D.; Wei, P.; Li, D.; Ying, Z.; Hao, X.; Xue, Z. Intelligent Damping Control of Renewable Energy/hydrogen Energy DC Interconnection System. Energy Rep. 2022, 8, 972–982. [Google Scholar] [CrossRef]
  55. Kumar, M.S.C.; Singh, S.; Gupta, M.K.; Nimdeo, Y.M.; Raushan, R.; Deorankar, A.V.; Kumar, T.M.A.; Chanotiya, C.S.; Pakhale, V.D.; Nannaware, A.D. Solar Energy: A Promising Renewable Source for Meeting Energy Demand in Indian Agriculture Applications. Sustain. Energy Technol. Assess. 2023, 55, 102905. [Google Scholar] [CrossRef]
  56. Behar, O.; Pena, R.; Kouro, S.; Kracht, W.; Fuentealba, E.; Moran, L.; Sbarbaro, D. The Use of Solar Energy in the Copper Mining Processes: A Comprehensive Review. Chem. Eng. Technol. 2021, 4, 100259. [Google Scholar] [CrossRef]
  57. Xu, B.; Xu, J.; Chen, Z. Heat Transfer Study in Solar Collector with Energy Storage. Int. J. Heat Mass Transf. 2020, 156, 119778. [Google Scholar] [CrossRef]
  58. Lobaccaro, G.; Croce, S.; Lindkvist, C.; Probst, M.C.M.; Scognamiglio, A.; Dahlberg, J.; Lundgren, M.; Wallg, M. A Cross-country Perspective on Solar Energy in Urban Planning: Lessons Learned from International Case Studies. Renew. Sustain. Energy Rev. 2019, 108, 209–237. [Google Scholar] [CrossRef]
  59. Kong, Z.; Li, L.; Wu, J.; Wang, T.; Rong, C.; Luo, Z.; Pan, Y.; Li, D.; Li, Y.; Huang, Y.; et al. Evaluation of Bio-energy Recovery from the Anaerobic Treatment of Municipal Wastewater by a Pilot-scale Submerged Anaerobic Membrane Bioreactor (AnMBR) at Ambient Temperature. Bioresour. Technol. 2021, 339, 125551. [Google Scholar] [CrossRef] [PubMed]
  60. Kong, Z.; Xue, Y.; Hao, T.; Zhang, Y.; Wu, J.; Chen, H.; Song, L.; Rong, C.; Li, D.; Pan, Y.; et al. Carbon-neutral Treatment of N, N-dimethylformamide-containing Industrial Wastewater by Anaerobic Membrane Bioreactor (AnMBR): Bio-energy Recovery and CO2 Emission Reduction. Bioresour. Technol. 2022, 358, 127396. [Google Scholar] [CrossRef]
  61. Afzal, A.; Buradi, A.; Jilte, R.; Shaik, S.; Kaladgi, A.R.; Arıcı, M.; Lee, C.T.; Nizetic, S. Optimizing the Thermal Performance of Solar Energy Devices Using Meta-heuristic Algorithms: A Critical Review. Renew. Sustain. Energy Rev. 2023, 173, 112903. [Google Scholar] [CrossRef]
  62. Masera, K.; Tannous, H.; Stojceska, V.; Tassou, S. An Investigation of the Recent Advances of the Integration of Solar Thermal Energy Systems to the Dairy Processes. Renew. Sustain. Energy Rev. 2023, 172, 113028. [Google Scholar] [CrossRef]
  63. Xiao, X.; Wang, M.; Cao, G. Solar Energy Harvesting and Wireless Charging based Temperature Monitoring System for Food Storage. Sens. Int. 2023, 4, 100208. [Google Scholar] [CrossRef]
  64. Gao, Y.; Ma, S.; Wang, T.; Wang, T.; Gong, Y.; Peng, F.; Tsunekawa, A. Assessing the Wind Energy Potential of China in Considering its Variability/Intermittency. Energy Convers. Manag. 2020, 226, 113580. [Google Scholar] [CrossRef]
  65. Bahar, F.A.; Ritschel, U.; Akari, P.; Abdeljelil, I.; Amairi, M. Wind Energy Deployment in Tunisia: Status, Drivers, Barriers and Research Gaps—A Comprehensive Review. Energy Rep. 2021, 7, 7374–7389. [Google Scholar] [CrossRef]
  66. Govindan, K. Pathways to Low Carbon Energy Transition Through Multi Criteria Assessment of Offshore Wind Energy Barriers. Technol. Forecast. Soc. Change 2023, 187, 122131. [Google Scholar] [CrossRef]
  67. Kong, Z.; Hao, T.; Chen, H.; Xue, Y.; Li, D.; Pan, Y.; Li, Y.; Li, Y.Y.; Huang, Y. Anaerobic Membrane Bioreactor for Carbon-neutral Treatment of Industrial Wastewater Containing N, N-dimethylformamide: Evaluation of Electricity, Bio-energy Production and Carbon Emission. Environ. Res. 2023, 216, 114615. [Google Scholar] [CrossRef]
  68. Jain, S.; Tembhurkar, A.R. Sustainable Amelioration of Fly Ash Dumps Linking Bio-energy Plantation, Bioremediation and Amendments: A Review. J. Environ. Manag. 2022, 314, 115124. [Google Scholar] [CrossRef] [PubMed]
  69. Zou, L.; Wan, Y.; Zhang, S.; Luo, J.; Li, Y.Y.; Liu, J. Valorization of Food Waste to Multiple Bio-energies Based on Enzymatic Pretreatment: A Critical Review and Blueprint for the Future. J. Clean. Prod. 2020, 277, 124091. [Google Scholar] [CrossRef]
  70. Li, Q.; Liu, Y.; Guo, S.; Haoshen Zhou, H. Solar Energy Storage in the Rechargeable Batteries. Nano Today 2017, 16, 46–60. [Google Scholar] [CrossRef]
  71. Chang, C.C.W.; Ding, T.J.; Ping, T.J.; Ariannejad, M.; Chao, K.C.; Samdin, S.B. Fault Detection and Anti-icing Technologies in Wind Energy Conversion Systems: A Review. Energy Rep. 2022, 8, 28–33. [Google Scholar] [CrossRef]
  72. U.S. Department of Energy. Energy Efficiency & Renewable Energy. Available online: https://www1.eere.energy.gov/solar/pdfs/solar_timeline.pdf (accessed on 13 December 2022).
  73. SolarPower Energy. 2022: The Year of Terawatt Solar Global Installed Solar Capacity Expected to Hit Terawatt Mark in Early 2022. January 2022. Available online: https://www.solarpowereurope.org/news/2022-the-year-of-terawatt-solar (accessed on 13 December 2022).
  74. SolarPower Energy. Global Market Outlook For Solar Power 2022-2026. Available online: https://www.solarpowereurope.org/insights/market-outlooks/global-market-outlook-for-solar-power-2022 (accessed on 13 December 2022).
  75. Abdelrazik, M.K.; Abdelaziz, S.E.; Hassan, M.F.; Hatem, T.M. Climate action: Prospects of Solar Energy in Africa. Energy Rep. 2022, 8, 11363–11377. [Google Scholar] [CrossRef]
  76. Hao, X.; Shan, S.; Gao, N.; Chen, G.; Wang, Q.; Gu, T. Performance Analysis of a Novel Combined Cooling, Heating and Power System with Solar Energy Spectral Beam Splitting. Energy Conver. Manag. 2023, 276, 116500. [Google Scholar] [CrossRef]
  77. Shi, X.; Wang, F.; Lougou, B.G.; Zhang, H.; Wei, X.; Li, D.; Xu, J. Experimental and Numerical Study Regarding the Biomimetic Bone Porous Structure to Match Energy and Mass Flow in a Solar Thermochemical Reactor. J. Energy Storage 2022, 55, 105645. [Google Scholar] [CrossRef]
  78. Mannepalli, K.; Vinoth, K.; Mohapatra, S.K.; Rahul, R.; Gangodkar, D.P.; Madduri, A.; Ravichandran, M.; Sathyamurthy, R.; Mohanavel, V. Allocation of Optimal Energy From Storage Systems Using Solar Energy. Energy Rep. 2022, 8, 836–846. [Google Scholar] [CrossRef]
  79. Lei, L.; Liu, X.; Wang, H.; Zou, Y.; Xu, Y.; Xu, M. Performance Analysis of a Novel Mode using Solar Energy to Recycle and Reuse Water Vapor from Flue Gas of Coal-Fired Power Station. Energy Conver. Manag. 2023, 276, 116537s. [Google Scholar] [CrossRef]
  80. Balachandran, S.; Swaminathan, J. Advances in Indoor Cooking Using Solar Energy with Phase Change Material Storage Systems. J. Energies 2022, 15, 8775. [Google Scholar] [CrossRef]
  81. Abdullah-Al-Mahbub, M.; Islam, A.R.M.T.; Almohamad, H.; Dughairi, A.A.A.; Al-Mutiry, M.; Abdo, H.G. Different Forms of Solar Energy Progress: The Fast-Growing Eco-Friendly Energy Source in Bangladesh for a Sustainable Future. J. Energies 2022, 15, 6790. [Google Scholar] [CrossRef]
  82. Wikipedia. Solar Power in China. Available online: https://en.wikipedia.org/wiki/Solar_power_in_China (accessed on 14 December 2022).
  83. Wikipedia. Renewable Energy. Available online: https://en.wikipedia.org/wiki/Renewable_energy (accessed on 7 December 2022).
  84. Solar Feeds. Top 10 Country Uses the Most Solar Energy. February 2022. Available online: https://www.solarfeeds.com/mag/top-10-country-uses-the-most-solar-energy/ (accessed on 14 December 2022).
  85. World Economic Forum. Energy Transition. 5 Unexpected Places in the World for Solar Power Generation. May 2022. Available online: https://www.weforum.org/agenda/2022/05/solar-power-energy-unusual-sites/ (accessed on 14 December 2022).
  86. U.S. Energy Information Administration (EIA). Wind Explained History of Wind Power. March 2022. Available online: https://www.eia.gov/energyexplained/wind/history-of-wind-power.php#:∼:text=American%20colonists%20used%20windmills%20to,turbines)%20were%20also%20widely%20used (accessed on 14 December 2022).
  87. Renewable Energy World. History of Wind Turbines. November 2014. Available online: https://www.renewableenergyworld.com/storage/history-of-wind-turbines/#gref (accessed on 14 December 2022).
  88. American Clean Power. Land-Based Wind Siting. Available online: https://cleanpower.org/policy/land-based-wind-siting/ (accessed on 15 December 2022).
  89. Frantál, B.; Frolova, M.; Liñán-Chacón, J. Conceptualizing the Patterns of Land use Conflicts in Wind Energy Development: Towards a Typology and Implications for Practice. J. Energy Res. Soc. Sci. 2023, 95, 102907. [Google Scholar] [CrossRef]
  90. Lee, M.K.; Nam, J.; Kim, M. Valuing the Public Preference for Offshore Wind Energy: The Case Study in South Korea. J. Energy 2023, 263, 125827. [Google Scholar] [CrossRef]
  91. Younis, A.; Dong, Z.; Badway, M.E.; Khatib, F.A.; Anazi, A.A. Development of Low-Speed Wind Energy Harvesting Device. J. Energy Rep. 2022, 8, 22–27. [Google Scholar] [CrossRef]
  92. Zhu, J.; Hu, W.; Xu, X.; Liu, H.; Pan, L.; Fan, H.; Zhang, Z.; Chen, Z. Optimal Scheduling of a Wind Energy Dominated Distribution Network via a Deep Reinforcement Learning Approach. J. Renew. Energy 2022, 201, 792–801. [Google Scholar] [CrossRef]
  93. Mordor Intelligence. Sweden Wind Energy Market - Growth, Trends, COVID-19 Impact, and Forecasts (20223 - 2028). Available online: https://www.mordorintelligence.com/industry-reports/sweden-wind-energy-market (accessed on 13 December 2022).
  94. Sweden Sverige. Swedes Use a Lot of Energy – Yet, Emissions are Low. The key? Renewable Energy. Available online: https://sweden.se/climate/sustainability/energy-use-in-sweden (accessed on 13 December 2022).
  95. Travel Tomorrow. What Are the Countries Leading the Wind Energy Transition? October 2022. Available online: https://traveltomorrow.com/what-are-the-countries-leading-the-wind-energy-transition/ (accessed on 15 December 2022).
  96. Banerjee, S.; Singh, R.; Singh, V. Bioenergy Crops as Alternative Feedstocks for Recovery of Anthocyanins: A Review. Environ. Tech. Innov. 2023, 29, 102977. [Google Scholar] [CrossRef]
  97. Aron, N.S.M.; Khoo, K.S.; Chew, K.W.; Show, P.L.; Chen, W.H.; Nguyen, T.H.P. Sustainability of the Four Generations of Biofuels – A Review. Int. J. Energy Res. 2020, 44, 9266–9282. [Google Scholar] [CrossRef]
  98. Papilo, P.; Marimin, M.; Hambali, E.; Machfud, M.; Yani, M.; Asrol, M.; Evanila, E.; Prasetya, H.; Mahmud, J. Palm Oil-Based Bioenergy Sustainability and Policy in Indonesia and Malaysia: A Systematic Review and Future Agendas. Heliyon 2022, 8, e10919. [Google Scholar] [CrossRef] [PubMed]
  99. Liu, X.; Liu, M.; Huang, Y.; Meo, M.S. Analysis of Asymmetries in the Nexus Between Bioenergy and Ecological Footprint: Evidence from European Eeconomies. Biomass Bioenergy 2023, 167, 106605. [Google Scholar] [CrossRef]
  100. Wang, G.; Liao, Q.; Zhang, H.; Liang, Y. How Government Policies Promote Bioenergy’s Permeability in National-Level Energy Supply Chain: A Case of China. Appl. Energy 2022, 324, 119750. [Google Scholar] [CrossRef]
  101. Vu, D.K.N.; Thi, Y.N.N.; Tran, L.Q. Potential Biofuel Exploitation from Two Common Vietnamese Euphorbia Plants (Euphorbiaceae). Biofuels Bioprod. Biorefin. 2023. [Google Scholar] [CrossRef]
  102. Sathre, R.; Gustavsson, L. Lifecycle Climate Impact and Primary Energy Use of Electric and Biofuel Cargo Trucks. GCB Bioenergy 2023, 1–24. [Google Scholar] [CrossRef]
  103. Bhuniya, S.; S Pareek, S.; Sarkar, B. A Sustainable Game Strategic Supply Chain Model with Multi-factor Dependent Demand and Mark-up Under Revenue Sharing Contract. Comp. Intell. Syst. 2023. [Google Scholar] [CrossRef]
  104. Singh, S.K.; Chauhan, A.; Sarkar, B. Supply Chain Management of E-Waste for End-of-Life Electronic Products with Reverse Logistics. Mathematics 2023, 11, 124. [Google Scholar] [CrossRef]
  105. Mridha, B.; Ramana, G.V.; Pareek, S.; Sarkar, B. An Efficient Sustainable Smart Approach to Biofuel Production with Emphasizing the Environmental and Energy Aspects. Fuel 2023, 336, 126896. [Google Scholar] [CrossRef]
  106. Mridha, B.; Goswami, A.; Pareek, S.; Sarkar, B. Joint Effects of Production Quality Improvement of Biofuel and Carbon Emissions Towards a Smart Sustainable Supply Chain Management. J. Clean. Prod. 2023, 386, 135629. [Google Scholar] [CrossRef]
  107. Singh, S.K.; Chauhan, A.; Sarkar, B. Sustainable Biodiesel Supply Chain Model Based on Waste Animal Fat with Subsidy and Advertisement. J. Clean. Prod. 2023, 382, 134806. [Google Scholar] [CrossRef]
  108. IEA. Bioenergy. Available online: https://www.iea.org/reports/bioenergy (accessed on 15 December 2022).
  109. Meirinhos, G.; Malebo, M.; Cardoso, A.; Silva, R.; Rêgo, R. Information and Public Knowledge of the Potential of Alternative Energies. Energies 2022, 15, 4928. [Google Scholar] [CrossRef]
  110. Yin, X.; Pan, L.; Lei, M. Maximizing Tidal Energy Conversion by Adopting Hydraulic Transformation and LMI Based Robust Control. Renew. Energy 2022, 195, 331–343. [Google Scholar] [CrossRef]
  111. Hočevar, M.; Novak, L.; Drešar, P.; Rak, G. The Status Quo and Future of Hydropower in Slovenia. Energies 2022, 15, 6977. [Google Scholar] [CrossRef]
  112. Caricimi, R.; Dranka, G.G.; Setti, D.; Ferreira, P. Reframing the Selection of Hydraulic Turbines Integrating Analytical Hierarchy Process (AHP) and Fuzzy VIKOR Multi-Criteria Methods. Energies 2022, 15, 7383. [Google Scholar] [CrossRef]
  113. Bütüner, M.A.; Koşalay, İ.; Gezer, D. Machine-Learning-Based Modeling of a Hydraulic Speed Governor for Anomaly Detection in Hydropower Plants. Energies 2022, 15, 7974. [Google Scholar] [CrossRef]
  114. Chi, F.; Pan, J.; Liu, Y.; Guo, Y. Improvement of Thermal Comfort by Hydraulic-Driven Ventilation Device and Space Partition Arrangement Towards Building Energy Saving. Appl. Energy 2021, 299, 117292. [Google Scholar] [CrossRef]
  115. Iyer, K.R.; Roozbahani, H.; Alizadeh, M.; Handroos, H. A Novel Approach for Direct Conversion of Wind Energy to Heat Utilizing a Hydraulic Medium for Domestic Heating Applications. Energy Rep. 2022, 8, 11139–11150. [Google Scholar] [CrossRef]
  116. Office of Energy Efficiency and Renewable Energy. Waste-to-Energy. Available online: https://www.energy.gov/eere/bioenergy/waste-energy (accessed on 22 December 2022).
  117. Bancook & Wilcox. Waste to Energy Overview: Ecologically Sound, Cost-Effective Energy. Available online: https://www.babcock.com/home/renewable/waste-to-energy/waste-to-energy-technology (accessed on 22 December 2022).
  118. Caferra, R.; D’Adamo, I.; Morone, P. Wasting Energy or Energizing Waste? The Public Acceptance of Waste-to-Energy Technology. Energy 2023, 263, 126123. [Google Scholar] [CrossRef]
  119. Yadav, D.; Singh, R.; Kumar, A.; Sarkar, B. Reduction of Pollution Through Sustainable and Flexible Production by Controlling By-Products. J. Environ. Inform. 2022, 40, 106–124. [Google Scholar] [CrossRef]
  120. Yatim, F.E.; Boumanchar, I.; Srhir, B.; Chhiti, Y.; Jama, C.; Alaoui, F.E.M. Waste-to-Energy as a Tool of Circular Economy: Prediction of Higher Heating Value of Biomass by Artificial Neural Network (ANN) and Multivariate Linear Regression (MLR). Waste Manag. 2022, 153, 293–303. [Google Scholar] [CrossRef]
  121. Silva, M.G.; Przybysz, A.L.; Piekarski, C.M. Location as a Key Factor for Waste to Energy Plants. J. Clean. Prod. 2022, 379, 134386. [Google Scholar] [CrossRef]
  122. Blue Ocean. Turning Waste to Energy: Sweden’s Recycling Revolution. Available online: https://www.blueoceanstrategy.com/blog/turning-waste-energy-sweden-recycling-revolution/#:\$\sim$:text=Only%201%25%20of%20Sweden’s%20trash,homes%20and%20electricity%20to%20250%2C000 (accessed on 2 February 2023).
  123. Irsyad, M.I.; Halog, A.B.; Nepal, R.; Koesrindartoto, D. Selecting Tools for Renewable Energy Analysis in Developing Countries: An Expanded Review. Front. Energy Res. 2017, 5, 34. [Google Scholar] [CrossRef] [Green Version]
  124. Kim, J.; Suharto, Y.; Daim, T.U. Evaluation of Electrical Energy Storage (EES) technologies for renewable energy: A case from the US Pacific Northwest. J. Energy Storage 2017, 11, 25–54. [Google Scholar] [CrossRef]
  125. Wang, J.J.; Jing, Y.Y.; Zhang, C.F.; Zhao, J.H. Review on Multi-Criteria Decision Analysis Aid in Sustainable Energy Decision-Making. Renew. Sustan. Energy Rev. 2009, 13, 2263–2278. [Google Scholar] [CrossRef]
  126. Pan, X.; Wang, Y. Evaluation of Renewable Energy Sources in China Using an Interval Type-2 Fuzzy Large-Scale Group Risk Evaluation Method. Appl. Soft Comput. 2021, 108, 107458. [Google Scholar] [CrossRef]
  127. Bhowmik, C.; Bhowmik, S.; Ray, A.; Pandey, K.M. Optimal Green Energy Planning for Sustainable Development: A Review. Renew. Sustan. Energy Rev. 2017, 71, 796–813. [Google Scholar] [CrossRef]
  128. Mardani, A.; Jusoh, A.; Zavadskas, E.K.; Cavallaro, F.; Khalifah, Z. Sustainable and Renewable Energy: An Overview of the Application of Multiple Criteria Decision Making Techniques and Approaches. Sustainability 2015, 7, 13947–13984. [Google Scholar] [CrossRef] [Green Version]
  129. Kumar, A.; Sah, B.; Singh, A.R.; Deng, Y.; He, X.; Kumar, P.; Bansal, R.C. A Review of Multi Criteria Decision Making (MCDM) Towards Sustainable Renewable Energy Development. Renew. Sustan. Energy Rev. 2017, 69, 596–609. [Google Scholar] [CrossRef]
  130. Troldborg, M.; Heslop, S.; Hough, R.L. Assessing the Sustainability of Renewable Energy Technologies Using Multi-Criteria Analysis: Suitability of Approach for National-Scale Assessments and Associated Uncertainties. Renew. Sustain. Energy Rev. 2014, 39, 1173–1184. [Google Scholar] [CrossRef]
  131. Ilbahar, E.; Cebi, S.; Kahraman, C. A state-of-the-Art Review on Multi-Attribute Renewable Energy Decision Making. Energy Strategy Rev. 2019, 25, 18–33. [Google Scholar] [CrossRef]
  132. Arce, M.E.; Saavedra, Á.; Míguez, J.L.; Granada, E. The Use of Grey-Based Methods in Multi-Criteria Decision Analysis for the Evaluation of Sustainable Energy Systems: A Review. Renew. Sustain. Energy Rev. 2015, 47, 924–932. [Google Scholar] [CrossRef]
  133. Terrados, J.; Almonacid, G.; Pérez-higueras, P. Proposal for a Combined Methodology for Renewable Energy Planning. Application to a Spanish Region. Renew. Sustain. Energy Rev. 2009, 13, 2022–2030. [Google Scholar] [CrossRef]
  134. Strantzali, E.; Aravossis, K. Decision Making in Renewable Energy Investments: A Review. Renew. Sustain. Energy Rev. 2015, 55, 885–898. [Google Scholar] [CrossRef]
  135. Wu, D.; Mendel, J.M.; Coupland, S. Enhanced Interval Approach for Encoding Words into Interval Type-2 Fuzzy Sets and its Convergence Analysis. IEEE Trans. Fuzzy Syst. 2012, 20, 499–513. [Google Scholar]
  136. Dincer, H.; Yuksel, S. Balanced Scorecard-Based Analysis of Investment Decisions for the Renewable Energy Alternatives: A Comparative Analysis Based on the Hybrid Fuzzy Decision-Making Approach. Energy 2019, 175, 1259–1270. [Google Scholar] [CrossRef]
  137. Ezbakhe, F.; Perez-Foguet, A. Decision Analysis for Sustainable Development: The Case of Renewable Energy Planning under Uncertainty. Eur. J. Oper. Res. 2021, 291, 601–613. [Google Scholar] [CrossRef]
  138. Wu, Y.; Xu, C.; Zhang, T. Evaluation of Renewable Power Sources Using a Fuzzy MCDM Based on Cumulative Prospect Theory: A Case in China. Energy 2018, 147, 1227–1239. [Google Scholar] [CrossRef]
  139. Bortoluzzi, M.; Correia de Souza, C.; Furlan, M. Bibliometric Analysis of Renewable Energy Types Using Key Performance Indicators and Multicriteria Decision Models. Renew. Sustain. Energy Rev. 2021, 143, 110958. [Google Scholar] [CrossRef]
  140. Climate Council. 11 Countries Leading the Charge on Renewable Energy. August 2022. Available online: https://www.climatecouncil.org.au/11-countries-leading-the-charge-on-renewable-energy/ (accessed on 13 December 2022).
  141. Bnamericas. Costa Rica Reaches 98.58% of Renewable Electricity Generation in the First Half. July 2021. Available online: https://www.bnamericas.com/en/news/costa-rica-reaches-9858-of-renewable-electricity-generation-in-the-first-half#:$\sim$:text=Costa%20Rica%20added%2098.58%25%20of,of%20diversified%20and%20complementary%20resources (accessed on 13 December 2022).
  142. Scottish Renewables. New Figures Show Over 18,000 Gwh of Renewable Electricity Generated in the First Half of 2022. October 2022. Available online: https://www.scottishrenewables.com/news/1170-new-figures-show-over-18000-gwh-of-renewable-electricity-generated-in-the-first-half-of-2022#:$\sim$:text=The%20Scottish%20Government%20today%20(October,the%20\same%20period%20in%202021 (accessed on 13 December 2022).
  143. Green by Iceland. E-World 2022: Energy and Water. Available online: https://www.greenbyiceland.com/e-world-2022/ (accessed on 13 December 2022).
  144. Clean Energy Wire. Germany Sets Renewable Power Record in 2022, But Is Off-Track for 2030 Target. December 2022. Available online: https://www.cleanenergywire.org/news/germany-sets-renewable-power-record-2022-track-2030-target (accessed on 13 December 2022).
  145. International Trade Administration. Department of Commerce. U.S.A. Renewable Energy Equipment. September 2022. Available online: https://www.trade.gov/country-commercial-guides/uruguay-renewable-energy-equipment (accessed on 13 December 2022).
  146. World Economic Forum. Energy Transition. These 4 Charts Show the State of Renewable Energy in 2022. June 2022. Available online: https://www.weforum.org/agenda/2022/06/state-of-renewable-energy-2022/ (accessed on 7 December 2022).
  147. Chen, Y.; Zhao, C. Review of Energy Sharing: Business Models, Mechanisms, and Prospects. IET Renew. Power Gener. 2022, 16, 2468–2480. [Google Scholar] [CrossRef]
  148. Chen, J.; Li, L.; Cui, Y.; Shen, F.; Qiu, M.; Wei, T. Utility-Driven Renewable Energy Sharing Systems for Community Microgrid. J. Syst. Arch. 2022, 126, 102492. [Google Scholar] [CrossRef]
  149. National History Museum. Available online: https://www.nhm.ac.uk/discover/news/2022/september/net-zero-cheaper-and-greener-than-continuing-use-fossil-fuels.html (accessed on 7 December 2022).
  150. International Energy Agency. Renewable Energy Market Update 2022: Outlook for 2022 and 2023. May 2022. Available online: https://www.iea.org/reports/renewable-energy-market-update-may-2022 (accessed on 7 December 2022).
  151. REN21. Renewables 2022 Global Status Report. Available online: https://www.ren21.net/gsr-2022/ (accessed on 7 December 2022).
  152. Our World in Data. Renewable Energy. 2022. Available online: https://ourworldindata.org/energy (accessed on 7 December 2022).
  153. United Nations. Available online: https://news.un.org/en/story/2022/09/1127351 (accessed on 22 December 2022).
  154. Moon, I.; Yun, W.Y.; Sarkar, B. Effects of Variable Setup Cost, Reliability, and Production Costs Under Controlled Carbon Emissions in a Reliable Production System. Eur. J. Ind. Eng. 2022, 16, 371–397. [Google Scholar] [CrossRef]
  155. Kar, S.; K Basu, K.; Sarkar, B. Advertisement Policy for Dual-Channel Within Emissions-Controlled Flexible Production System. J. Retail. Consum. Serv. 2023, 71, 103077. [Google Scholar] [CrossRef]
  156. Mukherjee, T.; Sangal, I.; Sarkar, B.; Alkadash, T.M. Mathematical Estimation for Maximum Flow of Goods within a Cross-dock to Reduce Inventory. Math. Biosci. Eng. 2022, 19, 13710–13731. [Google Scholar] [CrossRef] [PubMed]
  157. Mondal, A.K.; Pareek, S.; Chaudhuri, K.; Bera, A.; Bachar, R.K.; Sarkar, B. Technology license sharing strategy for remanufacturing industries under a closed-loop supply chain management bonding. RAIRO-Operat. Res. 2022, 56, 3017–3045. [Google Scholar] [CrossRef]
  158. Mishra, U.; Wu, J.Z.; Sarkar, B. Optimum Sustainable Inventory Management with Backorder and Deterioration under Controllable Carbon Emissions. J. Clean. Prod. 2021, 279, 123699. [Google Scholar] [CrossRef]
  159. Bachar, R.K.; Bhuniya, S.; Ghosh, S.K.; Sarkar, B. Controllable Energy Consumption in a Sustainable Smart Manufacturing Model Considering Superior Service, Flexible Demand, and Partial Outsourcing. Mathematics 2022, 10, 4517. [Google Scholar] [CrossRef]
  160. Yadav, D.; Chand, U.; Goel, R.; Sarkar, B. Smart Production System with Random Imperfect Process, Partial Backordering, and Deterioration in an Inflationary Environment. Mathematics 2023, 11, 440. [Google Scholar] [CrossRef]
  161. Sarkar, B.; Dey, B.K.; Sarkar, M.; Kim, S.J. A smart production system with an autonomation technology and dual channel retailing. Comput. Ind. Eng. 2022, 173, 108607. [Google Scholar] [CrossRef]
  162. Padiyar, S.V.S.; Vandana, V.; Bhagat, N.; Singh, S.R.; Sarkar, B. Joint Replenishment Strategy for Deteriorating Multi-item Through Multi-echelon Supply Chain Model with Imperfect Production Under Imprecise and Inflationary Environment. RAIRO Oper. Res. 2022, 26, 3071–3096. [Google Scholar] [CrossRef]
  163. Oryani, B.; Moridian, A.; Sarkar, B.; Rezania, S.; Kamyab, H.; Khan, M.K. Assessing the Financial Resource Curse Hypothesis in Iran: The Novel Dynamic ARDL Approach. Resour. Pol. 2022, 78, 102899. [Google Scholar] [CrossRef]
  164. Sarkar, B.; Takeyeva, D.; Guchhait, R.; Sarkar, M. Optimized Radio-Frequency Identification System for Different Warehouse Shapes. Knowl. Based Syst. 2022, 258, 109811. [Google Scholar] [CrossRef]
  165. Guchhait, R.; Pareek, S.; Sarkar, B. How Does a Radio Frequency Identification Optimize the Profit in an Unreliable Supply Chain Management? Mathematics 2019, 7, 490. [Google Scholar] [CrossRef] [Green Version]
  166. Sarkar, B.; Ganguly, B.; Pareek, S.; Cárdenas-Barrón, L.E. A Three-echelon Green Supply Chain Management for Biodegradable Products with Three Transportation Modes. Comp. Indust. Eng. 2022, 174, 108727. [Google Scholar] [CrossRef]
  167. Sepehri, A.; Mishra, U.; Sarkar, B. A Sustainable Production-Inventory Model with Imperfect Quality under Preservation Technology and Quality Improvement Investment. J. Clean. Prod. 2021, 310, 127332. [Google Scholar] [CrossRef]
  168. Ullah, M.; Sarkar, B. Recovery-Channel Selection in a Hybrid Manufacturing-Remanufacturing Production Model with RFID and Product Quality. Int. J. Prod. Econ. 2020, 219, 360–374. [Google Scholar] [CrossRef]
  169. Voa News. Energy Agency: CO2 Emissions Rise in 2022, But More Slowly. October 2022. Available online: https://www.voanews.com/a/energy-agency-co2-emissions-rise-in-2022-but-more-slowly/6796703.html (accessed on 13 December 2022).
  170. Nature. Carbon Emissions Hit New High: Warning from COP27. November 2022. Available online: https://www.nature.com/articles/d41586-022-03657-w (accessed on 13 December 2022).
  171. Investopedia. Per Capita: What It Means, How It’s Determined, Uses, and Examples. September 2022. Available online: https://www.investopedia.com/terms/p/percapita.asp (accessed on 13 December 2022).
  172. The Guardian. Carbon Emissions from Fossil Fuels Will Hit Record High in 2022. November 2022. Available online: https://www.theguardian.com/environment/2022/nov/10/carbon-emissions-from-fossil-fuels-will-hit-record-high-in-2022-climate-crisis (accessed on 13 December 2022).
  173. Climate Champions. Power Sector Emissions Are Set to Fall in 2022. Thanks to Renewable Energy. September 2022. Available online: https://climatechampions.unfccc.int/power-sector-emissions-are-set-to-fall-in-2022-thanks-to-renewable-energy/ (accessed on 12 December 2022).
  174. International Renewable Energy Agency. Renewable Energy Statistics 2022. July 2022. Available online: https://www.irena.org/publications/2022/Jul/Renewable-Energy-Statistics-2022; https://www.irena.org/News/pressreleases/2022/Nov/New-Report-Warns-World-of-Huge-Untapped-Renewable-Energy-Potential (accessed on 7 December 2022).
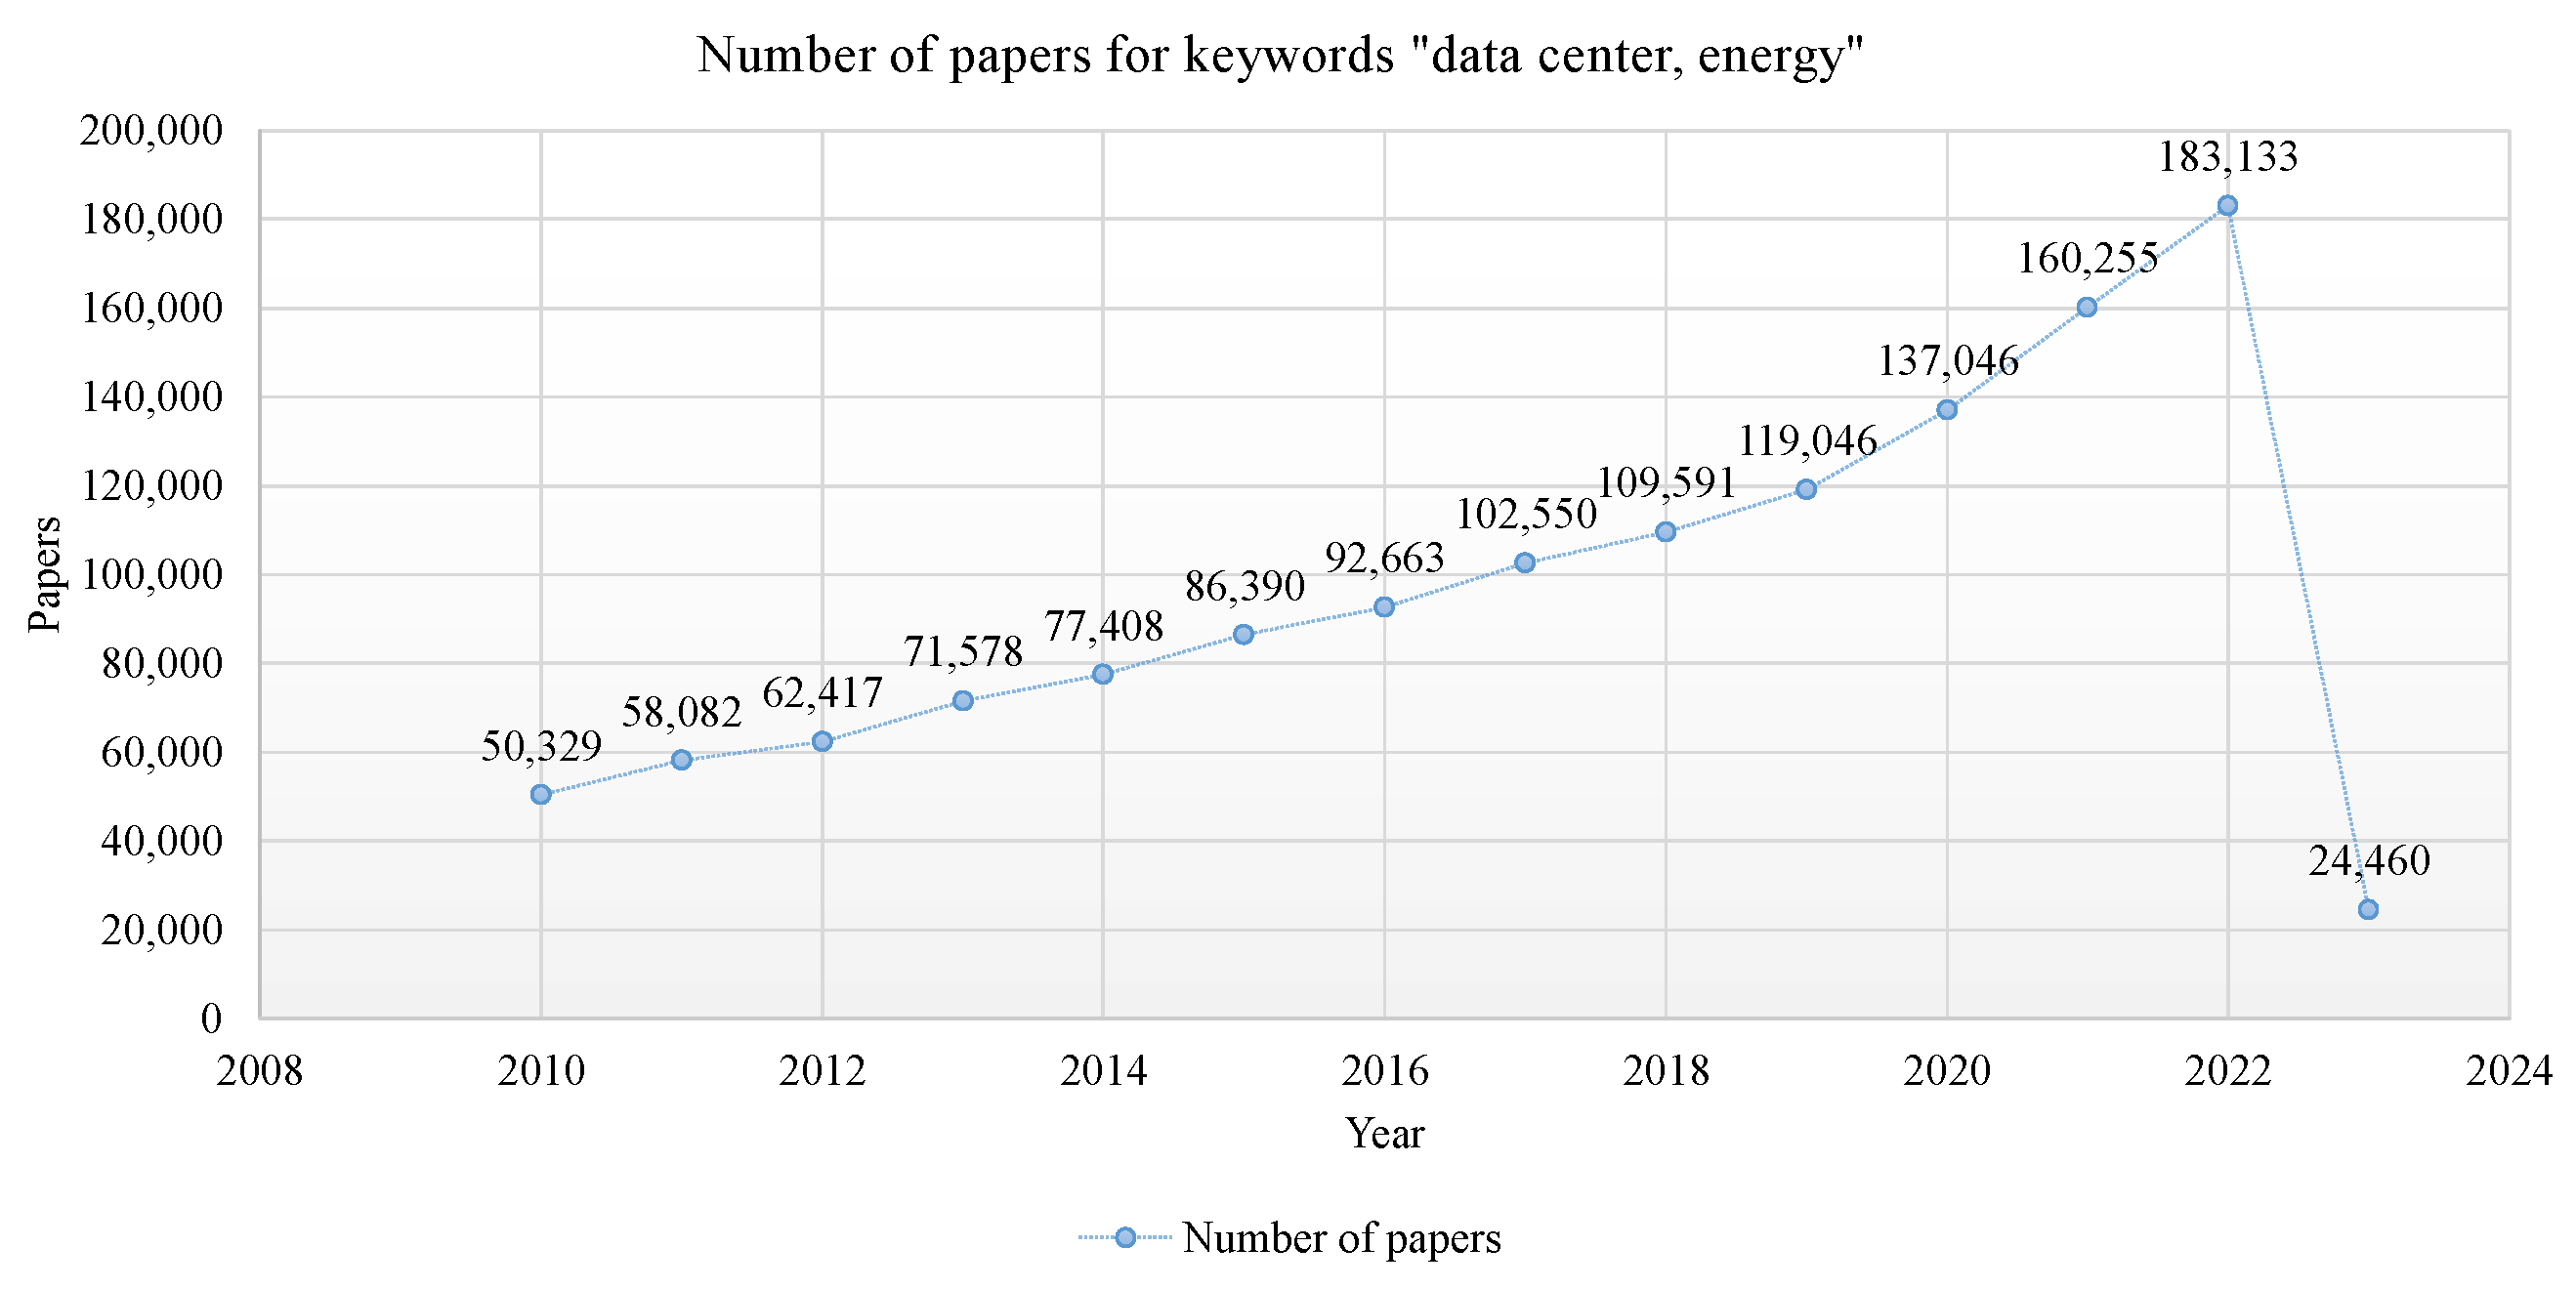
Figure 1. Research trend in energy demand for data centers (sciencedirect.com on 19 December 2022 at 2.30 p.m. KST).
Energies 16 02665 g001
Figure 2. Comparison of the number of papers between 2022 and 2010∼>2022 (sciencedirect.com on 19 December 2022 at 2.30 pm KST); (a) energy articles, (b) review articles, and (c) review versus energy articles in 2022.
Energies 16 02665 g002
Figure 3. Renewable energy and related SDGs.
Energies 16 02665 g003
Figure 4. Energy price goes negative for zero demand of oil in 2020, during COVID-19 pandemic [24].
Energies 16 02665 g004
Figure 5. Number of published papers in the field of solar, wind, bio, hydraulic, waste, and hydrogen energy in 2022; accessed on 12 December 2022, 1.30 p.m. KST.
Energies 16 02665 g005
Figure 6. Development of research in the field of solar energy (2010–2022). The dotted line represents the moving average of the published paper. (>2022 represents continuing 2022).
Energies 16 02665 g006
Figure 7. Research paper publication trends in wind energy (2010–2022). The dotted line represents the moving average of the published paper.
Energies 16 02665 g007
Figure 8. Development of research in bioenergy (2010–2022). The dotted line represents the moving average of the published paper.
Energies 16 02665 g008
Figure 9. Development of research in the field of hydraulic energy (2010–2022). The dotted line represents the moving average of the published paper.
Energies 16 02665 g009
Figure 10. Development of research in waste to energy (2010–2022). The dotted line represents the moving average of the published paper.
Energies 16 02665 g010
Figure 11. Development of research in the field of hydrogen energy (2010–2022). The dotted line represents the moving average of the published paper.
Energies 16 02665 g011
Table 2. Articles used following methodologies frequently for analyzing RE and its corresponding.
ArticlesMethodologies
Irsyad et al. [123]BEM, STA, DSA, LCT
Kim et al. [124]MoOP, MAUT, AHP, HDM, PROMETHEE, ELECTRE, DSS
Wang et al. [125]MCDA
Pan and Wang [126]Decision making, Clustering approach
Bhowmik et al. [127]ZBT, AHP, MCM, GFIP, HOGA, ANN, ANP, GA, DEA,
Game theory approach
Mardani et al. [128]AHP, F-AHP, ANP, VIKOR, TOPSIS, F-TOPSIS, PROMETHEE
Kumar et al. [129]AHP, VIKOR, TOPSIS, PROMETHEE, MAUT, ELECTRE
Troldborg et al. [130]PROMETHEE
Ilbahar et al. [131]MCDA, AHP, Fuzzy
Arce et al. [132]Grey-based MCDA
Terrados et al. [133]Delphi method, SWOT analysis
Strantzali and Aravossis [134]LCA, CBA, MCDA
Wu et al. [135]Data-driven interval approach
Dincer and Yuksel [136]DEMATEL, TOPSIS
Ezbakhe and Perez-Foguet [137]ELECTRE III
Wu et al. [138]CPT
Table 3. Number of papers based on a particular type of methodology (2010 to >2022) (accessed on 15 December 2022).
MethodologyTotal ArticlesArticles in 2022
PROMETHEE601121
ELECTRE1052192
Game theory66391393
AHP3486662
ANN79781927
DEA2004367
MOP31,5385917
DSS65,41111,028
FIP3414657
GA79261618
DEA4804916
MCDA20,1033793
VIKOR1051278
CBA115,98322,062
Disclaimer/Publisher’s Note: The statements, opinions and data contained in all publications are solely those of the individual author(s) and contributor(s) and not of MDPI and/or the editor(s). MDPI and/or the editor(s) disclaim responsibility for any injury to people or property resulting from any ideas, methods, instructions or products referred to in the content.