Article

Comparison of Control Techniques for Harmonic Isolation in Series VSC-Based Power Flow Controller in Distribution Grids

by
Guilherme Gonçalves Pinheiro
1,*,
Robson Bauwelz Gonzatti
1,
Carlos Henrique da Silva
2,
Rondineli Rodrigues Pereira
1,
Bruno P. Braga Guimarães
1,
João Gabriel Luppi Foster
1,
Germano Lambert-Torres
3,
Kleverson Sinezio da Silva
4 and
Joselino Santana-Filho
4
1
Institute of Engineering and Information Technology (IESTI), Federal University of Itajuba, Itajuba 37500-903, MG, Brazil
2
Electric Engineering Department, Federal University of Ouro Preto, Joao Monlevade 35931-008, MG, Brazil
3
Gnarus Institute, Itajuba 37500-052, MG, Brazil
4
Engineering Department, EDP Sao Paulo, Sao Paulo 08820-460, SP, Brazil
*
Author to whom correspondence should be addressed.
Energies 2023, 16(6), 2729; https://doi.org/10.3390/en16062729
Submission received: 10 February 2023 / Revised: 6 March 2023 / Accepted: 12 March 2023 / Published: 15 March 2023
(This article belongs to the Special Issue Smart Energy and Sustainable Environment II)

Abstract

:
The application of power electronics equipment in medium voltage (MV) distribution grids can provide new management solutions for power flow control, load balancing and voltage problems. A series MV VSC-based power flow controller has recently been presented to interconnect two radial distribution feeders performing active and reactive power transfers to improve the flexibility and utilization of these circuits in a controlled and secure way. Although not previously explored, this power flow controller can integrate the functionality of a series power filter, accomplishing independent control of the fundamental power flow while isolating the harmonic content between the two interconnected feeders. This prevents harmonic pollution from one feeder from propagating to the other, improving the voltage quality. To implement the harmonic isolation, several control strategies can be used. Therefore, this paper provides a comparative analysis between two of the main harmonic control techniques found in the literature: the Synchronous Reference Frame (SRF) controller and the Proportional Resonant (PR) controller. Assessments are conducted both through simulations and experimental results in a meshed network at 13.8 kV with different types of non-linear loads. In the simulation cases, both algorithms showed similar results; however, in the experimental cases, the PR-based solution exhibited better performance in isolating the harmonics from one feeder to the other.

1. Introduction

With the increase of power consumption and non-linear loads, power quality issues and contingency management techniques have been a constant challenge for power grid engineers and researchers both for transmission and distribution grids [1,2,3,4,5]. Conventional techniques to mitigate contingencies and perform load balance in power systems include network reconfigurations, new investments in transmission/distribution lines, construction of new substations, etc. These actions target technical loss reduction and increases in distribution capacity and reliability but involve high-cost investments.
Distribution grids are traditionally designed with radial topology for unidirectional power flow. However, nearby distribution feeders sometimes are idle, while others are overloaded. Still, radial feeders cannot operate in a permanent loop to take advantage of an adjacent circuit with a lower load, or even with distributed renewable generation (e.g., PV panels), because this change in configuration increases the short-circuit currents and can cause bidirectional power flow. This would require an update in protection schemes and equipment.
The application of power electronics equipment in distribution grids, known as RACDS (Resilient AC Distribution Systems), can provide new management solutions for smarter power flow, load balancing and voltage problems [5,6,7,8,9]. These devices allow radial distribution grids to be converted into meshed grids in a controlled and secure way [10,11,12]. Among several options, the compensation approach using series converters has been considered a cost-effective solution [8,9,10,11,12,13,14] compared to MV back-to-back converters [15] or Unified Power Flow Controllers (UPFC) [7] due to its reduced power rating, even though it is not equally flexible. For example, to manipulate a 1 pu of active power, a power electronics converter rated at 2 pu is required with a back-to-back converter, while only 0.2 pu of power electronics is needed with a series converter [16].
A series medium voltage VSC-based power flow controller has recently been described, modeled and analyzed both in laboratory and in field application [16], focusing on active and reactive power transfer to improve the flexibility and utilization of meshed distribution feeders. However, a key point, the propagation of harmonics when interconnecting feeders with different voltage distortions, has not been demonstrated.
The harmonic content present in non-linear loads impacts the power quality along the distribution feeders. Traditionally, Series Active Power Filters (SAPFs) are used to compensate for voltage distortions, sags and unbalances (also called DVR—Dynamic Voltage Restorers, when performing the last two functions) [17,18,19], while Parallel Active Power Filters (PAPF) are applied to mitigate current harmonic distortions and power factor compensation.
The use of a series converter to perform harmonic isolation when interconnecting two radial feeders can provide a feature similar to a SAPF [20,21,22]. This can prevent the harmonic content existing in one feeder from propagating to the adjacent feeder when they are connected, indirectly improving the voltage quality. In other words, it keeps the system, from the harmonic point of view, as it was before the interconnection.
The topic addressed here is a current trend and of interest to the scientific community because, in fact, with the increase in the installation of electrical and electronic equipment and power electronics connected to the electrical distribution system, which also come from renewable energies, finding solutions for improving power quality has become a challenge for the power grid.
The fact that a series VSC is able to reproduce a high impedance for harmonic frequencies and a controlled impedance for the fundamental component can be understood in an analogous way to the concept of the Smart Impedance [23,24]. This idea was proposed for Shunt Hybrid Active Filters, in which it is possible to tune multiple frequencies simultaneously, providing zero impedance for each harmonic component and a controlled impedance for the fundamental frequency to control the reactive power [23]. In the series converter presented here, the equipment is tuned to present a high impedance for each harmonic component (to block the harmonics) and a controlled impedance for the fundamental frequency to control active and reactive power flow.
Several control strategies have been used in active power filters for harmonic extraction and current/voltage control [24,25,26,27,28,29,30,31,32]. A well-established harmonic control strategy is based on instantaneous power theory (p-q theory). However, it is known that p-q theory-based harmonic detection algorithms do not perform well under non-sinusoidal supply voltages [24,25], which is the case for the application discussed here.
To improve filtering characteristics, compensation algorithms based on the Discrete Fourier Transform (DFT) were presented in [26,27]. A DFT window of one fundamental cycle is required for harmonic calculation, which introduces delay in the calculations. Furthermore, adequate synchronization of this window with the fundamental frequency component is needed to avoid errors in magnitude or phase of the harmonics. During transients, this synchronization can be lost and the harmonic cancellation will not be accurate. A tradeoff between accurate harmonic estimation and fast transient response is required. Moreover, the computational burden of these algorithms is usually high. In [27], a recursive DFT implementation was used to reduce the processing time.
One of the main techniques used for voltage control in Active Power Filters is based on PI controllers in the Synchronous Reference Frame (SRF) [28,29], due to its inherent immunity to distorted voltage conditions, fast response, and ease of implementation. Another technique that has been used for active filters, and PWM converters in general, is the Proportional Resonant (PR) Controller. This technique is derived from the SRF PI controller with the advantage of being applied directly to the measured signals, reducing the need for transforms [30]. Additionally, it can be used to selectively compensate for particular harmonics only, with a simpler structure compared to the SRF [23,29].
More recently, Model Predictive Control (MPC) has been used in APF applications [31,32] due to the fast transient response inherent to the predictive nature of the control and the possibility to include control restraints and non-linearities in the cost functions. A shortcoming of this strategy is that the predictive controller presents prediction errors when there is a parameters mismatch in the model of the plant [33], thus requiring detailed knowledge of the system. This can be an issue for the presented power flow controller since the distribution grid parameters may not be accurately known and can change due to power grid reconfiguration. Furthermore, in [32], additional adaptive notch filters (ANFs) and PR controllers were required to obtain the correct harmonic current references for the MPC controller in an LC-coupled hybrid filter, increasing the complexity of the control strategy.
Moreover, control strategies based on artificial intelligence algorithms, such as Artificial Neural Networks (ANN), Fuzzy-based systems, etc. [34,35,36,37], or controllers optimized using machine learning techniques [38] have been described in the literature. These strategies have shown equivalent or better results than the traditional control techniques in determined scenarios. However, they are much more complex than the conventional control strategies, require large amount of data for training or demand huge computing power.
Considering the above, this paper provides a comparative analysis between two of the main control techniques for Active Power Filters: SRF and PR-based algorithms, performing harmonic isolation in a series power flow controller when interconnecting two distribution feeders with the presence of non-linear loads. First, the explanation of both algorithms is carried out. Then, a comparison is made through simulations and experimental tests in a 13.8 kV laboratory prototype with different types of non-linear loads. The main contribution of this paper is to verify the usefulness and ease of implementation of these two simple and effective strategies for a series power flow controller, which is different from a conventional SAPF connected between a source and a load. Additionally, the analyses were performed with the objective of selecting a control strategy for real equipment, and they demonstrate some results that could only be observed in practical implementation and not in simulations.

2. Series Compensator Description

The power circuit topology of the series power flow controller used in this work is presented in Figure 1. It was built using a modular design where the three-phase equipment is composed of three independent single-phase structures. Each single-phase module is composed of an IGBT H-bridge Voltage Source Converter (VSC) connected in series with the 13.8 kV distribution line by means of a coupling transformer. A diode rectifier supplies the dc-link voltage for each phase to compensate for converter losses and during start-up. The control system is based on TMS320F28335 DSC (Digital Signal Controller).

3. Fundamental Frequency and Harmonic Control

The complete modelling of the equipment is presented in [16]. The main control loop equations can be derived for the converter interconnecting two feeders at the terminal of two distribution feeders as shown in Figure 2.
In Figure 2 VA and VB represent the power grid HV voltage sources, TA and TB are the substation transformers, ZL1 and ZL2 are the distribution feeder impedances, Z1 and Z2 are the lumped load impedances, LF1 and LF2 are the inductances of the converter switching filter, TS is the coupling transformer and Cdc is the converter dc-link capacitor. V1 and V2 are the feeder voltages at the connection point and VT is the converter output voltage.
The converter control objective is to control the current IT flowing between the two feeders while keeping the minimum terminal voltage difference V1V2. However, this should be carried out only for the fundamental frequency so that the distortion present in one feeder does not pollute the adjacent feeder. To perform this task, the main control loop is separated in two parts: one manipulates the fundamental component of the transferred current and the second performs the blocking of harmonic voltages.
The fundamental frequency control uses cascaded PI controllers in the synchronous reference frame. For the harmonic isolation, two harmonic mitigation techniques will be evaluated and are briefly described in this section.

3.1. Synchronous Reference Frame

The SRF (Synchronous Reference Frame) is a coordinate transformation for a synchronous reference system. With this technique it is possible to obtain both the alternating components that are multiples of the fundamental (i.e., harmonic content) and only the fundamental component of the desired measurement (depending on the type of filter used—i.e., low-pass or high-pass) [28], which allows real-time implementation through digital signal processing.
In this technique, all signals are shifted from 60 Hz, allowing the fundamental components of the system to be transformed into the desired components of the system involved (e.g., the fundamental component or, in this case, the harmonic content).
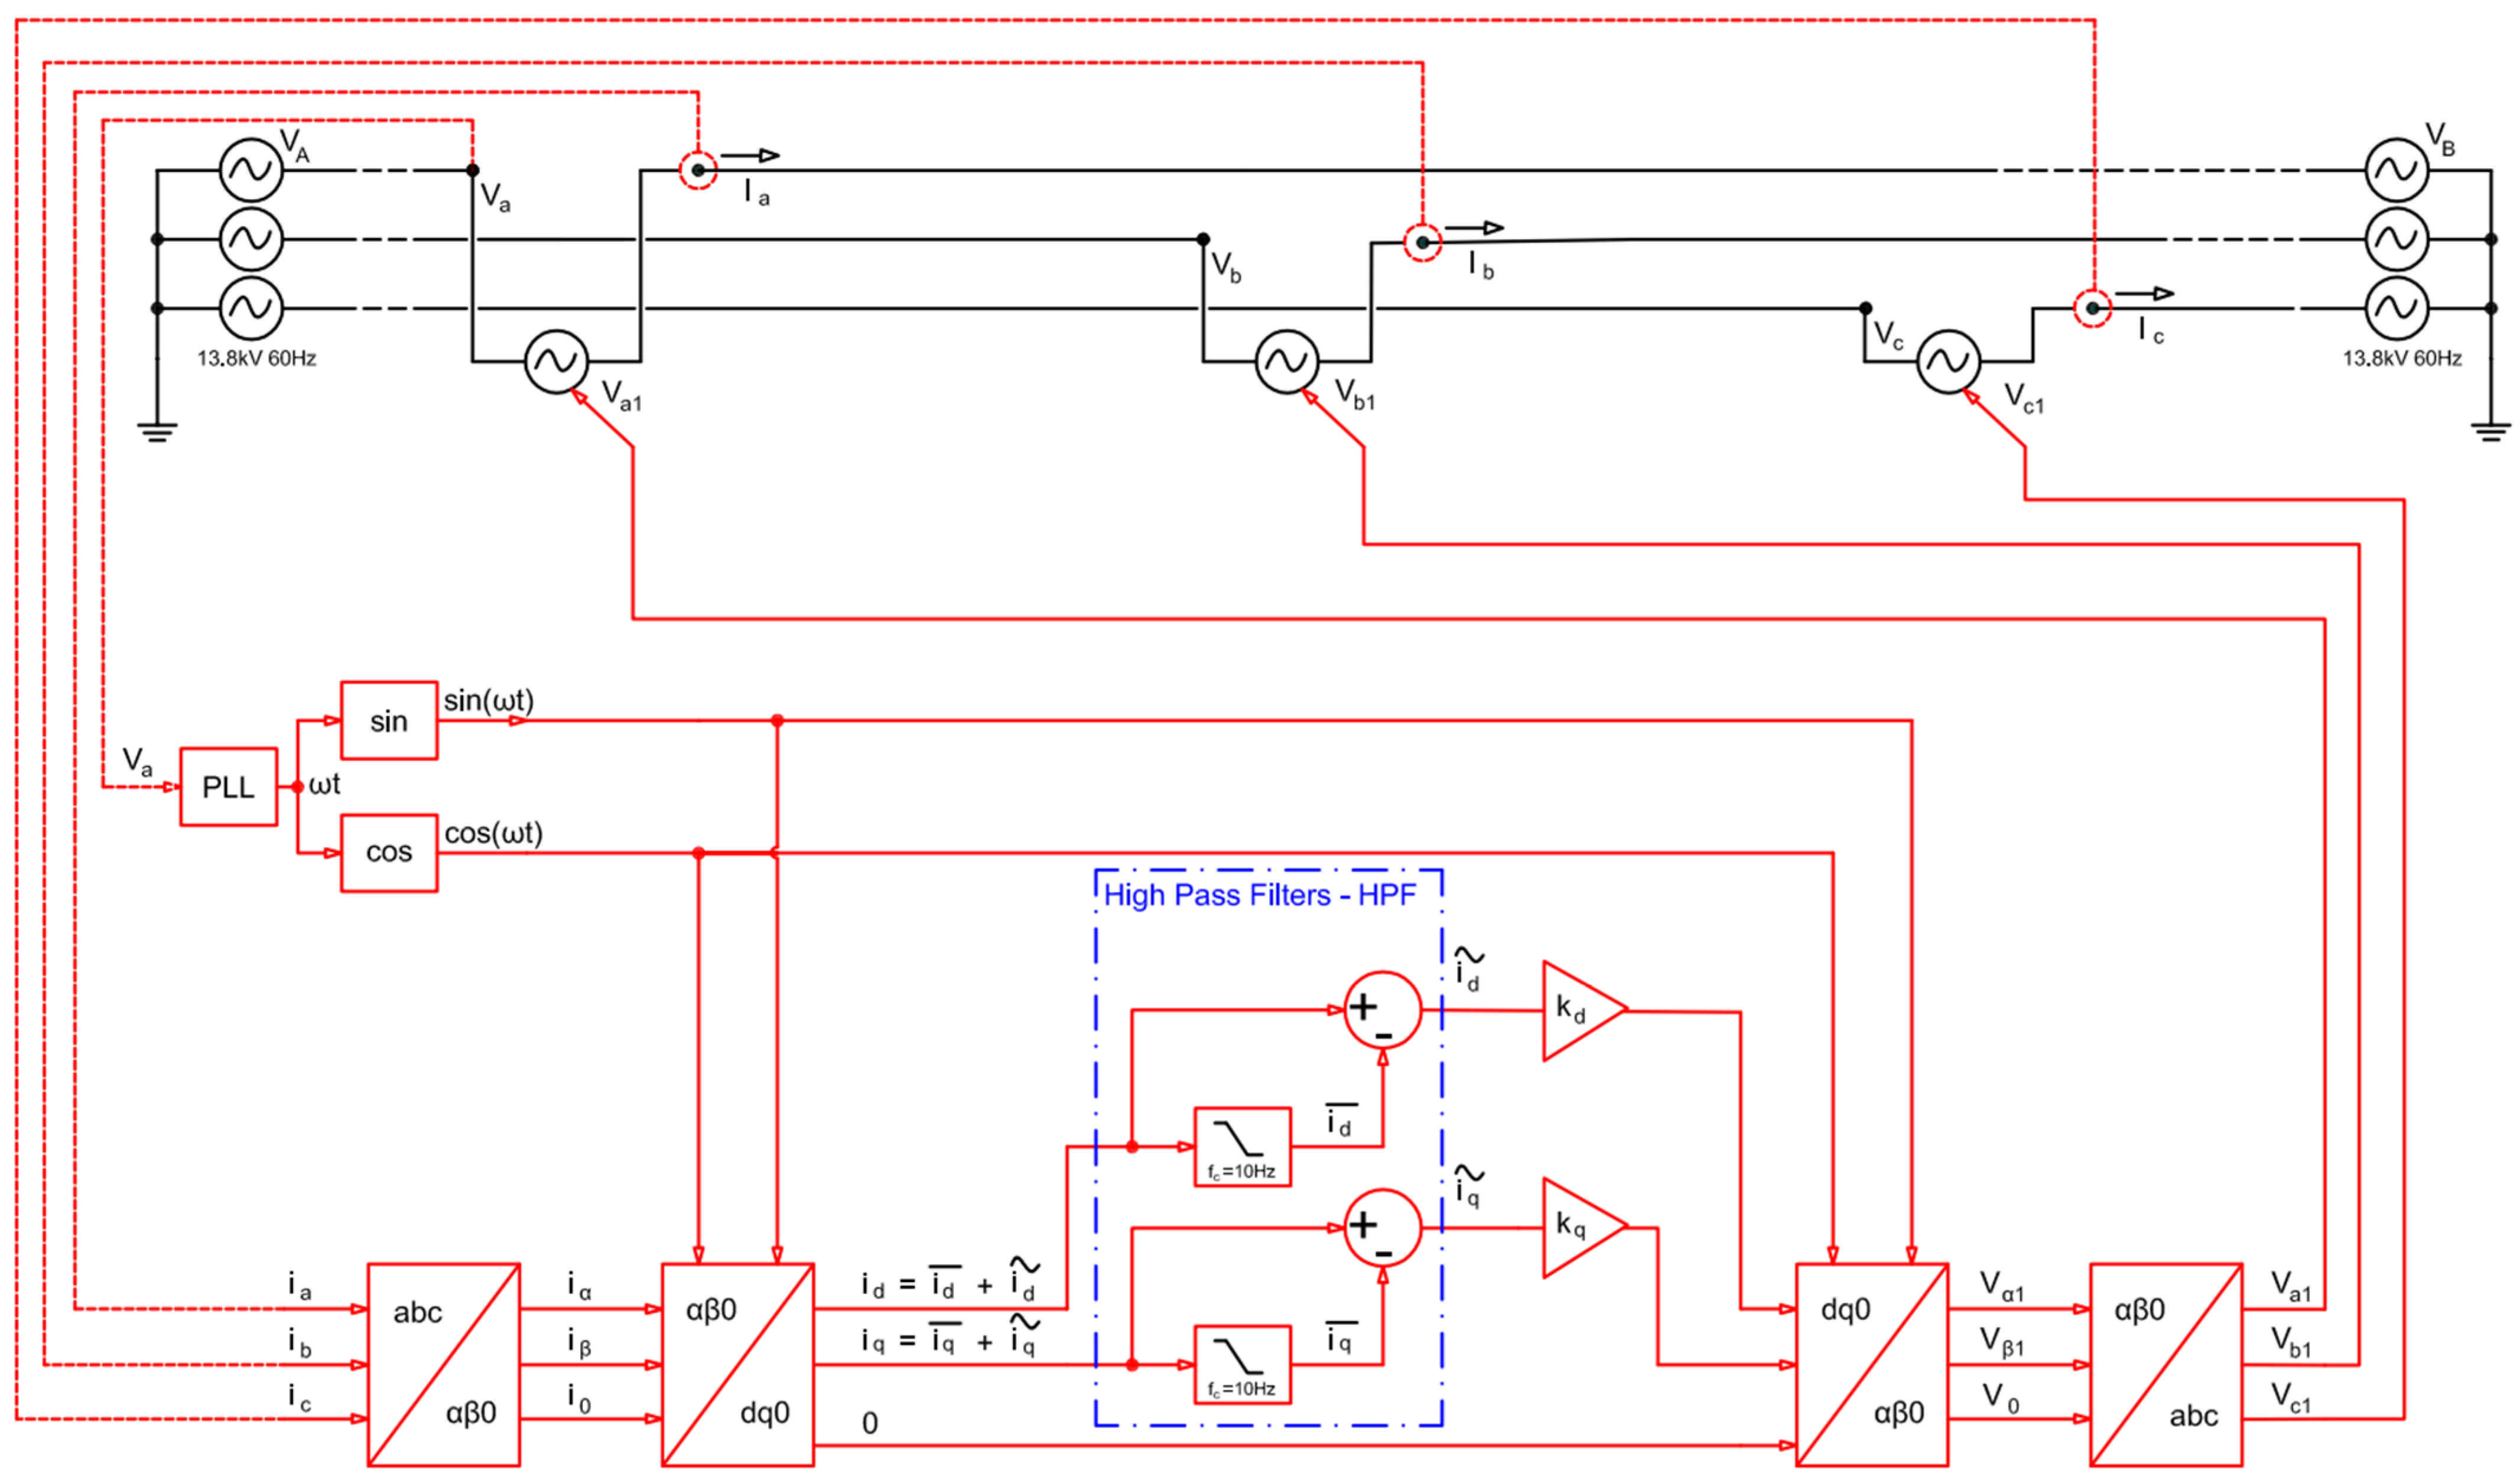
The block diagram of the three-phase synchronous reference algorithm to obtain the current harmonic components is shown in Figure 3. The currents or voltages of interest are transformed from the abc coordinate system to the stationary reference system αβ0 through the Clarke Transform. The αβ0 components are transformed from the stationary system to the synchronous system dq through the Park Transform. Then, to convert back to the abc coordinate axis, the Inverse Park Transform and then the Inverse Clarke Transform are applied.
The Park Transform requires two unit vectors, sin(ωt) and cos(ωt), in phase and at 90°, respectively, with the system voltage or current. These signals are obtained from a PLL (Phase Locked Loop). A PLL is an algorithm that keeps track of the angle of the fundamental frequency component of the grid voltage [39].
The Park Transform provides the components id and iq (or vd and vq), which can be decomposed into continuous and alternating components according to (1) and (2):
i d = i d ¯ + i d ˜
i q = i q ¯ + i q ˜
The continuous components ( i d ¯ , i q ¯ ) represent the fundamental component, that is, 60 Hz. The alternating components ( i d ˜ , i q ˜ ) represent the harmonic content. In this work, the components ( i d ¯ , i q ¯ ) are used for power flow control and ( i d ˜ , i q ˜ ) are used to perform the blocking of the harmonic components.
To obtain the harmonic content of (1) and (2), a high-pass filter is used. The high-pass filter was implemented from a low-pass filter, which is a solution that allows the removal of the continuous component present in id and iq, as in (3) and (4), without phase-shift errors.
i d ˜ = i d i d ¯
i q ˜ = i q i q ¯
Thus, these obtained abc signals are multiplied by a proportional gain after the transformations and are applied to the series active filter involved.

Modified Synchronous Reference Frame

For single-phase systems, the Modified Synchronous Reference Frame (MSRF) is used, which is an adaptation of the standard three-phase Synchronous Reference Frame (SRF) [39]. This method consists of multiplying the input signal directly by the two orthogonal signals generated by the PLL (sin(ωt) and cos(ωt)) and is represented in the block diagram of Figure 4. An important difference from the three-phase SRF is that the signals id and iq in the MSRF have half the amplitude of the original signals in the abc frame, so a gain of two must be used in the MSRF loop, as shown in Figure 4.

3.2. MSRF-Based Controller

The first proposed control strategy, shown in Figure 4, is based entirely in the MSRF, with two PI controller feedback loops. The current loop controls the transferred current (IT). Additionally, for a higher X/R line ratio, there will be a higher coupling between id and iq variables when an additional decoupling technique might be required.
The current control loop at fundamental frequency, shown in black in Figure 4, is responsible for transferring the required amount of power, where id corresponds to the active component of the fundamental current and iq to the reactive component. This loop compares the actual transferred current (id and iq) to their reference values (idref and iqref), generating the modulation indexes mid and miq. These modulation indexes are multiplied by unit vectors sin(ꞷt) and cos(ꞷt) and then summed to generate the PWM reference signal (Vpwm).
The harmonic isolation control loop is shown in red in Figure 4. This loop obtains the harmonic content of the transferred current IT using a high-pass filter in the MSRF and feeds this harmonic content back to the converter voltage reference signal Vpwm by means of a proportional gain K. This provides a very high impedance for the harmonics, preventing harmonics from flowing from one distribution feeder to the other.

3.3. Proportional Resonant Based Controller

Another harmonic control algorithm that will be evaluated for the series converter is based on the Proportional Resonant Controller (PR). This controller is the mathematical transformation of a PI controller in the Synchronous Frame [30]. The PR controller transfer function is given by (5).
C ( s ) = k p + k r s s 2 + ω 2
where kp is the proportional gain, kr is the resonant term gain and ω is the resonance frequency. Due to the high gain at the resonance frequency ω, this controller can track a sinusoidal reference at this frequency without steady-state error. This characteristic is similar to that presented by a PI controller with a dc reference.
However, Equation (5) represents an ideal tuned controller with very low bandwidth, which can present problems in digital implementations. For practical cases, it is recommended to use the transfer function given by (6), which represents the controller as a bandpass filter, whose bandwidth can be defined by the term ωc.
C ( s ) = k p + 2 k r ω c s s 2 + 2 ω c s + ω 0 2
where ω0 is the filter tuning frequency of (60 Hz) and ωc is the frequency that defines the controller bandwidth. Several resonant controllers can be used in parallel, as in (7), to provide compensation of multiple harmonics at the same time. The main harmonics present in the distribution networks are the low order odd ones, so resonant terms were used for the third, fifth, seventh, ninth and eleventh harmonics.
C P R ( s ) = k p + h = 3 , 5 , 7 , 9 , 11 2 k r h ω c s s 2 + 2 ω c s + h ω 0 2
The block diagram of fundamental power flow control (in black) and harmonic isolation using the Proportional Resonant controller (in red) is shown in Figure 5.
It is observed that the proportional term presents constant gain for the entire spectrum, and that the fundamental component should not be affected by the harmonic compensator as in the SRF. This influence is caused by the imposition of a voltage of 60 Hz which causes an active power consumption in the series converter. Therefore, the fundamental component must be separated from the harmonics. This is conducted in the scheme of Figure 5 using a high-pass filter inside the MSRF, which is the same strategy from Figure 4.

4. Simulations

The electrical system used to simulate the effectiveness of the fundamental frequency power flow control along with the harmonic isolation capability is shown in Figure 6. It considers a representation of a typical three-phase medium voltage distribution power system at 13.8 kV with two circuits interconnected and was built in Matlab®/Simulink software (version 2019b, licensed for UNIFEI at Itajuba, Brazil).
At the point where these feeders are connected, a series converter was inserted with the purpose of performing harmonic isolation, as symbolized in Figure 6. The line, equivalent transformer impedances and load parameters of the model are also shown in Figure 6. A controlled voltage source was used to represent the series converter, providing a reduced and faster simulation.
Two simulation models of 0.3 s were run, the first with the SRF controller and the second with the PR controller. There are two scenarios within each simulation model: one with the insertion of a voltage source type of load (VS) and the other with the insertion of a current source type of load (CS).
To carry out a comparative analysis of the performance between the techniques studied, the following operation history was defined:
(a)
The simulation is started with the series converter imposing zero voltage and with only linear loads turned on.
(b)
At 0.05 s, one of the non-linear loads is inserted into the system.
(c)
At 0.15 s, the series converter begins to operate in the harmonic block mode.

4.1. Without Harmonic Isolation

In the first simulation case, the vs. non-linear load is connected to Feeder 1 (the left-hand side feeder from Figure 6) between 0.05 s and 0.15 s, and the feeders are directly linked by the series converter. During this time the equipment imposes zero voltage, i.e., acting like a short-circuit for both fundamental and harmonic frequencies and not performing any harmonic mitigation.
At this point, the results show that voltage and current distortions propagate throughout the whole system when the two feeders are interconnected without harmonic isolation. The terminal voltage profiles of both feeders are the same and are shown in Figure 7, along with their harmonic spectrum with a THD of 2.28%. Figure 8 shows the harmonic spectrum of the current transferred between feeders (Ia) with a THD of 99.89%.
In the second simulation scenario, the CS type of load is connected to Feeder 2. This load presents lower current distortion, so the voltages at the terminal present a THD of 1.23%, as shown in Figure 9. In Figure 10, the harmonic spectrum of the loop current is shown with a THD of 26.61% when only the current source type load is connected to Feeder 2.

4.2. Harmonic Isolation with vs. Type of Load

For voltage source type of load simulations, it was observed that the performance of both control techniques remained identical in the harmonic isolation function, so the results are not presented for both cases. Figure 11 shows the simulated waveforms of Ia and the converter voltage (VSS1). One can clearly see the reduction in the distortion of the transferred current at 0.05 s when the converter starts blocking the harmonics.
Figure 12 shows the harmonic spectrum of current Ia after harmonic isolation, with a THD of 4.01%, a value considerably lower than previously presented in Figure 8 without compensation.
Figure 13 and Figure 14 show the harmonic spectrum of terminal voltages Va and V2a, respectively. Va has a THD of 3.46%, a value greater than shown in Figure 7, which shows the terminal voltages before harmonic isolation. However, V2a has a THD of 0.49 because the non-load is connected to Feeder 1, so Feeder 2 is practically unaffected by the harmonic distortion of the other feeder, demonstrated by the ability of the series converter to perform harmonic isolation both with MSRF and PR controllers.

4.3. Harmonic Isolation with CS Type of Load

In the second analysis of the results, there is only the current source type of load connected to Feeder 2. Figure 15 shows the simulated waveforms of Ia and the converter voltage (VSS1). The sinusoidal waveform of the transferred current can be seen at 0.05 s when the converter starts blocking the harmonics.
In this simulation, the two harmonic block strategies showed slightly different results, which are shown and discussed here. The harmonic spectrum of Ia during harmonic isolation with SRF is shown in Figure 16, with a THD of 4.01%. On the other hand, the PR controller technique was able to achieve a THD of 3.86% for the same case, as shown in Figure 17.
Figure 18 and Figure 19 show the voltage harmonic spectrum in Feeder 1 for the SRF controller and PR controller, respectively. The voltage measurements show the harmonic isolation capacity for the two control techniques. In both cases, as the current source load is inserted in Feeder 2, Feeder 1 is practically not influenced by the voltage distortion present in the other feeder when harmonic isolation is performed. However, the THD of Va with the PR controller is a bit lower than with the SRF controller, with values of 0.49% (Figure 18) and 0.53% (Figure 19), respectively.
Figure 20 and Figure 21 show the voltage harmonic spectrum in Feeder 2 for the SRF controller and PR controller, respectively. The harmonic distortion in Feeder 2, where the CS load is connected, is larger than Feeder 1 in both cases. This distortion cannot be reduced with the action of the series converter. A shunt active power filter would be required to deal with the non-linear load current harmonics.

5. Prototype

The experimental results were obtained using the prototype shown in Figure 22. This equipment can transfer up to 500 kVA at 13.8 kV three-phase. Figure 22 shows the power electronic converters, indicated as 1, and the control system, indicated as 2. The control system for each single-phase module includes the low power electronics for analog signal conditioning, voltage and current transducers, a relay command circuit board, a TMS320F28335 DSC and IGBT gate drivers.
Outside the cabinet, the equipment has three single-phase 37.5 kVA 1800 V:600 V series coupling transformers, oil-isolated switches and voltage and current transformers. Figure 23 shows a picture from the medium voltage lab used in the tests, highlighting the voltage transformers (1), current transformers (2) and coupling transformers (3).

6. Experimental Results

Laboratory tests were performed to verify the effectiveness of the harmonic isolation algorithms and compare both techniques empirically, since the simulations presented similar results for both cases. The experimental tests consider factors that are not present in the simulations such as noise, saturation and limitations on the digital implementation of the controllers (such as quantizing effects, sampling frequency, etc.).
The test circuit used in the lab is shown in Figure 24, which is formed by the feeder impedances (RA and LA) connected at the low voltage side, two step-up transformers (220 V:13.8 kV), a voltage source type non-linear load and the series power converters interconnecting the feeders through a coupling transformer T1. Measurements were performed with three Fluke 435 power quality meters connected at the points indicated in Figure 24.
Table 1 shows the parameters of the converter switching filter (LF1 and LF2), the resistance and inductance of the lines (RA and LA) and the loads used in the lab experimental results. The data for the transformers used in the test setup are presented in Table 2, where TA and TB are the source step-up transformers and T1 is the coupling transformer. Table 3 shows the controller gains of the current and voltage control loops, at fundamental frequency, and the parameters of the harmonic isolation strategies.
The results obtained can be divided into three moments:
  • With radial topology (switch k1 in Figure 24 is open).
  • In mesh with the converter transferring power from Feeder 2 to Feeder 1, without harmonic isolation.
  • In mesh with the converter transferring power from Feeder 2 to Feeder 1 and performing harmonic isolation.
In experimental results the current control references (idref and iqref) were defined as idref = 0.15 A and iqref = 0 A, without changes during all of experimental tests.
The control tuning (i.e., controllers gains) of the harmonic controllers and the fundamental frequency control was conducted empirically with the aim of having a relatively quick response but without instabilities during disturbances provided by the load’s insertion or remotion.

6.1. Results of SRF-Based Harmonic Isolation Algorithm

In this section the experimental results with the SRF-based strategy (Figure 4) to block the passage of harmonics while controlling power flow at fundamental frequency are presented.
Firstly, the system was in the radial form (in which the ends of the feeders are open by k1 and without the converter), and the non-linear load was inserted in Feeder 1. The harmonic spectrum of the terminal voltages of the two feeders are shown in Figure 25. The harmonic spectrum of V1 is shown in Figure 25a while that of voltage V2 is shown in Figure 25b. Upon comparing both THDs, it can be verified that voltage V1 is more distorted than V2.
Then, keeping the non-linear load on Feeder 1, the converter starts to operate, transferring a current of 0.140 A from Feeder 2 to Feeder 1 without performing harmonic isolation. Figure 26a shows the waveform of the voltage V1 and the current transferred by the equipment. Note that the transferred current is not purely sinusoidal, which can be proved by the harmonic spectrum shown in Figure 26b with a THD of 10.7%.
In Figure 27 the voltage harmonic spectra of the two feeders are presented, showing that the greater harmonic distortion present in the voltage of Feeder 1 (previously with THD = 4.7%) is propagated to Feeder 2 (previously with THD = 1.6%), resulting in a THD of 2.2% at both terminal voltages.
Next, the non-linear load remains inserted in Feeder 1, with the current being transferred from Feeder 2 to Feeder 1 and the harmonic isolation algorithm based on the SRF being activated. Figure 28 shows the waveforms of the Feeder 1 voltage and loop current, which is slightly less distorted than in Figure 26a.
Figure 29a shows the harmonic spectrum of voltage V1 and Figure 29b that of voltage V2. Comparing the two figures, the THD of V1 is higher, with 3.0%, while that of V2 is lower, with 2.2%. These THD values demonstrate that most of the distortion from Feeder 1 is kept in Feeder 1 and does not propagate as much to Feeder 2 as in the case where there is no harmonic isolation.
However, as opposed to the simulation results in Section 4.2 and Section 4.3, the SRF-based algorithm is not capable of completely isolating the harmonics between both feeders. This happens because the harmonic mitigation capacity of the SRF-based algorithm depends on the proportional gain K shown in Figure 4. Since the harmonics are extracted from the fundamental frequency components using a high-pass filter, all the PWM noise and other high frequency noise present in the feedback signal is multiplied (and amplified) by the gain K. This inhibits the use of high values for K, which limits the harmonic isolation capacity of this strategy in actual experimental setups. This was not a problem in the simulations, since the PWM converter was modeled as a controlled voltage source. For experimental tests, a low-pass filter with high cutoff frequency was included in the loop, but still the harmonic isolation results with SRF in the lab were not as good as in the simulations.
Another test was performed with the SRF-based harmonic isolation algorithm where the fundamental frequency current references were set to zero (idref = 0 and iqref = 0) with the non-linear load still connected to Feeder 1. Figure 30a shows the terminal voltage and loop current waveforms without harmonic isolation. Due to the voltage distortion difference, there is a harmonic current flow between the two feeders even with the current reference set to zero. Figure 30b shows the same waveforms with harmonic mitigation enabled. One can see that the harmonic current transferred is reduced from Figure 30a to Figure 30b; however, there are still some minor components that are not blocked by the SRF-based algorithm.

6.2. Results of PR-Based Harmonic Isolation Algorithm

In this section the experimental results with the PR-based algorithm (Figure 5) to block the passage of harmonics between feeders while controlling power flow at fundamental frequency are presented.
Being the system in the radial form (the ends of the feeders are open by k1 and without the converter), the non-linear load was inserted in Feeder 1. The measurements of the terminal voltages of the two feeders are shown in Figure 31. Note that Feeder 1 voltage V1 (Figure 31a) has a more distorted waveform than Feeder 2 voltage V2 (Figure 31b), since the load is connected to Feeder 1. The harmonic spectrum of V1 is shown in Figure 32a while that of voltage V2 is shown in Figure 32b. Upon comparing the two THDs, it can be verified that voltage V1 is more distorted than V2.
Then, keeping the non-linear load on Feeder 1, the converter starts to operate, transferring a current of 0.353 A from Feeder 2 to Feeder 1 without performing harmonic isolation. Figure 33a shows the waveform of the voltage V1 and the current transferred by the equipment. Note that the transferred current is not purely sinusoidal, which can be proved by the harmonic spectrum shown in Figure 33b with a THD of 12.8%. In Figure 34 the voltage harmonic spectrum of the two feeders is presented, showing that the greater harmonic distortion present in the voltage of Feeder 1 (previously with THD = 6.6%) is propagated to Feeder 2 (previously with THD = 1.6%), resulting in a THD of 2.9% at both terminal voltages.
Finally, with the non-linear load inserted in Feeder 1, the PR-based harmonic isolation algorithm is activated, demonstrating that, even with the feeders interconnected by the converter, the distortion present in Feeder 1 no longer propagates to Feeder 2. Figure 35a shows the harmonic spectrum of voltage V1 and Figure 35b that of voltage V2. Comparing the two figures, the THD of V1 is higher, with 5.3%, while that of V2 is lower, with 1.9%. These values are very close to Case 1, in which the feeders were not interconnected. Observing the current transferred between the feeders, as shown in Figure 36, it can be seen that it is composed almost entirely of the fundamental component (THD = 4%, in Figure 36b), which was previously 12.8% in Figure 33b.
Moreover, the transferred current is closer to a sine curve than the one obtained with the SRF-based algorithm in Figure 28. This happens because the frequency selective feature of the PR controller guarantees that only the selected harmonic frequencies will be injected by the controller/converter, so the high frequency noise is not feedback into the loop generating problems in actual applications. This comes with an increase in computational cost and controller gain tuning procedure, since several controllers are used in parallel, one for each harmonic frequency. In most cases, since the major harmonics in the bus voltages are the low order harmonics, only five controllers were needed.
In the last test performed with the PR-based harmonic isolation algorithm, the fundamental frequency current references were set to zero (idref = 0 and iqref = 0), with the non-linear load still connected to Feeder 1. Figure 37a shows the terminal voltage and loop current waveforms without harmonic isolation. Due to the voltage distortion difference, there is a harmonic current flow between the two feeders even with the current reference set to zero. Figure 37b shows the same waveforms with harmonic mitigation enabled. It can be seen that the harmonic current transferred is reduced from Figure 37a to Figure 37b, and that the remaining harmonic content is even lower than what was obtained with the SRF-based algorithm shown in Figure 30b.
To summarize, the main results are presented in Table 4. For the simulation cases, both techniques achieved similar performances, keeping the harmonics restricted to the feeder whose non-linear loads were connected and reducing the THD of the feeder without the non-linear loads to about 0.5%. For the experimental case, the PR-based algorithm performed better harmonic isolation. This can be verified in Table 4 by comparing the values of the voltage THDs of Feeders 1 and 2, with harmonic isolation, to the radial case. These values are closer to the PR-based algorithm than to the SRF-based algorithm, which shows that the system behaves similarly to an open circuit from the harmonics point of view with the PR-based approach.

7. Conclusions

The interconnection of radial distribution feeders using a series power flow controller is a cost-effective approach to improve the flexibility and utilization of these circuits in a controlled and secure way. However, if these feeders present different harmonic distortions, harmonic currents can flow between them, propagating harmonic pollution from one circuit to the other. Implementing a harmonic isolation feature in the equipment interconnecting these circuits is of the utmost importance to improve power quality in meshed distribution networks.
In this way, this paper presented the description, implementation and comparison of two techniques to perform harmonic isolation in a series compensator: an SRF-based algorithm and a PR-based controller. This comparison was made using simulations and experimental results in a 13.8 kV laboratory with different types of non-linear loads.
For the simulation cases, both techniques achieved similar performances, keeping the harmonics restricted to the feeder whose non-linear loads were connected and reducing the THD of the feeder without the non-linear loads. For the experimental results, the PR-based algorithm was able to perform better harmonic isolation. In the radial case, the main voltage THD of Feeder 2 was 1.6% without non-linear loads. The SRF-based algorithm could achieve a THD of 2.2% in the Feeder 2 without non-linear loads when both feeders were interconnected. On the other hand, the PR-based algorithm was able to achieve a THD of 1.9% in the same situation, providing better harmonic isolation.
Especially in the experimental case study, where several factors such feedback signal noise and limitations in the controller’s digital implementation can influence algorithm performance, the PR-based strategy proved to be more robust and accurate. Even though multiple resonant compensators are needed, which increases the computational burden and tuning procedure, the selective frequency feature of this strategy proved to be more suitable for real applications.

Author Contributions

Conceptualization, J.S.-F., G.L.-T., C.H.d.S. and R.B.G.; Hardware assembly, control Software, G.G.P. and J.G.L.F.; Investigation, G.G.P., B.P.B.G., C.H.d.S. and K.S.d.S.; Funding acquisition, J.S.-F.; Writing—original draft, G.G.P.; Writing—review and editing, R.B.G.; Methodology, R.B.G. and R.R.P.; Project administration, G.L.-T.; Formal analysis, B.P.B.G. and R.B.G.; Software, J.G.L.F.; Supervision, R.R.P. All authors have read and agreed to the published version of the manuscript.

Funding

This research received no external funding.

Data Availability Statement

No new data were created or analyzed in this study. Data sharing is not applicable to this article.

Acknowledgments

The authors would like to thank the Brazilian Research Agencies CNPq, CAPES, FAPEMIG and ANEEL Research and Development for their support of this project.

Conflicts of Interest

The authors declare no conflict of interest.

Abbreviations

The following abbreviations are used in this manuscript:
ANFAdaptive Notch Filter
ANNArtificial Neural Network
CTCurrent Transformer
CSCurrent Source
DSPDigital Signal Processor
DVRDynamic Voltage Restorer
IGBTInsulated Gate Bipolar Transistor
LPFLow-pass Filter
MSRF Modified Synchronous Reference Frame
MVMedium Voltage
PAPFParallel Active Power Filter
PIProportional Integral
PRProportional Resonant
RACDSResilient AC Distribution Systems
SAPFShunt Active Power Filter
SRFSynchronous Reference Frame
VSCVoltage Source Converter
VSVoltage Source
VTVoltage Transformer

References

  1. Gasperic, S.; Mihalic, R. The Impact of Serial Controllable FACTS Devices on Voltage Stability. Int. J. Electr. Power Energy Syst. 2015, 64, 1040–1048. [Google Scholar] [CrossRef]
  2. Gandoman, F.H.; Ahmadi, A.; Sharaf, A.M.; Siano, P.; Pou, J.; Hredzak, B.; Agelidis, V.G. Review of FACTS Technologies and Applications for Power Quality in Smart Grids with Renewable Energy Systems. Renew. Sustain. Energy Rev. 2018, 82, 502–514. [Google Scholar] [CrossRef]
  3. Ordóñez, C.A.; Gómez-Expósito, A.; Maza-Ortega, J.M. Series Compensation of Transmission Systems: A Literature Survey. Energies 2021, 14, 1717. [Google Scholar] [CrossRef]
  4. Imdadullah; Amrr, S.M.; Asghar, M.S.J.; Ashraf, I.; Meraj, M. A Comprehensive Review of Power Flow Controllers in Interconnected Power System Networks. IEEE Access 2020, 8, 18036–18063. [Google Scholar] [CrossRef]
  5. Peng, F.Z. Flexible AC Transmission Systems (FACTS) and Resilient AC Distribution Systems (RACDS) in Smart Grid. Proc. IEEE 2017, 105, 2099–2115. [Google Scholar] [CrossRef]
  6. Ilea, V.; Bovo, C.; Falabretti, D.; Merlo, M.; Arrigoni, C.; Bonera, R.; Rodolfi, M. Voltage Control Methodologies in Active Distribution Networks. Energies 2020, 13, 3293. [Google Scholar] [CrossRef]
  7. Sayed, M.A.; Takeshita, T. Line Loss Minimization in Isolated Substations and Multiple Loop Distribution Systems Using the UPFC. IEEE Trans. Power Electron. 2014, 29, 5813–5822. [Google Scholar] [CrossRef]
  8. Saradarzadeh, M.; Farhangi, S.; Schanen, J.L.; Jeannin, P.-O.; Frey, D. The Benefits of Looping a Radial Distribution System with a Power Flow Controller. In Proceedings of the 2010 IEEE International Conference on Power and Energy, Kuala Lumpur, Malaysia, 29 November–1 December 2010; pp. 723–728. [Google Scholar]
  9. Wang, L.; Feng, S.; Shi, F. Risk Analysis of ClosING Loop Operation Based on the Main and Distribution Network Integration. In Proceedings of the 2012 China International Conference on Electricity Distribution, Shanghai, China, 10–14 September 2012; pp. 1–4. [Google Scholar]
  10. Bacha, S.; Frey, D.; Schanen, J.L.; Lepelleter, E.; Jeannin, P.O.; Caire, R. Short-Circuit Limitation Thanks to a Series Connected VSC. In Proceedings of the 2008 Twenty-Third Annual IEEE Applied Power Electronics Conference and Exposition, Austin, TX, USA, 24–28 February 2008; pp. 1938–1945. [Google Scholar]
  11. Saradarzadeh, M.; Farhangi, S.; Schanen, J.L.; Jeannin, P.-o.; Frey, D. Combination of Power Flow Controller and Short-Circuit Limiter in Distribution Electrical Network Using a Cascaded H-Bridge Distribution-Static Synchronous Series Compensator. Transm. Distrib. IET Gener. 2012, 6, 1121–1131. [Google Scholar] [CrossRef]
  12. Farmad, M.; Farhangi, S.; Afsharnia, S.; Gharehpetian, G.B. Modelling and Simulation of Voltage Source Converter-Based Interphase Power Controller as Fault-Current Limiter and Power Flow Controller. Transm. Distrib. IET Gener. 2011, 5, 1132–1140. [Google Scholar] [CrossRef]
  13. Saradarzadeh, M.; Farhangi, S.; Schanen, J.L.; Jeannin, P.-O.; Frey, D. Application of Cascaded H-Bridge Distribution-Static Synchronous Series Compensator in Electrical Distribution System Power Flow Control. IET Power Electron. 2012, 5, 1660–1675. [Google Scholar] [CrossRef]
  14. Chen, H.; Iyer, A.R.; Harley, R.G.; Divan, D. Dynamic Grid Power Routing Using Controllable Network Transformers (CNTs) With Decoupled Closed-Loop Controller. IEEE Trans. Ind. Appl. 2015, 51, 2361–2372. [Google Scholar] [CrossRef]
  15. Wu, R. Improve the Flexibility of Power Distribution Network by Using Back-to-Back Voltage Source Converter. Ph.D. Thesis, University of Warwick, Coventry, UK, 2018. [Google Scholar]
  16. Pinheiro, G.G.; da Silva, C.H.; Guimarães, B.P.B.; Gonzatti, R.B.; Pereira, R.R.; Sant’Ana, W.C.; Lambert-Torres, G.; Santana-Filho, J. Power Flow Control Using Series Voltage Source Converters in Distribution Grids. Energies 2022, 15, 3337. [Google Scholar] [CrossRef]
  17. George, S.; Agarwal, V. A DSP-Based Control Algorithm for Series Active Filter for Optimized Compensation Under Nonsinusoidal and Unbalanced Voltage Conditions. IEEE Trans. Power Deliv. 2007, 22, 302–310. [Google Scholar] [CrossRef]
  18. Roldán-Pérez, J.; Zamora-Macho, J.L.; Ochoa-Giménez, M.; Garcίa-Cerrada, A. A steady-state harmonic controller for a series compensator with uncertain load dynamics. Electr. Power Syst. Res. 2017, 150, 152–161. [Google Scholar] [CrossRef]
  19. Sleszynski, W.; Cichowski, A.; Mysiak, P. Suppression of Supply Current Harmonics of 18-Pulse Diode Rectifier by Series Active Power Filter with LC Coupling. Energies 2020, 13, 6060. [Google Scholar] [CrossRef]
  20. Li, D.; Song, M.; Hu, J.; Luo, Y.; Xiao, X.; Yang, K. Improved series active power filter with fundamental and harmonic magnetic flux hybrid compensation. IET Power Electron. 2018, 11, 1038–1045. [Google Scholar] [CrossRef]
  21. Senturk, O.S.; Hava, A.M. High-Performance Harmonic Isolation and Load Voltage Regulation of the Three-Phase Series Active Filter Utilizing the Waveform Reconstruction Method. IEEE Trans. Ind. Appl. 2009, 45, 2030–2038. [Google Scholar] [CrossRef]
  22. Pinheiro, G.; Sant’Ana, W.; Rodrigues Pereira, R.; Gonzatti, R.B.; Guimarães, B.; Lambert-Torres, G.; da Silva, L.E.; Mollica, D.; Filho, J.; Silva, C.; et al. Comparação de Técnicas de Controle para Bloqueio Harmônico Utilizando um Filtro Ativo Série em Redes de Distribuição. In Proceedings of the XVIII Encontro Regional Ibero-Americano do CIGRÉ, XVIII ERIAC, Foz do Iguaçu, Brazil, 19–23 May 2019. [Google Scholar] [CrossRef]
  23. Gonzatti, R.B.; Ferreira, S.C.; da Silva, C.H.; Pereira, R.R.; Borges da Silva, L.E.; Lambert-Torres, G. Smart Impedance: A New Way to Look at Hybrid Filters. IEEE Trans. Smart Grid 2016, 7, 837–846. [Google Scholar] [CrossRef]
  24. Soares, V.; Verdelho, P.; Marques, G.D. An Instantaneous Active and Reactive Current Component Method for Active Filters. Power Electron. IEEE Trans. 2000, 15, 660–669. [Google Scholar] [CrossRef]
  25. Patnaik, N.; Pandey, R.; Satish, R.; Surakasi, B.; Abdelaziz, A.Y.; El-Shahat, A. Single-Phase Universal Power Compensator with an Equal VAR Sharing Approach. Energies 2022, 15, 3769. [Google Scholar] [CrossRef]
  26. le Roux, A.D.; du Mouton, H.T.; Akagi, H. DFT-Based Repetitive Control of a Series Active Filter Integrated With a 12-Pulse Diode Rectifier. IEEE Trans. Power Electron. 2009, 24, 1515–1521. [Google Scholar] [CrossRef]
  27. Maza-Ortega, J.M.; Rosendo-Macias, J.A.; Gomez-Exposito, A.; Ceballos-Mannozzi, S.; Barragan-Villarejo, M. Reference Current Computation for Active Power Filters by Running DFT Techniques. IEEE Trans. Power Deliv. 2010, 25, 1986–1995. [Google Scholar] [CrossRef]
  28. Asiminoael, L.; Blaabjerg, F.; Hansen, S. Detection is keyHarmonic detection methods for active power filter applications. IEEE Ind. Appl. Mag. 2007, 13, 22–33. [Google Scholar] [CrossRef]
  29. Cheng, P.; Bhattacharya, S.; Divan, D. Operations of the dominant harmonic active filter (DHAF) under realistic utility conditions. IEEE Trans. Ind. Appl. 2001, 37, 1037–1044. [Google Scholar] [CrossRef]
  30. Zmood, D.N.; Holmes, D.G. Stationary frame current regulation of PWM inverters with zero steady-state error. IEEE Trans. Power Electron. 2003, 18, 814–822. [Google Scholar] [CrossRef]
  31. Aljafari, B.; Rameshkumar, K.; Indragandhi, V.; Ramachandran, S. A Novel Single-Phase Shunt Active Power Filter with a Cost Function Based Model Predictive Current Control Technique. Energies 2022, 15, 4531. [Google Scholar] [CrossRef]
  32. Foster, J.G.L.; Pereira, R.R.; Gonzatti, R.B.; Guimaraes, B.P.B.; Pinheiro, G.G.; Sant’ana, W.C. FCS-MPC Applied to Multilevel Hybrid Active Power Filter for Reactive Power and Harmonics Compensation. In Proceedings of the 2021 Brazilian Power Electronics Conference (COBEP), João Pessoa, Paraíba, 7–10 November 2021. [Google Scholar]
  33. Wang, Y.; Wang, C.; Zeng, W.; Bai, F. Multifactorial Prediction Errors Analysis and a Feedback Self-Correction on Model Predictive Control for the Three-Phase Inverter. IEEE Trans. Ind. Electron. 2019, 66, 3647–3654. [Google Scholar] [CrossRef]
  34. Omran, M.; Ibrahim, I.; Ahmad, A.; Salem, M.; Almelian, M.; Jusoh, A.; Sutikno, T. Comparisons of PI and ANN controllers for shunt HPF based on STF-PQ algorithm under distorted grid voltage. Int. J. Power Electron. Drive Syst. 2019, 10, 1339–1346. [Google Scholar] [CrossRef]
  35. Kołek, K.; Firlit, A. A New Optimal Current Controller for a Three-Phase Shunt Active Power Filter Based on Karush–Kuhn–Tucker Conditions. Energies 2021, 14, 6381. [Google Scholar] [CrossRef]
  36. Fei, J.; Wang, T. Adaptive fuzzy-neural-network based on RBFNN control for active power filter. Int. J. Mach. Learn. Cybern. 2019, 10, 1139–1150. [Google Scholar] [CrossRef]
  37. Fei, J.; Chu, Y. Double hidden layer output feedback neural adaptive global sliding mode control of active power filter. IEEE Trans. Power Electron. 2020, 35, 3069–3084. [Google Scholar] [CrossRef]
  38. Ali, A.; Rehman, A.U.; Almogren, A.; Eldin, E.T.; Kaleem, M. Application of Deep Learning Gated Recurrent Unit in Hybrid Shunt Active Power Filter for Power Quality Enhancement. Energies 2022, 15, 7553. [Google Scholar] [CrossRef]
  39. Silva, C.H.; Pereira, R.R.; Silva, L.E.B.; Lambert-Torres, G.; Bose, B.K.; Ahn, S.U. A digital pll scheme for three-phase system using modified synchronous reference frame. IEEE Trans. Ind. Electron. 2010, 57, 3814–3821. [Google Scholar] [CrossRef]
Figure 1. Three-phase modular power flow controller power circuit topology.
Energies 16 02729 g001
Figure 2. Simplified model of two distribution feeders interconnected by the series power flow controller.
Energies 16 02729 g002
Figure 3. Synchronous reference frame block diagram for harmonic extraction.
Energies 16 02729 g003
Figure 4. Modular algorithm for power flow control and harmonic isolation based on modified synchronous reference frame.
Energies 16 02729 g004
Figure 5. Modular Algorithm for power flow control based on modified synchronous reference frame and harmonic isolation based on proportional resonant control.
Energies 16 02729 g005
Figure 6. Single-line electrical diagram of the simulated system.
Energies 16 02729 g006
Figure 7. Terminal voltage of both feeders (Va and V2a) with vs. type of load connected to Feeder 1 and without harmonic isolation.
Energies 16 02729 g007
Figure 8. Loop current (Ia) with vs. type of load and without harmonic isolation.
Energies 16 02729 g008
Figure 9. Terminal voltage of both feeders (Va and V2a) with CS type of load and without harmonic isolation.
Energies 16 02729 g009
Figure 10. Loop current with CS type of load and without harmonic isolation.
Energies 16 02729 g010
Figure 11. Simulated waveforms of loop current (Ia) and the converter voltage (VSS1) with vs. type of load.
Energies 16 02729 g011
Figure 12. Loop current (Ia) harmonic spectrum with vs. type of load and harmonic isolation.
Energies 16 02729 g012
Figure 13. Harmonic spectrum of Feeder 1 terminal voltage (Va) with vs. type of load and harmonic isolation.
Energies 16 02729 g013
Figure 14. Harmonic spectrum of Feeder 2 terminal voltage ranch 1 (V2a) with vs. type of load and harmonic isolation.
Energies 16 02729 g014
Figure 15. Simulated waveforms of loop current (Ia) and the converter voltage (VSS1) with CS type of load.
Energies 16 02729 g015
Figure 16. Loop current (Ia) harmonic spectrum with CS type of load and harmonic isolation using SRF.
Energies 16 02729 g016
Figure 17. Loop current (Ia) harmonic spectrum with CS type of load and harmonic isolation using PR controller.
Energies 16 02729 g017
Figure 18. Harmonic spectrum of Feeder 1 terminal voltage (Va) with CS type of load and harmonic isolation using SRF.
Energies 16 02729 g018
Figure 19. Harmonic spectrum of Feeder 1 terminal voltage (Va) with CS type of load and harmonic isolation using PR controller.
Energies 16 02729 g019
Figure 20. Harmonic spectrum of Feeder 2 terminal voltage (V2a) with CS type of load and harmonic isolation using SRF.
Energies 16 02729 g020
Figure 21. Harmonic spectrum of Feeder 2 terminal voltage (V2a) with CS type of load and harmonic isolation using PR controller.
Energies 16 02729 g021
Figure 22. Inner electronics of the series power flow controller.
Energies 16 02729 g022
Figure 23. Picture of the medium voltage lab, showing the components outside the prototype cabinet.
Energies 16 02729 g023
Figure 24. Single-line laboratory test setup diagram.
Energies 16 02729 g024
Figure 25. Voltage harmonic spectrums with radial grid topology and the load connected to Feeder 1. (a) Terminal voltage of Feeder 1 (V1) and (b) Terminal voltage of Feeder 2 (V2).
Energies 16 02729 g025
Figure 26. Terminal voltage of Feeder 1 and loop current with grid in mesh topology before harmonic isolation (a) waveforms and (b) current harmonic spectrum.
Energies 16 02729 g026
Figure 27. Harmonic spectra of the terminal voltages in mesh topology before harmonic isolation with SRF-based algorithm. (a) Feeder 1 voltage and (b) Feeder 2 voltage.
Energies 16 02729 g027
Figure 28. Waveforms of the terminal voltage of Feeder 1 and loop current with grid in mesh topology after harmonic isolation with SRF.
Energies 16 02729 g028
Figure 29. Harmonic spectra of the terminal voltages in mesh topology after harmonic isolation with SRF-based algorithm. (a) Feeder 1 voltage and (b) Feeder 2 voltage.
Energies 16 02729 g029
Figure 30. Terminal voltage of Feeder 1 and loop current with grid in mesh topology and (idref = 0 and iqref = 0) (a) without harmonic isolation (b) with harmonic isolation using SRF-based algorithm.
Energies 16 02729 g030
Figure 31. Voltage waveforms with radial grid topology and the load connected to Feeder 1. (a) Terminal voltage of Feeder 1 (V1) and (b) Terminal voltage of Feeder 2 (V2).
Energies 16 02729 g031
Figure 32. Voltage harmonic spectrums with radial grid topology and the load connected to Feeder 1. (a) Terminal voltage of Feeder 1 (V1) and (b) Terminal voltage of Feeder 2 (V2).
Energies 16 02729 g032
Figure 33. (a) Waveforms of the terminal voltage of Feeder 1 (V1) and loop current with grid in mesh topology after harmonic isolation with PR. (b) Loop current spectrum.
Energies 16 02729 g033
Figure 34. Harmonic spectra of the terminal voltages in mesh topology before harmonic isolation with PR-based algorithm. (a) Feeder 1 voltage and (b) Feeder 2 voltage.
Energies 16 02729 g034
Figure 35. Harmonic spectra of the terminal voltages in mesh topology after harmonic isolation with PR-based algorithm. (a) Feeder 1 voltage and (b) Feeder 2 voltage.
Energies 16 02729 g035
Figure 36. Terminal voltage of Feeder 1 and loop current in mesh topology after harmonic isolation, (a) waveforms and (b) current harmonic spectrum.
Energies 16 02729 g036
Figure 37. Terminal voltage of Feeder 1 and loop current with grid in mesh topology and (idref = 0 and iqref = 0) (a) without harmonic isolation (b) with harmonic isolation using PR-based algorithm.
Energies 16 02729 g037
Table 1. Test setup.
FeedersNon-Linear Load Converters
RA = 0.6 Ω
LA = 530 µH
Single-phase diode rectifier
R = 10.67 Ω
LF1 = 250 µH
LF2 = 250 µH
C = 3333 µF
Table 2. Transformers’ data.
Transformer DataZ%r1x1r2x2
TA, TB66.0 kVA0.22:13.8 kV6%0.0130.04351.15168.6
T137.5 kVA600:1800 V5.3%0.060.260.542.34
Table 3. Controller setup.
Fundamental Frequency Control Loops
Current controller gains
Kpd = 10Kid = 100Kpq = 0.8Kiq = 120
Harmonic Frequency Control Loops
SRF-based ControlPR-based Control
K = −0.034Kp = 50
Krh3 = 9000Krh5 = 16,000Krh7 = 12,000
Krh9 = 7000Krh11 = 7000
Table 4. Main results summary.
Simulation Results
VS Type Non-Linear LoadFeeder 1
THDv (%)
Feeder 2
THDv (%)
Without harmonic isolation2.282.28
With harmonic isolation—PR and SRF-based control3.460.49
CS type non-linear load
Without harmonic isolation1.231.23
With harmonic isolation—SRF-based control0.493.46
With harmonic isolation—PR-based control0.532.05
Experimental Results: with vs. Type Non-Linear Load
SRF-Based ControlFeeder 1
THDv (%)
Feeder 2
THDv (%)
Radial4.71.6
Meshed without harmonic isolation2.22.2
Meshed with harmonic isolation3.02.2
PR-based Control
Radial6.61.6
Meshed without harmonic isolation2.92.8
Meshed with harmonic isolation5.31.9
Disclaimer/Publisher’s Note: The statements, opinions and data contained in all publications are solely those of the individual author(s) and contributor(s) and not of MDPI and/or the editor(s). MDPI and/or the editor(s) disclaim responsibility for any injury to people or property resulting from any ideas, methods, instructions or products referred to in the content.

