Abstract
Tackling climate change, implementing the principles of sustainable development and a closed-loop economy, and creating an economically and environmentally efficient waste management system are the most serious environmental and economic challenges today. One of the biggest problems with waste is that it causes water, soil, and air pollution. The combination of precipitation and septic processes produces leachates containing heavy metals and acids, which negatively affect surface and groundwater, changing their composition and pH, among other things. According to the Polish waste database, there are more than 2500 waste incineration plants operating worldwide, including more than 500 in Europe, while there are 8 in Poland. The concept of a closed-loop economy is based on the rational use of resources, i.e., less consumption of raw materials and energy by creating a closed loop of processes in which waste becomes raw materials in subsequent production stages. The aim of this study was to develop forecasts of electricity recovery from municipal waste using a prediction method based on an approximating function. The predictions made show that in 2023, the forecast of energy recovery from biodegradable municipal waste will be 6566 TJ. Projections of energy recovery from municipal waste for the future are steadily increasing, with planned recovery in 2030 at 9943 TJ.
1. Introduction
Power shortages in the energy market currently exist throughout Europe [1,2,3]. Virtually the entire continent is worried about planned and unplanned power outages. The current situation is the result of Russia’s decision to halt gas supplies via Nord Stream. As a result, gas and energy prices have risen significantly, and the energy crisis has deepened. This situation has been further complicated by gas leaks from Nord Stream1 and Nord Stream2. There is not enough coal and gas in Europe; therefore, if demand does not decrease, companies in particular are at risk of having their energy supply cut off. The amount of energy obtained from other sources is still relatively small to replace the use of fossil fuels [4,5,6,7,8,9]. With current climate and regulatory challenges and the high cost of purchasing carbon allowances, it is advisable to seek and produce energy from other sources, including municipal waste [10,11]. Revenues from the sale of heat generated from municipal waste in 2020 in Poland amounted to PLN 140 million. The average price of heat from municipal waste was PLN 34.91/GJ. This is the second lowest rate of all fuels after lignite [6]. It is also becoming necessary to transform to zero-emission technology and maximize the use of renewable energy sources.
Energy transition plays a very important role in the transition to a circular economy. It is to be expected that in the coming years, there will be an increasing share of energy production from clean sources, as well as from renewable sources, e.g., solar, wind, biofuels, and municipal waste. The transition to a closed-loop economy should take place at many levels, including at the household level [12,13,14,15,16].
A very important issue in a closed-loop economy is regeneration. Consumption of raw materials and energy should be minimized by creating closed processes. Waste from one process would then become raw materials in other processes. This would ensure the least possible consumption of resources and reduce waste production. For a closed-loop economy to work properly, meticulous planning and modernization of production processes are necessary [17,18,19,20]. In 2015, the European Commission adopted a roadmap for a circular economy, which should be competitive and generate continued growth and jobs. The adopted plan includes five priorities: critical raw materials; food waste; plastics; biomass and bioproducts; and construction and demolition waste. Reducing waste production, increasing the use of biological components, and advances in recycling should be the most important challenges for a modern and environmentally friendly economy [21,22,23,24,25,26]. A closed-cycle economy is a model for running an economy in which all products, materials, and raw materials should be used for as long as possible. The closed-loop economy strategy aims to bring benefits of environmental protection, increased innovation, and business competitiveness [27,28]. All this can be achieved by increasing the efficiency of the recycling system, reducing waste and emissions of harmful pollutants, and reducing energy consumption.
According to data from the European Environment Agency (EEA), the bioeconomy sector in the EU is growing quite well [29]. In 2014, it provided 9% of employment, and more than 25% of total material flows were in involved biomass. Today, these values are much higher. Agriculture provides about 63% of the EU’s total biomass, forestry provides 36%, and about 1% comes from fisheries. More than 62% of biomass from agriculture is used for food production, and almost 20% is used for energy and materials. In contrast, more than 1/3 of biomass from forests is used directly for energy production. Nearly half of the EU’s demand for wood products (such as paper) comes from recycling. Annual timber harvesting amounts to nearly 72% of annual forest growth [30,31,32,33,34].
The bioeconomy strategy includes research and innovation programs aiming to increase the use of biomaterials in an environmentally sustainable way [35,36,37,38,39,40]. In the EU, the most commonly used biomaterials are wood products, polymers, textiles, and fibers in composite materials. A particular challenge is to extend the life of biological products by putting them into recycling. Each year in the EU, approx. 140 million tons of biowaste are produced, of which about 100 million tons are food waste. In contrast, only about 25% of it is recycled; the rest ends up in landfills or is incinerated. This situation poses a threat to the environment, is a source of infectious diseases, and leachate from landfills can pollute surface and groundwater [41,42,43].
The last few years have seen rapid development of renewable energy sources (RESs), mainly wind and photovoltaic. Unfortunately, they are highly dependent on meteorological conditions. In turn, the diversity and number of these sources create new problems for transmission system operators, distribution system operators, and commercial operators. It is crucial for these companies to forecast production from RESs over different time horizons. Reliable forecasts positively influence energy market stabilization, power grid operation planning and development, and are an important element in ensuring the security and stability of the power system [44,45,46,47,48,49,50]. Because the number of energy sources is considerable and their unit power is relatively small, it makes economic sense to seek other forms of energy generation, including from municipal waste.
Currently, renewable energy is a very rapidly growing field of energy in Poland and worldwide. Preliminary estimates indicate that by 2050, half of energy will be produced from wind or solar power. This will happen thanks to a reduction in the cost of building power plants by up to 71%. Then, the cost of energy from wind can decrease by up to 58%. Wind conditions for energy purposes in Poland are described as average, but high enough to provide a potentially efficient source of renewable energy. For the country as a whole, annual average wind speeds range from 2.6 m/s to 3.8 m/s [51,52].
The development of energy storage technology is also not without significance [53,54]. In recent years, Poland has seen a significant increase in the total installed capacity of power plants using renewable energy sources. According to data from the Energy Regulatory Office, in mid-2018, the installed capacity of wind power plants was 5.856 GW (1199 wind installations), while for photovoltaic power plants, this value was 110.563 MW (602 photovoltaic installations). At the end of 2019, there was an increase in installed capacity, especially of photovoltaic power plants of 478 MW and slightly smaller wind power plants of 5.917 GW. The draft Energy Policy of Poland until 2040 indicates a further increase in the share of RESs in gross final energy consumption to at least 23% in 2030 [55]. Currently, RESs meet about 16% of energy demand (an increase of 2.5% compared to 2018) [56,57,58,59]. The main renewable energy sources in Poland are wind, biomass, solar, hydropower, biogas, and geothermal. Solar energy is an increasingly used renewable energy source worldwide.
With the development of renewable energy sources, it is necessary to develop tools to support operators in the efficient management of the grid. These tools include forecasting models of energy production from power plants using renewable energy sources. Currently, there is a rapid development of topics related to forecasting the volume of energy production, especially wind and photovoltaic power plants. Current forecasting methods relate mainly to single sources of energy production. The forecast of energy production is determined on the basis of point forecasts of meteorological conditions. Using such methods is quite labor-intensive and expensive due to the need to create a predictive model for a single source and due to the need to obtain such a meteo forecast. Therefore, taking into account the above problems and the increase in interest in electricity recovery from municipal waste, a statistical study was undertaken to create such a forecast. While there are many prediction models for wind and solar energy recovery in the literature, there are still relatively few such predictions for municipal waste. Therefore, the aim of this study was to develop forecasts of energy recovery from municipal waste using adaptation and prediction methods made on the basis of an approximating function.
2. Materials and Methods
The research was conducted based on data from the Central Statistical Office in Poland from 2008–2021 [60]. Acquisition of total primary energy in 2017–2020 in most of the EU-27 member states decreased, while there was an increasing trend in the acquisition of primary energy from renewable sources. In Poland in 2021, the amount of selectively collected waste per capita was 143 kg, including the following [60]:
- -
- Biodegradable waste: 49 kg per capita (42 kg in 2020);
- -
- Glass: 21 kg per capita (19 kg in 2020);
- -
- Bulky waste: 20 kg per capita (19 kg in 2020);
- -
- Mixed packaging waste: 16 kg per capita (14 kg in 2020);
- -
- Paper and cardboard: 14 kg per capita (13 kg in 2020);
- -
- Plastics: 14 kg per capita (13 kg in 2020).
In cities, 158 kg per capita was collected selectively in 2021, while in rural areas, 122 kg per capita was collected.
According to a morphological composition survey conducted in 2021 by the Institute of Environmental Protection, it was found that the highest share was reached by kitchen waste (18.3%). Another significant share was found for plastics (16.1%). Paper waste accounted for 12.8% and garden waste accounted for 11.8%. In the range of 5–10%, shares of morphological components were recorded for glass waste “other categories” and fractions < 10 mm. Analysis of the morphological composition of the category of paper waste accepted at municipal facilities confirmed the dominance of cardboard (almost 40%). Half the share was recorded for the fraction of other non-packaging paper (22.7%). The share of other subcategories was recorded at almost 20%. Analysis of the morphological composition of the category of plastic waste in mixed municipal waste showed that, of the subcategories highlighted, high-density polyethylene (PE-HD) and low-density polyethylene (PE-LD) film dominated at 45%. A much lower share was obtained by the polypropylene and polystyrene fraction (16.1%). Shares of less than 10% were found for the following: clear PET; household chemical packaging; other non-packaging; and blue PET. The lowest contents at 1.9% were obtained for green PET and PET mix. The share of colorless glass packaging in the main category of glass waste was almost 60%. The share of brown glass packaging was shown to be 22.7%, and other glass packaging was shown to be 18.6%. On the other hand, in the category of metal waste, the highest share was obtained for iron packaging (45.5%) and 40.9% for aluminum packaging.
In order to approximate the development of the trend in energy recovery from biodegradable municipal waste consumption in Poland (in TJ) over time, the development trend was assumed to be linear. The model of the development trend has the form of an equation in which the only explanatory variable is the time variable. This is a time series model in which there is a development trend and there are random fluctuations. The role of the explanatory variable in the equation is played by the time variable, which is not directly responsible for changes in the value of the forecast variable but synthesizes the influence of certain factors (including COVID-19) and yields a description of these changes in a quantitative way. One of them is the additive model, a linear model of the development trend, without taking into account periodic fluctuations. This model makes the following assumptions:
(1) The model of the development trend is built on the basis of the time series {Yt; t = 0, 1, n − 1}, when the elements of Yt do not contain periodic fluctuations;
(2) Random fluctuations are superimposed on the trend in the phenomenon in an additive manner.
The general form of this model is described by the following equation:
where Ht = E(Yt) trend function describing the development trend in the phenomenon under study, and ζt represents the random variable, representing random fluctuations resulting from, among other things, pandemics.
Yt = H(t) + ζt; (t = 0, 1, …, n − 1),
Finally, the form of the linear model of the development trend, without taking into account periodic fluctuations, is presented in the following equation:
Random fluctuation analysis was calculated using the following formula:
The value of the standard deviation of the residuals tells how much, on average, the values of the phenomenon observed in each period deviate from the theoretical values of the phenomenon due to random fluctuations resulting from, among other things, the pandemic.
Projections were made based on the classical linear trend model, according to the following equation:
where T = n − 1 + w forecast period, with w denoting the length of the forecast. The estimator of the average forecast error was determined using the following formula:
The most common linear function with one variable is used in the models, which has the form Y = α0 + α1X. The parameter α0 is interpreted as the level of the endogenous variable Y with zero level of the explanatory variable, while an increase in the value of the explanatory variable X by a unit causes a change in the value of the explanatory variable Y by α1 units [61,62,63,64,65].
The study used measured data from 14 years, so it was possible to account for the variability in energy recovery from municipal waste. The CSO data were the primary sources of information for forecasting models of energy recovery from waste. They may be subject to error and inaccuracy due to information obtained from annual waste management reports.
3. Results and Discussion
The increase in the share of renewable energy in total primary energy in 2020, compared to 2017 for Poland, was 7.3 percentage points, while in the EU-27, it was slightly higher at 7.9 percentage points.
The largest increases were in the Netherlands (12.5 p.p.), Germany (10.9 p.p.), and Slovakia (7.8 p.p.) (Figure 1). In 2020, in Poland, the share of renewable energy in total primary energy was 21.6%, while in the EU-27, it was 40.7%. The average annual growth rate of this indicator in 2017–2020 was 14.7% in Poland and 7.5% in the EU-27.
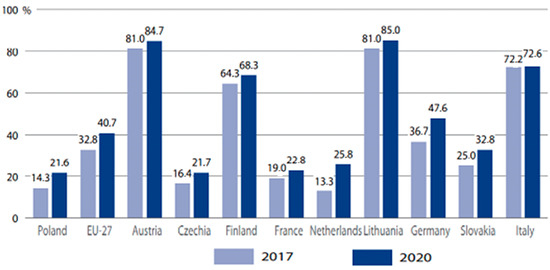
Figure 1.
Share of energy from renewable sources in total primary energy in 2017 and 2020. Source: Renewable energy in 2021, CSO, Warsaw, 2022.
The shares of renewable energy in final energy consumption in the EU-27 and Poland were 11.8% and 12.8%, respectively, in 2020. Between 2017 and 2020, there was an increase of 1.5 p.p. in the EU-27, and an increase of 4.1 p.p. in Poland. The increase in the share of energy from renewable sources in total energy consumption in EU countries in 2020, compared to 2017, was recorded in particular in Slovakia, Poland, and the Czech Republic (5.4, 4.1, and 3.7 p.p., respectively). A decrease in the share of renewable energy in total energy consumption was recorded only in Austria (by 0.2 percentage points). In the EU-27, the increase was 1.4 percentage points.
In 2020, the structures for obtaining energy from renewable sources in Poland and the EU-27 differed. Both Poland and the EU were dominated by solid biofuels, but in the case of Poland, they accounted for as much as 71.6%, while in the EU, this rate was only 40.1%. A more similar share was accounted for by the use of wind energy, with 10.9% in Poland and 14.7% in the EU. In third place in Poland are liquid biofuels (7.8%), while in the EU, this is water energy (12.8%) (Figure 2).
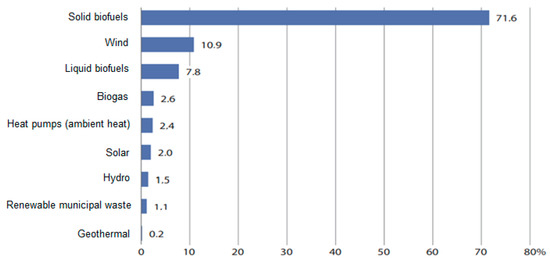
Figure 2.
Production of energy from renewable sources by carriers in Poland in 2020. Source: Renewable energy in 2021, CSO, Warsaw, 2022.
Energy from renewable municipal waste according to the National Statistical Reporting on Fuel and Energy Management also includes waste fuels from combustible industrial and municipal waste, such as rubber, plastics, waste oils, and other similar products (Figure 3). These are in solid or liquid form and are classified as renewable or non-renewable fuels, depending on whether they are biodegradable or not. Renewable fuels used in the generation of electricity and/or heat include municipal waste of biological origin, burned in appropriately adapted facilities. These are waste from households, hospitals, and the service sector (waste biomass) that contain biodegradable organic fractions.
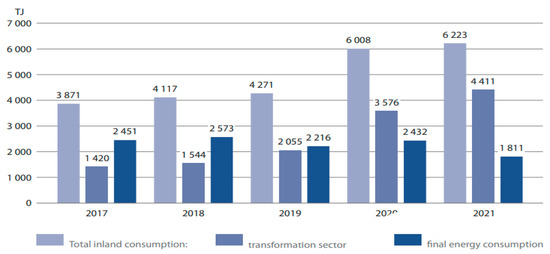
Figure 3.
Consumption biodegradable municipal waste. Source: Renewable energy in 2021, CSO, Warsaw, 2022.
The energy balance of biodegradable municipal waste is shown in Table 1. Between 2017 and 2021, there was a 60.8% increase in total domestic consumption (from 3871 TJ to 6223 TJ) and a 26.1% decrease in final consumption (from 2451 TJ to 1811 TJ). During the years in question, the largest increase in final consumption was recorded in trade and services (by 815%), while the mineral industry recorded a decrease of 98%. In addition, there was a more than three-fold increase in energy consumption per energy conversion input (from 1420 TJ to 4411 TJ) in industrial and commercial thermal power plants.

Table 1.
The balance of renewable energy commodities in the years 2017–2021 (renewable municipal waste).
From 2017 to 2021, there was an increase in heat production from renewable energy carriers to 23,511.4 TJ in 2021 (Figure 4). It should be noted that in 2017–2021, the share of solid biofuels in heat production remained at a similar level (the share in 2017 was 89.6%, and in 2021, the share was 89.08%). At the same time, there was a 3.3 p.p. increase in biogas and renewable municipal waste energy production (from 457 TJ in 2017 to 1599 TJ in 2021).
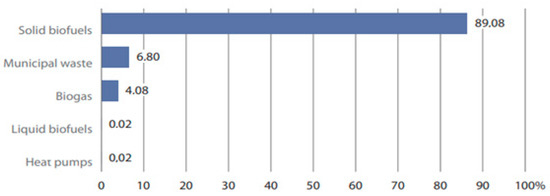
Figure 4.
Share of renewable energy carriers in heat production in 2021. Source: Renewable energy in 2021, CSO, Warsaw, 2022.
The share of renewable energy in a country’s gross total energy consumption measures the extent to which renewable energy sources have been used and, consequently, the extent to which renewable fuels have replaced fossil and nuclear fuels and thus contributed to the decarbonization of the EU economy. The indicator also illustrates the progress of EU countries in achieving one of the Europe 2020 strategy’s renewable energy targets. In 2020, with the share of renewable energy in gross final energy consumption at 16.1%, Poland was in 22nd position among EU countries. The highest share of renewable energy in final electricity consumption was recorded, as in previous years, in Sweden (60.1%), while the lowest was in Malta (10.7%), Luxembourg (11.7%), and Belgium (13.0%).
Generated municipal waste includes waste collected from property owners and selectively collected municipal solid waste. Waste collected from all residents is considered generated waste due to the inclusion of all property owners of waste management systems by municipalities as of 1 July 2013. In 2021, 13,674 thousand tons of municipal waste were generated, and there was a 4.2% increase in generation compared to the previous year. This means an increase in the amount of municipal waste generated per Polish resident from 344 kg in 2020 to 360 kg in 2021. The amount of municipal waste generated depends not only on the population, but also on consumption patterns. In 2021, there was a marked difference between provinces in the western part of the country and the eastern provinces. The western provinces produced significantly more municipal waste per capita than the eastern provinces. An even greater variation was seen among municipalities in terms of the amount of waste generated. With an average of 360 kg per capita in Poland in 2021, 24% of municipalities received less than 200 kg of municipal waste per capita (mainly rural municipalities), while 58% of municipalities generated between 200 and 400 kg per capita. On the other hand, between 400 and 600 kg per capita fell within 16% of municipalities. The largest amounts of municipal waste were generated in tourist municipalities—nine of them collected more than 1000 kg of municipal waste per capita.
In Poland, of the municipal waste collected and received in 2021, 8.2 million tons were destined for recovery (60% of municipal waste generated), of which 3.7 million tons (27%) were destined for recycling, 2.7 million tons (20%) were destined for thermal transformation with energy recovery, and 1.8 million tons (13%) were destined for biological treatment processes (composting or fermentation). A total of almost 5.5 million tons were diverted to disposal processes, of which 5.3 million tons were destined for land filling, and the remaining 0.2 million tons (1%) were destined for disposal by thermal conversion without energy recovery.
The amount of municipal waste collected selectively is increasing year by year. In 2005, selective collection accounted for only 3% of municipal waste collected (295,000 tons). In 2021, almost 5.5 million tons (40% of total municipal waste generated) were collected selectively, a 9% increase from the previous year (Figure 5).
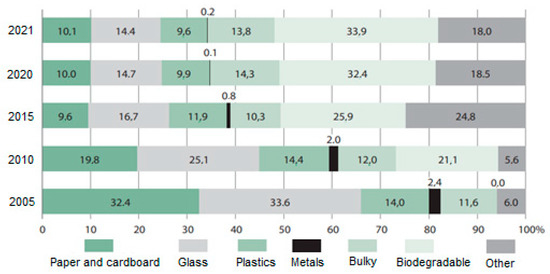
Figure 5.
Structure of separately collected municipal waste by waste fraction. Source: Environmental Protection 2022, CSO, Warsaw, 2022.
The ability to make forecasts with a selected time horizon depends on the available input data. Due to the collected dataset, models dedicated to forecasts with a horizon of several years or more have been proposed.
Based on the decomposition of the series, it was noted that there is an increasing development trend and random fluctuations in the time series of the variable under study. Performing graphical analysis, it was found that a straight line adequately describes the trend in growth in the recovery of electricity from municipal waste in Poland over time. The necessary intermediate calculations are shown in Table 2. The parameters of the linear trend function were estimated using the classical least-squares method. Using Equations (6) and (7), the following model parameter values were obtained: α1 = 482.44, α0 = −1153.2. Thus, the equation of the linear trend function describing the development of energy yield from biodegradable municipal waste consumption in 2008–2021 is as follows:
Yt = 482.44 − 1153.2t
Table 2.
Supporting calculations for determining the parameters of the trend function of energy recovery from biodegradable municipal waste consumption in (TJ) from 2008 to 2021.
The calculated coefficient α1 = 482.44, called the elasticity coefficient, informs that a 1-year increment in time caused an increase in energy recovery from biodegradable municipal waste of 482.44 TJ during the period under study.
Energy recovery forecasts for which the calculated ex-ante or ex-post forecast errors were determined for periods earlier than the period of the evaluated forecast were considered sufficient, acceptable, and appropriate for use in practice. In order to build a forecast of energy recovery of biodegradable municipal waste consumption for 2023–2030, data from 2008–2021 were used (Table 2). Smoothing the level of energy recovery from waste, i.e., elimination of fluctuations and extraction of the development trend, was conducted using the analytical method.
By determining forecasts using analytical models, function values were calculated for a future moment or period of time. Some important assumptions were made, the adoption of which determines how the forecast is made (extrapolation of the model) and how its quality is evaluated ex ante. The stability of structural relations over time was assumed, which means that the analytical form of the model and the values of its parameter evaluations do not change.
Energy recovery from the consumption of biodegradable municipal waste in Poland in 2008–2021, including the trend line, is shown in Figure 6. The square of the correlation coefficient, called the coefficient of determination, close to unity (0.925), indicates a good fit of the trend function in energy recovery of biodegradable municipal waste consumption in the years studied.
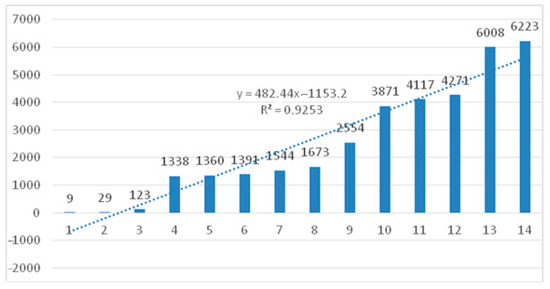
Figure 6.
Trend equation of energy recovery from biodegradable municipal waste consumption (in TJ) in 2008–21.
In order to optimally manage renewable energy in Poland, forecasts of energy recovery until 2030 were built based on the determined trend function (Table 3).
Table 3.
Forecasts and forecast errors of energy recovery from municipal waste until 2030.
Projections of energy recovery from waste consumption have been steadily increasing in subsequent years and should be at 7530.66 TJ in 2025 (Figure 7). Calculated errors, including the coefficient of convergence, indicate that only 7.47% of the information on energy recovery from waste was not explained by the describing variable.
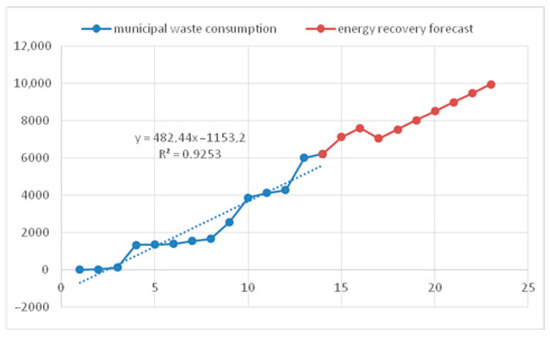
Figure 7.
Prediction of energy recovery from biodegradable municipal waste (in TJ).
In order to confirm the hypothesis of whether there is a trend in the studied time series, the null hypothesis α1 = 0 was verified against the alternative hypothesis α1 ≠ 0.
Null hypothesis: the parameter of the trend function—the trend coefficient is statistically significant, Ho: α1 = 0.
Alternative hypothesis: the parameter of the trend function—the trend coefficient is not statistically significant, H1: α1 ≠ 0.
The test value of the null hypothesis was t = 11.946. The result obtained was confronted with the critical value read from the tables of Student’s t-distribution at the confidence level α = 0.05 and 12 degrees of freedom, which was t0.0515 = 2.179. Thus, the null hypothesis Ho was rejected in favor of the alternative hypothesis H1 because the test value of the null hypothesis is greater than the critical value read from the tables of Student’s t-distribution (11.946 > 2.179). The trend coefficient was statistically significant, confirming the presence of a trend in the time series under study.
The Durbin–Watson (DW) test was used to test the hypothesis that the linear regression estimators satisfy Gauss–Markov assumptions. For the predictor k = 1 occurring in the model and the number of observations n = 14, the values dl = 1.04 and dg = 1.35 were read from the Durbin–Watson distribution tables. These values allowed us to determine the range of results, on the basis of which it was determined whether there was autocorrelation of the residuals. Formula (9) was used to calculate the DW test, and the calculations are shown in Table 2.
where DW refers to the Durbin–Watson test; e(i) refers to the residual in the regression model; e(i+1) is the subsequent residual in the regression model; and n is the number of observations.
The results obtained, DW < 2 and DW < dl, indicate the presence of positive autocorrelation. In many applications, the residuals of the model are correlated. This is especially true for models estimated from time series data. One of the main assumptions of regression analysis is that the predictors are not collinear. To verify this assumption, the collinearity index (VIF) was calculated using Formula (10):
The calculated collinearity coefficient was in the range of 1 < VIF < 10, indicating the presence of slight collinearity among the predictors.
According to forecasts by other authors, global energy consumption will increase by 44% by 2035 (compared to an increase of 55% over the previous 23 years), with 95% of the increase going to developing countries [66]. Another forecast to 2050, according to the BP Energy Outlook 2020 report, also assumes an increase in global energy demand. However, the structure of energy demand will change fundamentally as the role of fossil fuels will decrease, while the share of renewable energy and the importance of electricity will increase [67]. This should be seen as an opportunity to better manage municipal medium-calorie waste (including used disposable diapers and other nuisance hygiene waste) for energy purposes.
4. Conclusions
Waste is a huge, still untapped source of energy raw materials. Part of the waste is classified for reuse as a secondary raw material, while those that have sufficient energy value can be used to produce alternative fuels. Such fuels are obtained from recycled industrial and municipal waste (e.g., containing rubber, paper and plastics), from dried sewage sludge, from tires, and from bone and animal meat. The use of alternative fuels brings tangible environmental benefits; it saves non-renewable natural resources, helps solve the problem of landfill, and reduces greenhouse gas emissions. In this way, industrial production is carried out in accordance with the idea of sustainable development, in which future generations should have access to the kind of natural environment we have today. The novelty of the article is the development and testing of models that yield predictions of energy recovery from municipal waste in a closed-loop economy.
There is optimism in the fact that forecasts for energy recovery from biodegradable municipal waste for the next few years are steadily increasing. The planned recovery for 2030 is at 9943 TJ, an increase of 66% compared to 2020. The low coefficient of convergence (0.075) indicates that the trend function describes the energy recovery from municipal waste during the period studied well.
The amount of selectively collected waste varies widely in Poland and depends largely on how the system of collecting this type of waste has been organized by local authorities. In 2021, eighteen municipalities achieved a selective collection rate of more than 90% against all waste collected and received, while three municipalities collected selectively less than 10% of waste. However, mixed municipal waste dominates the waste generated. In 2021, this amounted to 8.2 million tons, or 60% of all municipal waste generated. Mixed waste is the main waste stream requiring disposal by land filling. The share of this waste handling process, despite a decrease from the previous year, is still too high. In 2021, it reached 38.7% (in 2020, it reached 39.8%). The number of active landfills is steadily decreasing and, at the end of 2021, there were 265 landfills accepting municipal waste (271 at the end of 2020). In 2021, eight landfills with a total area of 31 hectares were closed.
The energy recovery forecasts developed are important for strategic planning of the country’s development, not only in the area of the circular economy, but also in the areas of energy security, environmental protection, and production costs. They form part of the information base on which national evidence-based strategies and policies are shaped and modified. The solutions developed and tested can be an important reference for Polish policymakers, who can use them to assess the effectiveness of their actions and the need to adjust them if necessary. In addition, the developed forecasts can significantly simplify municipal waste management options for a closed-loop economy at the regional and national levels. Energy recovery from municipal waste is the only waste management method capable of closing a waste management system that meets the requirements of a closed-loop economy.
Author Contributions
Conceptualization, A.M.-K. and M.K.; methodology, A.M.-K. and M.K.; software, A.M.-K. and M.K.; validation, A.M.-K.; formal analysis, A.M.-K. and M.K.; investigation, A.M.-K. and M.K.; resources, A.M.-K. and M.K.; data curation, A.M.-K.; writing—original draft preparation, A.M.-K. and M.K.; writing and editing, A.M.-K. and M.K.; visualization, A.M.-K. and M.K.; supervision, A.M.-K. and M.K.; project management, A.M.-K. and M.K.; acquisition of funds, A.M.-K. All authors have read and agreed to the published version of the manuscript.
Funding
The work was sponsored by the Ministry of Education and Science. The funding number 173/23/B.
Data Availability Statement
The study used data from the Central Statistical Office, as indicated in the cited literature.
Conflicts of Interest
The authors declare no conflict of interest.
References
- Famulska, T.; Kaczmarzyk, J.; Grząba-Włoszek, M. Environmental Taxes in the Member States of the European Union—Trends in Energy Taxes. Energies 2022, 15, 8718. [Google Scholar] [CrossRef]
- Bajan, B.; Łukasiewicz, J.; Mrówczyńska-Kamińska, A. Energy Consumption and Its Structures in Food Production Systems of the Visegrad Group Countries Compared with Eu-15 Countries. Energies 2021, 14, 3945. [Google Scholar] [CrossRef]
- Beal, C.M.; King, C.W. The zero-emissions cost of energy: A policy concept. Prog. Energy 2022, 3, 023001. [Google Scholar] [CrossRef]
- Brodny, J.; Tutak, M. Analyzing Similarities between the European Union Countries in Terms of the Structure and Volume of Energy Production from Renewable Energy Sources. Energies 2020, 13, 913. [Google Scholar] [CrossRef]
- Dall-Orsoletta, A.; Romero, F.; Ferreira, P. Open and collaborative innovation for the energy transition: An exploratory study. Technol. Soc. 2022, 69, 101955. [Google Scholar] [CrossRef]
- Gajdzik, B.; Wolniak, R.; Grebski, W.W. An Econometric Model of the Operation of the Steel Industry in Poland in the Context of Process Heat and Energy Consumption. Energies 2022, 15, 7909. [Google Scholar] [CrossRef]
- Garcia-Torea, N.; Giordano-Spring, S.; Larrinaga, C.; Rivière-Giordano, G. Accounting for Carbon Emission Allowances: An Empirical Analysis in the EU ETS Phase 3. Soc. Environ. Account. J. 2022, 42, 93–115. [Google Scholar]
- Khandaker, S.; Das, S.; Hossain, M.T.; Islam, A.; Miah, M.R.; Awual, M.R. Sustainable approach for wastewater treatment using microbial fuel cells and green energy generation—A comprehensive review. J. Mol. Liq. 2021, 344, 117795. [Google Scholar] [CrossRef]
- Srivastava, R.K.; Shetti, N.P.; Reddy, K.R.; Nadagouda, M.N.; Badawi, M.; Bonilla-Petriciolet, A.; Aminabhavi, T.M. Valorization of biowastes for clean energy production, environmental depollution and soil fertility. J. Environ. Manag. 2023, 332, 117410. [Google Scholar]
- Açar, T.S.; Öz, N.A. The Determination of Optimal Cluster Number by Silhouette Index at Clustering of the European Union Member Countries and Candidate Turkey by Waste Indicators. Pamukkale Üniversitesi Mühendis. Bilim. Derg. 2020, 26, 481–487. [Google Scholar]
- Kastanaki, E.; Giannis, A. Energy decarbonisation in the European Union: Assessment of photovoltaic waste recycling potential. Renew. Energy 2022, 192, 1–13. [Google Scholar] [CrossRef]
- Khan, S.A.R.; Ibrahim, R.L.; Al-Amin, A.Q.; Yu, Z. An Ideology of Sustainability under Technological Revolution: Striving towards Sustainable Development. Sustainability 2022, 14, 4415. [Google Scholar] [CrossRef]
- Khandaker, S.; Bashar, M.M.; Islam, A.; Hossain, M.T.; Teo, S.H.; Awual, M.R. Sustainable energy generation from textile biowaste and its challenges: A comprehensive review. Renew. Sustain. Energy Rev. 2022, 157, 112051. [Google Scholar] [CrossRef]
- Łukasiewicz, K.; Pietrzak, P.; Kraciuk, J.; Kacperska, E.; Cieciora, M. Sustainable Energy Development—A Systematic Literature Review. Energies 2022, 15, 8284. [Google Scholar] [CrossRef]
- Miskinis, V.; Galinis, A.; Konstantinaviciute, I.; Lekavicius, V.; Neniskis, E. Comparative Analysis of the Energy Sector Development Trends and Forecast of Final Energy Demand in the Baltic States. Sustainability 2019, 11, 521. [Google Scholar]
- Liu, J.; Chen, Y.; Wang, X. Factors driving waste sorting in construction projects in China. J. Clean. Prod. 2022, 336, 130397. [Google Scholar]
- Howie, P.; Atakhanova, Z. Assessing initial conditions and ETS outcomes in a fossil-fuel dependent economy. Energy Strategy Rev. 2022, 40, 100818. [Google Scholar] [CrossRef]
- Xiao, Y.; Zuo, X.; Huang, J.; Konak, A.; Xu, Y. The continuous pollution routing problem. Appl. Math. Comput. 2020, 387, 125072. [Google Scholar]
- Monforti, F.; Huld, T.; Bódis, K.; Vitali, L.; D’isidoro, M.; Lacal-Arántegui, R. Assessing Complementarity of Wind and Solar Resources for Energy Production in Italy. A Monte Carlo Approach. Renew. Energy 2014, 63, 576–586. [Google Scholar] [CrossRef]
- Nielsen, H.; Warde, P.; Kander, A. East versus West: Energy intensity in coal-rich Europe, 1800–2000. Energy Policy 2018, 122, 75–83. [Google Scholar]
- Zhang, T.; Wu, X.; Shaheen, S.M.; Abdelrahman, H.; Ali, E.F.; Bolan, N.S.; Sik Ok, Y.; Li, G.; Tsang, D.C.W.; Rinklebe, J. Improving the humification and phosphorus flow during swine manure composting: A trial for enhancing the beneficial applications of hazardous biowastes. J. Hazard. Mater. 2022, 425, 127906. [Google Scholar] [CrossRef] [PubMed]
- Pérez, M.D.L.E.M.; Scholten, D.; Stegen, K.S. The multi-speed energy transition in Europe: Opportunities and challenges for EU energy security. Energy Strat. Rev. 2019, 26, 100415. [Google Scholar] [CrossRef]
- Pietrzak, M.B.; Olczyk, M.; Kuc-Czarnecka, M.E. Assessment of the Feasibility of Energy Transformation Processes in European Union Member States. Energies 2022, 15, 661. [Google Scholar] [CrossRef]
- Pilpola, S.; Arabzadeh, V.; Mikkola, J.; Lund, P.D. Analyzing National and Local Pathways to Carbon-Neutrality from Technology, Emissions, and Resilience Perspectives—Case of Finland. Energies 2019, 12, 949. [Google Scholar] [CrossRef]
- Potrč, S.; Čuček, L.; Martin, M.; Kravanja, Z. Sustainable renewable energy supply networks optimization—The gradual transition to a renewable energy system within the European Union by 2050. Renew. Sustain. Energy Rev. 2021, 146, 111186. [Google Scholar] [CrossRef]
- Martins, F.; Felgueiras, C.; Smitkova, M.; Caetano, N. Analysis of Fossil Fuel Energy Consumption and Environmental Impacts in European Countries. Energies 2019, 12, 964. [Google Scholar] [CrossRef]
- Wolde-Rufael, Y.; Weldemeskel, E.M. Environmental policy stringency, renewable energy consumption and CO2 emissions: Panel cointegration analysis for BRIICTS countries. Int. J. Green Energy 2020, 17, 568–582. [Google Scholar] [CrossRef]
- Abdelkareem, M.A.; Elsaid, K.; Wilberforce, T.; Kamil, M.; Sayed, E.T.; Olabi, A. Environmental Aspects of Fuel Cells: A Review. Sci. Total Environ. 2021, 752, 141803. [Google Scholar] [CrossRef]
- Salami, R.; Kordi, M.; Bolouri, P.; Delangiz, N.; Lajayer, B.A. Algae-Based Biorefinery as a Sustainable Renewable Resource. Circ. Econ. Sustain. 2021, 1, 1349–1365. [Google Scholar] [CrossRef]
- Afshan, S.; Ozturk, I.; Yaqoob, T. Facilitating renewable energy transition, ecological innovations and stringent environmental policies to improve ecological sustainability: Evidence from MM-QR method. Renew. Energy 2022, 196, 151–160. [Google Scholar] [CrossRef]
- Biresselioglu, M.E.; Demir, M.H.; Kaplan, M.D.; Solak, B. Individuals, collectives, and energy transition: Analysing the motivators and barriers of European decarbonisation. Energy Res. Soc. Sci. 2020, 66, 101493. [Google Scholar] [CrossRef]
- Burchart-Korol, D.; Pustejovska, P.; Blaut, A.; Jursova, S.; Korol, J. Comparative Life Cycle Assessment of Current and Future Electricity Generation Systems in the Czech Republic and Poland. Int. J. Life Cycle Assess. 2018, 23, 2165–2177. [Google Scholar] [CrossRef]
- Demetriou, E.; Mallouppas, G.; Hadjistassou, C. Embracing Carbon Neutral Electricity and Transportation Sectors in Cyprus. Energy 2021, 229, 120625. [Google Scholar] [CrossRef]
- European Commission. Communication from the Commission to the European Parliament, the Council, the European Economic and Social Committee and the Committee of the Regions: A Policy Framework for Climate and Energy in the Period from 2020 to 2030; European Commission: Brussel, Belgium, 2014. [Google Scholar]
- Wałachowska, A.; Ignasiak-Szulc, A. Comparison of Renewable Energy Sources in ‘New’ EU Member States in the Context of National Energy Transformations. Energies 2021, 14, 7963. [Google Scholar] [CrossRef]
- Wei, Y.; Zhu, R.; Tan, L. Emission trading scheme, technological innovation, and competitiveness: Evidence from China’s thermal power enterprises. J. Environ. Manag. 2022, 320, 115874. [Google Scholar] [CrossRef] [PubMed]
- Wang, W.; Zhang, Y.-J. Does China’s carbon emissions trading scheme affect the market power of high-carbon enterprises? Energy Econ. 2022, 108, 105906. [Google Scholar] [CrossRef]
- Van De Putte, J.; Short, R.; Beranek, J.; Thies, F.; Teske, S.; Dawe, A.; Hunter, J. Battle of the Grids. How Europe Can Go 100% Renewable and Phase out Dirty Energy; Greenpeace International: Amsterdam, The Netherlands, 2011. [Google Scholar]
- Swain, R.B.; Karimu, A.; Gråd, E. Sustainable development, renewable energy transformation and employment impact in the EU. Int. J. Sustain. Dev. World Ecol. 2022, 29, 695–708. [Google Scholar] [CrossRef]
- Suharevska, K.; Blumberga, D. Progress in Renewable Energy Technologies: Innovation Potential in Latvia. Environ. Clim. Technol. 2019, 23, 47–63. [Google Scholar] [CrossRef]
- Stec, M.; Grzebyk, M. Statistical Analysis of the Level of Development of Renewable Energy Sources in the Countries of the European Union. Energies 2022, 15, 8278. [Google Scholar] [CrossRef]
- Safarzynska, K.; van den Bergh, J.C. Industry Evolution, Rational Agents and the Transition to Sustainable Electricity Production. Energy Policy 2011, 39, 6440–6452. [Google Scholar] [CrossRef]
- Rokicki, T.; Perkowska, A. Diversity and Changes in the Energy Balance in EU Countries. Energies 2021, 14, 1098. [Google Scholar] [CrossRef]
- Quaranta, E.; Aggidis, G.; Boes, R.M.; Comoglio, C.; De Michele, C.; Patro, E.R.; Georgievskaia, E.; Harby, A.; Kougias, I.; Muntean, S.; et al. Assessing the energy potential of modernizing the European hydropower fleet. Energy Convers. Manag. 2021, 246, 114655. [Google Scholar] [CrossRef]
- Bórawski, P.; Bełdycka-Bórawska, A.; Szymańska, E.J.; Jankowski, K.J.; Dubis, B.; Dunn, J.W. Development of Renewable Energy Sources Market and Biofuels in The European Union. J. Clean. Prod. 2019, 228, 467–484. [Google Scholar] [CrossRef]
- Child, M.; Kemfert, C.; Bogdanov, D.; Breyer, C. Flexible Electricity Generation, Grid Exchange and Storage for the Transition to a 100% Renewable Energy System in Europe. Renew. Energy 2019, 139, 80–101. [Google Scholar] [CrossRef]
- Chudy-Laskowska, K.; Pisula, T. An Analysis of the Use of Energy from Conventional Fossil Fuels and Green Renewable Energy in the Context of the European Union’s Planned Energy Transformation. Energies 2022, 15, 7369. [Google Scholar] [CrossRef]
- Gaigalis, V.; Katinas, V. Analysis of the Renewable Energy Implementation and Prediction Prospects in Compliance with the EU Policy: A Case of Lithuania. Renew. Energy 2020, 151, 1016–1027. [Google Scholar] [CrossRef]
- Holjevac, N.; Baškarad, T.; Daković, J.; Krpan, M.; Zidar, M.; Kuzle, I. Challenges of High Renewable Energy Sources Integration in Power Systems—The Case of Croatia. Energies 2021, 14, 1047. [Google Scholar] [CrossRef]
- Kacperska, E.; Łukasiewicz, K.; Pietrzak, P. Use of Renewable Energy Sources in the European Union and the Visegrad Group Countries-Results of Cluster Analysis. Energies 2021, 14, 5680. [Google Scholar] [CrossRef]
- Wolniak, R.; Skotnicka-Zasadzień, B. Development of Photovoltaic Energy in EU Countries as an Alternative to Fossil Fuels. Energies 2022, 15, 662. [Google Scholar] [CrossRef]
- Zdonek, I.; Tokarski, S.; Mularczyk, A.; Turek, M. Evaluation of the Program Subsidizing Prosumer Photovoltaic Sources in Poland. Energies 2022, 15, 846. [Google Scholar] [CrossRef]
- Bluszcz, A.; Manowska, A. Differentiation of the Level of Sustainable Development of Energy Markets in the European Union Countries. Energies 2020, 13, 4882. [Google Scholar] [CrossRef]
- Mularczyk, A.; Zdonek, I.; Turek, M.; Tokarski, S. Intentions to Use Prosumer Photovoltaic Technology in Poland. Energies 2022, 15, 6300. [Google Scholar] [CrossRef]
- Poland’s Energy Policy until 2040. Urząd Regulacji Energetyki. Available online: www.ure.gov.pl (accessed on 27 December 2022).
- Miłek, D.; Nowak, P.; Latosińska, J. The Development of Renewable Energy Sources in the European Union in the Light of the European Green Deal. Energies 2022, 15, 5576. [Google Scholar] [CrossRef]
- Rybak, A.; Rybak, A.; Joostberens, J.; Kolev, S.D. Cluster Analysis of the EU-27 Countries in Light of the Guiding Principles of the European Green Deal, with Particular Emphasis on Poland. Energies 2022, 15, 5082. [Google Scholar] [CrossRef]
- Balezentis, T. Shrinking ageing population and other drivers of energy consumption and CO2 emission in the residential sector: A case from Eastern Europe. Energy Policy 2020, 140, 111433. [Google Scholar] [CrossRef]
- Jonek-Kowalska, I. Towards the reduction of CO2 emissions. Paths of pro-ecological transformation of energy mixes in European countries with an above-average share of coal in energy consumption. Resour. Policy 2022, 77, 102701. [Google Scholar] [CrossRef]
- CSO. Environmental Protection; CSO: Warsaw, Poland, 2022. [Google Scholar]
- Gils, H.C.; Scholz, Y.; Pregger, T.; de Tena, D.L.; Heide, D. Integrated Modelling of Variable Renewable Energy-Based Power Supply in Europe. Energy 2017, 123, 173–188. [Google Scholar] [CrossRef]
- Capros, P.; Zazias, G.; Evangelopoulou, S.; Kannavou, M.; Fotiou, T.; Siskos, P.; De Vita, A.; Sakellaris, K. Energy-System Modelling of the EU Strategy towards Climate-Neutrality. Energy Policy 2019, 134, 110960. [Google Scholar] [CrossRef]
- Lowitzsch, J.; Hoicka, C.E.; van Tulder, F.J. Renewable Energy Communities under the 2019 European Clean Energy Package—Governance Model for the Energy Clusters of the Future? Renew. Sustain. Energy Rev. 2020, 122, 109489. [Google Scholar] [CrossRef]
- Mehrtash, M.; Capitanescu, F.; Heiselberg, P.K.; Gibon, T.; Bertrand, A. An Enhanced Optimal PV and Battery Sizing Model for Zero Energy Buildings Considering Environmental Impacts. IEEE Trans. Ind. Appl. 2020, 56, 6846–6856. [Google Scholar] [CrossRef]
- Thomas, S. The British Model in Britain: Failing Slowly. Energy Policy 2006, 34, 583–600. [Google Scholar] [CrossRef]
- Peng, W.; Rupich, S.M.; Shafiq, N.; Gartstein, Y.N.; Malko, A.V.; Chabat, Y.J. Silicon Surface Modification and Charakterization for Emergent Photovoltaic Applications Based on Energy Transfer. Chem. Rev. 2015, 115, 12764. [Google Scholar] [CrossRef] [PubMed]
- Reimagining Energy for People and Our Planet; BP Energy Outlook 2020 Report; BP Australia Pty Limited: Docklands, Australia, 2020; p. 61.


Disclaimer/Publisher’s Note: The statements, opinions and data contained in all publications are solely those of the individual author(s) and contributor(s) and not of MDPI and/or the editor(s). MDPI and/or the editor(s) disclaim responsibility for any injury to people or property resulting from any ideas, methods, instructions or products referred to in the content. |
© 2023 by the authors. Licensee MDPI, Basel, Switzerland. This article is an open access article distributed under the terms and conditions of the Creative Commons Attribution (CC BY) license (https://creativecommons.org/licenses/by/4.0/).