Abstract
Thin copper and carbon coatings of electrodes of lithium-ion batteries (LIBs) have the potential to improve LIB operation by preserving electrode integrity during cycling, by developing a proper solid-electrolyte interphase (SEI) layer (e.g., by increasing the de-solvation rate), and by enhancing electric conductivity. In the structures, the thin coatings, e.g., copper thin films, must be permeable to Li+ ions in order to facilitate Li+ uptake and Li+ release in the electrochemically active material of coated electrodes beneath. The influences of copper and carbon thin coatings on LIB-electrode performance were investigated in this work by electrochemically cycling a [C(16 nm)/Cu(17 nm)] × 10 multilayer (ML) up to lithium plating. The C/Cu ML was deposited onto a copper current collector using ion beam sputtering. The rate capability and the long-time cycling were compared to the corresponding ones for the cycling of the bare copper substrate and 16 nm and 230 nm carbon single films (without Cu coating). The bare copper electrode does not store Li+ ions, which is as expected because copper is electrochemically inactive with respect to lithiation. The Li+ uptake and Li+ release in thin carbon layers capped by thin copper layers within the C/Cu ML is compared to that of uncapped carbon single thin films. All electrodes exhibited a good rate capability and long-term cycling stability. Under fast cycling, the amount of reversible Li+ uptake and Li+ release was largest for the case of the C/Cu ML, which pointed to the beneficial influence of the capping Cu layers. The higher Li kinetics in the C/Cu ML was confirmed using impedance analysis. The C/Cu ML behaves as a supercapacitor possessing a differential charge plot nearly independent of potential. At lower currents, the specific capacity of the C/Cu ML is only 20% of that of the thin carbon single films, with that of the latter being the same as that of graphite. On the one hand, this evidences a disadvantageous influence of the thin Cu layers, which block the Li+ permeation, that is necessary to reach deeper carbon layers of the C/Cu ML electrode. On the other hand, the differential capacity plots reveal that the carbon material in the interior of the C/Cu ML is electrochemically cycled. Microscopy, Raman scattering, depth profiling with X-ray reflectometry (XRR), and secondary ion mass spectrometry (SIMS) were applied to get deep insights and a comprehensive examination of the contradiction. The XRR examination revealed a non-altered ML after more than 542 electrochemical cycles, after the washing procedure, and even after 15 months of air exposure. This observation suggests that the copper layers block contamination as well as the Li insertion. The analyses of microscopy, Raman, and SIMS affirm the ML intactness but also reveal the participation of some portions of the interior of the C/Cu ML in electrochemical cycling. The low capacity of carbon in the C/Cu ML may stem from the mechanical stress inside the C/Cu ML, which reduces the Li+ uptake and Li+ release.
1. Introduction
Carbon is widely used in negative electrodes (here termed anodes) of lithium-ion batteries (LIBs) and has been heavily investigated. The Web of Science core collection reports up to date more than 27 thousand publications when the terms “carbon” and “lithium-ion battery” are used in the search, including 1894 reviews. There are hundreds of carbon types that can be used as anodes in LIBs [1]. A recent work [2] presents, alongside new data on carbon single-films, an up-to-date review of the different types of carbon used in LIBs. In short, graphite was found to be the best carbon material for LIB operation because it possesses a low potential hysteresis and low irreversible Li+ uptake [1,2], with at least a 2000 cycle life and a considerable Li+ reversible storage capacity of 372 mAhg−1 [1,2,3,4,5,6]. Hence, graphite is omnipresent as an electrochemically active material in the negative electrodes of commercial LIBs.
Although graphite has the advantage of low potential hysteresis and low irreversible Li+ insertion, it still has some disadvantages. Graphite can exfoliate with electrolyte solvent co-intercalation [6,7,8,9]. Solvent co-intercalation in between the densely packed carbon (0001) atomic layers can cause a huge increase in volume which pulverizes the carbon electrode. To prevent this aging effect, the coating of carbon with, e.g., copper, was investigated [10,11,12,13]. Copper-coating was found to suppress the exfoliation of graphite by preventing solvent co-intercalation. The effect of the copper coating is related to a sort of catalytic effect of copper, which increases the de-solvation rate [11,12,13,14,15]. The use of nanoscale metal films deposited on the surface of graphite electrodes was demonstrated to reduce capacity fade under repetitive fast charging conditions [15]. The copper coating enhanced even the capacity of graphite itself [13,16]. The benefits of the copper coating on carbon electrodes can be attributed to the increase of electrical conductivity and the formation of a suitable solid electrolyte interphase (SEI) layer. On the one hand, the thinner the Cu coatings, the less effective they are regarding the reduction of the aging effects. A 5 nm thin Cu coating on graphite was observed to be less effective in preventing aging effects than a 20 nm thin Cu coating [15]. On the other hand, thicker coatings were found to reduce the Li+ storage capacity of the carbon electrodes. Investigation of the relationship between the Cu coating thickness and the amount of reversible Li+ uptake from a carbon fiber covered with a Cu film found a 50% decrease in reversible Li+ storage capacity from 8 nm to 100 nm in the Cu film thickness [16]. For Cu coatings thicker than 30 nm, investigation based on impedance spectroscopy found an increase in the charge transfer resistance, which is attributed to the presence of a barrier for Li+ permeation through the Cu film [12]. Thicker Cu films may act as a physical barrier toward Li+ transport [12,16,17]. Regarding this issue, let us mention that the ability of a material to conduct Li+ ions can be tailored by miniaturization (confinement). Recently, the Li permeability in amorphous silicon (a-Si) thin films was reported to increase by many orders of magnitude if the layer thickness is below 30 nm [18,19]. Hence, in order to gain both benefits, (i) to avoid the aging effects of carbon and (ii) to enhance reversible Li+ insertion into carbon, the thickness of the metal coatings should be between 10 and 30 nm.
The Li permeability results reported in references [18,19] were obtained from experiments on silicon because silicon is the most desired material for huge charge storage in LIBs [20,21,22,23,24,25,26,27,28,29,30,31,32,33,34,35,36,37,38,39,40,41]. Silicon can store lithium up to a Li concentration corresponding to Li15Si4 (3579 mAhg−1) [42], which is approximately ten times higher than graphite (LiC6, 372 mAhg−1) [1]. The high amount of Li+ storage in silicon produces a ~300% volume change with inevitable electrode degradation, resulting in fracture-induced capacity loss [21]. The failure mechanisms of Si-based electrodes include cracking, pulverization, porosity, loss of electrical contact, and excessive formation of the SEI layer [41]. There are attempts to reduce the destruction by depositing Cu films on the silicon surface. The ductility and strength of copper are thought to limit the cracking of brittle silicon, stop exhaustive SEI formation, and enhance electrical conductivity and, in that way, avoid LIB failure [43,44]. Cracks expose fresh silicon to electrolytes and promote excessive SEI formation and Li consumption. The repeated exposure of silicon surfaces to the electrolyte further consumes Li for the new SEI formation, which decreases the Li stock available for reversible cycling. Indeed, experiments have shown that the volume increase during lithiation is partially suppressed if silicon is coated with copper [44]. However, there is no insight into whether the beneficial effect of Cu coating stems from the intrinsic property of the copper material (e.g., mechanical properties) or from a copper–silicon alloy which is thermodynamically favorable and presents at the Cu–Si interface during film deposition [45]. If Cu is deposited on amorphous silicon, fast nucleation of 10–20 nm Cu3Si takes place even at very low temperatures [46,47]. Dynamic segregation during deposition creates a thick mixed zone between copper and silicon.
Copper forms alloys with silicon [45] but not with carbon [48], and hence Cu–C alloying is not expected in the Cu/C electrode. Consequently, in order to investigate the effect of the Cu overlayer alone, we decided to electrochemically examine Cu-coated carbon. This was performed by studying the cycling performance of a C/Cu multilayer (ML) consisting of ten C/Cu bilayers with a thickness of approximately 16 nm for each single layer (for both Cu and C layers), in direct comparison with a bare copper electrode and with electrodes made solely from a single 16 nm or 230 nm thin carbon film without a Cu coating. An ML arrangement was selected to amplify the influence of the thin copper layers on the carbon material and to amplify the information obtained from low-angle x-ray scattering measurements. In the ML, the Li+ ions have to permeate consecutively through thin Cu layers, and this permeability is investigated as well. Note that the cycling and examination of the C/Cu MLs are the main focus of this work. The cycling of carbon single thin films is presented only for a direct comparison of the cycling results of the C/Cu MLs, to help interpret the results achieved on the C/Cu MLs. Details about the cycling of the carbon single thin films are given in reference [2]. To this end, it needs to be pointed out that cathodes also tend to react with electrolytes [49]. The release of gases following the decomposition of active components and combustion of the gaseous by-products may lead to an LIB explosion [49]. Hence, it is evident that surface coating to improve electrode stability, enhance the electrochemical performance, and prevent detrimental surface reactions between electrode material and electrolyte, is not restricted only to anodes. A recent work [49] reviews different types of surface coatings for cathode materials, as well as the comparison of the changes in the electrochemical performance of those materials with and without an applied coating.
This article is organized as follows. Section 2 describes the electrodes, the electrochemical cell, the measurement techniques, and the cycling procedure. Section 3 presents and discusses the data obtained from the C/Cu MLs in direct comparison to the blank electrode (i.e., without carbon), and to the 16 and 230 nm carbon single films, for a proper interpretation of the results. In Section 3.1, the characterization of the C/Cu ML is presented before the electrode is assembled into an electrochemical cell. Section 3.2 presents the results of rate capability. Section 3.3 discusses the obtained differential charge plots. The results from electrochemical impedance spectroscopy (EIS) are presented and analyzed in Section 3.4. The unexpected electrochemical results provoked further investigations of ex situ microscopy, X-ray reflectometry, Raman spectroscopy, and secondary ion mass spectrometry (SIMS), which are presented in Section 3.5. Section 4 presents remarks, open questions, and an outlook. The findings are summarized in Section 5.
2. Experimental Procedure
The electrochemical characterization was performed using a self-constructed three-electrode electrochemical cell. Propylene carbonate (PC, Sigma Aldrich, Taufkirchen, Germany, anhydrous, 99.7%) with 1 M LiClO4 (Sigma Aldrich, Taufkirchen, Germany, battery grade) was used as an electrolyte. No separator was used due to the large distance of 30 mm between the electrodes. The cell was assembled and disassembled within a glovebox filled with argon gas and the partial pressures of O2 and H2O being less than 1 ppm.
The working electrode consists of a polished, 1-inch quartz crystal disc of 3.2 mm thickness with a 15 nm thin chromium film as an adhesion layer for a 230 nm thick copper current collector film and a C/Cu multilayer or single carbon thin-film as active material. The C/Cu ML started with a 16 nm thin C layer followed by a stack of ten [C(16 nm)/Cu(17 nm)] double layers, and the ML is, hence, ended with a C layer. Consequently, there are ten Cu layers and eleven C layers in the ML, which is denoted as C/Cu ML (see Table 1). The layer deposition was performed by ion-beam sputtering as described in reference [50].

Table 1.
Parameters used for the simulation of the X-ray reflectivity pattern (shown later in the next section) by the Parratt32 code, i.e., for the as-deposited C/Cu ML electrode.
The counter and reference electrodes were lithium plates (1.5 mm in thickness, 99.9%, Alfa Aesar, Kandel, Germany). The Li+ insertion process into the C/Cu ML electrode (Li+ uptake) and the Li+ extraction process from the C/Cu ML electrode (Li+ release) are referred to as the lithiation and delithiation processes, respectively. The galvanostatic lithiation and delithiation operation are further denoted as constant current (CC) lithiation and delithiation, respectively. Cycling was performed with CC. A cycling protocol to test the rate-capability by stepwise increasing the current density after each fifth cycle from 13 to 1163 µAcm−2 and then stepwise decreasing the current density after each fifth cycle back to 13 µAcm−2 was used.
The CC operations were performed on a Biologic SP150 potentiostat with EC-lab software. All experiments were performed at room temperature. The lithiations were conducted up to Li-plating, using negative potential with respect to the lithium-metal reference electrode to correct the lithiation process from overpotential (see, e.g., Figure 2 in reference [2]). Concerning Li-plating recognition, the reader is referred to review [51]. The cut-off voltage for the delithiation process was set at 3 V for an overpotential lower than 0.1 V. Higher cut-off potentials were set corresponding to higher overvoltages which usually appear at a higher current density. Potentiostatic electrochemical impedance spectroscopy (PEIS) was performed with 10 mV amplitude at open circuit voltage (OCV).
The radius of the lithiated surface, the thicknesses of the carbon single-films and carbon layers in the C/Cu ML, and their mass density are crucial parameters for the capacity calculation. The mass densities of the carbon films and the carbon layers in the C/Cu ML are 2 gcm−3, determined using neutron reflectometry (NR) [50] and X-ray reflectometry (XRR) measurements (Table 1). Grazing incidence X-ray diffraction (GI-XRD) confirms the carbon films and the layers in the C/Cu ML to be amorphous, i.e., no long-range order. The copper layers were polycrystalline with an fcc(111) texture. Raman scattering found the carbon layers in the C/Cu ML and the carbon single films to be amorphous and predominantly of graphitic (sp2) bonding configuration (Figure 1). The layer thickness was determined by XRR (Table 1). The diameter of the lithiated zone was determined visually on the electrode surface to ~17 mm after cell disassembling. The appendix of reference [2] presents how the electrochemical results and the errors were calculated.
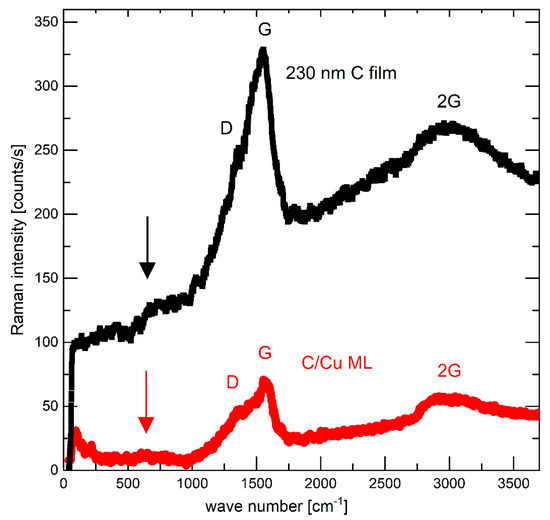
Figure 1.
Raman spectra of the as-deposited 230 nm carbon film (upper black curve) and the electrode with a C/Cu ML (lower red curve) in the delithiated state of charge (SOC) after 542 lithiation/delithiation cycles, after washing the electrode, respectively, with solvent PC and acetonitrile, and after air exposure for 15 months. A color version of this figure can be viewed online.
XRD and XRR were performed on a Bruker D8 DISCOVER diffractometer and a Panalytical Empyrean diffractometer (CuKα, 40 keV, 40 mA). Raman scattering analysis was conducted on a Bruker SENTERRA Raman microscope with a laser of 532 nm wavelength. SIMS measurements were done on a CAMECA IMS-3F/4F machine with a double-focused mass spectrometer and O2+ (5 keV, ~100 nA) primary ion beam. Positive secondary ions were recorded. Micrographs were taken on a ZEISS AXIO ImagerM2m light optical microscope. The XRD, XRR, Raman, and SIMS measurements were performed ex situ in air and at room temperature.
3. Results and Discussion
3.1. Electrode Characterization before Electrochemical Cycling
Prior to electrochemical cycling, the electrodes were examined intentionally only with non-destructive techniques, i.e., with Raman scattering and X-ray scattering (XRR and GI-XRD) to maintain the electrode integrity on the microscale. Figure 1 presents the typical Raman spectrum (black squares) of the carbon materials, which allows non-destructive analysis of the bonding configuration of all carbon structures (graphite, diamond, graphene, nanotube, fullerenes) [52,53,54,55,56]. Amorphous carbon films are assumed to possess intermediate structures between graphite (fully sp2) and diamond (fully sp3). The Raman spectrum of the carbon films (Figure 1) resembles the typical Raman spectrum of amorphous carbon with low content sp3 structure which is also called sp2 hybridized low-density carbon. The vertical arrows in Figure 1 point to broad peaks centered around 600 cm−1, which have been found for hydrogen-free carbon films [53].
Figure 2 presents the XRR pattern of the electrode without (Figure 2a,b) and with the C/Cu ML (Figure 2c) before mounting into the electrochemical cell. The XRR data of the C/Cu ML is dominated by strong and sharp Bragg reflexes (peaks) of an even higher order. This result indicates a good C/Cu laminar structure with a low interface roughness of ~1 nm. The continuous black lines in Figure 2a,c represent the XRR-simulation results which were found by best-fitting the measured XRR data. The XRR-simulation results reproduce well the XRR data of the C/Cu ML. The depth profile of the X-ray scattering length density is presented in Figure 2d. The parameters (thickness, mass density, and interface roughness for all layers) used for the best-fit simulation are listed in Table 1. It can be observed that (i) the interface roughness is for all layers below 1 nm, confirming the good quality of the C/Cu ML, and (ii) the mass density of the carbon layers is low, validating the Raman result of low-density carbon. The thicknesses of the copper and carbon individual layers were found to be ~17 nm and ~16 nm, respectively. The thickness of the carbon single films was also obtained with the XRR experiments to be ~16 nm and ~230 nm for the thinner and thicker carbon films, respectively.
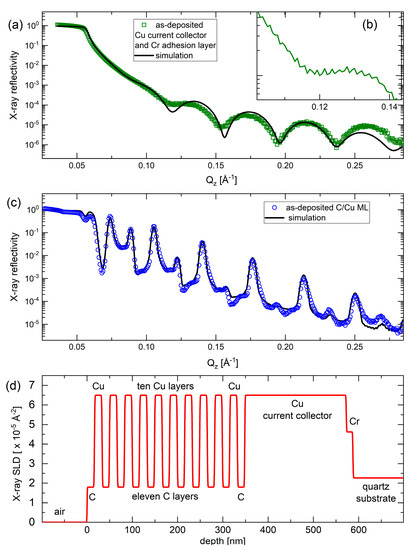
Figure 2.
(a,b) XRR pattern (green squares in (a) and green curve in (b) (inset)) and XRR-simulation result (black line in (a)) on the blank electrode (without the C/Cu ML). Panel (b) is a cutout of the XRR data for a better visualization of the tiny oscillation due to the 230 nm thick copper current collector. (c) XRR pattern (blue circles) and XRR-simulation result (black line) on the C/Cu ML electrode before mounting the electrode into the electrochemical cell. The X-ray reflectivity represents the fraction between the intensities of the reflected and primary X-ray beams. (d) Depth profile of the X-ray scattering length density of the XRR-simulation result presented in (c). The measurement results were collected on a Panalytical Empyrean diffractometer. A color version of this figure can be viewed online.
3.2. Rate Capability: Li+ Uptake and Release Charge Density and Capacity
The rate capability was examined using consecutive packets of five CC cycles. The current density within the packet of five cycles is maintained constant. Consecutive cycling with the configurations of packets was performed with stepwise ascending current densities from 13 to 1163 µAcm−2, followed by stepwise descending current densities from 1163 back to 13 µAcm−2, as inscribed in Figure 3. Afterward, hundreds of cycles were performed. The lithiation was stopped before the onset of Li-plating.
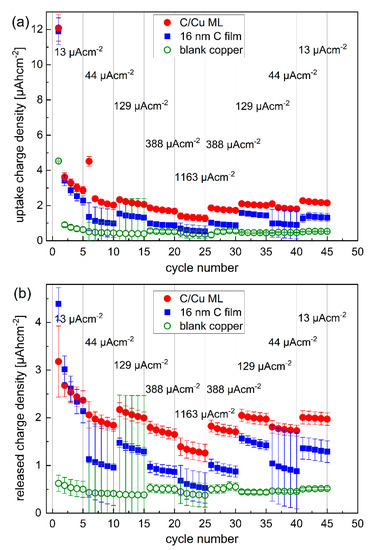
Figure 3.
Inserted (a) and released (b) Li+ charge density into and from the C/Cu ML electrode (red dots), respectively, compared to that of the 16 nm carbon film (blue squares) and to the electrode without carbon (green open circles). After each packet of five cycles (marked with thin vertical gray lines), the current density was stepwise increased from 13 to 1163 µAcm−2 and subsequently stepwise decreased to 13 µAcm−2. A color version of this figure can be viewed online.
Figure 3 presents the Li+ charge density inserted and extracted to and from the electrode with a bare copper current collector, a 16 nm carbon single-film, and the C/Cu ML during the CC cycling. Overall, the Li+ uptake and release are higher for the carbon-based electrodes than for the electrode without carbon material, as expected. The Li+ uptake and release in the first cycle are higher than in other cycles. There is a higher Li+ uptake than release for all the electrodes in the first cycle, evidencing that a considerable amount of Li+ remains in the electrode and does not participate in further cycling anymore. The difference between the Li+ uptake and release diminishes for further cycling. The Li+ uptake and release are higher for the C/Cu ML than for the 16 nm carbon film, but not as much as expected. The eleven carbon layers in the C/Cu ML result in a 179 nm total carbon thickness in the C/Cu ML, which should lead to an eleven times larger amount of Li+ uptake and release compared to the single 16 nm carbon film. The unexpectedly low Li+ uptake and release of the C/Cu ML are also observed in their specific capacities (Figure 4 and Figure 5).
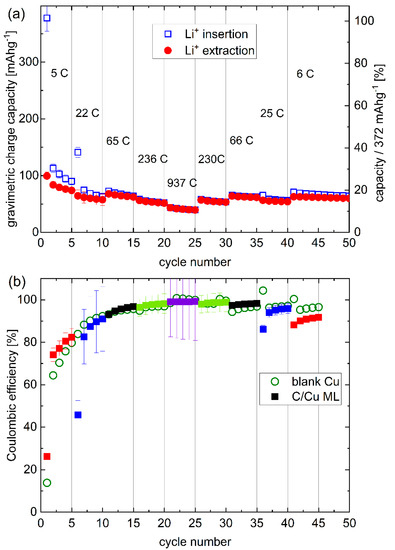
Figure 4.
Rate capability: (a) Gravimetric capacity, and (b) Coulombic efficiency (CE) of the C/Cu ML electrode for the cycling inscribed in Figure 3. The CE of the C/Cu ML is plotted with filled squares. The different colors denote the different current densities (see Figure 3). The CE of the blank copper electrode is plotted with open circles. The rates are given for every fifth cycle. A color version of this figure can be viewed online.
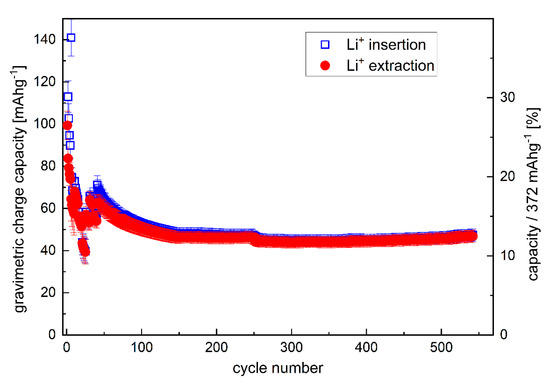
Figure 5.
Variation of the gravimetric capacity of the C/Cu ML with cycle number. A color version of this figure can be viewed online.
We assume that only the carbon material in the electrodes is the electrochemically active material. Under such a case, the gravimetric capacity is obtained by dividing the Li+ charge uptake (Figure 3a) and release (Figure 3b) with the carbon mass, which obviously cannot be calculated for the electrode without carbon (blank copper electrode). The volumetric capacity is obtained by multiplying the gravimetric capacity with the mass density of the carbon layers (see Table 1). Although the charge uptake and release are higher in the C/Cu ML than in the single carbon film, the capacity of the C/Cu ML (Figure 4) is lower than that of the 16 nm carbon single film (Figure 6 of reference [2]) because the Li charge for the C/Cu ML is divided by a carbon mass that is eleven times larger than that of the 16 nm carbon film.
Figure 4a presents a variation of the gravimetric capacity for Li+ uptake and release of the electrode of a C/Cu ML with the cycle number. The right y-axis is the normalized capacity by the maximal capacity of graphite. The Coulombic efficiencies (CEs, Figure 4b) obtained from the C/Cu ML (filled squares) are similar to that of the blank copper (unfilled green circles). The CE is more than 90% after the 10th cycle, revealing a good reversible Li+ insertion. At high current densities, large rates of up to 937C (Figure 4) appear, which means that full lithiation is reached in less than 4 s. The results from the test under 44 µAcm−2 do not follow the trends with other current densities. The capacities of cycles 6–10 and 35–40 are lower than expected because the Li+ insertion was stopped prematurely, i.e., before the onset of Li plating. The lower cut-off was set at 0.001 V vs. Li metal reference electrode. An overpotential correction was not done because of the expected low overpotentials at low current densities (see Figure 6a,b,h,i). For higher current densities, the overpotential increases, and the lithiation process was performed up to Li-plating onset by using negative cut-off potential vs. Li metal reference electrode (Figure 6c–g).
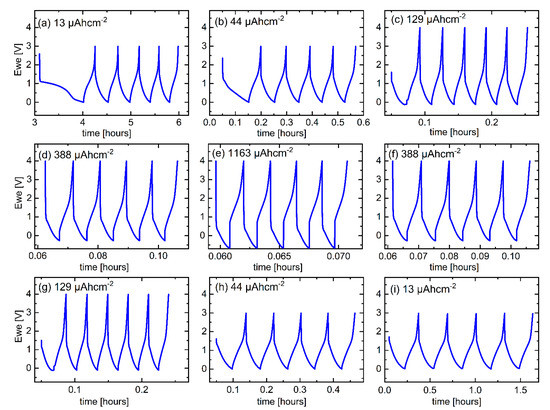
Figure 6.
CC potential profiles measured during the rate capability experiment for the C/Cu ML for (a–e) ascending current densities and (f–i) descending current densities after each pack of five cycles. A color version of this figure can be viewed online.
The C/Cu ML possesses a good cycling performance but has capacities lower than 20% of pure graphite (Figure 4). The capacity does not increase for hundreds of further cycles at a rate of 7C (Figure 5) but stabilizes at ~12% of the maximum graphite capacity. The cycling of the single 16 nm carbon film shows capacities as high as that of graphite (Figure 6 of reference [2]).
The presented Li+ charge densities (Figure 3) and capacities (Figure 4 and Figure 5) do not decrypt the origin of the reversible and irreversible capacities, but some information on that issue can be obtained from differential charge curves, which show how much Li+ is inserted and extracted at each electrode potential, i.e., it answers the question at which potentials predominant reversible and irreversible Li+ uptake takes place. These facts are discussed in the next subsection.
3.3. Rate Capability: Differential Charge and Differential Capacity Plots
The differential charge plots (and cyclic voltammetry (CV) curves) unfold the inserted and released charge in its individual dependence on the electrode potential. Peaks in dQ/dV plots correspond to flat regions of the CC potential profile and reveal potentials of predominant Li+ uptake and release processes. The shape of differential charge (dQ/dV) plots is similar to that of CV curves, the latter being widely applied to characterize electrochemical performance [2,39]. Both presentations, i.e., dQ/dV plots and CV curves, present the amount of Li+ uptake and release at each potential value and, obviously, possess similar shapes.
Differential charge plots were calculated from the potential profiles presented in Figure 6. Figure 7a,b presents the dQ/dV plots of the first, second, and fifth cycles on the C/Cu ML and the 16 nm carbon single film, respectively. The Li+ uptake (release) process corresponds to the negative (positive) y-axis values. The area between the dQ/dV plot and the y = 0 line corresponds to the total Li+ charge uptake (negative values) and release (positive values). The high irreversible Li+ consumption in the first cycle observed in the integrated results, as presented in Figure 3, can also be observed in the deconvolution presented in Figure 7a,b. The Li+ uptake (negative values) is larger than the corresponding Li+ release (positive values). In the first cycle, there are three predominant Li+ uptake peaks, marked with roman numerals I, II, and III in Figure 7. The peaks I and II are more accentuated for the C/Cu ML and carbon single film, respectively.
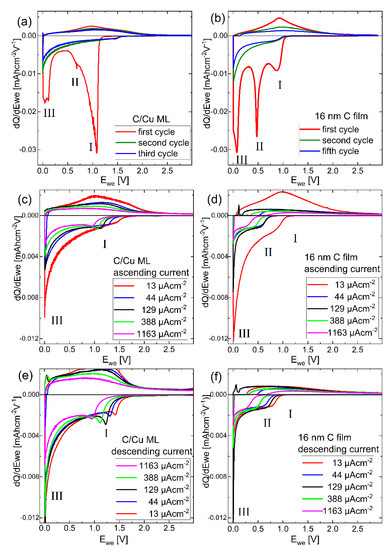
Figure 7.
Differential charge plots (dQ/dV curves) of (a,b) the 1st, 2nd, and 5th CC cycle with 13 µAhcm−2, (c,d) the 2nd, 7th, 12th, 17th, and 22nd cycle for the ascending current, (e,f) 22nd, 28th, 33rd, 38th and 43rd cycle for the descending current for the (a,c,e) C/Cu ML and (b,d,f) carbon single-film. A color version of this figure can be viewed online.
For graphite electrodes, CV experiments reveal, below a potential of 0.3 V vs. the Li reference electrode, several peaks due to the formation of various LixC6 phases (with x ≤ 1) from lithium intercalation [57,58,59,60]. CV peaks at higher voltages are attributed to the decomposition of carbonate electrolytes (e.g., PC) to form an SEI layer on the graphite electrode [4,60]. Consequently, peak III may be ascribed to the Li+ intercalation process inside the carbon material of the C/Cu ML and single film, and peaks II and I to the processes occurring on the electrode surface (SEI layer formation) or to irreversible Li bonding inside carbon to impurities such as oxygen and nitrogen [5]. A recent review lists the chemical species found in the SEI layer on graphite, carbon, silicon, and other electrode materials [61]. The organic and inorganic species in the SEI are likely due to the reduction of the electrolyte solvent and electrolyte Li-salt, respectively [61].
The dQ/dV curves of the second and fifth cycles are similar to each other (Figure 7a,b). For the second cycle, all peaks decrease, even peak III, which is related to the bulk process of Li intercalation inside the graphitic stack of graphene sheets. This result illustrates that in the first cycle, more than half of the Li+ intercalation process (peak III) is irreversible, which is related to Li-trapping on defects inside the amorphous carbon material. After the first cycle, the dQ/dV plots are less structured (Figure 7c–f), resembling that of electrochemical capacitors.
The rectangular shape and the potential independence (see Figure 7c–f), together with the high-rate capability (i.e., fast reversible charging, Figure 4 and Figure 5), show that the carbon single-film and the carbon layers in the C/Cu ML behave like supercapacitors [62,63,64]. They represent a carbon-based material that exhibits a pseudo-capacitive response of a sloping potential dependence with the extent of charge and operates far from equilibrium at a sub-minute time scale (high rates in Figure 4) [64]. The pseudo-capacitance does not mean that cycling occurs exclusively at the film surface. The mechanism of energy storage in pseudo-capacitive materials constitutes a reversible Li+ insertion into confined regions in the interior of films, even on a sub-minute time scale [64]. Further discussion is continued by comparing the dQ/dV plots of the C/Cu ML directly with those from the bare copper current collector and from the thinnest (16 nm) and thickest (230 nm) carbon single films.
Figure 8 presents the dQ/dV curves of the C/Cu ML in comparison to those of the 16 nm and 230 nm carbon single films, and to those of the blank copper current collector, for the selected cycles. The dQ/dV peaks of the blank copper are not present in the electrodes with carbon layers. The behavior of the C/Cu ML is in between that of the thin and thick carbon single films. In the first cycle (Figure 8a), the Li+ uptake of the C/Cu ML shows the same characteristics as the thick carbon single film for peak I. Peak II is not present in the C/Cu ML, and the intensity of peak III is more similar to that of the 16 nm carbon film.
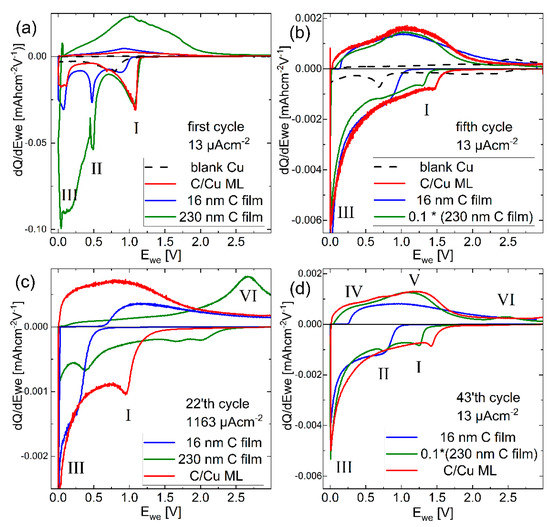
Figure 8.
Differential charge (dQ/dV) curves for the rate capability experiments (Figure 3 and Figure 4) of the C/Cu ML (red curves), 16 nm (blue curve), and 230 nm (green curve) carbon single-films, and the blank copper electrode (dashed line). (a) first, (b) fifth, (d) 43 cycles at 13 µAcm−2, and (c) of the 22 cycles at 1163 µAcm−2. For better visualization, the intensity for the 230 nm C film is multiplied by 0.1 in (b,d). A color version of this figure can be viewed online.
In the fifth cycle (Figure 8b), where irreversible Li-bonds are largely diminished, the dQ/dV intensity from the 230 nm carbon film is highest. For the reason of comparison, it is divided by a factor of 10 in Figure 8b. The shape of the Li+ uptake curve of the C/Cu ML is more similar to that of the thicker carbon single film than to that of the thinner carbon single film despite the lower amount of charge cycled in the C/Cu ML. Figure 8b shows that there is reversible Li+ uptake above the potential of 1 V only in the C/Cu ML and in the thicker carbon film, revealing that the behavior of the C/Cu ML is more similar to the thicker carbon film.
Figure 8c presents the dQ/dV plots for the highest applied current density. The C/Cu ML exhibits the highest Li+ uptake and release (red curve). At such fast cycling, more Li+ ions insert into the C/Cu ML reversibly than into the 230 nm carbon single-film. This result indicates an advantage with the copper layers when cycling the carbon layers in the C/Cu ML. The shape of the dQ/dV curve of the C/Cu ML (Figure 8c) is again in between that of the thinner (blue curve) and thicker (green curve) carbon single films.
Figure 8d presents the dQ/dV curves for the 43rd cycle, where the electrodes are cycled at the lowest applied current density. The shape of the curve for the C/Cu ML is again similar to that of the thicker carbon single-film. Interestingly, Figure 8 reveals that, beyond the first cycle, the shape of the dQ/dV curves for the single films changes drastically with the change of the current density, but the dQ/dV shape for the C/Cu ML is almost independent of a current density change. This behavior reveals good supercapacitor-like characteristics of the C/Cu ML.
According to the electrochemical results, we conclude that the carbon material inside the C/Cu ML exhibits an unexpectedly low capacity, although the dQ/dV plots reveal that the Li+ uptake and release in the C/Cu ML is more similar to the thicker, i.e., 230 nm thick carbon single film than to the 16 nm thin carbon single film. On the one hand, the differential charge plots (Figure 8) uncover that the carbon layers inside the C/Cu ML are indeed involved in the Li+ uptake and release. On the other hand, the dQ/dV behavior is in contrast to the integrated capacity behavior (Figure 3), which shows a considerably smaller capacity than expected. This indicates that the carbon material in the C/Cu ML likely does not contribute to cycling. This inconsistency provoked an additional non-electrochemical investigation to find answers to the questions of why the capacity of the carbon material in the C/Cu ML (Figure 3) was much lower than expected, although there was evidence that the interior carbon material in the C/Cu ML also participated in electrochemical cycling (Figure 8). This can be the case (i) if the C/Cu ML is damaged (partially delaminated), where only a part of the C/Cu ML fully participates in electrochemical cycling, and (ii) the copper layer functions as a barrier to Li+ permeation, and hence the buried carbon layer of the C/Cu ML does not participate in electrochemical cycling. Consequently, the task of the additional investigation is to examine after cycling (i) if the C/Cu ML is intact perpendicularly and parallel to the surface and (ii) if Li can be detected in the interior of the C/Cu ML. The characterization was performed ex situ, and therefore, in order to minimize the possible electrode damage caused by the expected reaction of Li with air, the characterization was conducted on the C/Cu ML electrode in the delithiated state of charge and on the same electrode which was used in the rate capability experiments. Before doing so, impedance investigations are briefly presented in the next subsection, which supports the indication of fast Li penetration through the C/Cu MLs.
3.4. Electrochemical Impedance Investigation
EIS is a very convenient measurement technique [65]. It can be applied in situ, and the results can be easily recorded. Besides these advantages, EIS also possesses limitations. The analysis of EIS data is problematic. It is done by using equivalent circuits. There is an inherent ambiguity in equivalent circuit fitting [65]. Different circuits can produce the same overall impedance at all frequencies [65]. Consequently, the discussion of the EIS data will be done preponderantly by comparing the measured EIS data from the C/Cu ML electrode with that from the carbon single-film electrode.
After cycling, the carbon-film electrodes were disassembled from the electrochemical cell in the Ar-gas-filled glove box. The 16 nm carbon film could not be visually discerned from the copper current collector due to its small thickness. Thus, the integrity of the 16 nm thin carbon film cannot be visually attested. This is not the case for the thicker film. Visual inspection recognized that the 230 nm carbon film was still intact with the Cu current collector after the cycling. Consequently, in the following, the EIS data obtained from the C/Cu ML electrode will be compared to that of the 230 nm carbon single-film electrode.
The processes contributing to the impedance can be easily observed by plotting the frequency responses of impedance and especially the phase (the so-called Bode plot). A resistor-like behavior, an ideal capacitor, and an ionic diffusion process possess phase angles of 0°, −90°, and −45°, respectively. Values in between them indicate mixed behavior. The Bode plot allows an easy determination of the frequency values where the corresponding process takes place. Obviously, the peak frequency easily delivers the time constant characterizing the respective process. For example, ionic diffusion is expected to appear at low frequencies because it is a relatively slow process in comparison to molecule and dielectric polarization effects.
Figure 9 presents the EIS data obtained from the C/Cu ML and 230 nm carbon single-film electrode. Figure 9a–j presents Bode plots before cycling (Figure 9a) and after each batch of five CC cycles of the rate capability experiments. In the virgin state, the EIS data collected from the C/Cu ML is identical to that of the 230 nm carbon film for frequencies higher than 0.2 Hz. Below 0.2 Hz, the impedance of the C/Cu ML unexpectedly drops below 1 Ohm (Figure 9a). Note that this resistance is even lower than the electrolyte resistance of 184 Ohm, which can be read out at the high-frequency range of the EIS data (Figure 9a). There seems to be a shortcut between the electrodes. In that case, the phase should attain zero value. This is not the case. The phase increases from −82° to a positive value above +90 °C, i.e., to +135 °C, indicating a device artifact or the presence of non-linear behavior. The real and imaginary parts of the impedance attain negative values of −0.69 and −0.71 Ohms, respectively, which point to the existence of negative resistance. A positive resistance (an ordinary resistor) consumes power, but a negative resistance produces power from the passing current. This indicates the presence of space charge layers inside the C/Cu ML electrode [66,67,68]. This phenomenon disappears after cycling (Figure 9b–l), presumably due to the disappearance of the space charge layers because of Li+ incorporation.
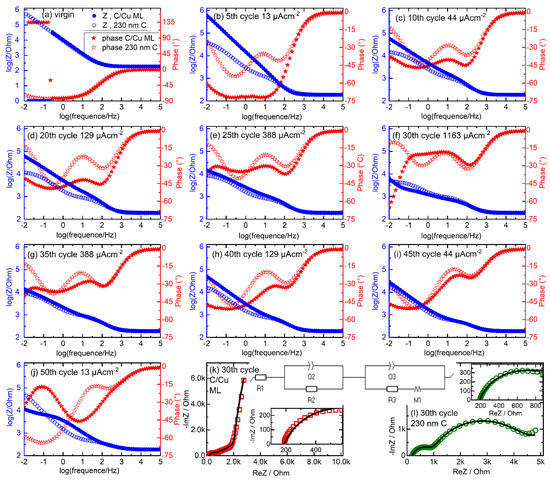
Figure 9.
EIS data. (a–j) Frequency response of impedance (circles) and phase (stars) (Bode plot) obtained in the virgin state (a) and in the delithiated states of charge (b–j) of the C/Cu ML (filled symbols) and 230 nm carbon single film (unfilled symbols) during the rate capability experiments (Figure 3, Figure 4, Figure 6, Figure 7 and Figure 8). (b) after 5 cycles with 13 µAcm−2. (c–j) after subsequent 5 cycles with (c) 44 µAcm−2, (d) 129 µAcm−2, (e) 388 µAcm−2, (f) 1163 µAcm−2, (g) 388 µAcm−2, (h) 129 µAcm−2, (i) 44 µAcm−2, (j) 13 µAcm−2. (k,l) Complex plane (Nyquist) representation of EIS collected from the C/Cu ML (red squares in panel (k)) and from the 230 nm carbon film (green circles in panel (l)) electrode for the Bode plot of panel (f). The equivalent circuit used to analyze the measured EIS data is also drawn. The fitted curves are plotted with black lines. For better visualization, the inset figures present the EIS data in the high-frequency region. A color version of this figure can be viewed online.
With cycling, the EIS data from the C/Cu ML becomes similar to that of the 230 nm carbon film (Figure 9), confirming the result obtained from the differential charge curves (Figure 7 and Figure 8) that the cycling behavior of the C/Cu ML is like that of the thick carbon single film. The phase curves show peaks (larger negative values) located around 100 Hz and 1 Hz and at the smallest frequency (0.01 Hz) (see, e.g., Figure 9f). The phase peak at 100 Hz possesses a small time constant of 0.01 s and may be attributed to the so-called electrochemical double layer. The phase peak at 1 Hz corresponds to a time constant of 1 s and may be attributed to the SEI layer. Phases at the smallest frequency of 0.01 Hz are associated with slow processes, presumably diffusion processes.
The EIS data of Figure 9f is of particular interest because it was taken after the 5 CC cycles with the highest current density during the rate capability experiments, where the cycling results (Figure 8c) show that more Li+ can be cycled in the C/Cu ML than in the 230 nm carbon film, presumably due to faster Li+ diffusion in the C/Cu ML. In order to obtain some diffusivities, the EIS data presented in Figure 9f is fitted with the equivalent circuit presented in the inset of Figure 9k. Figure 9k,l presents the complex plane (Nyquist plots) of the Bode plots presented in Figure 9f, together with the fit results (black lines). The resistor R1 represents the resistance of the electrolyte and contact resistances. The RC (RQ) circuits R2–Q2 and R3–Q3 represent the transfer resistance (R2 and R3) and the capacitive behavior (the constant phase elements Q2 and Q3) of the electrochemical double layer and that of the SEI layer, respectively.
The diffusion element M1 represents the finite-length diffusion process of Li+ within the C/Cu ML and within the 230 nm carbon film, with a reflective boundary condition at the film/current collector interface [65,69,70]. Table 2 lists the values obtained from the fitting. It can be observed that the corresponding values are roughly the same (possesses the same magnitude) for the 230 nm carbon film and the C/Cu ML electrode, except that of the diffusion element M1. The time constant t1 of the diffusion element differs by almost three orders of magnitude. The diffusivities, calculated according to D = d2(2t1)−1 with d the film thickness, are listed in the last column of Table 2. The diffusivity in the C/Cu ML is by three orders of magnitude larger than for the 230 nm carbon film, confirming the cycling results that more Li+ can be cycled in the ML at fast rates. Note that the diffusivity for the C/Cu ML was calculated considering the thickness of the whole C/Cu ML of 348 nm. This is uncertain because, for the C/Cu ML, one does not know if the reflection happens on the ML/current collector boundary or at each carbon/copper interface within the ML.
Table 2.
Values of the equivalent circuit elements obtained from fitting the measured EIS data presented in Figure 9k,l. The EIS measurements were performed in the delithiated SOC after the 30th cycle of the C/Cu ML (Figure 9k) and 230 nm carbon thin film (Figure 9l) electrode, i.e., after the five CC cycles with the highest current density during the rate capability experiments. The equivalent circuit is presented in Figure 9k. The last column lists the Li diffusivities obtained from the EIS analysis. The parameters (Q and a) describe the constant phase element, where the constant phase is given by (−90·a). The parameters Rd1 and t1 describe the restricted diffusion element M1 which is used for finite-length linear diffusion.
Overall, according to the EIS investigation, during cycling, the EIS data of the C/Cu ML is similar to that of the 230 nm carbon single-film electrode over almost all (higher) frequency ranges. They differ only after fast cycling and at low frequencies, revealing the higher phase for the C/Cu ML below 0.1 Hz in the Bode plot (Figure 9f) and a corresponding larger –ImZ at larger ReZ for the C/Cu ML in the Nyquist plot (Figure 9k,l). This slow process is attributed to Li+ diffusion with a diffusivity in the C/Cu ML three orders of magnitude higher than in the carbon single film (Table 2). The similarity at the higher frequency range points to the formation of a similar electrochemical double layer and a similar SEI layer at the C/Cu ML and at the 230 nm carbon single-film electrode.
3.5. ML Characterization after Electrochemical Cycling
After 542 electrochemical cycles, the C/Cu ML electrode was demounted from the electrochemical cell in the delithiated state of charge (SOC) and washed with PC and acetonitrile. The electrode was then exposed to air at room temperature. XRR measurements were performed after 1 and 15 months of exposure to air. The XRR measurement after 15 months of air exposure shows similar results to those after the 1-month of air exposure. Figure 10a,b shows the XRR pattern of the electrochemically cycled ML electrode (red curve in Figure 10a,b) after 15 months of air exposure, together with the XRR pattern of the as-deposited C/Cu ML, before being mounted in the electrochemical cell (blue circles). The XRR data after electrochemical cycling is nearly identical to that before electrochemical cycling (Figure 10a). The C/Cu ML structure remains unchanged after the electrochemical cycling.
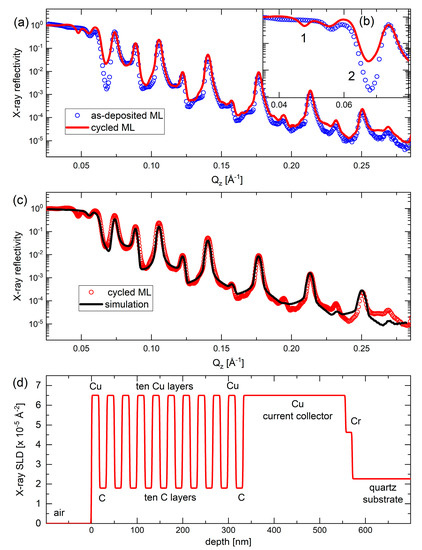
Figure 10.
(a,b) XRR patterns of the C/Cu ML electrode before being mounted in the electrochemical cell (blue circles), measured on a Panalytical Empyrean diffractometer, and after cycling, washing, and air exposure for 15 months (red line), measured on a Bruker D8 DISCOVER diffractometer. Panel (b) is a cutout of (a). (c) XRR pattern (red circles) and XRR-simulation results (black line) on the C/Cu ML electrode after cycling, washing, and 15 months of air exposure. (d) Depth profile of the X-ray scattering length density of the XRR-simulation results presented in (c). A color version of this figure can be viewed online.
Figure 10c depicts the XRR pattern of the cycled C/Cu ML (red cycles) together with a simulated XRR pattern (black curve) with the best fit to the experimental results. The depth profile of the X-ray SLD is shown in Figure 10d. The mass density of the layers, the layer thicknesses, and the interlayer roughness are listed in Table 3. All of them remain identical after electrochemical cycling. This observation is unexpected because it is well-known that electrochemical cycling changes the microstructures of electrodes drastically [41]. Moreover, some Li content often remains in the active material of the electrode even after full delithiation, which then heavily reacts with air, often pulverizing the active material. Nevertheless, even if all Li+ can be extracted from the electrode by delithiation, the 542 electrochemical cycles actually should leave some damage in the C/Cu ML electrode. Such damage should be reflected in an increase in the interfacial roughness of the C/Cu ML. As this is not observed in the XRR measurements, the most straightforward explanation of the XRR results is that the interior of the C/Cu ML was not involved in electrochemical cycling. This result suggests that the Cu layers are probably impermeable to the Li+ flux during electrochemical cycling.
Table 3.
Parameters used for the simulation of the reflectivity pattern presented in Figure 10c, using the Parratt32 code, i.e., obtained for the C/Cu ML after 542 cycles, after washing with PC and acetonitrile, and after air exposure for 15 months.
The only two observable minor changes after electrochemical cycling are denoted with the numbers 1 and 2 in the inset of Figure 10b. The minima of the Bragg reflection denoted with the number 2 in Figure 10b can be simulated if the outmost carbon layer of the ML stack is removed (see Figure 10d and Table 3) or if the outmost carbon layer is changed into a layer of extremely low X-ray SLD. This may be the case if the outmost carbon layer possesses light atoms such as lithium and/or hydrogen atoms. The minima denoted in Figure 10b with the number 1 (dip-1) can be simulated if the XRR simulation is performed without imposing any constraint on the parameters of the C/Cu ML. If the parameters of the C/Cu ML (thickness, mass density, and interface roughness) are allowed to differ from one layer to another, which means fitting with unconstrained ML parameters, the intensity drop at number 1 in Figure 10b is well matched. This means that the cycling indeed changes the microstructure of the C/Cu ML, but the fit of the other Bragg peaks becomes worse, excluding the former hypothesis. Thus, the dip-1 may appear in the XRR pattern in another manner which cannot be explained by the XRR simulation without including lateral inhomogeneity of the electrode.
We point out that the dip-1 in Figure 10b represents another critical angle. The critical angle denotes the drop-in intensity after total reflection and is given by mass density (electron density). Hence, the dip-1 must originate from another material that exists in addition to the C/Cu ML. This additional material possesses an X-ray SLD exactly in between that of carbon (low SLD) and copper (high SLD). The material of the C/Cu ML (e.g., copper) is responsible for the critical angle at the scattering vector of 0.055 Å−1 (i.e., in between dip-1 and dip-2 in Figure 10b) in both the XRR patterns, i.e., in the pattern of the as-deposited C/Cu ML and in the pattern of the C/Cu ML after electrochemical cycling. The dip-1 cannot be a Bragg reflex feature because, at this extremely small glance angle, photons do not penetrate deeply into the C/Cu ML (very few nm). The dip-1 is also typical for X-ray inelastic effects such as absorption, which points to changed X-ray absorption in the C/Cu ML after electrochemical cycling. Note that lateral inhomogeneity can be analyzed using microscopy (Figure 11).
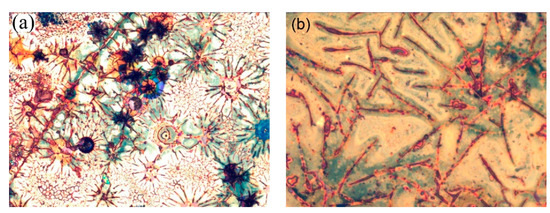
Figure 11.
(a) 330 µm × 250 µm and (b) 130 µm × 105 µm LOM images of the electrode with a C/Cu ML in the delithiated SOC after 542 cycles, after washing, and after air exposure for 15 months. A color version of this figure can be viewed online.
Figure 11 presents LOM (light optical microscopy) images of the C/Cu ML electrode in the delithiated SOC after 542 electrochemical cycles, after washing, and after air exposure for 15 months. There are regularly arranged linear strikes of approximately 2 µm in thickness on the surface, which are grouped in rosette-like structures. In between the dark stripes of red to dark-brown color, a flat area of light color (the yellow to brown colors in Figure 11b) is observed. The flat regions may be interpreted as the less distorted ML, which produces the well-developed Bragg reflexes in the XRR pattern (Figure 10). We interpret the stripes as cracks, which appeared due to electrochemical cycling, in particular, because the brown-red color of the stripes is identical to the color of the underlying 224 nm thick copper current collector. Cracks are usually seen on electrode surfaces after LIB operation [41]. Between the cracks, large regions of intact ML film can be seen, which may produce the well-developed Bragg reflexes of the ML XRR pattern as well. The appearance of cracks suggests that the interior of the C/Cu ML participated in electrochemical cycling. The cracks were not observed on the cycled blank Cu plates.
However, the interpretation of the stripes as canyons in the C/Cu ML due to cracks is actually just one possible explanation because the stripes might not correspond to sinks inside the C/Cu ML but to an additional material on top of the C/Cu ML. This additional material might be related to dried remains of the SEI layer and/or of the PC solvent, accumulated in stripes on the ML surface, with thicknesses in the µm range. In that case, the microscopic investigation might describe the lateral arrangement of the electrode as a combination of two regions: one with additional material and the other without additional material on top of the ML. Note that the XRR averages over the whole electrode surface. In that case, the XRR pattern represents a combination of the X-ray scattering of (i) the ML portion, which is covered with the accumulated material, which produces the stripes under LOM and the dip-1 in the XRR pattern, and (ii) the ML region in between the stripes. In that way, the origin of the dip-1 in the XRR pattern (Figure 10a,b) can also be explained by the remains of the salt solvent and/or SEI layer, which possess light atoms such as hydrogen, carbon, and lithium.
The quality of the C/Cu ML structure is further examined by reciprocal space exploration. Reciprocal space exploration is used to reveal the finest details of the multilayer structure. Figure 12 represents a rapid reciprocal space map in the XRR regime with the reflected intensity R represented in color entities on the electrode of the C/Cu ML in delithiated SOC after 542 electrochemical cycles, washing, and air exposure for 15 months. Several scattering features, such as streaks (traces of Bragg singularities [71]) and spots (reflexes) originating from dynamical X-ray scattering, are visible (Figure 12). RDS sheets (or bananas, i.e., horizontal intensity parallel to the axis in Figure 12b) occur at wave vectors equal to the corresponding values of the superlattice (ML) peaks [71,72]. This observation indicates that there is a full replication of interface roughness in the ML, i.e., a strong correlation of the interface parameters over all the interfaces of the C/Cu ML [71,72].
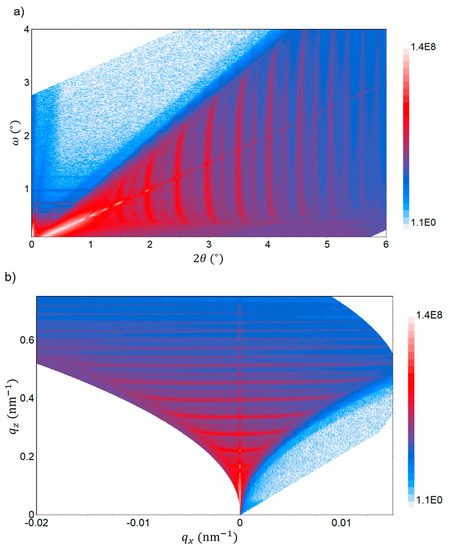
Figure 12.
Rapid reciprocal space (RSM) map in the XRR regime as measured in the angular space (panel (a)) and in the wave vector plane (reciprocal space, panel (b)) on the C/Cu ML electrode after 542 cycles, washing, and air exposure for 15 months. The reflected X-ray intensity is represented in color entities. Several scattering features originating from dynamical X-ray scattering are visible. A color version of this figure can be viewed online.
Overall, the specular (Figure 10) and non-specular (Figure 12) XRR results prove a high quality of the C/Cu ML stack, which did not experience change during electrochemical cycling. This indicates that the interior of the C/Cu ML does not participate in electrochemical cycling. The uppermost 17 nm Cu layer of the C/Cu ML may block the Li+ flux to reach the underlying carbon layers so that only the uppermost carbon layer participates exclusively in electrochemical cycling. This would explain the almost intactness of the C/Cu ML after the electrochemical cycling and air exposure and the lower capacity calculated for the carbon material in the C/Cu ML. The Li+ insertion and extraction to and from the C/Cu ML then took place exclusively in the uppermost 16 nm carbon layer of the C/Cu ML. For the calculated ML capacity (Figure 4 and Figure 5), the Li+ charge inserted and released to and from the C/Cu ML was divided not only by the carbon mass of the uppermost carbon layer but also by the mass of the ten carbon layers beneath, which did not participate in the electrochemical cycling. This results in a lower capacity than expected for the whole carbon material in the C/Cu ML. The electrochemical cycling of solely the uppermost carbon layer, together with the washing procedure and air exposure, would (i) destroy the uppermost carbon layer, as expected, and (ii) might produce some thick agglomeration on some regions of the surface (the stripes in Figure 11). This explains why the XRR measurements suggest a C/Cu ML with a lack of the uppermost carbon layer in the cycled electrode (comparing Table 3 with Table 1) but concomitantly with regions covered by another thick material (dip-1 in Figure 10). Another explanation might be that the Li+ permeation through the 17 nm Cu layer proceeds, but the mechanical stress (constraint) of the thin Cu layers in the ML hinders the carbon layers in the interior of the ML from storing the maximum capacity (e.g., that of graphite), although the electrode was cycled up to Li-plating. A partial Li+ storage might result in electrochemical cycling without ML deterioration, as measured (Figure 10). A slow Li+ transport through the Cu layers of the ML might preserve the carbon layers inside the C/Cu ML from full lithiation as well.
Raman scattering and SIMS depth profiling were performed to examine if (i) the outmost carbon layer of the C/Cu ML stack is indeed removed (absent) after the cycling, washing, and air storage and (ii) if there is Li+ present in the interior of the C/Cu ML, despite the delithiated SOC, which would indicate that the interior of the C/Cu ML participated in electrochemical cycling. In the first case, one would expect no carbon lines in the Raman spectra, given that the laser light of the Raman microscope does not permeate through the 17 nm copper layer of the C/Cu ML. Figure 1 shows that this is not the case. The carbon lines are also present for the cycled and washed electrodes. This indicates that (i) the uppermost carbon layer is still present, or (ii) the carbon lines stem solely from the carbon layers in the interior of the C/Cu ML, and the laser of the Raman microscope can very well permeate the 17 nm copper layers. The depth-resolved location of carbon was then investigated by SIMS depth profiling.
Figure 13 presents depth profiles of the carbon, copper, and lithium SIMS signal, measured on the electrochemically cycled, washed, and air-exposed ML-based electrode in delithiated SOC. The depth profile of the carbon mass reveals the existence of eleven layers with the local maximal carbon signals denoted with numbers 1 to 11 in Figure 13. At the surface (in the depth region below 20 nm), the carbon signal has a maximum, whereas the copper signal possesses a minimum. This evidences that the outmost layer of the cycled C/Cu ML possesses carbon and is not a blank copper layer. However, the SIMS signals are averaged over an area of 60 µm × 60 µm. As visualized in Figure 11, this area possesses the stripes and the flat areas in between them, meaning that the SIMS signals are a combination of signals from the sputtered material of the stripes and that of the blank C/Cu ML in between them as well. Hence, the SIMS results from the surface are not in contradiction to the explanation given for the XRR and microscopy results.
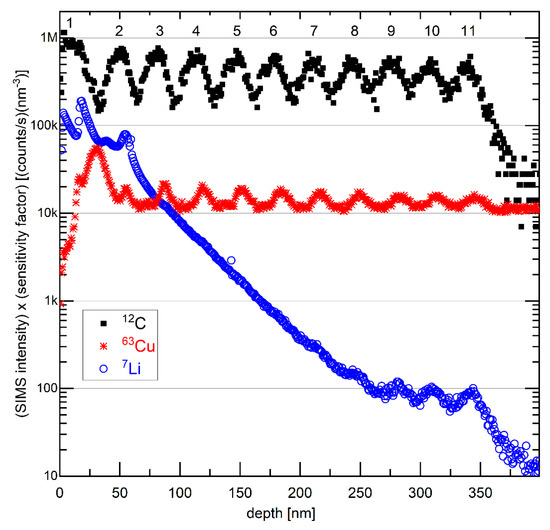
Figure 13.
SIMS depth profiles of 7Li, 12C, and 63Cu isotope on the electrode with a C/Cu ML after 542 cycles, washing, and air exposure for 15 months. The intensity is multiplied by the corresponding sensitivity factor. The numbers 1 to 11 denote the presence of eleven layers with a strong C signal. A color version of this figure can be viewed online.
Note that, in contrast to the electrochemical methods, XRR, and Raman scattering, SIMS depth profiling is a destructive method due to the involved sputtering process. The sputtering process used in this work was performed with a 5 keV O2+ primary ion beam which is known to produce less damage than using other primary ion beams such as 5 keV Ar+ and 15 keV O− primary ion beams. The damage produced by the SIMS measurement itself often distorts the realistic (existing) depth profiles in MLs (Figure S9 in the supplementary information accompanying reference [50]).
The SIMS depth profile of lithium is also shown in Figure 13. It possesses a high value on the surface and decays almost monotonically with the ML depth. Such a Li depth profile is typical for cycled electrodes in the delithiated SOC, e.g., similar to that measured in our laboratory for silicon films that cannot be fully delithiated. Some Li remains trapped in the electrode with a depth profile similar to that presented in Figure 13. The irreversible capacity observed during electrochemical cycling (Figure 4) may stem from Li trapping inside the electrode, as evidenced in Figure 13. Thus, the depth profile of the Li SIMS signal reveals that the interior of the ML was also cycled, i.e., that during electrochemical cycling, some Li+ flux permeated through the copper layers of the ML and reached (and was extracted from) the carbon layers in the interior of the C/Cu ML. The plotted intensities in Figure 13 represent the SIMS intensities of the corresponding isotopes multiplied by their sensitivity factors of the elements in a silicon matrix (the sensitivity factors inside the C/Cu ML are unknown). The sensitivity factors were measured with the same primary ion beam as that used in this work, i.e., with a 5 keV O2+ primary ion beam [73], but of elements implanted inside a silicon material (matrix). Taking into account the data in Figure 13, one obtains the Li content in the delithiated carbon layers of the C/Cu ML (given as x in LixC) starting with x = 0.2 in the uppermost carbon layer and ending with x = 0.001 in the deepest (eleventh) carbon layer inside the C/Cu ML.
4. Remarks, Open Questions, and Outlook
The aim of this work was to examine the influence of the copper coating on the Li storage in carbon via a C/Cu ML in a LIB half-cell and not primarily on the C/Cu ML as an anode material. As a potential anode material for Li-ion batteries, the electrochemical performance of the C/Cu ML electrode has to be investigated in a full cell. The examination of a C/Cu ML and not just that of only one C/Cu double layer was performed in order to obtain more precise XRR data.
All the investigations performed with XRR, LOM, Raman, and SIMS on the cycled ML electrode can be explained consistently, i.e., the results are not in contradiction to each other but possess the disadvantage that they do not precisely reveal why the capacity of the carbon in the C/Cu ML is lower than expected. One possible explanation is that the C/Cu ML, besides the cycling of its uppermost carbon layer, may also possess another storage mechanism involving solely the ML interfaces [66,67,68]. Interfaces in a battery can lead to additional storage capacity [66,67,68]. This interface storage possesses a fast Li insertion and extraction capability [66,68], which is also found in this work for the C/Cu ML at high current densities (with a rate of 937C, Figure 4 and Figure 5). The EIS data confirms a higher Li diffusivity in the C/Cu ML than in the carbon single-film electrode. Another explanation might be that the Li+ permeation through the 17 nm thin Cu layer proceeds, but the constraint of the thin Cu layers induces mechanical stress in the carbon layers, which prevents them from storing Li+ with the maximum capacity, although the electrode was cycled up to Li-plating. It is well known that mechanical stress influences the amount of Li+ stored in a material [74,75,76]. A partial Li+ storage may result in electrochemical cycling without ML deterioration, as was also evidenced by the XRR, Raman, and SIMS results for the heavily cycled ML electrode. As an outlook, depth profiles with XRR and SIMS at different SOCs, including full lithiation, may shed some light on this issue. Unfortunately, SIMS is performed ex situ, while in situ and even operando XRR measurements may be performed only if adequate electrochemical cells are constructed. Li+ insertion and extraction are accompanied by volume expansion and contraction of the active material, respectively. The XRR and neutron reflectometry (NR) techniques can be used to determine the layer thicknesses with sub-nanometer resolution. In addition to XRR, neutron scattering is sensitive to Li and Li isotopes but can measure only large variations of the Li concentration. SIMS can measure traces of Li contents and can discern the difference between low Li contents, such as 0.001 and 0.01 at. %. Thus, the combination of low-angle scattering methods (XRR and NR) to determine volume (layer thickness) changes and ML deterioration, and SIMS, to determine the Li content would properly elucidate the characteristics that appear during the electrochemical cycling of ML structures. There, it is of interest to elucidate the exact processes of the predominant Li+ uptake and release peaks obtained during ML cycling. This can be achieved by measuring depth profiles at different SOCs (i) ex situ with SIMS in order to determine the variation in Li content and (ii) operando with NR and XRR in order to determine volume (layer thickness) changes. As for the stripes in Figure 11, a future characterization with SEM, EDS, and XRD may validate if they are the remains of salt solvent and/or an SEI layer.
There is very limited data regarding the Li permeability besides the indirect info from the cycling behavior. The capability of thin Cu layers to transport Li+ ions is likely of interest in terms of thickness, conduction mechanism, grain boundary, etc., to examine Li+ permeation and full Li+ blocking. The current collectors for anodes are mostly copper, and there is an endeavor to reduce the thickness of the copper film to reduce the mass of LIBs. However, the copper current collector must be thick enough in order to block Li+ permeation to reduce Li loss during LIB operation. As an outlook, the investigation of the electronic conductivity and ionic conductivity may provide more solid evidence to elucidate the effects of Cu thin films, especially when they are presented as a function of film thickness.
EIS is a very convenient methodology for investigating conductivity (impedance). The analysis of the EIS data found that the Li diffusivity in the C/Cu ML is three orders of magnitude higher than in the 230 nm thick carbon film (Table 2). The formation of an electrochemical double layer and SEI layer at the C/Cu ML was found by EIS analysis to be similar to the 230 nm carbon single-film electrode. EIS also possesses, as previously mentioned, severe drawbacks regarding the analysis and result interpretation, especially in the cases of the C/Cu ML and carbon single films where both electronic and Li+ ion conductions contribute to the conduction mechanism. In general, there is an aspiration to validate the results determined electrochemically (from EIS and other methods like pulse methods such as galvanostatic and potentiostatic intermittent titration techniques [77]) by applying standard methods for the diffusion determination similar to SIMS and NR.
Regarding the determination of the Li permeability through thin Cu layers with SIMS and NR, a preliminary study was performed. The results show that Li permeation through thin Cu layers can be measured with the methodology used to measure the Li permeation through thin silicon layers (silicon or copper spacer layers in between solid-state Li reservoir layers) [18,19,50,78]. The Li permeation strength (permeability) through thin Cu layers was found to be similar to that through silicon layers. For comparison, the Li permeabilities through chromium, carbon, [50] and platinum layers were found to be many orders of magnitude higher than those through silicon and copper layers. At room temperature, the Li permeability through amorphous carbon thin layers was determined to be nine orders of magnitudes higher than through amorphous silicon layers [50,78]. With the result that the Li permeation strength through copper layers is similar to that through silicon layers, one can roughly estimate that the Li permeability through the carbon layers is nine orders of magnitude higher than through Cu layers. Thus, the Cu layers and not the carbon layers are the bottleneck process for the Li flux in the C/Cu ML. The difference between the copper and silicon layers can be attributed to the difference in atomic networks. The studied silicon layers were amorphous, whereas the copper layers were polycrystalline. The Li conduction mechanism in the Cu layers may be governed by grain boundaries. The contribution of grain boundary diffusion may depend on layer thickness and average grain size. Thus, the investigations of the dependence of the Li permeability on copper layer thickness and average grain size should thoroughly include the characterization of grain sizes and misorientations using, e.g., EBSD (electron backscatter diffraction) and electron scanning measurements.
Last but not least, it must be pointed out that mechanical stress is omnipresent during electrochemical cycling, playing an important role in the failure of LIB operation and the lithiation/delithiation process [40,41]. The capacity fade in LIB operation has been, in general, hypothesized to be connected to the appearance of mechanical stresses introduced by electrochemical cycling [41]. Compressive stress can be responsible for the reactions and phase formation/suppression during LIB operation [40,41]. Note that the carbon layers inside the C/Cu ML are under strong structural constraints. In contrast to a carbon single film which is constrained only on one of its surfaces (which lies on the copper current collector), the carbon layers in the C/Cu ML are constrained on both surfaces. Hence, the carbon layers inside the C/Cu ML may be exposed to larger mechanical stresses than carbon single films. This could strongly influence the evolution of mechanical stresses during LIB operation and, in that way, control the Li+ uptake and release. Consequently, a coupled mechanical–electrochemical modeling of the lithiation of C/Cu ML with numerical results of the depth-resolved mechanical stress is essential in order to elucidate the reason for the measured low capacity during the electrochemical cycling of the C/Cu ML.
5. Conclusions
The scope of this work was to investigate the effects of thin Cu layers on the lithiation and delithiation behavior of thin film carbon electrodes and the characteristics of a carbon multilayer with Cu-spacer layers via in situ electrochemical and ex situ XRR, Raman, microscopy and SIMS measurements. For that purpose, the electrochemical performance of a [Cu(17 nm)/C(16 nm)] × 10 ML capped by a 16 nm C layer was analyzed and compared to those of a bare copper electrode and of electrodes with solely a single 16 nm or 230 nm carbon film. The carbon material in the electrodes was found to be amorphous with an sp2 (graphite-like) bonding configuration. A cycling protocol to test the rate-capability by stepwise increasing the current density after each fifth cycle from 13 to 1163 µAcm−2 and stepwise decreasing the current density after each fifth cycle back to 13 µAcm−2 was used. Following the stepwise cycling, a long-term cycling with an additional 500 cycles was performed. Lithiations were performed up to Li-plating, using negative potential with respect to the Li reference electrode, to correct the lithiation process from overpotential.
All cycled electrodes exhibited a good rate capability and good long-term cycling but showed capacity losses in the first cycle. The electrode potential evolution of inserted and released charge (dQ/dV plots) identified irreversible and reversible side reactions and irreversible and reversible Li+ insertion in the electrodes. Irreversible and reversible Li+ insertion into the electrodes takes place in an unexpectedly large potential window, i.e., between 0 V and 1.2 V versus the Li reference material. The irreversible Li+ insertion may stem from Li-trapping inside the electrodes. At the highest current density, the most reversible Li+ insertion is obtained from the C/Cu ML, which points to a fast reversible lithiation process in the C/Cu ML. EIS data provided evidence for fast Li migration through the MLs. The Li diffusivity in the C/Cu ML is three orders of magnitude higher than that in the carbon single-film electrode, confirming the cycling results that more Li+ can be cycled in the ML at fast rates. Nevertheless, this result remains to be validated with standard techniques for diffusion determination, such as SIMS and NR. The C/Cu ML acts as a good supercapacitor, which is evidenced by an almost potential-independent differential charge plot. On the one hand, at lower current densities, the capacity of the C/Cu ML is only 20% of that of the carbon single-film electrodes, which equals that of graphite. On the other hand, the differential capacity plots of the C/Cu ML are more similar to that of the 230 nm thick carbon single film than to the 16 nm thin carbon single film. This indicates that the amount of carbon cycling in the C/Cu ML is larger than that corresponding to the 16 nm thin carbon layer, and in that way, also evidenced that the interior of the C/Cu ML was electrochemically cycled.
The effects of the Cu layers on the electrochemical cycling of the C/Cu ML were further examined ex situ with XRR, light optical microscopy, Raman, and SIMS measurements. The results are consistent, but they do not elucidate the reasons for the lower capacity of carbon in the C/Cu ML. Specular and off-specular XRR investigations show that the ML arrangement is of high quality and is not changed by long-term electrochemical cycling (542 cycles), washing with PC and acetonitrile, and air exposure of the cycled electrode for 15 months. Microscopy and SIMS depth profiling evidenced that (i) the ML arrangement is intact as indicated by the XRR data, but also that (ii) the interior of the ML was electrochemically cycled, and in that manner, the 17 nm copper layers in the C/Cu ML did not block the Li+ transport. The lower capacity of the carbon layers within the C/Cu ML may be explained by (i) the electrochemical cycling of only the uppermost carbon layer (together with a reversible Li storage at the interfaces of the ML) or by (ii) the reduction of the Li+ uptake due to the constraint of the copper layers imposed on the carbon layers, leading to mechanical stress and enabling only partial lithiation.
Author Contributions
Conceptualization, E.H.; validation, E.H.; formal analysis, E.H., CJ.; electrode preparation, E.H.; non-electrochemical investigation, E.H.; electrochemical investigation, E.H., C.J.; data curation, E.H.; writing—original draft preparation, E.H.; writing—review and editing, E.H., K.M., D.U. and F.Y.; visualization, E.H.; supervision, E.H.; project administration, E.H. All authors have read and agreed to the published version of the manuscript.
Funding
This research received no external funding.
Data Availability Statement
Data are available upon request.
Acknowledgments
We thank Lars Dörrer and Karin Bode (TU Clausthal) for electrochemical cell construction and Raman scattering measurements, respectively. We thank Gundula Helsch (TU Clausthal) for providing EH’s access to the Panalytical Empyrean X-ray diffractometer. EH thanks Harald Schmidt (TU Clausthal) for fruitful discussions. The Bruker Discover D8 HRXRD was financially supported by the Deutsche Forschungs-gemeinschaft (DFG) in the framework of the INST 189/189-1 FUGG and is gratefully acknowledged. We deeply thank Stefan Jacobs (Bruker AXS GmbH, Germany) for the validation of the XRR measurements, for help in the presentation of the XRR data recorded with the Bruker D8 Discover diffractometer, and for fruitful discussion.
Conflicts of Interest
The authors declare no conflict of interest.
References
- Dahn, J.R.; Zheng, T.; Liu, Y.; Xue, J.S. Mechanisms for Lithium Insertion in Carbonaceous Materials. Science 1995, 270, 590–593. [Google Scholar] [CrossRef]
- Hüger, E.; Jin, C.; Schmidt, H. Electrochemical investigation of ion-beam sputter-deposited carbon thin films for Li-ion batteries. J. Appl. Electrochem. 2022, 52, 1715–1732. [Google Scholar] [CrossRef]
- Salgada, R.M.; Danzi, F.; Oliveira, J.E.; El-Azab, A.; Camanho, P.P.; Braga, M.H. The Latest Trends in Electric Vehicles Batteries. Molecules 2021, 26, 3188. [Google Scholar] [CrossRef]
- Subramaniana, V.; Karabacak, T.; Masarapua, C.; Tekic, R.; Lud, T.-M.; Wei, B. Low hydrogen containing amorphous carbon films—Growth and electrochemical properties as lithium battery anodes. J. Power Sources 2010, 195, 2044–2049. [Google Scholar] [CrossRef]
- Fathi, R.; Sanderson, R.J.; Lucas, L.J.; Dahn, J.R. The electrochemical reaction of lithium with high-capacity dense sputtered carbon. Carbon 2014, 74, 249–254. [Google Scholar] [CrossRef]
- Vetter, J.; Novak, P.; Wagner, M.R.; Veit, C.; Möller, K.-C.; Besenhard, J.O.; Winter, M.; Wohlfahrt-Mehrens, M.; Vogler, C.; Hammouche, A. Ageing mechanisms in lithium-ion batteries. J. Power Sources 2005, 147, 269–281. [Google Scholar] [CrossRef]
- Winter, M. The Solid Electrolyte Interphase—The Most Important and the Least Understood Solid Electrolyte in Rechargeable Li Batteries. Z. Phys. Chem. 2009, 223, 1395–1406. [Google Scholar] [CrossRef]
- Ding, R.; Huang, Y.; Li, G.; Liao, Q.; Wei, T.; Liu, Y.; Huang, Y.; He, H. Carbon Anode Materials for Rechargeable Alkali Metal Ion Batteries and in-situ Characterization Techniques. Front. Chem. 2020, 8, 607504. [Google Scholar] [CrossRef] [PubMed]
- Asenbauer, J.; Eisenmann, T.; Kuenzel, M.; Kazzazi, A.; Chen, Z.; Bresser, D. The success story of graphite as a lithium-ion anode material—Fundamentals, remaining challenges, and recent developments including silicon (oxide) composites. Sustain. Energy Fuels 2020, 4, 5387–5416. [Google Scholar] [CrossRef]
- Dey, A.; Sullivan, B. Carbon Anode Materials for Rechargeable Alkali Metal Ion Batteries and in-situ Characterization Techniques. J. Electrochem. Soc. 1970, 117, 222–224. [Google Scholar] [CrossRef]
- Lu, W.; Donepudi, V.; Prakash, J.; Liu, J.; Amine, K. Electrochemical and thermal behavior of copper coated type MAG-20 natural graphite. Electrochim. Acta 2002, 47, 1601–1606. [Google Scholar] [CrossRef]
- Nobili, F.; Dsoke, S.; Mancini, M.; Marassi, R. Interfacial Properties of Copper-coated Graphite Electrodes: Coating Thickness Dependence. Fuel Cells 2009, 09, 264–268. [Google Scholar] [CrossRef]
- Licht, B.K.; Homeyer, F.; Bösebeck, K.; Binnewies, M.; Heitjans, P. Synthesis and Electrochemical Behavior of Nanostructured Copper Particles on Graphite for Application in Lithium Ion Batteries. Z. Phys. Chem. 2015, 229, 1415–1427. [Google Scholar] [CrossRef]
- Tallman, K.R.; Zhang, B.; Wang, L.; Yan, S.; Thompson, K.; Tong, X.; Thieme, J.; Kiss, A.; Marschilok, A.C.; Takeuchi, K.J.; et al. Anode Overpotential Control via Interfacial Modification: Inhibition of Lithium Plating on Graphite Anodes. ACS Appl. Mater. Interfaces 2019, 11, 46864–46874. [Google Scholar] [CrossRef] [PubMed]
- Tallman, K.R.; Quilty, C.D.; Abraham, A.; McCarthy, A.H.; Marschilok, A.C.; Takeuchi, K.J.; Takeuchi, E.S.; Bock, D.C. Improved Capacity Retention of Lithium Ion Batteries under Fast Charge via Metal-Coated Graphite Electrodes. J. Electrochem. Soc. 2020, 167, 160503. [Google Scholar] [CrossRef]
- Suzuki, J.; Yoshida, M.; Nishijima, Y.; Sekine, K.; Takamura, T. Effect of a vacuum-deposited metal film on the CV of the Li insertion/extraction reaction at a graphitized carbon fiber electrode. Electrochim. Acta 2002, 47, 3881–3890. [Google Scholar] [CrossRef]
- Nobili, F.; Dsoke, S.; Mancini, M.; Tossici, R.; Marassi, R. Electrochemical investigation of polarization phenomena and intercalation kinetics of oxidized graphite electrodes coated with evaporated metal layers. J. Power Sources 2008, 180, 845–851. [Google Scholar] [CrossRef]
- Hüger, E.; Schmidt, H. Li Permeability Increase in Nano-Sized Amorphous Silicon Layers. J. Phys. Chem. C 2018, 122, 28528–28536. [Google Scholar] [CrossRef]
- Hüger, E.; Stahn, J.; Heitjans, P.; Schmidt, H. Neutron Reflectometry to Measure in-situ the Rate Determining Step of Lithium Ion Transport through Thin Silicon Layers and Interfaces. Phys. Chem. Chem. Phys. 2019, 21, 16444–16450. [Google Scholar] [CrossRef]
- Oudenhoven, J.F.M.; Baggetto, L.; Notten, P. All-solid-state lithium-ion micro-batteries: A review of various three-dimensional concepts. Adv. Energy Mater. 2011, 1, 10–33. [Google Scholar] [CrossRef]
- McDowell, M.T.; Lee, S.W.; Nix, W.D.; Cui, Y. 25th Anniversary Article: Understanding the lithiation of silicon and other alloying anodes for lithium-ion batteries. Adv. Mater. 2013, 25, 4966–4985. [Google Scholar] [CrossRef] [PubMed]
- Nguyen, B.P.N.; Chazelle, S.; Cerbelaud, M.; Porcher, W.; Lestriez, B. Manufacturing of industry-relevant silicon negative composite electrodes for lithium ion-cells. J. Power Sources 2014, 262, 112–122. [Google Scholar] [CrossRef]
- Obravac, M.N.; Chevrier, V.L. Alloy negative electrodes for Li-ion batteries. Chem. Rev. 2014, 114, 11444–11502. [Google Scholar] [CrossRef] [PubMed]
- Kasavajjula, U.; Wang, C.; Appleby, A.J. Nano- and bulk-silicon-based insertion anodes for lithium-ion secondary cells. J. Power Sources 2004, 163, 1003–1039. [Google Scholar] [CrossRef]
- Aifantis, K.; Hackney, S.; Kumar, R. High Energy Density Lithium Batteries. Materials, Engineering, Applications; Wiley—VCH Verlag GmbH & Co. KGaA: Weinheim, Germany, 2010. [Google Scholar]
- Zuo, X.; Zhu, J.; Muller-Buschbaum, P.; Cheng, Y. Silicon based lithium-ion battery anodes: A chronicle perspective review. Nano Energy 2017, 31, 113–143. [Google Scholar] [CrossRef]
- Fiakas, D. The Race for Silicon Anodes. Small Cap Strategist. 2018. Available online: http://www.altenergystocks.com/archives/2018/08/the-race-for-silicon-anodes/ (accessed on 11 November 2018).
- Fiakas, D. Better Battery. Small Cap Strategist, Crystal Equity Research. 2018. Available online: http://crystalequityresearch.blogspot.com/2018/08/better-battery.html (accessed on 11 November 2018).
- Salah, M.; Murphy, P.; Hall, C.; Francis, C.; Kerr, R. Pure silicon thin-film anodes for lithium-ion batteries: A review. J. Power Sources 2019, 414, 48–67. [Google Scholar] [CrossRef]
- McDowell, M.T.; Ryu, I.; Lee, S.W.; Wang, C.; Nix, W.D.; Cui, Y. Studying the Kinetics of Crystalline Silicon Nanoparticle Lithiation with In Situ Transmission Electron Microscopy. Adv. Mater. 2012, 24, 6034–6041. [Google Scholar] [CrossRef] [PubMed]
- Gu, M.; Li, Y.; Li, X.; Hu, S.; Zhang, X.; Xu, W.; Thevuthasan, S.; Baer, D.R.; Zhang, J.-G.; Liu, J.; et al. In Situ TEM Study of Lithiation Behavior of Silicon Nanoparticles Attached to and Embedded in a Carbon Matrix. ACS Nano 2012, 6, 8439–8447. [Google Scholar] [CrossRef]
- Liu, X.H.; Huang, J.Y. In situ TEM electrochemistry of anode materials in lithium ion batteries. Energy Environ. Sci. 2011, 4, 3844–3860. [Google Scholar] [CrossRef]
- Liu, X.H.; Zhang, L.Q.; Zhong, L.; Liu, Y.; Zheng, H.; Wang, J.W.; Cho, J.-H.; Dayeh, S.A.; Picraux, S.T.; Sullivan, J.P.; et al. Ultrafast Electrochemical Lithiation of Individual Si Nanowire Anodes. Nano Lett. 2011, 11, 2251–2258. [Google Scholar] [CrossRef]
- Liu, X.H.; Zheng, H.; Zhong, L.; Huang, S.; Karki, K.; Zhang, L.Q.; Liu, Y.; Kushima, A.; Liang, W.T.; Wang, J.W.; et al. Anisotropic Swelling and Fracture of Silicon Nanowires during Lithiation. Nano Lett. 2011, 11, 3312–3318. [Google Scholar] [CrossRef]
- McDowell, M.T.; Lee, S.W.; Ryu, I.; Wu, H.; Nix, W.D.; Choi, J.W.; Cui, Y. Novel Size and Surface Oxide Effects in Silicon Nanowires as Lithium Battery Anodes. Nano Lett. 2011, 11, 4018–4025. [Google Scholar] [CrossRef] [PubMed]
- Liu, X.H.; Wang, J.W.; Huang, S.; Fan, F.; Huang, X.; Liu, Y.; Krylyuk, S.; Yoo, J.; Dayeh, S.A.; Davydov, A.V.; et al. In situ atomic-scale imaging of electrochemical lithiation in silicon. Nature Nanotechnol. 2012, 7, 749–756. [Google Scholar] [CrossRef] [PubMed]
- Gu, M.; Wang, Z.; Connell, J.G.; Perea, D.E.; Lauhon, L.J.; Gao, F.; Wang, C. Electronic Origin for the Phase Transition from Amorphous LixSi to Crystalline Li15Si. ACS Nano 2013, 7, 6303–6309. [Google Scholar] [CrossRef]
- Wang, Z.; Gu, M.; Zhou, Y.; Zu, X.; Connell, J.G.; Xiao, J.; Perea, D.; Lauhon, L.J.; Bang, J.; Zhang, S.; et al. Electron-Rich Driven Electrochemical Solid-State Amorphization in Li−Si Alloys. Nano Lett. 2013, 13, 4511–4516. [Google Scholar] [CrossRef] [PubMed]
- Hüger, E.; Uxa, D.; Yang, F.; Schmidt, H. The Lithiation Onset of Amorphous Silicon Thin-Film Electrodes, APL Special Topic: New technologies and applications of advanced batteries. Appl. Phys. Lett. 2022, 221, 133901. [Google Scholar] [CrossRef]
- Zhang, K.; Hüger, E.; Li, Y.; Schmidt, H.; Yang, F. Invited: Review and Stress Analysis on the Lithiation Onset of Amorphous Silicon Films. Batteries Special Issue: Electrode Materials for Rechargeable Lithium Batteries. Batteries 2023, 9, 105. [Google Scholar] [CrossRef]
- Lyubina, J. Phase transformations and hysteresis in Si based anode materials. Appl. Phys. Lett. 2021, 118, 090501. [Google Scholar] [CrossRef]
- Hatchard, T.D.; Dahn, J.R. In Situ XRD and Electrochemical Study of the Reaction of Lithium with Amorphous Silicon. J. Electrochem. Soc. 2004, 151, A838–A842. [Google Scholar] [CrossRef]
- Sethuraman, V.A.; Kowolika, K.; Srinivasan, V. Increased cycling efficiency and rate capability of copper-coated silicon anodes in lithium-ion batteries. J. Power Sources 2011, 196, 393–398. [Google Scholar] [CrossRef]
- McDowell, M.T.; Lee, S.W.; Wang, C.; Cui, Y. The effect of metallic coatings and crystallinity on the volume expansion of silicon during electrochemical lithiation/delithiation. Nano Energy 2012, 1, 401–410. [Google Scholar] [CrossRef]
- Okamoto, H. Supplemental Literature Review of Binary Phase Diagrams: Ag-Ni, Ag-Zr, Au-Bi, B-Ni, Co-Sb, Cu-Mn, Cu-Si, Cu-Zn, Fe-Zr, Li-Sb, Mg-Pu, and Si-Zr. J. Phase Equilib. Diffus. 2018, 39, 87–100. [Google Scholar] [CrossRef]
- Parditka, B.; Verzhak, M.; Balogh, Z.; Csik, A.; Langer, G.A.; Beke, D.L.; Ibrahim, M.; Schmitz, G.; Erdelyi, Z. Phase growth in an amorphous Si–Cu system, as shown by a combination of SNMS, XPS, XRD and APT techniques. Acta Mater. 2013, 61, 7173–7179. [Google Scholar] [CrossRef]
- Balogh, Z.; Ibrahim, M.; Stender, P.; Schlesiger, R.; Greiwe, G.-H.; Schmitz, G.; Parditka, B.; Langer, G.A.; Csik, A.; Erdélyi, Z. On the influence of the stacking sequence in the nucleation of Cu3Si: Experiment and the testing of nucleation models. Acta Mater. 2014, 76, 306–313. [Google Scholar]
- Okamoto, H. Supplemental Literature Review of Binary Phase Diagrams: Ag-Cl, Br-Pb, Br-Zn, C-Cu, Ce-Zr, Cl-Zn, Fe-Lu, Fe-Tm, Ga-V, Nd-Ti, Nd-Zr, and Si-Ta. J. Phase Equilib. Diffus. 2016, 37, 246–257. [Google Scholar] [CrossRef]
- Kaur, G.; Gates, B.D. Review: Surface Coatings for Cathodes in Lithium Ion Batteries: From Crystal Structures to Electrochemical Performance. J. Electrochem. Soc. 2022, 169, 043504. [Google Scholar] [CrossRef]
- Hüger, E.; Dörrer, L.; Yimnirun, R.; Jutimoosik, J.; Stahn, J.; Paul, A. Lithium permeation within lithium niobate multilayers with ultrathin chromium, silicon and carbon spacer layers. Phys. Chem. Chem. Phys. 2018, 20, 23233–23243. [Google Scholar] [CrossRef]
- Paul, P.P.; McShane, E.J.; Colclasure, A.M.; Brown, D.E.; Balsara, N.; Cao, C.; Chen, B.-R.; Chinnam, P.R.; Cui, Y.; Dufek, E.J.; et al. Nelson A Review of Existing and Emerging Methods for Lithium Detection and Characterization in Li-ion and Li-metal Batteries. Adv. Energy Mater. 2021, 11, 2100372. [Google Scholar] [CrossRef]
- Dillon, R.O.; Woollam, J.A.; Katkanant, V. Use of Raman scattering to investigate disorder and crystallite formation in as-deposited and annealed carbon films. Phys. Rev. B 1984, 29, 3482. [Google Scholar] [CrossRef]
- Tamor, M.A.; Vassell, W.C. Raman “fingerprinting” of amorphous carbon films. J. Appl. Phys. 1994, 76, 3823. [Google Scholar] [CrossRef]
- Ferrari, A.C.; Robertson, J. Interpretation of Raman spectra of disordered and amorphous carbon. Phys. Rev. B 2000, 61, 14095. [Google Scholar] [CrossRef]
- Ferrari, A.C. Raman spectroscopy of graphene and graphite: Disorder, electron–phonon coupling, doping and nonadiabatic effects. Solid State Commun. 2007, 143, 47–57. [Google Scholar] [CrossRef]
- Wang, L.; Zhang, R.; Jansson, U.; Nedfors, N. A near-wearless and extremely long lifetime amorphous carbon film under high vacuum. Sci. Rep. 2015, 5, 11119. [Google Scholar] [CrossRef] [PubMed]
- Aurbach, D.; Levi, M.D.; Levi, E.; Schechter, A. Failure and Stabilization Mechanisms of Graphite Electrodes. J. Phys. Chem. B 1997, 101, 2195–2206. [Google Scholar] [CrossRef]
- Levi, M.D.; Aurbach, D. The mechanism of lithium intercalation in graphite film electrodes in aprotic media. Part High resolution slow scan rate cyclic voltammetric studies and modeling. J. Electroanal. Chem. 1997, 421, 79–88. [Google Scholar] [CrossRef]
- Markowski, B.; Levi, M.D.; Aurbach, D. The basic electroanalytical behavior of practical graphite lithium intercalation electrodes. Electrochim. Acta 1998, 43, 2287–2304. [Google Scholar]
- Kanga, S.-H.; Abrahama, D.P.; Xiao, A.; Lucht, B.L. Investigating the solid electrolyte interphase using binder-free graphite electrodes. J. Power Sources 2008, 175, 526–532. [Google Scholar] [CrossRef]
- Tripathi, A.M.; Su, W.-N.; Hwang, B.J. In situ analytical techniques for battery interface analysis. Chem. Soc. Rev. 2018, 47, 736–851. [Google Scholar] [CrossRef]
- Simon, P.; Gogotsi, Y.; Dunn, B. Where Do Batteries End and Supercapacitors Begin? Science 2014, 343, 1210–1211. [Google Scholar] [CrossRef]
- Brousse, T.; Belanger, D.; Long, J.W. To Be or Not to Be Pseudocapacitive? J. Electrochem. Soc. 2015, 162, A5185–A5189. [Google Scholar] [CrossRef]
- Fleischmann, S.; Mitchell, J.B.; Wang, R.; Zhan, C.; Jiang, D.; Presser, V.; Augustyn, V. Pseudocapacitance: From Fundamental Understanding to High Power Energy Storage Materials. Chem. Rev. 2020, 120, 6738–6782. [Google Scholar] [CrossRef]
- McDonald, J.R. Impedance Spectroscopy: Emphasizing Solid Materials and Systems; John Wiley & Sons, Inc.: Hoboken, NJ, USA; ISBN 0-471-64749-7.
- Fu, L.; Chen, C.-C.; Samuelis, D.; Maier, J. Thermodynamics of Lithium Storage at Abrupt Junctions: Modeling and Experimental Evidence. PRL 2004, 112, 208301. [Google Scholar] [CrossRef]
- Chen, C.-C.; Fu, L.; Maier, J. Synergetic, ultrafast mass storage and removal in artificial mixed conductors. Nature 2016, 536, 159–165. [Google Scholar] [CrossRef]
- Usiskin, R.; Maier, J. Interfacial Effects in Lithium and Sodium Batteries. Adv. Energy Mater. 2021, 11, 2001455. [Google Scholar] [CrossRef]
- Bisquert, J.; Garcia-Belmonte, G.; Bueno, P.; Longo, E.; Bulhoes, L.O.S. Impedance of constant phase element (CPE)-blocked diffusion in film electrodes. J. Electroanal. Chem. 1998, 452, 229–234. [Google Scholar] [CrossRef]
- Diard, J.-P.; Montella, C. Diffusion-trapping impedance under restricted linear diffusion conditions. J. Electroanal. Chem. 2003, 557, 19–36. [Google Scholar] [CrossRef]
- Kaganer, V.M.; Stepanov, S.A.; Kohler, R. Bragg diffraction peaks in x-ray diffuse scattering from multilayers with rough interfaces. Phys. Rev. B 1995, 52, 16369–16372. [Google Scholar] [CrossRef]
- Holy, V.; Baumbach, T. Nonspecular x ray reflection from rough multilayers. Phys. Rev. B 1994, 52, 10668–10676. [Google Scholar] [CrossRef]
- Wilson, R.G.; Stevie, F.A.; Magee, C.W. The Annual Workshop on Sims Secondary Ion Mass Spectrometry: A Practical Handbook for Depth Profiling And Bulk Impurity Analysis; John Wiley and Sons: Hoboken, NJ, USA, 1989. [Google Scholar]
- Sheldon, B.W.; Soni, S.K.; Xiao, X.; Qi, Y. Stress Contributions to Solution Thermodynamics in Li-Si Alloys. Electrochem. Solid State Lett. 2012, 15, A9–A11. [Google Scholar] [CrossRef]
- Zhang, Y.; Li, Y.; Wang, Z.; Zhao, K. Lithiation of SiO2 in Li-Ion Batteries: In Situ Transmission Electron Microscopy Experiments and Theoretical Studies. Nano Lett. 2014, 14, 7161–7170. [Google Scholar] [CrossRef]
- Kim, S.; Choi, S.J.; Zhao, K.; Yang, H.; Gobbi, C.; Zhang, S.; Li, J. Electrochemically driven mechanical energy harvesting. Nat. Commun. 2016, 7, 10146. [Google Scholar] [CrossRef] [PubMed]
- Uxa, D.; Hüger, E.; Schmidt, H. Li Diffusion in Thin Film LiySi Electrodes: Galvanostatic Intermittent Titration Technique and Tracer Diffusion Experiments. J. Phys. Chem. 2020, 124, 27894–27899. [Google Scholar] [CrossRef]
- Hüger, E.; Dörrer, L.; Schmidt, H. Permeation, Solubility, Diffusion and Segregation of Lithium in Amorphous Silicon Layers. Chem. Mater. 2018, 30, 3254–3264. [Google Scholar] [CrossRef]


Disclaimer/Publisher’s Note: The statements, opinions and data contained in all publications are solely those of the individual author(s) and contributor(s) and not of MDPI and/or the editor(s). MDPI and/or the editor(s) disclaim responsibility for any injury to people or property resulting from any ideas, methods, instructions or products referred to in the content. |
© 2023 by the authors. Licensee MDPI, Basel, Switzerland. This article is an open access article distributed under the terms and conditions of the Creative Commons Attribution (CC BY) license (https://creativecommons.org/licenses/by/4.0/).