Article

Solar-Thermal-Chemical Integrated Design of a Cavity-Type Solar-Driven Methane Dry Reforming Reactor

Key Laboratory of Thermo-Fluid Science and Engineering of MOE, School of Energy and Power Engineering, Xi’an Jiaotong University, Xi’an 710000, China
*
Author to whom correspondence should be addressed.
Energies 2023, 16(6), 2781; https://doi.org/10.3390/en16062781
Submission received: 3 February 2023 / Revised: 13 March 2023 / Accepted: 14 March 2023 / Published: 16 March 2023
(This article belongs to the Special Issue Advances in Solar Thermal Energy Harvesting, Storage and Conversion)

Abstract

:
In this work, the solar-thermal-chemical integrated design for a methane dry reforming reactor with cavity-type solar absorption was numerically performed. Combined with a multiphysical reactor model, the gradient optimization algorithm was used to find optimal radiation flux distribution with fixed total incident solar energy for maximizing overall hydrogen yield, defined as the ratio of molar flow of exported hydrogen to imported methane, which can be applied for guiding the optical property design of solar adsorption surface. The comprehensive performances of the reactor under the conditions of original solar flux and optimal solar flux were analyzed and compared. The results show that for the inlet volume flow rate of 8–14 L·min−1, the hydrogen production rate was increased by up to 5.10%, the energy storage efficiency was increased by up to 5.55%, and the methane conversion rate was increased by up to 6.01%. Finally, the local absorptivities of the solar-absorptive coating on the cavity walls were optimized and determined using a genetic algorithm, which could realize the predicted optimal radiation flux distribution.

1. Introduction

To combat global warming and fossil energy shortages, it is important to increase the share of renewable energy consumption to achieve sustainable development [1,2,3]. It is noteworthy that the solar-driven dry reforming of methane (DRM) is a promising clean energy technology that integrates hydrogen production, carbon sequestration, and solar energy utilization [4,5], which uses concentrating mirrors to collect light and heat to create a high-temperature environment and achieve an increase in the calorific value of fuel [5,6,7].
For solar thermochemical reactors and absorbers, the construction plays a major role in the energy utilization’s efficiency and safety. According to the form of contact between fluid/particles and solar radiation, solar absorbers/reactors can be divided into the direct and indirect system [8,9,10]. For direct solar absorbers, much of the research has been devoted to maximizing the ‘volumetric effect’ and thus achieving higher utilization efficiency. This effect is defined as solar radiation penetrating the absorber and volumetric absorption, the lower frontal temperature of the absorber which is lower than the outlet fluid temperature due to convection cooling the inlet fluid, and finally the lower frontal face heat radiation loss [11,12]. The thermal performance of the silicon carbide foam solar absorber with four different geometric parameters was investigated by a combination of experiments and simulations by Wang et al. [13]. The results showed that the maximum thermal efficiency of this direct solar absorber is 72.48% at a porosity of 0.95, which proves that the increase in porosity has a positive effect on the ‘volumetric effect’. In addition, for absorbers with the same porosity (a porosity of 0.85), the pore size reduction also helps to increase thermal efficiency. Unlike ref. [13], Du et al. [14] used super-alloy Inconel 718 as a material, combined with pore-scale reconstruction and 3D printing techniques, and fabricated several porous samples with different geometric parameters as porous volume solar receivers. The experimental results show that for a uniform solar radiation receiver, the small aperture sample is beneficial for enhancing convective heat transfer and reducing the front surface temperature and heat radiation loss, but weakens the radiation penetration depth. In addition, the researchers also proposed a radial gradient variation design, which improves the thermal efficiency of the bulk absorber and reduces the flow resistance. Kasaeian et al. [15] studied the performance of a multi-channel volumetric solar absorber with different aperture shapes of the same internal surface area by numerical simulation. The results showed that the triangular channel achieved the highest outlet gas temperature of 894.2 °C and an efficiency of 0.697, while the circular channel showed the lowest outlet temperature of 869.8 °C and an efficiency of 0.676. Li et al. [16] built a numerical model of solar-thermal integration for volumetric solar absorber and optimized the two parameters of porosity and pore size in radial and axial sub-regions by combining it with a genetic algorithm. The optimization results show that, compared with a uniform porous absorber, the thermal efficiency of an optimal sub-regional gradient porous absorber can be improved by 1.23~9.76%, and the pressure drop can be reduced by 7.88~55.73%. Raffaele et al. [17] creatively designed and fabricated a needle-type volumetric absorber and tested its performance, which showed that the absorber has an outlet fluid temperature higher than the front surface solid temperature and a thermal efficiency reaching 90%, much higher than other types of absorbers, achieving the so-called volumetric effect. Based on these studies, some scholars have also carried out a lot of work for the volumetric solar-thermal-chemical reactor. For instance, Shi et al. combined the biomimetic leaf-type [18] and biomimetic venous [19] concepts to propose two hierarchical porous structure reactors and showed that the methane conversion of the two new reactors increased by 4.5% and 5.9%, respectively, compared to the conventional homogeneous pore structure reactor. Correspondingly, Liu et al. [20] also proposed a foam reactor with concave geometry at the front end, and optimized the porosity, pore size, and reactor length parameters by numerical simulation combined with a multi-island genetic algorithm, and the results showed that the optimized solar fuel efficiency reached 53.3%.
Indirect solar heat absorbers/reactors have also been extensively studied by many scholars because of their simple structure, safety, and stability. Most indirect solar absorbers/reactors have a cavity structure because of the cavity effect (multiple reflections and the absorption of visible infrared radiation at the cavity wall), which enhances solar radiation utilization. Therefore, Bellos et al. [21] studied five different coil-type cavity receivers for solar dish concentrators, and the results showed that the cylindrical-conical structure has the best optical efficiency of 85.42% and the highest thermal efficiency of 67.95%. Beyond that, a novel construction for a gas-phase solar indirect irradiation receiver was also crafted by Sedighi et al. [22], combined with impact jet compound technology, and the findings revealed that the cylindrical cavity with an inverted conical base has the maximum optical efficiency of roughly 92%. Huang et al. [23] exploited a numerical model of radiation transfer within a coupled cavity to evaluate the absorption performance of solar radiation by both structures (direct/indirect). The results revealed that the indirect radiation receiver shows a higher solar thermal efficiency compared to the direct absorption radiation receiver.
Carbon deposition is an unavoidable problem during the thermochemical reaction of methane reforming. In commercial applications, carbon deposition in the chemical reaction imposes regular cleaning requirements for the glass window of direct solar thermal chemical reactors. The safety of the glass window also seems to be difficult to guarantee under a high temperature. Indirect solar thermochemical reactors can be designed without glass windows, and combined with the concept of cavity design, can also achieve a higher optical efficiency and energy storage efficiency. The indirect thermochemical reactor is also simpler in structure, which is convenient for early installation and later maintenance. In summary, indirect solar thermal chemical reactors seem to be more suitable for commercial application and promotion.
For cavity receivers, the concentrated solar radiation is absorbed by the surface of the cavity, and the heat flux distribution on the cavity wall is normally extremely uneven. Thus, when extreme operating conditions occur, the cavity walls can develop local hot spots due to large temperature gradients, resulting in large thermal stresses, which are a great challenge for the reliability of the receiver [24,25,26]. On the other hand, the radiant heat flux distribution on the cavity surface also affects the overall temperature field distribution, which in turn affects the overall energy storage efficiency of the device [27,28,29,30]. In order to solve the above problems, Yan et al. [25] proposed a structural optimization method for a disc concentrator in order to improve the heat flux uniformity at the wall of a solar cavity-type absorber. The results showed that the non-uniformity factor was reduced from 0.55~0.63 to 0.10~0.22 while ensuring excellent optical efficiency. Different from the method in ref. [25], Wang et al. [31] addressed the problem of the uneven distribution of solar flux on the solar tower receiver wall by optimizing the distribution of cavity wall coats in an attempt to achieve a uniformity of flux distribution while maintaining the lowest possible optical loss. This work shows that enhancing flux uniformity and reducing reflection losses are two conflicting objectives, and a trade-off choice needs to be made between them. Similarly, Tang et al. [32,33] achieved nearly uniform circumferential solar heat flow and optimal axial solar heat flow by arranging secondary mirrors and an adapted trough concentrator, improving the fuel conversion and energy storage efficiency for the straight-tube indirect solar methanol reforming reactor.
The distribution of the solar radiation heat flux on the cavity wall greatly influences the optical efficiency and the safety of a solar thermochemical reactor. Therefore, in this study, a numerical solar-thermal-chemical model is constructed for the cavity-type solar thermochemical reactor with a dish concentrator based on the previous study [34]. The gradient optimization algorithm is used to find the optimal solar radiation heat flux distribution with a constant total incident solar energy, using the optimization of the hydrogen yield as the optimization objective. In addition, the comprehensive performances of the reactor’s original heat flux and optimal heat flux are compared and analyzed. Finally, this study optimizes the absorptivity of the solar absorption coating on the cavity wall using a genetic algorithm, which achieves the optimal solar radiation flux distribution.

2. Mathematical Model and Optimization Method

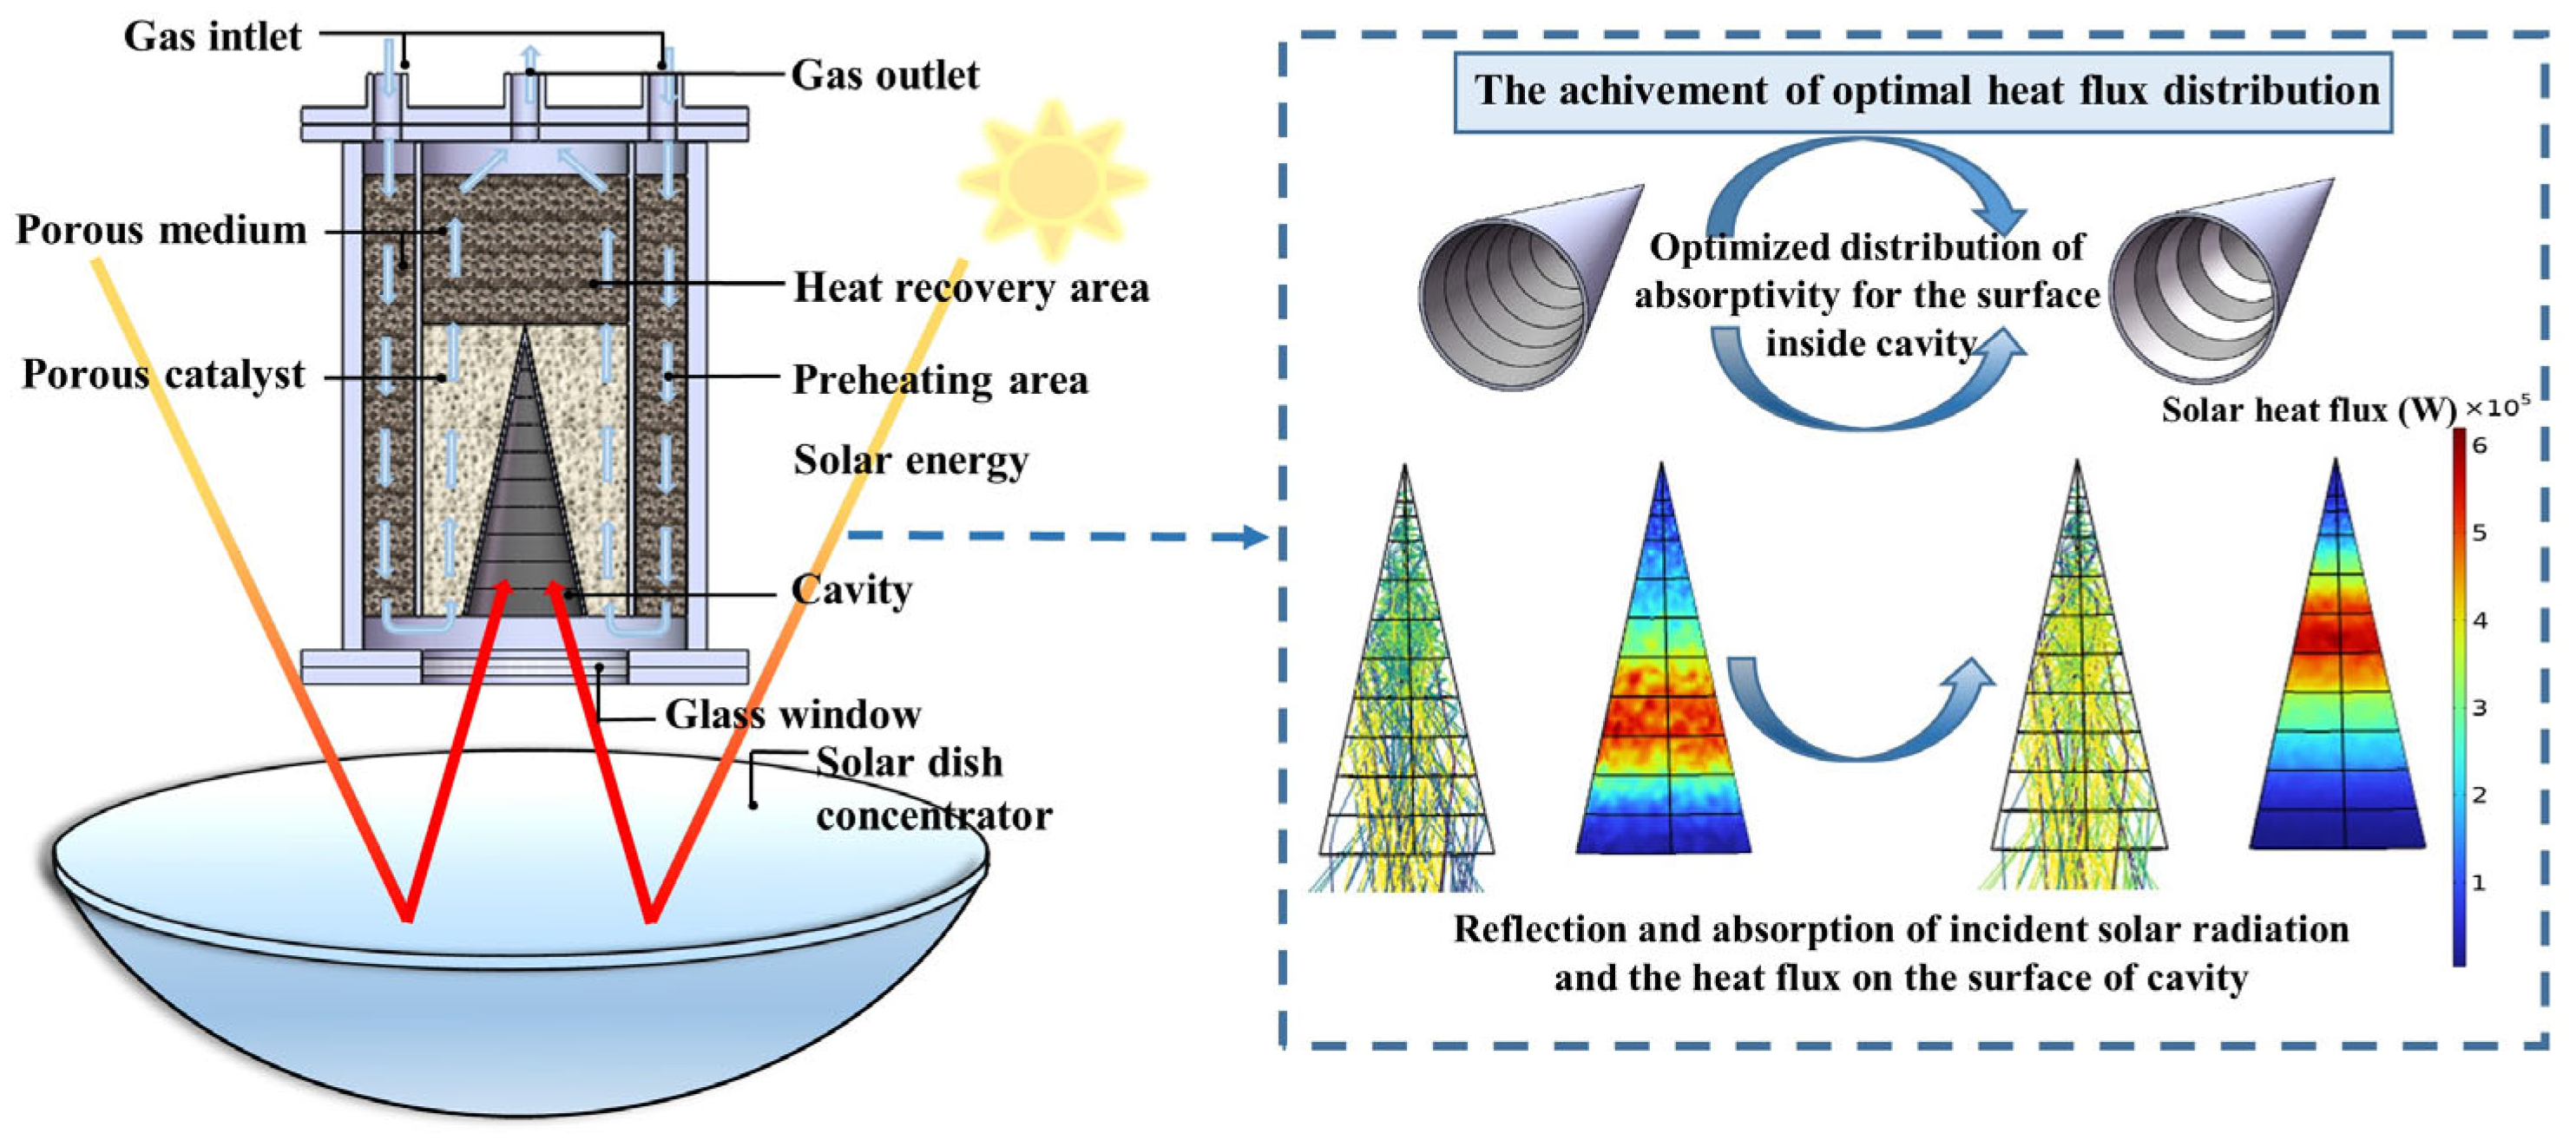
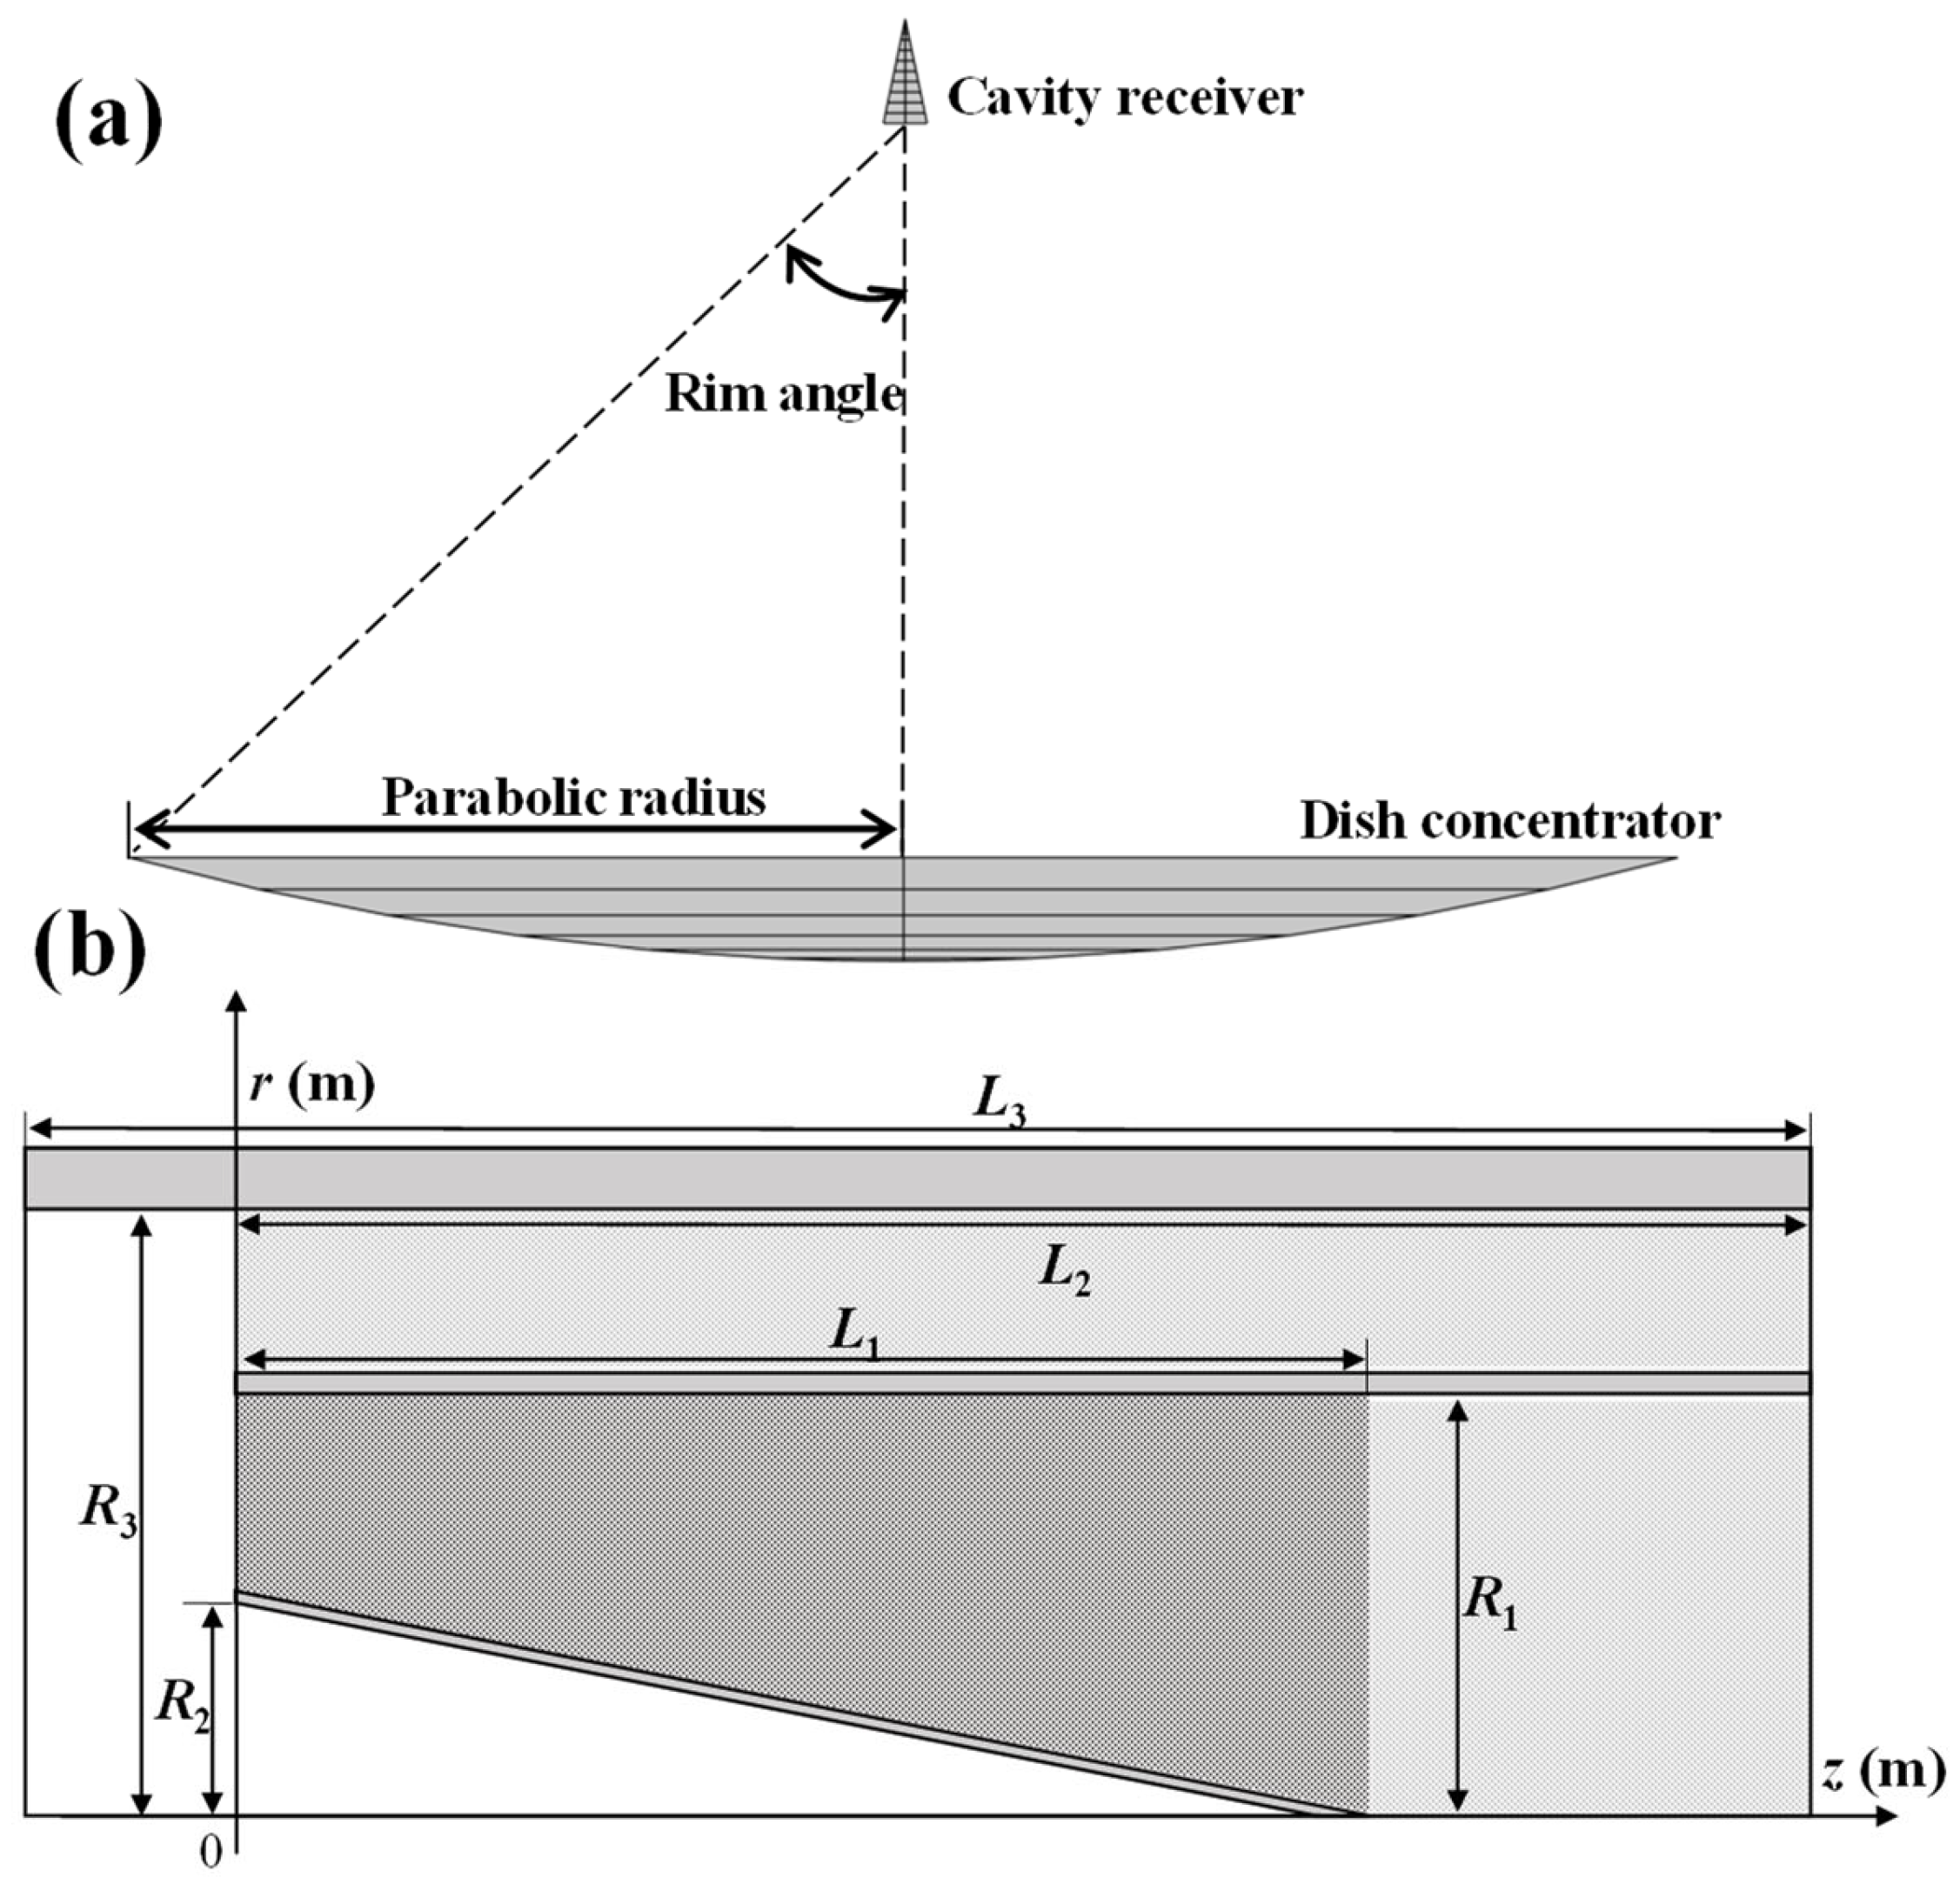
2.1. Model Description

As shown in Figure 1, the concentrator reactor involved in this study was mainly divided into two parts: one part was the dish concentrator system for the energy conversion of solar-to-thermal energy, and the other part was the thermochemical reactor for the energy conversion of thermal-to-chemical energy. As shown in Figure 2a, the dish concentrator system was simplified to a model which included a parabolic concentrating mirror and a light-receiving conical cavity. It was simulated by the non-sequential ray-tracing method, which has no predefined path for any rays. The ray is emitted and projected onto any object in the ray path, and then may be reflected, refracted, scattered, etc. Additionally, in this study, only the reflection and absorption of light were considered. During the optical simulations, the solar direct normal irradiance (DNI) was assumed to be stable at 1000 W·m−2, the radius of the dish concentrator was 1.2 m, and the reflectivity of the mirror was 0.9. Other relevant parameters are shown in Table 1.
The thermochemical reactor, due to the structural symmetry and computational consideration, was simplified to a two-dimensional (2D) model in this study, which is shown in Figure 2b. All solar energy collected by the dish concentrator was reflected into the cavity, absorbed by the surface, and converted into thermal energy. The porous media were arranged in the preheating area. Then, the gas mixture (CH4 and CO2) at the feed ratio of 1:1 entered the outer channel’s preheating area. The inlet flow rate of the gas mixture was set to 10 L·min−1. Considering that too-high inlet volume flow rates would lead to the under-utilization of the inlet reactants and that too low inlet volume flow rates would lead to a sufficient supply of energy such that the change in flux distribution at the cavity wall would have almost no effect, an incorrect optimization solution would be obtained that would not be applicable for the whole operating field. Therefore, an appropriate inlet volume flow rate of 10 L·min−1 was chosen as the operating parameter in the subsequent optimization process. The gas mixture entered from the outer channel and was heated and then turned around to flow into the inner channel. It is noteworthy that the reaction area was a SiC porous ceramic coated with the catalyst Ni/Al2O3. The relevant structural parameters were determined according to those in ref. [34]. Moreover, the rear section of the inner channel was also filled with a porous medium to enhance heat transfer for the full utilization of solar sensible heat. The ambient temperature was set to 300 K, which was considered as the temperature of the reactants at the inlet.

2.2. Mathematical Model

2.2.1. Mass Conservation Equation

The equation for the mass conservation of the gas mixture can be expressed as
ρ f u = 0
where u is the superficial velocity.

2.2.2. Momentum Conservation Equation

The momentum conservation equation for fluid flow in the porous reaction bed can be indicated as
1 φ ρ f u u φ = p + μ f φ u + F
where F is the resistance term, and μf is the dynamic viscosity of gas mixture which is described in the Wilke equation, which is
μ f = i = 1 n m i μ i j = 1 n m j ϕ ij
ϕ ij = 1 8 1 + μ i μ j 1 / 2 M i M j 1 / 4 2 1 + M i M j 1 / 2
where mi, μi, and Mi refer to the mole fraction, viscosity, and molecular weight of species i, respectively.
The resistance term F in Equation (2) can be indicated as [35]
F = 1039 1002 φ d p 2 μ f u 0.5138 ρ f φ 5.739 d p u u

2.2.3. Energy Conservation Equation

Considering the temperature difference between the solid and the fluid inside the porous medium and the difference in physical properties, the local thermal non-equilibrium (LTNE) assumption [36] is used in this study, which can be indicated as
the fluid phase:
( ρ f C p , f u T f ) = 𝜆 e , f T f + S f  
and the solid phase:
( ρ s C p , s T s ) = 𝜆 e , s T s + S s  
where subscripts “f” and “s” denote fluid and solid, respectively; Cp,f and Cp,s are the specific heats at a constant pressure of the fluid phase and solid phase; λe,f and λe,s are the effective thermal conductivities; Sf and Ss are the heat source terms.
Equations (8) and (9) show the effective thermal conductivities of solid and fluid from the Schuetz–Glicksman empirical formula [37].
𝜆 e , f = φ 𝜆 f
𝜆 e , s = 𝜆 s 3 ( 1 φ )
The heat source terms Sf and Ss of the energy equations are calculated by
S f = S con , f + S chem
S s = S con , s + S r + S loss
where Schem is the heat generation and consumption source term caused by chemical reactions; Scon,f and Scon,s are the convective heat transfer terms between the fluid phase and solid phase, respectively; Sloss is the radiative heat dissipation.
The energy source, Sr, due to thermal radiation, is estimated by the Rosseland approximation [38], which can be expressed as
S r = 16 n 2 σ T 3 κ e 3 d T d z
In addition, the radiation heat loss of the cavity radiation is assessed on the basis of surface-to-surface radiation. The cavity inner walls are divided into N discrete surface elements and then the radiative heat transfer among them is computed. For each surface k, the radiosity, Jk, is evaluated by the following equation:
J k = ε k σ T k + τ k j = 1 N J j F kj
where ε k is the emissivity of the surface k, and τ k is the reflectivity of the surface k. For opaque gray body surfaces, the reflectivity can be simply expressed as τ k = 1 ε k . The term Fkj represents the view factor between the surface k and the generic surface j.
The radiative heat loss from the front surface can be calculated by the following equation:
S loss = ε σ ( T 4 T 0 4 )
where T0 is the ambient temperature (300 K).
Furthermore, the relationship between the source terms Scon,f and Scon,s can be described as
S con , f = S con , s = h v ( T s T f )
Additionally, the two-phase heat exchange coefficient, hv, obtained by Wu et al. [35] can be described as
h v = 𝜆 f ( 32.504 φ 0.38 109.94 φ 1.38 + 166.65 φ 2.38 86.98 φ 3.38 ) R e 0.438 d p 2
where Re is the Reynolds number, which is defined by
R e = ρ f u d p μ f

2.2.4. Species Conservation Equation

The mass transfer equation can be expressed as [39]
ρ f ( u ) ω i + ( ρ ω i j = 1 n D ij ( m j + ( m j ω j ) ( p p ) ) + D i T ( T T ) ) = S i
where ω i , D ij , D i T and Si are, respectively, the mass fraction for the gas of species i, the multicomponent Fick’s diffusivity of components i/j, the thermal diffusion coefficient, and the species generation rate.
The specific heat and thermal conductivity of gas can be calculated by using the mixing law [40]:
C p , f = i n ω i C p , i
𝜆 f = i n m i 𝜆 i
where λi and Cp,i represent the thermal conductivity coefficient and the heat capacity and enthalpy coefficients of species i. The relevant parameters from the COMSOL material library are used here.

2.2.5. Reaction Kinetics

The reaction kinetics of DRM are a very complex reaction system and the kinetic expression can be shown below.
(1) The dry reforming of methane [41]
CH 4 + CO 2 2 CO + 2 H 2 · Δ H 298 o = + 247.0 kJ / mol
r 1 = ρ cat k 1 K CO 2 , 1 K CH 4 , 1 P CH 4 P CO 2 ( 1 + K CO 2 , 1 P CO 2 + K CH 4 , 1 P CH 4 ) 2 1 ( P CO P H 2 ) 2 K P 1 P CH 4 P CO 2
(2) The reverse water-gas shift reaction (RWGS) [41]
CO 2 + H 2 CO + H 2 O · Δ H 298 o = + 41.7 kJ / mol
r 2 = ρ cat k 2 K CO 2 , 2 K H 2 , 2 P CO 2 P H 2 ( 1 + K CO 2 , 2 P CO 2 + K H 2 , 2 P H 2 ) 2 1 P CO P H 2 O K P 2 P CO 2 P H 2
(3) The methane cracking reaction [42]
CH 4 C + 2 H 2 · Δ H 298 o = + 74.0 kJ / mol
r 3 = ρ cat k 3 K CH 4 , 3 ( P CH 4 P H 2 2 K P 3 ) ( 1 + K CH 4 , 3 P CH 4 + P H 2 1 . 5 K H 2 , 3 ) 2
where the relevant kinetic parameters are listed in Table 2.
The reaction source term can be expressed as
S chem = i = 1 3 r i Δ H
where Δ H is the reaction enthalpy.
The hydrogen production rate, r H 2 , can also be expressed as
r H 2 = 2 r 1 + 2 r 3 r 2
Furthermore, the methane conversion, η CH 4 , and the carbon dioxide, η CO 2 , can be expressed as
η CH 4 = F CH 4 , in F CH 4 , out F CH 4 , in
η CO 2 = F CO 2 , in F CO 2 , out F CO 2 , in
The hydrogen yield characterizes the performance in terms of hydrogen production, which can be defined as
Y H 2 = F H 2 , out / M H 2 F CH 4 , in / M CH 4
Typically, the product is stored under environmental conditions, so the chemical storage energy is defined by reaction enthalpy. The chemical energy storage efficiency is defined as
η ch = Q ch Q so = i = 1 3 r i Δ H i , 298 d V I ( z ) d V
When the outlet product is cooled to ambient temperature, the released sensible heat, Qse, can be indicated as
Q se = i T s 300 K F i , out C p , i d T
According to the above definition, we can observe that the system energy loss Qlo can be expressed as
Q lo = Q so Q ch Q se

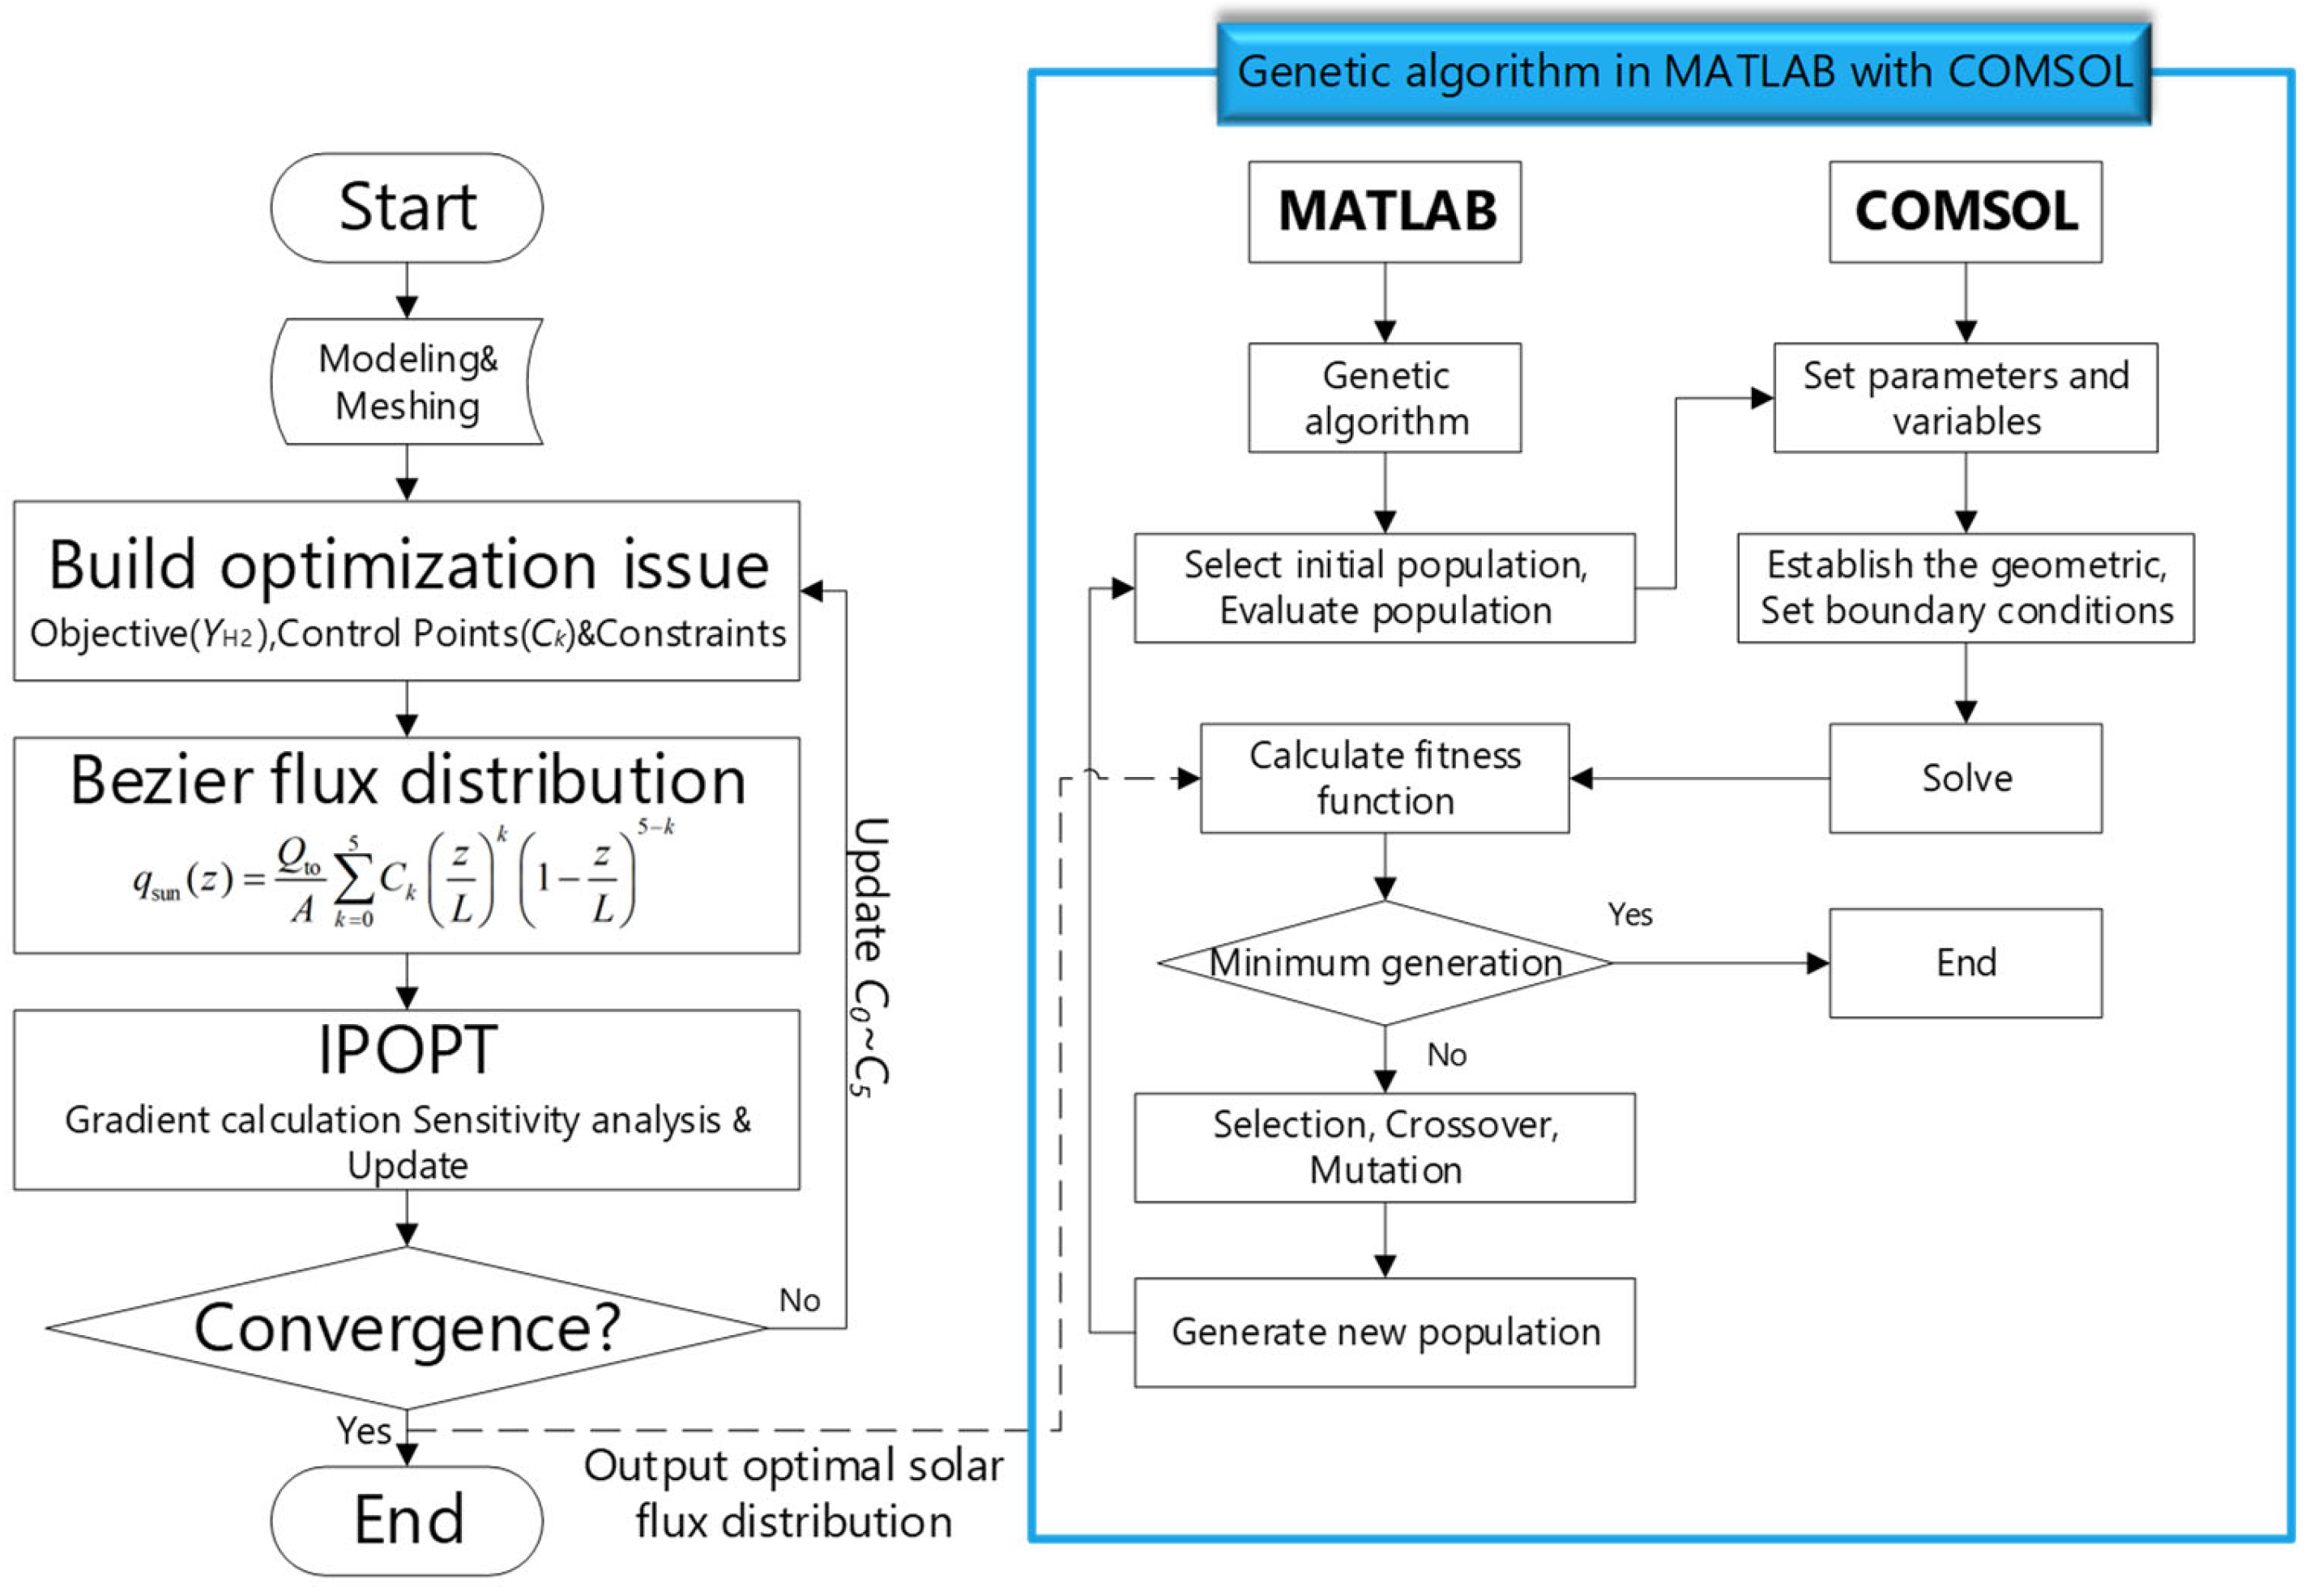
2.3. Optimization Method for Solar Flux and Absorptivity
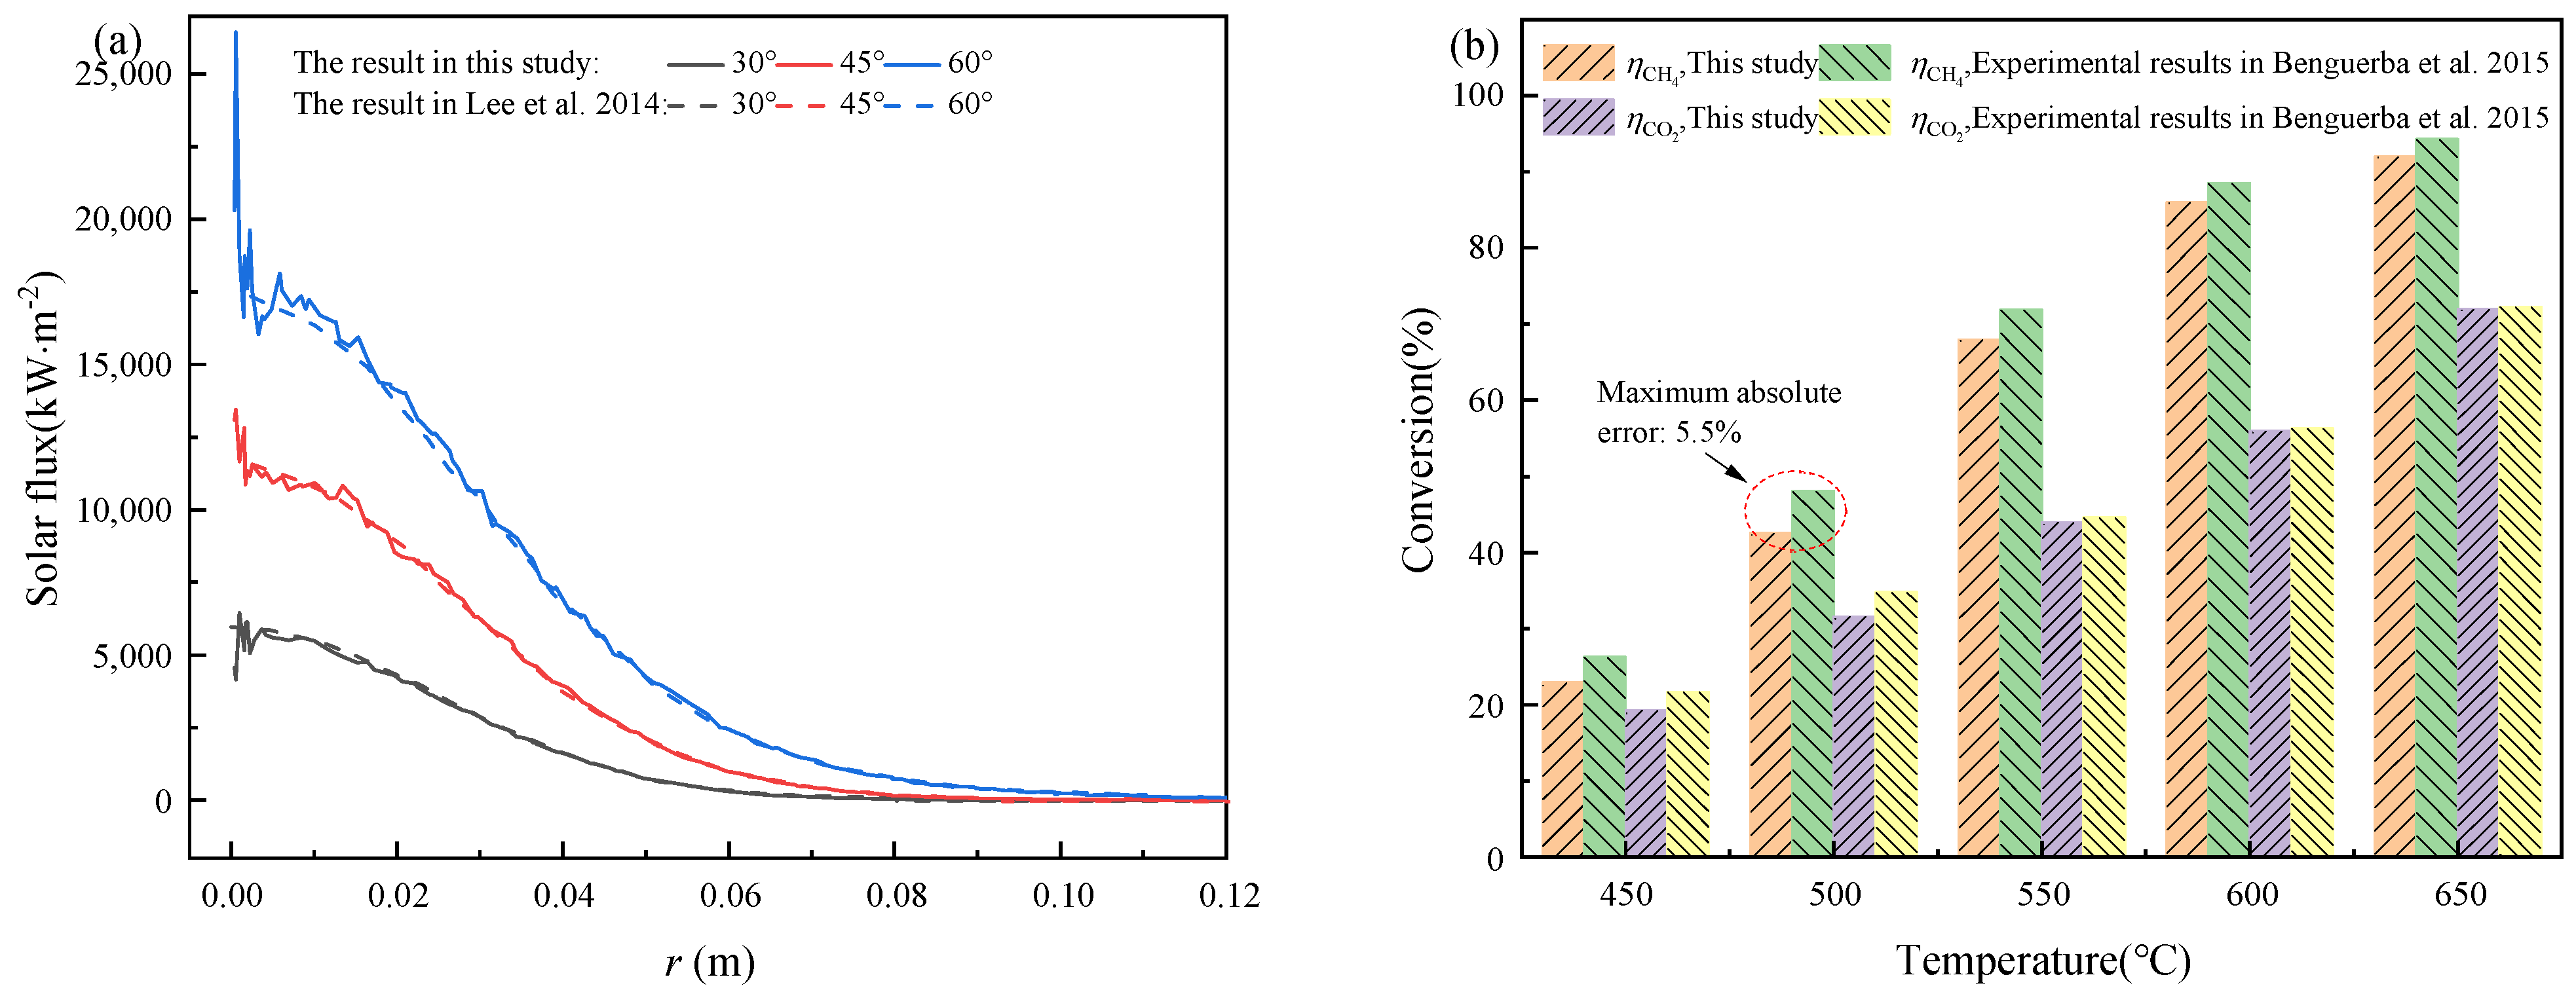
The hydrogen yield, Y H 2 , was considered to be an important performance parameter indicator. In the optimization process, the highest hydrogen yield production was obtained by optimizing the solar flux distribution in the cavity, and it was taken as the objective function. For solar flux distribution, it was described by the Bezier curve, which is widely used in scenarios such as shape-optimized design [43,44] and robot motion control [45,46]. In addition, the curve was very suitable for the gradient optimization algorithm in this study due to its high order derivability. All optimization-related processes are shown in Figure 3. In the first stage, the gradient optimization algorithm searches for the optimal radiation flux distribution mathematically described by the 5th-order Bernstein basis function around the objective of maximizing the hydrogen yield. In the second stage, the objective is to minimize the difference between the true flux distribution and the optimal radiation flux distribution are which mathematically described by least squares. The cavity wall absorbance was varied to achieve the optimal flux distribution in the joint simulation of MATLAB and COMSOL.
The interior point optimizer (IPOPT) in the COMSOL software was used in this study to find the optimal solar flux distribution. Based on the full-space in-point method, IPOPT can efficiently solve large-scale nonlinear optimization problems while maintaining excellent convergence characteristics, the suitability of which will be demonstrated later [47]. In this study, considering the amount of computation and the accuracy of the mathematical description, the 5th-order Bernstein basis function was used to describe the flux distribution, which is expressed as
q sun ( z ) = Q to A k = 0 5 C k z L k 1 z L 5 k
where Qto is the total incident solar energy, A is the cavity surface area, and Ck is the control point of the curve. Two constraints are considered in this study: a solar heat flux greater than or equal to 0, and a fixed total incident solar energy, as shown in Equation (36).
Objective   function :       max ( Y H 2 )   s . t :       q sun ( z ) 0 q sun z d A = Q to
After solving the optimal radiation flux distribution, the cavity wall was divided into 10 zones at a radial spacing of 0.0017 m. Additionally, the optimal solar radiation flux distribution was obtained from the optical model by optimizing the wall absorptivity. This part of the optimization was implemented in a joint MTLAB and COMSOL simulation by means of the genetic algorithm. The optimal solar radiation flux distribution obtained from the IPOPT solution was imported into MATLAB. Then, the least square objective (ls) of the optimal solar radiation flux distribution (qop) and the real radiation distribution (qre) generated by changing the wall absorptivity was set in MATLAB, which can be expressed as below:
l s = k = 1 n [ q re ( r k ) q op ( r k ) ] 2 n
The solar absorptivity values, α110, of each zone are optimized by the genetic algorithm. Therefore, the problem of optimizing the absorptivities of the cavity walls by means of the genetic algorithm to achieve the optimal solar radiation flux can be described as follows:
Find X = [ α 1 , α 2 α 10 ] Minimize   l s = k = 1 n [ q re ( r k ) q op ( r k ) ] 2 n s . t .   0 α 1 , α 2 α 10 1
In the genetic algorithm optimization constraint, the absorptivity of the cavity walls for solar radiation is considered to be always greater than 0 and less than 1.

3. Model Validation

In this study, the optical model of a dish concentrator system (3D) was implemented in the ray optics module of commercial software COMSOL, which was solved by a non-sequential ray tracing method, and the GMRES solver is used to solve this module [48]. Additionally, the finite element method was used to solve this multiphysics computational fluid dynamics model of the thermochemical reactor (2D) in a fully coupled manner. The PARDISO solver in the COMSOL software was chosen to solve this part [49]. Then, the grid independence test showed that 108,000 cells met the requirement of a 10−5 relative error. Additionally, in this study, the optical model of the dish concentrator was validated, and the relevant results were compared with the date in ref. [50]. As shown in Figure 4a, the solar radiation distributions on the receiving surface were well-matched for all three deflection angles (30°, 45°, and 60°). The results of the methane dry reforming kinetic model calculations were compared with those of the experimental study [51]. As shown in Figure 4b, the absolute error did not exceed 5.5% in the conversions of CH4 and CO2, so the kinetic model of this study can be considered feasible and accurate.

4. Results and Discussion

4.1. Analysis of Optimization Results and Comprehensive Performance of Cases

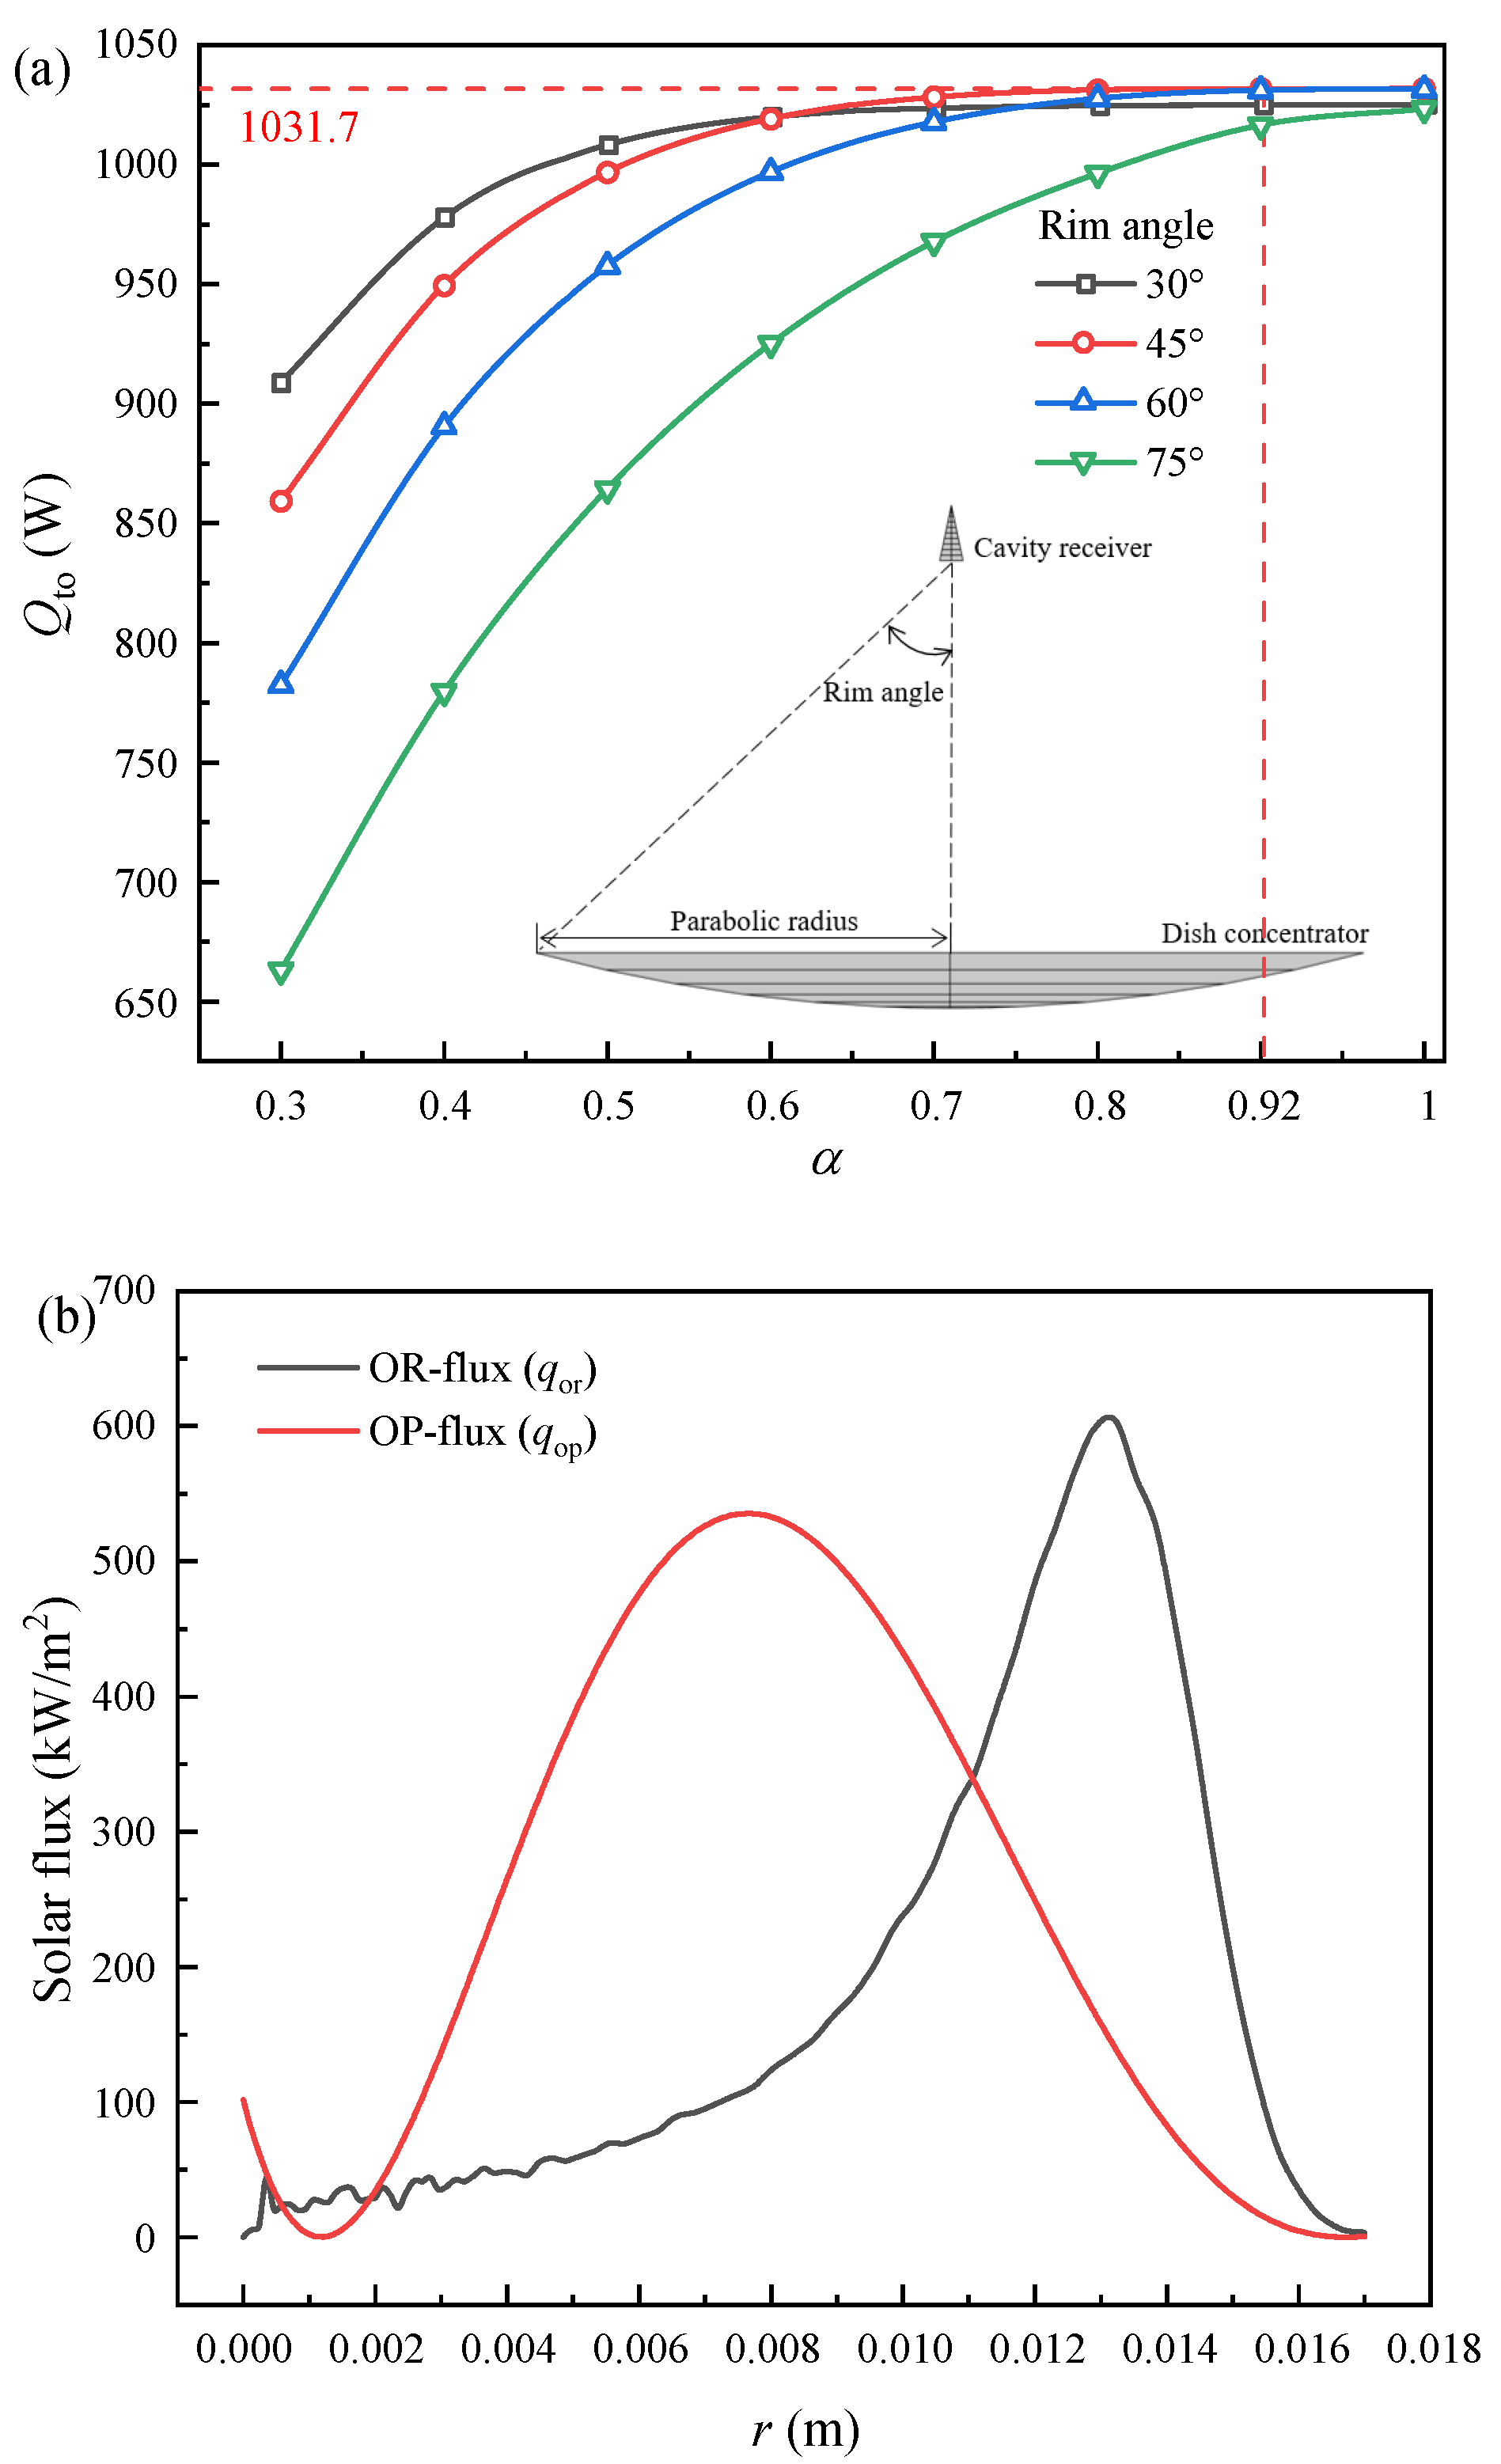
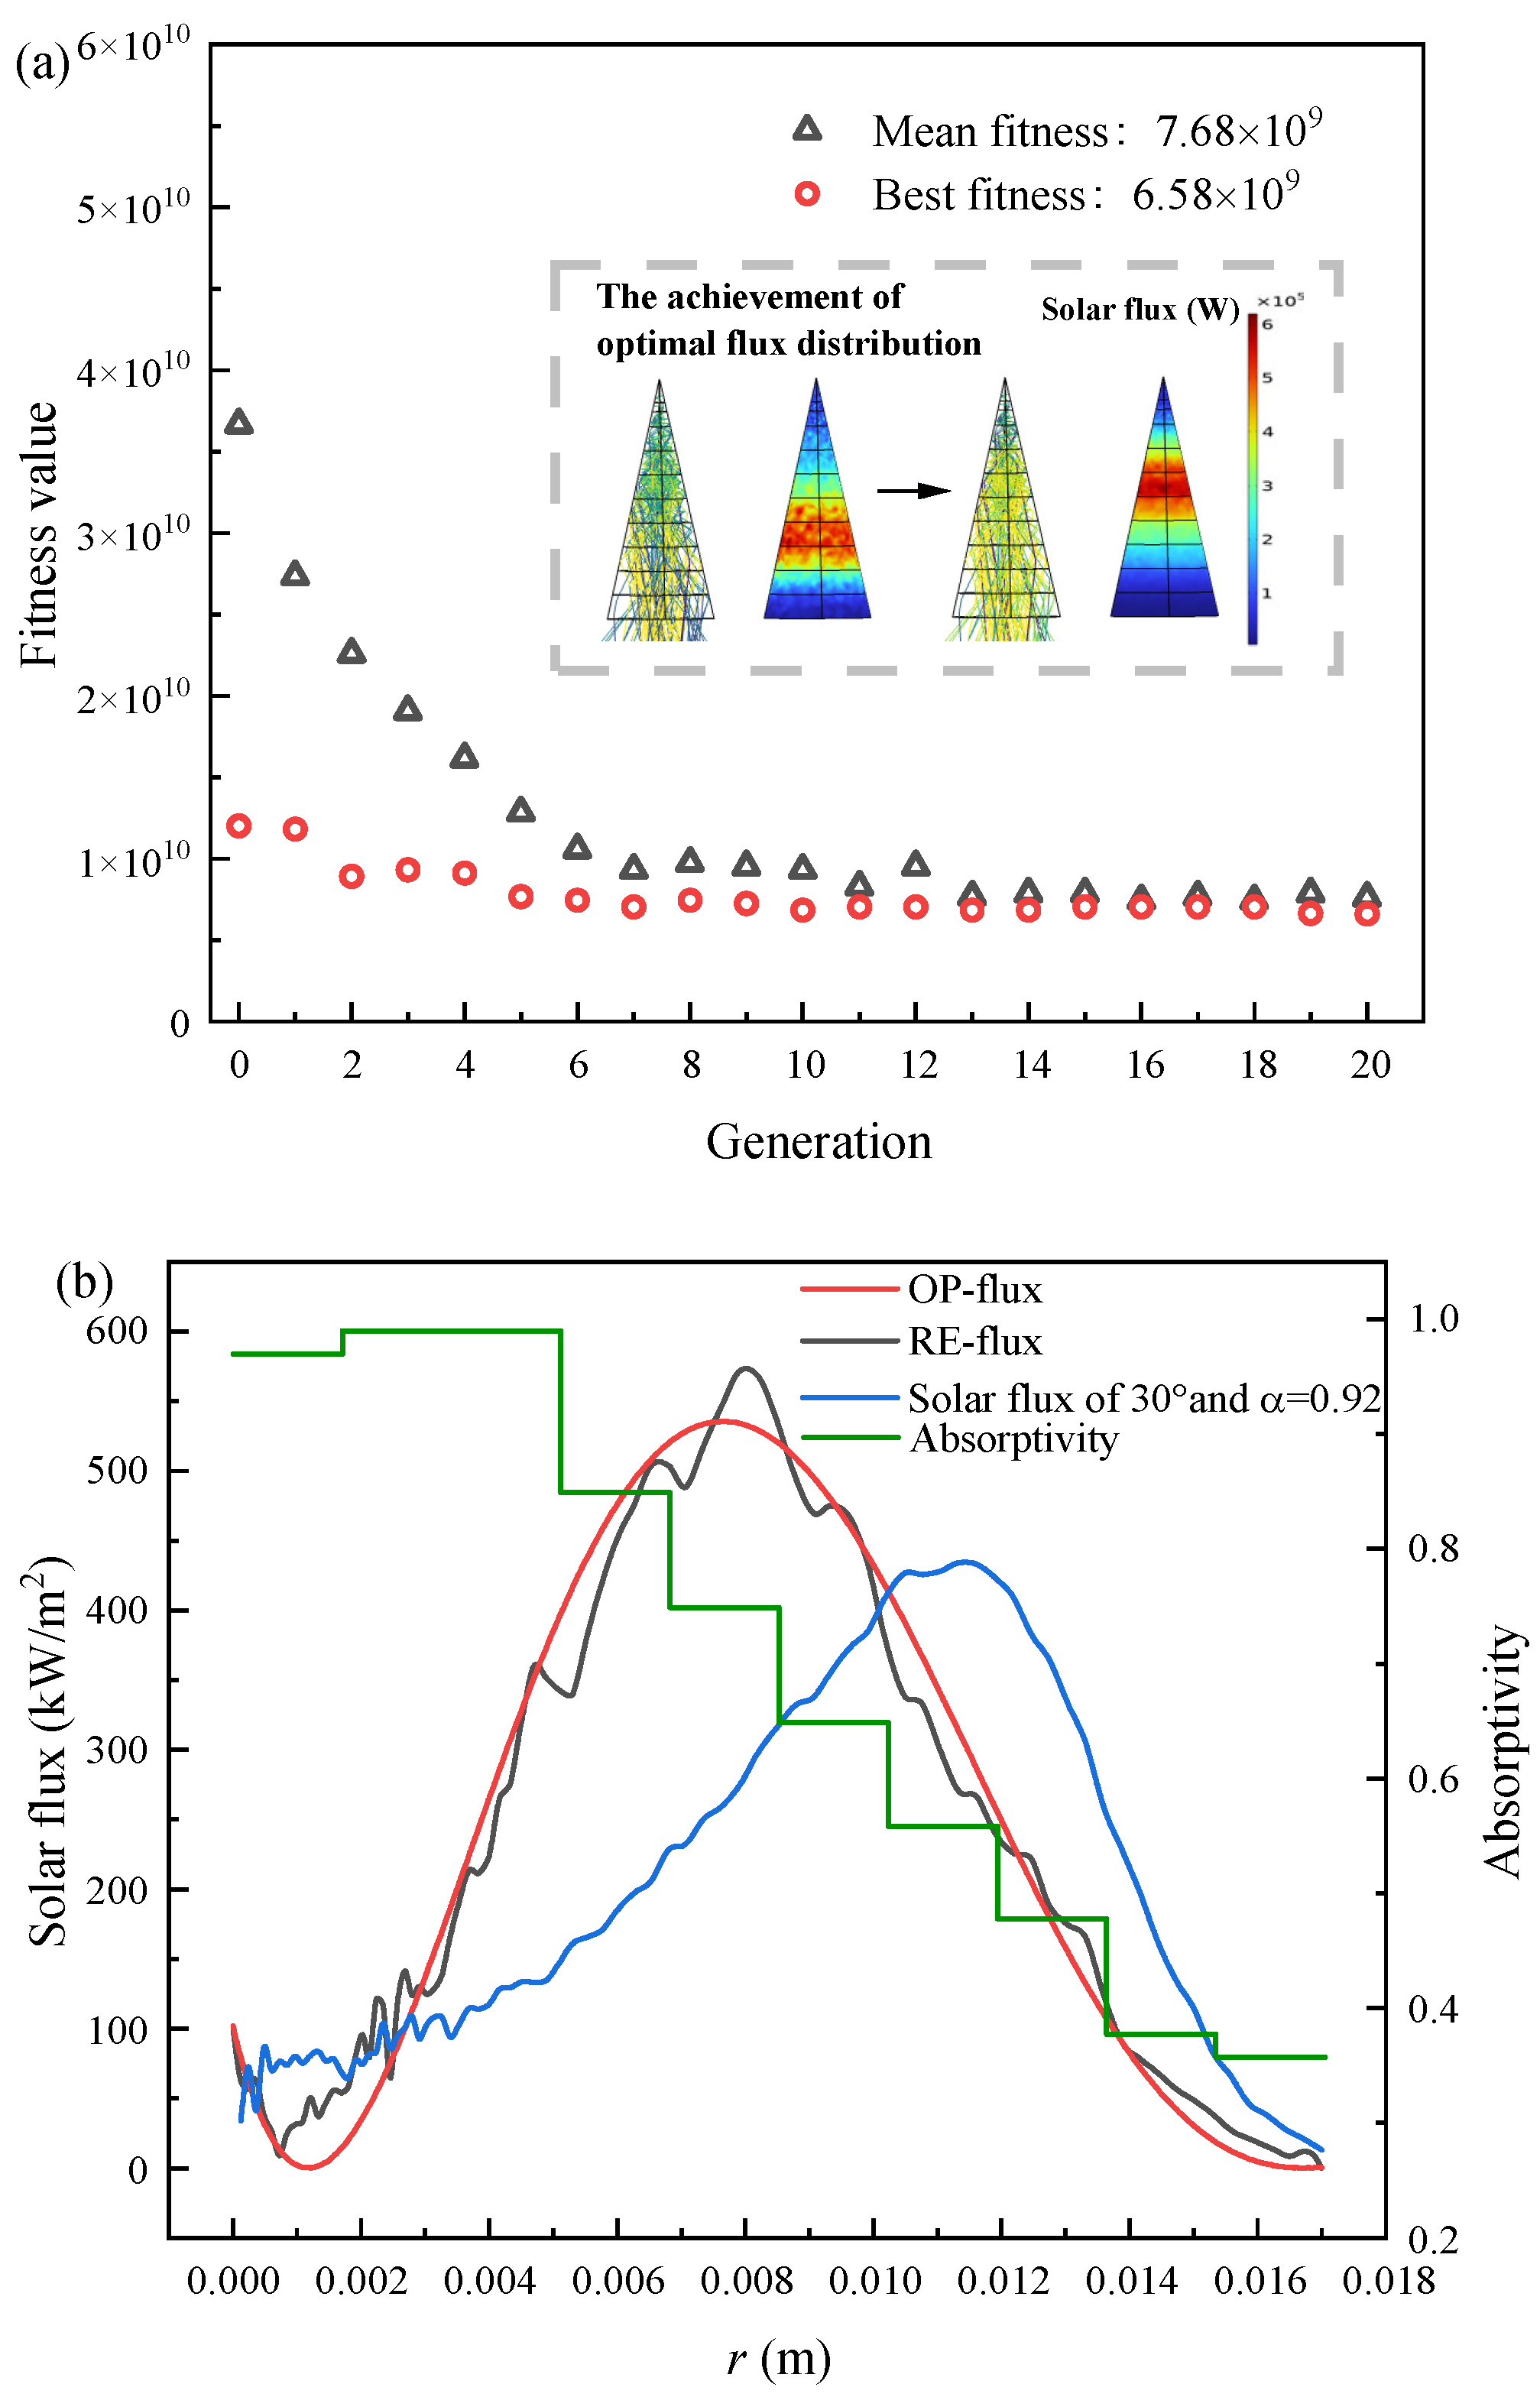
4.1.1. Optimal Flux Distribution Optimization Results

Before solving the optimal flux distribution, it is necessary to know the value of total incident solar energy (Qto) that is concentrated and reflected into the cavity by the dish concentrator. With a constant parabolic radius of the dish concentrator (1.2 m), it can be assumed that the energy received by the concentrator is unchanged. The effect of different cavity absorptivities of solar radiation and the effect of the dish concentrator rim angle on Qto were studied and analyzed, the results of which are shown in Figure 5a. Firstly, the total incident solar energy increased as the absorptivities of the cavity walls increased, and a high absorptivity always helps to reduce the reflective losses of solar radiation. When the absorptivity was less than or equal to 0.6, the rim angle showed an opposite increasing trend to the total incident solar energy. Therefore, when the absorptivity is small, the small rim angle is more conducive to obtain higher total incident solar energy for the cavity. In addition, when the absorptivity was larger than or equal to 0.8, the maximum total incident solar energy was achieved at a rim angle of 45°, followed by a deflection angle of 30°, and the minimum energy was obtained at a rim angle of 65°. The maximum total incident solar energy was 1031.8 W at an absorptivity of 1 and a rim angle of 45°. Considering the actual case where the cavity wall material was silicon carbide, a deflection angle of 45° and an absorptivity of 0.92 was used as the original case (Qto = 1031.7 W) for analysis and comparison. Qto = 1031.7 W was used as the total incident solar energy in the gradient optimization algorithm IPOPT solution.
Combined with the gradient optimization algorithm, the optimal solar flux distribution was obtained at the reactant inlet volume flow rate of 10 L·min−1. The optimization tolerance in the optimization solver was set to 0.0001, and the results converged after 158 iterations, which took almost 34 h. The optimization calculation results are shown in Figure 5b. The Bernstein polynomial control variable search results are C0 = −0.562, C1 = −16.691, C2 = 67.655, C3 = −4.534, C4 = −5.258, and C5 = −0.997. In the original flux distribution (OR-flux) case, the solar radiation was concentrated at the radius of 0.013 m near the front face, with the maximum radiation heat flux of approximately 600 kW·m−2. Additionally, at the end of the reaction area, almost no solar energy reached the cavity wall. The peak optimal flux distribution (OP-flux) was about 550 kW·m−2, which is slightly lower compared to the original distribution. The solar radiation was mainly concentrated at r = 0.008 m. The results of the gradient optimization solution indicate the inward migration of the concentrated solar radiation, which is favorable for hydrogen production.
The result of the comprehensive comparative performance analysis of the two flux distributions is shown in Figure 6a. As shown in the graph, the optimal flux distribution as an optimization target had a 4.00% increase in hydrogen yield compared to the original flux distribution. Additionally, an unexpected increase in reactant conversion and chemical energy storage efficiency was also observed. The optimal flux distribution increased CH4 conversion and CO2 conversion by 5.36% and 5.77%, respectively, compared to the original flux distribution. One thing that can be noticed is that the increase in reactant conversion was somewhat higher than the hydrogen yield. The increase of methane conversion means that more of reaction (1) and reaction (3) took place. However, the hydrogen yield did not increase to the corresponding percentage, which means that reaction (2), which consumes hydrogen in under an optimal flux distribution, proceeded more strongly. The increase in the mass fraction of water at the outlet confirms this idea, as shown in Figure 6a, with an increase of 1.09% under the optimal flux distribution. It is also known that the carbon monoxide mass fraction increases by 3.22% at the optimal flux distribution, which means that more carbon dioxide is converted by the reduction reaction.
Energy utilization under the two flux distributions was also analyzed and compared in this study, as shown in Figure 6b. Chemical energy storage had the largest share of total energy at 53.39% in the original flux distribution and further increased to 55.58% in the optimal flux distribution, an increase of 2.19%. In addition, the share of exported sensible heat increased from 20.34% to 23.28%, which means that more of the sensible heat energy could be utilized. The increase in chemical energy storage and sensible heat energy can be attributed to the decrease in energy loss, which decreased by 5.12% from 26.25% to 21.13%.

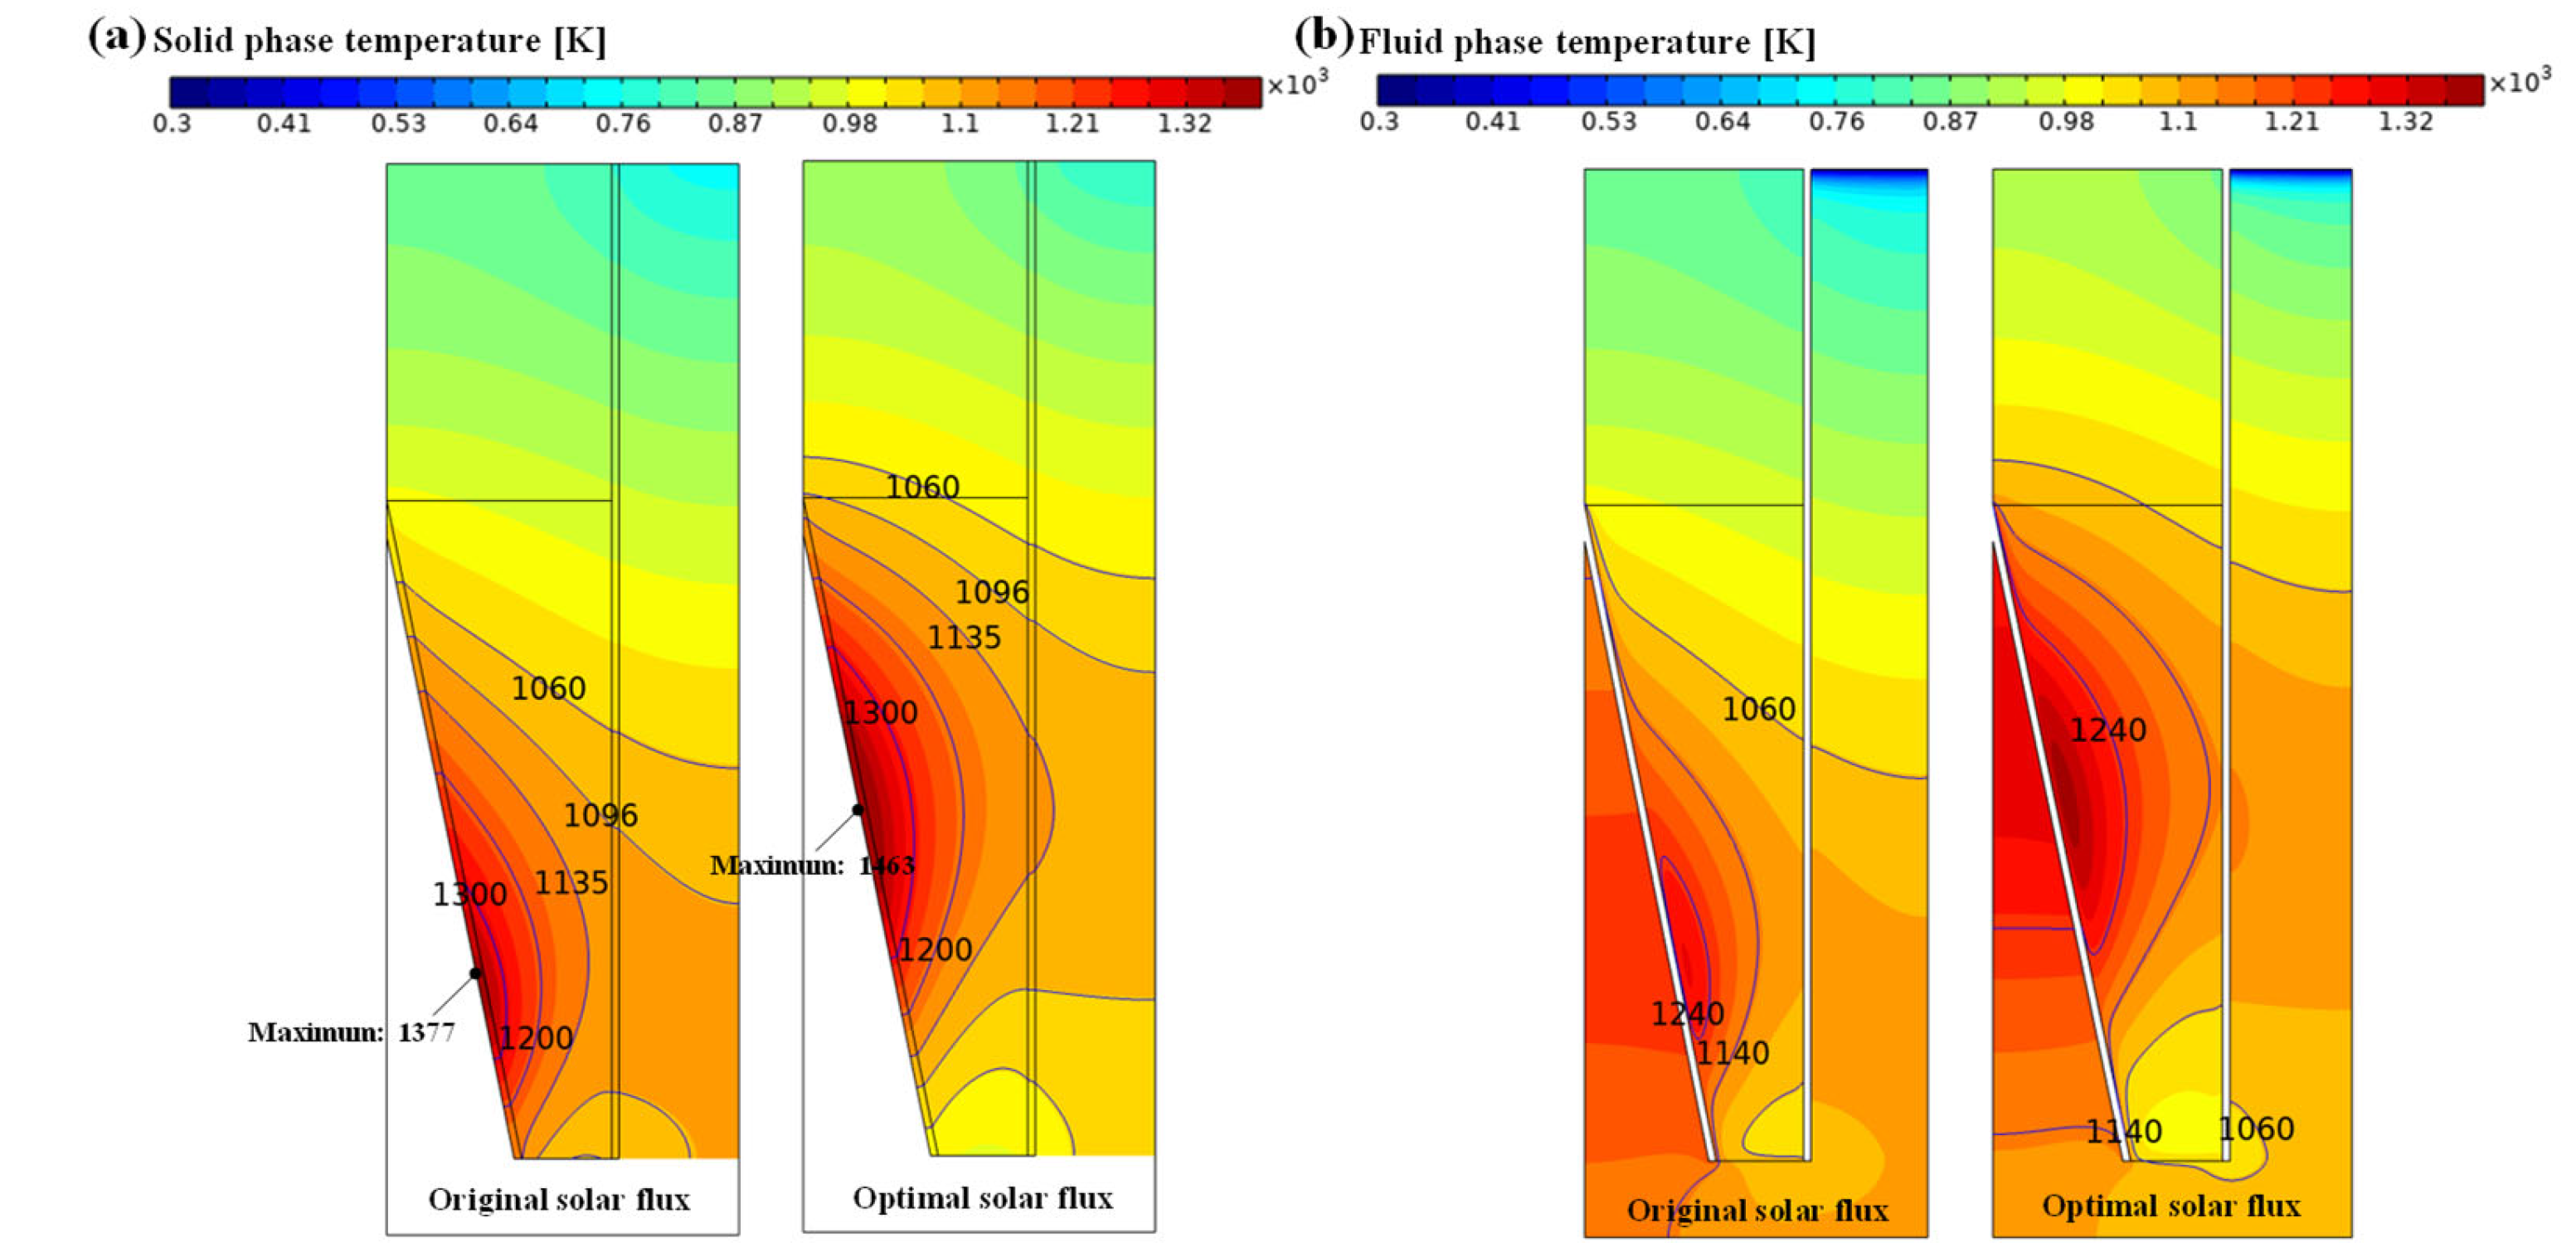
4.1.2. Analysis of Solid–Liquid Phase Temperature Field Distribution

The distribution of solar flux is directly related to the temperature field of the thermochemical reactor, which affects the thermochemical conversion process in the reactor, and therefore it is necessary to analyze and study. As shown in Figure 7a, under the original flux distribution, the high temperature region was found at the front end close to the cavity wall due to the solar radiation concentrated at the front of cavity. Additionally, the maximum solid phase temperature was 1377 K. Additionally, the high temperatures in the front section area mean large radiation heat loss. As shown in Figure 7b, affected by the temperature of the solid phase, although the temperature of the fluid phase in the first half of the reaction area was high, the temperature was low in the second half, even less than 1060 K in under the original flux distribution. Therefore, it is known that the reactor’s inability to obtain enough energy for the second half resulted in a decrease in fluid temperature.
For the optimal flux distribution, as most of the solar radiation was concentrated at r = 0.008 m, the high temperature region was displaced backwards compared to the original flux distribution. The maximum solid phase temperature was 1463 K, an increase of 86 K compared to the original flux distribution, and the entire solid phase area was almost always higher than 1060 K. Due to the heat exchange with the solid phase, the fluid temperature distribution was very similar to the solid phase temperature distribution. As shown in Figure 7b, for the original distribution, although the gas phase temperature in the reaction area was still acceptable in the front section where the solar radiation accumulates, the temperature remained mostly below 1060 K in the rear reaction area. Under the optimal flux distribution, the gas temperature was almost always greater than 1060 K throughout the reaction region. However, the gas phase temperature was less than 1060 K in a small part of the inlet area, which may have been caused by the chemical reaction’s energy consumption and insufficient energy supply. This may mean that the chemical reaction’s performance under the optimal flux distribution is not as good as it is under the original flux distribution at this area.

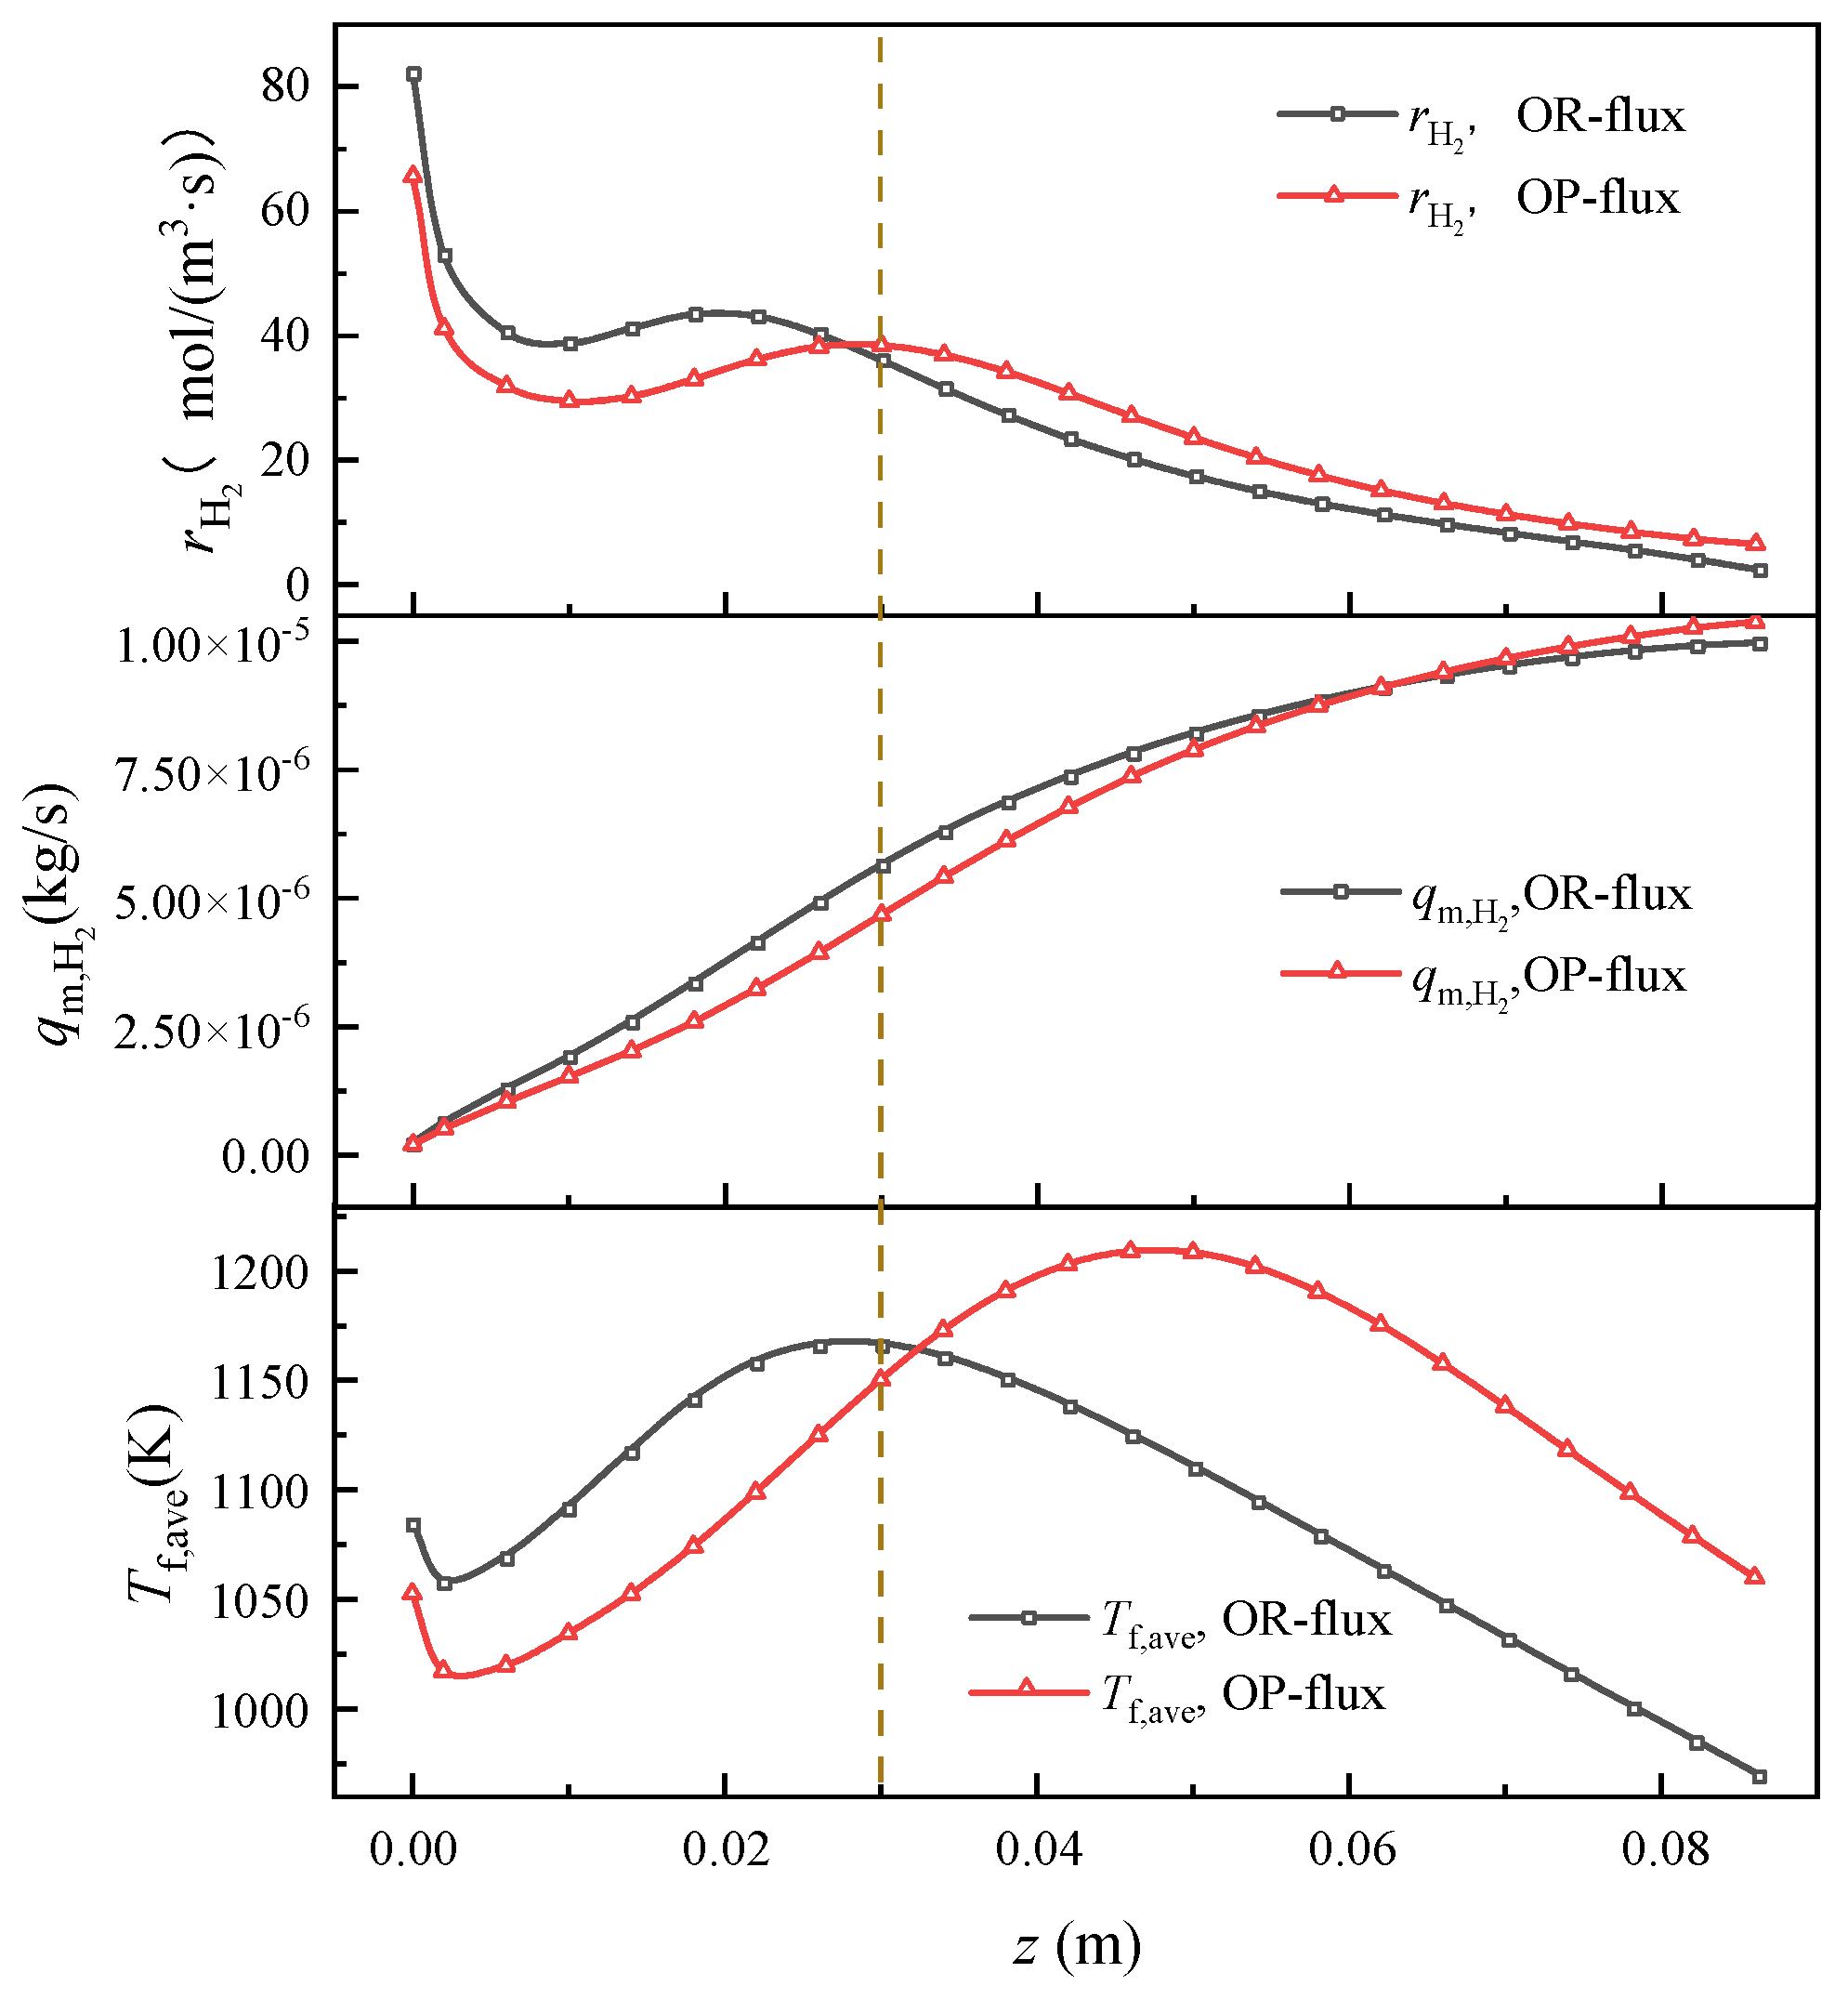
4.1.3. Comparison and Analysis of Hydrogen Production

In order to explore the changes in the hydrogen production rate and fluid temperature, the average parameter values on the axial cross-section were used for analysis in this study. In the solution of gradient optimization algorithms, the hydrogen production is used as the only optimization objective. Therefore, it was necessary to analyze the hydrogen production rate and the hydrogen mass flow rate, as shown in Figure 8.
The trend in fluid temperature was the same for both flux distributions. The temperature of the fluid rose from the inlet due to a continuous supply of solar energy, and then gradually decreased because of the energy consumed by the chemical reaction. Additionally, when z was greater than 0.03 m, the optimal flux distribution corresponded to a higher fluid temperature than in the original case. Conversely, the fluid temperature under the optimal flux distribution was lower than the original flux distribution when z was less than 0.03 m, as shown in Figure 8.
Temperature distribution has a very close relationship with the rate of hydrogen production. The lower the reaction temperature, the smaller the hydrogen production rate in this study, as shown in Figure 8. Therefore, when z was larger than 0.03 m, the hydrogen production rate corresponding to the original flux distribution was the smallest, while the hydrogen production rate corresponding to the optimal solar flux distribution was the largest. When z was less than 0.03 m, the hydrogen production rate under the original flux distribution was larger than under the optimal flux distribution.
However, high hydrogen production rates do not necessarily mean high hydrogen yields, and the impact of the reaction volume on hydrogen production can be significant. Therefore, the hydrogen mass flow rate at the cross section was also analyzed and compared in this study. It is worth noting that the difference between the hydrogen mass flow rate of the original flux distribution and that of the optimal flux distribution increased gradually until z = 0.03 m, reaching the maximum around z = 0.03 m, as shown in Figure 8. After that, the gap of the hydrogen mass flow rate between the two gradually decreased, and the hydrogen mass flow rate under the optimal flux distribution became gradually higher than it did in the original case (z ≥ 0.06 m), which benefited from the large volume of the reaction zone in the rear region.

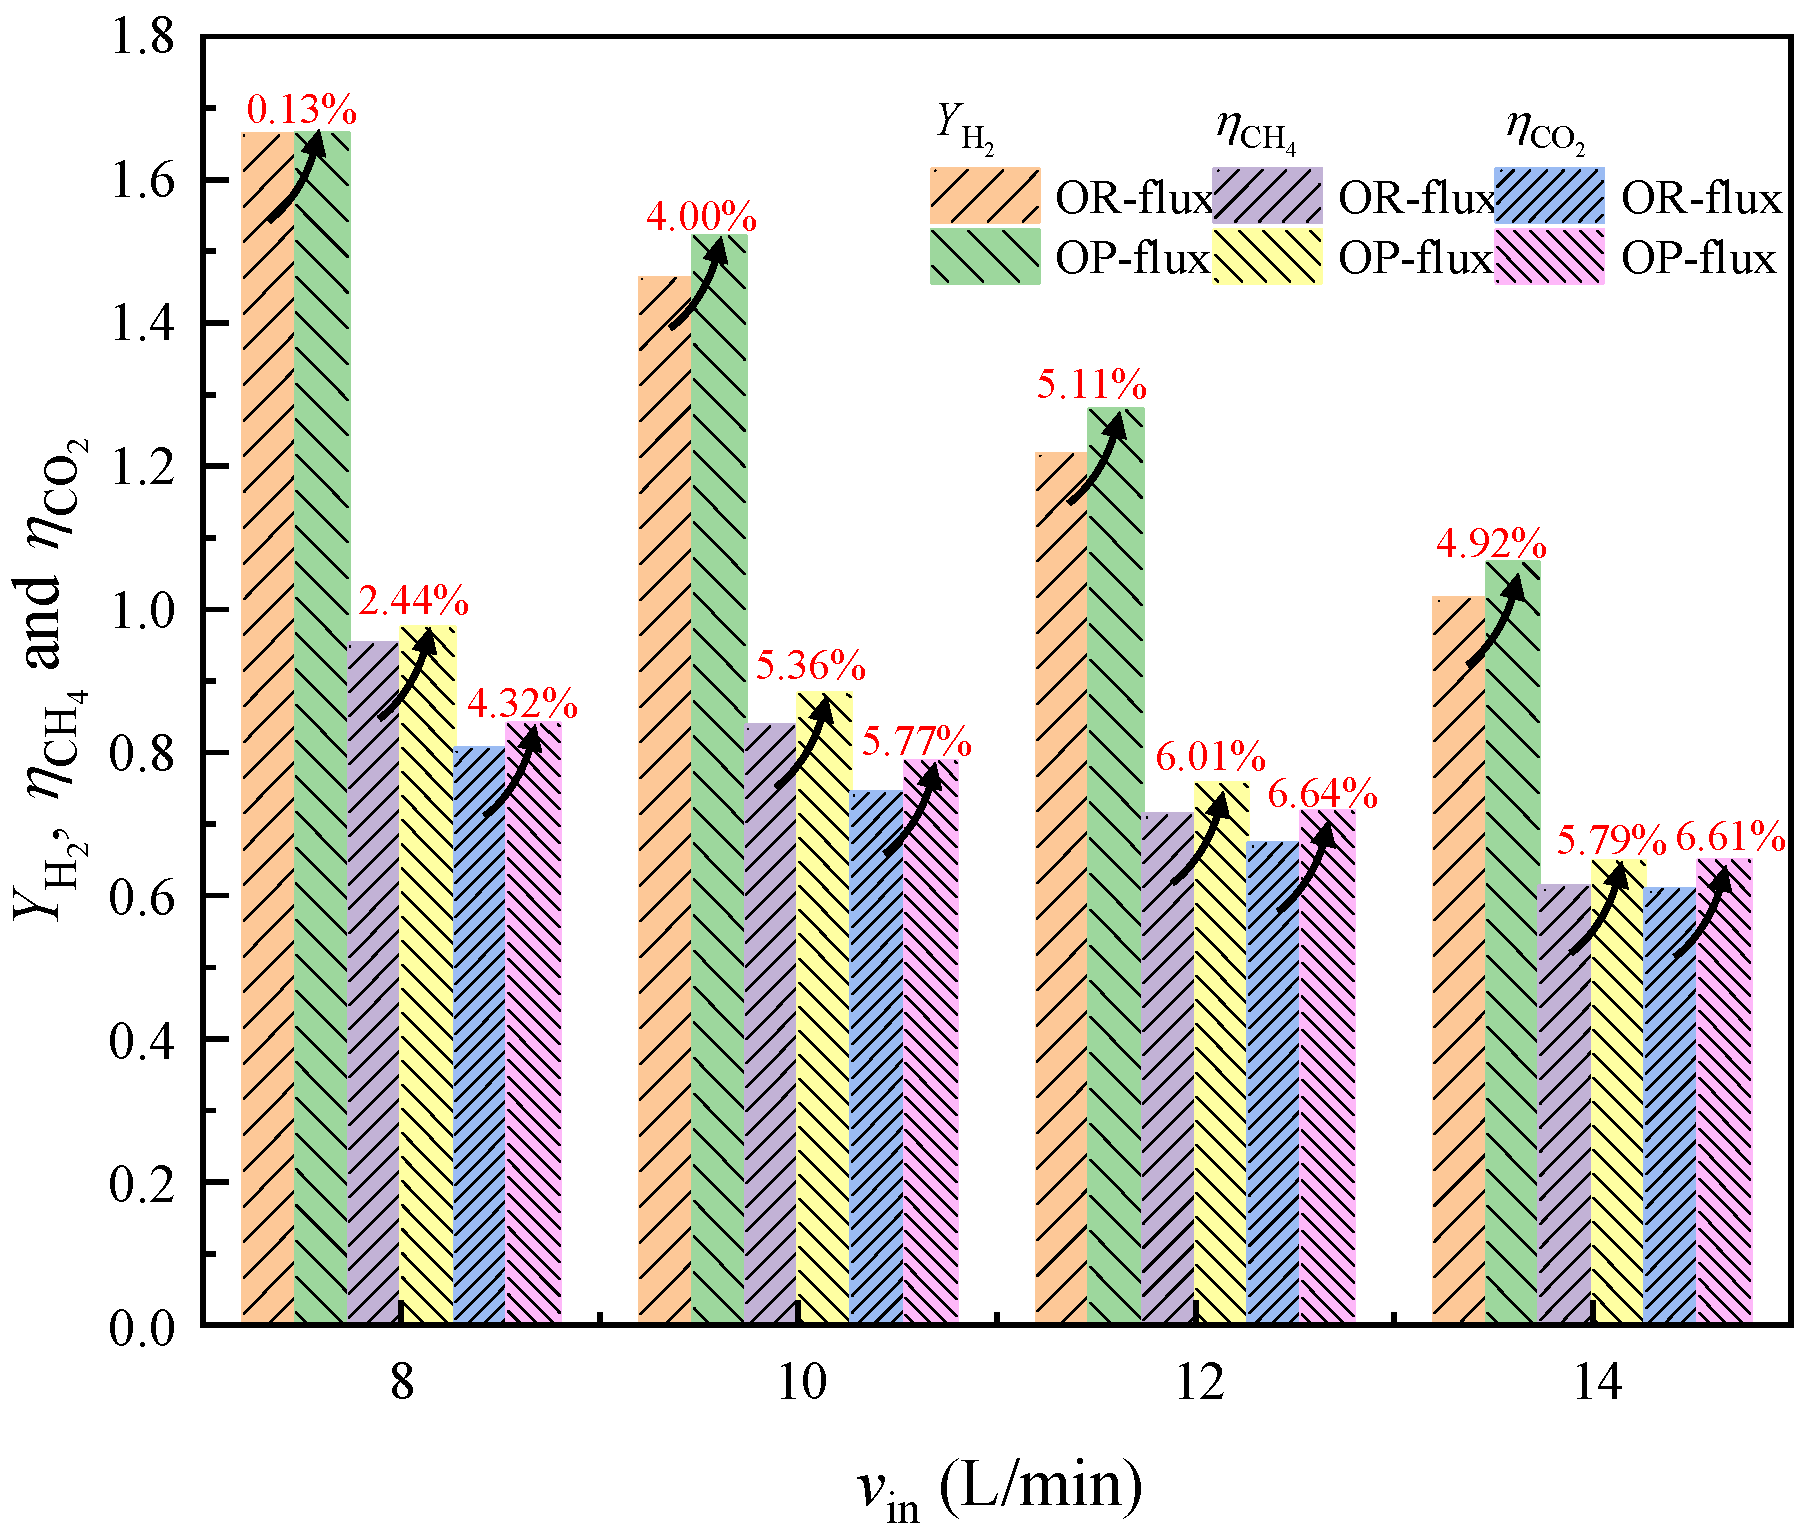
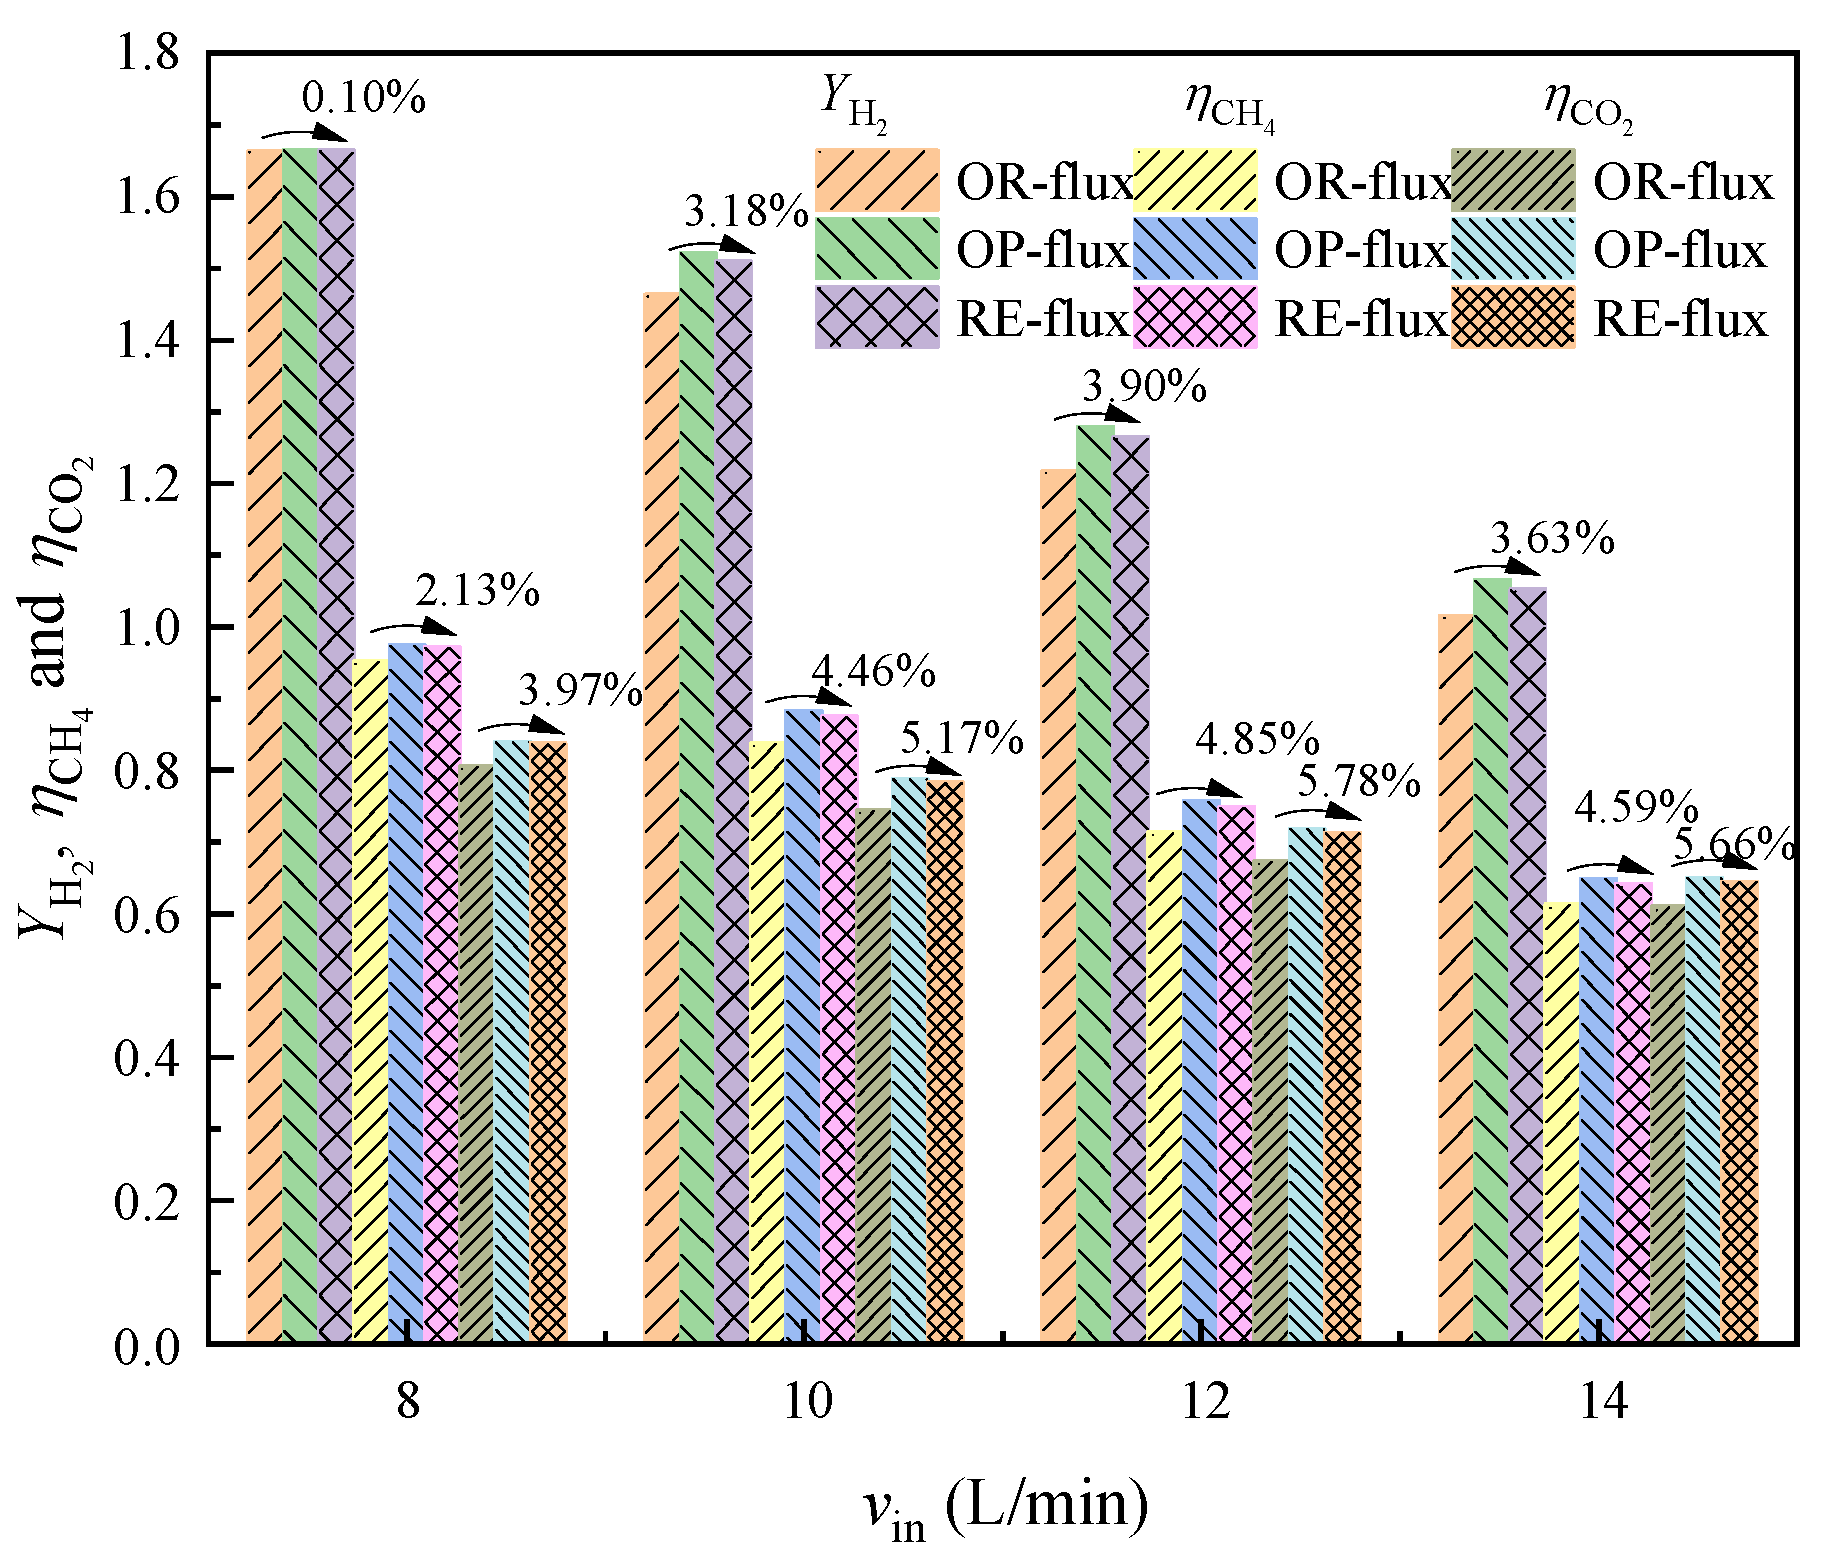
4.1.4. Performance Comparison under Different Inlet Volume Flow Rates

It is also necessary to analyze the performance of the original flux distribution compared to the optimal flux distribution for different inlet volume flow conditions. As shown in Figure 9, under the optimized working condition of the inlet volume flow of 10 L·min−1, the hydrogen yield increased by 4.00%, while when vin = 12 L·min−1 and 14 L·min−1, the hydrogen yield increased even more, by 5.11% and 4.92%, respectively. In addition, at vin = 8 L·min−1, the hydrogen production also increased by 0.13%. This means that the optimal flux distribution could feed more energy into the chemical reaction when the energy supply was not sufficient. Additionally, the optimal flux distribution of the methane conversion and carbon dioxide conversion increased by 2.44~5.79% and 4.32~6.61% at vin = 8~10 L·min−1, respectively. The optimal flux distribution obtained by the gradient optimization for a single operating condition showed a significant performance improvement from that under the original flux distribution for all four operating conditions.

4.2. Achievement of Optimal Solar Flux Distribution

In order to achieve an optimal solar flux distribution with the aim of maximizing hydrogen production, the method of optimizing the absorptivity of solar radiation of the cavity walls was used. Firstly, it was important to ensure that the total incident solar energy is not lost too much before achieving the goal of optimal flux distribution. Then, from Figure 5a, it can be seen that for the rim angle of 30°, the change in wall absorptivity had the least effect on the total incident solar energy. Therefore, the dish concentrator of the 30° rim angle was used in this part of the optimization study to minimize the solar energy loss due to the change in absorptivity.
Genetic algorithms are algorithms that simulate natural biological evolutionary mechanisms and are used to find the optimal solution to real world problems. They consist of three basic processes: selection, crossover, and mutation. In the selection step, the winning dominant individual is selected and passed on to the next generation, which is based on assessing the individual’s fitness function. In the crossover step, selected individuals exchange portions of genes in random patterns based on crossover scores. In the mutation step, whether each individual changes is based on the mutation probability. Then, one or several genes of the mutant individual are selected to change in a random pattern. The optimization process includes the above three genetic operators. The calculation of genetic optimization converges to the optimal solution when the fitness of the optimal individual is equal to the fitness of the population and remains constant. In this study, the optimization process was terminated by the maximum number of generations. The crossover fraction, mutation rate, and population size were set to 0.8, 0.05, and 100. The maximum generation was set to 20.
As shown in Figure 10a, after the number of generations was greater than 13, the difference between the mean fitness value of the population and the best individual fitness value were not significant, and the results could be considered to have basically reached convergence. At the end of the 20th generation, the average fitness value of the population was 7.68 × 10⁹, while the optimal individual fitness value was 6.58 × 10⁹, with the difference of only 1.1 × 10⁹. The results which took almost 219 h to obtain can be considered reliable. The results of the optimization of the absorptivity of solar radiation of the cavity surface are α1 = 0.97, α2 = 0.99, α3 = 0.99, α4 = 0.85, α5 = 0.75, α6 = 0.65, α7 = 0.56, α8 = 0.48, α9 = 0.38, and α10 = 0.36. The real flux distribution (RE-flux) achieved by varying the absorptivity is shown in Figure 10b, where a good fit to the optimal flux distribution can be seen over the entire cavity wall. When the rim angle was 30° and the absorptivity was 0.92, the solar flux was mainly concentrated around r = 0.012 m. By setting a lower absorptivity at r larger than 0.012 m, more light was reflected into the cavity and absorbed, thus achieving the optimal flux distribution. Another point to note is that, in the genetic algorithm optimization of absorptivity to achieve the optimal flux distribution, the total incident solar energy was 1023.8 W, which is only 0.69% lower than the 1031 W set in the optimal flux finding process, and can be considered as an achievement of the optimal flux distribution without energy loss.
In this study, the comprehensive performance of the real solar flux distribution achieved by changing the wall absorption rate was compared with other cases under different inlet volume flow rates, as shown in Figure 11. The results show that the hydrogen yield under the real flux distribution decreased slightly compared to the optimal flux distribution, but was still higher than the original solar flux, with a 0.10~3.90% improvement under the four inlet flow conditions. In addition, the methane conversion at the real flux distribution also decreased slightly compared to the optimal flux distribution, but still increased by 2.13~4.85% compared to the original flux distribution. This was due to the loss of total incident solar energy and the difference between the real flux distribution and the optimal flux distribution. For the real flux distribution achieved, the increase in carbon dioxide conversion was the largest, with an increase of 3.97~5.78% at vin = 8~10 L·min−1 compared to the original flux distribution, even if it was somewhat lower than the optimal flux distribution.

5. Conclusions

In this study, a numerical model of a preheated cavity solar thermochemical reactor-dish methane dry reformer was constructed based on previous research. The optimal solar radiation heat flux distribution described by the 5th-order Bernstein polynomial was solved with a constant value of total incident solar energy and a hydrogen production rate as the optimization objective by combining it with the gradient optimization algorithm.
The comprehensive performances of the two solar flux distributions were compared and analyzed. In addition, the absorptivity of the solar-absorbing coating on the cavity wall was optimized by using the genetic algorithm in an attempt to achieve the optimal solar radiation flux distribution. The salient findings are as follows:
(1) Taking 1031.7 W as the total incident solar energy, the gradient optimization algorithm performed 158 iterations to obtain the optimal solar flux distribution. The Bernstein polynomial control variables solved by IPOPT are C0 = −0.562, C1 = −16.691, C2 = 67.655, C3 = −4.534, C4 = −5.258, and C5 = −0.997. The main energy of the optimal solar flux distribution was concentrated deep in the cavity, which greatly reduced the loss of heat radiation and resulted in more efficient energy use.
(2) Under the optimal solar flux, the hydrogen production rate increased by 0.13~5.10%, the energy storage efficiency increased by 1.09~5.55%, and the methane conversion rate increased by 2.43~6.01% for the inlet volume flow rate of 8~14 L·min−1 compared to the original flux distribution.
(3) The absorptivity of the ten-segment cavity wall for solar radiation was optimized by the genetic algorithm, and the optimal solar flux distribution was roughly achieved, while the energy loss was only 0.6%. Although the performance of the real flux distribution was not as good as that of the optimal flux distribution, it was also much better than the original flux distribution.
There are also some shortcomings of this study. The optimal flux distribution obtained does not seem to be the final ideal flux distribution, as it is only for one hydrogen production target. In subsequent studies, different performance evaluation indicators, such as conversion rate, carbon deposition, etc., can be taken into account to find the most suitable flux distribution. The aim of this study is to provide a research idea for an integrated solar-thermal-chemical design. Furthermore, the optimal flux distribution found in this study was achieved by the adjustment of wall absorption rate, which also places high demands on the coating materials.

Author Contributions

Conceptualization, Z.-Q.D. and W.-W.Y.; methodology, Z.-Q.D.; software, R.-Z.Z.; validation, X.M. and W.-W.Y.; data curation, X.-Y.T. and R.-Z.Z.; writing—original draft preparation, Z.-Q.D. and X.M.; writing—review and editing, X.M. and W.-W.Y.; supervision, W.-W.Y.; All authors have read and agreed to the published version of the manuscript.

Funding

This work was financially sponsored by the National Natural Science Foundation of China (no. 52090063).

Data Availability Statement

The data presented in this study are available on request from the corresponding author.

Conflicts of Interest

The authors declare no conflict of interest.

Nomenclature

Cpspecific heat (J·kg−1·K−1)
dpaperture size (m)
Dijbinary diffusivity coefficient (m2·s−1)
Fimass flow of the species i (kg·s−1)
hvlocal volumetric heat transfer coefficient (W·m−3·K−1)
Δ H enthalpy change of the reaction (kJ·mol−1)
Iradiation intensity (MW·m−2·sr−1)
kreaction rate constant
Kadsorption constant
Kpequilibrium constant for reaction
Llength of reactor (m)
mimole fraction of species i
Mmole weight (kg·mol−1)
ppressure (Pa)
Pipartial pressure of species i (bar)
qenergy flux (MW·m−2)
Qenergy (W)
Runiversal gas constant (J·mol−1·K−1)
richemical reaction rate of the i-th reaction (mol·m−3·s−1)
r H 2 hydrogen production rate (mol·m−3·s−1)
Ttemperature (K)
u velocity vector (m·s−1)
Y H 2 hydrogen yield
zaxial coordinate (m)
Greeks
α absorptivity
ε emissivity
η energy efficiency or reactant conversion
κ e extinction coefficient of porous media (m−1)
𝜆 thermal conductivity (W·m−1·K−1)
μ dynamic viscosity (Pa·s)
ρ density (kg·m−3)
σ Stefan-Boltzmann constant (W·m−2·K−4)
τ reflectivity
φ porosity
ω mass fraction
α absorptivity
Superscripts and subscripts
aactual value
chchemical storage energy
catcatalyst
effeffective value
ffluid
i, jspecies (CH4, H2O, H2, CO, CO2)
ininlet
maxmaximum value
outoutlet
sosolar energy
ssolid
sesensible thermal energy
Abbreviations
DRMdry reforming of methane

References

  1. Wen, H.; Liang, W.; Lee, C.-C. China’s progress toward sustainable development in pursuit of carbon neutrality: Regional differences and dynamic evolution. Environ. Impact Assess. Rev. 2023, 98, 106959. [Google Scholar] [CrossRef]
  2. Gunnarsdottir, I.; Davidsdottir, B.; Worrell, E.; Sigurgeirsdottir, S. Sustainable energy development: History of the concept and emerging themes. Renew. Sustain. Energy Rev. 2021, 141, 110770. [Google Scholar] [CrossRef]
  3. Anam, M.Z.; Bari, A.B.M.M.; Paul, S.K.; Ali, S.M.; Kabir, G. Modelling the drivers of solar energy development in an emerging economy: Implications for sustainable development goals. Resour. Conserv. Recycl. Adv. 2022, 13, 200068. [Google Scholar] [CrossRef]
  4. He, C.; Wu, S.; Wang, L.; Zhang, J. Recent advances in photo-enhanced dry reforming of methane: A review. J. Photochem. Photobiol. C Photochem. Rev. 2022, 51, 100468. [Google Scholar] [CrossRef]
  5. Su, B.; Wang, Y.; Xu, Z.; Han, W.; Jin, H.; Wang, H. Novel ways for hydrogen production based on methane steam and dry reforming integrated with carbon capture. Energy Convers. Manag. 2022, 270, 116199. [Google Scholar] [CrossRef]
  6. Wang, Z.; Han, W.; Zhang, N.; Gan, Z.; Sun, J.; Jin, H. Energy level difference graphic analysis method of combined cooling, heating and power systems. Energy 2018, 160, 1069–1077. [Google Scholar] [CrossRef]
  7. Ling, Y.; Li, W.; Jin, J.; Yu, Y.; Hao, Y.; Jin, H. A spectral-splitting photovoltaic-thermochemical system for energy storage and solar power generation. Appl. Energy 2020, 260, 113631. [Google Scholar] [CrossRef]
  8. Agrafiotis, C.; von Storch, H.; Roeb, M.; Sattler, C. Solar thermal reforming of methane feedstocks for hydrogen and syngas production—A review. Renew. Sustain. Energy Rev. 2014, 29, 656–682. [Google Scholar] [CrossRef]
  9. Villafán-Vidales, H.I.; Arancibia-Bulnes, C.A.; Riveros-Rosas, D.; Romero-Paredes, H.; Estrada, C.A. An overview of the solar thermochemical processes for hydrogen and syngas production: Reactors, and facilities. Renew. Sustain. Energy Rev. 2017, 75, 894–908. [Google Scholar] [CrossRef]
  10. Sheu, E.J.; Mokheimer, E.M.A.; Ghoniem, A.F. A review of solar methane reforming systems. Int. J. Hydrogen Energy 2015, 40, 12929–12955. [Google Scholar] [CrossRef] [Green Version]
  11. Kribus, A.; Gray, Y.; Grijnevich, M.; Mittelman, G.; Mey-Cloutier, S.; Caliot, C. The promise and challenge of solar volumetric absorbers. Sol. Energy 2014, 110, 463–481. [Google Scholar] [CrossRef]
  12. Gomez-Garcia, F.; González-Aguilar, J.; Olalde, G.; Romero, M. Thermal and hydrodynamic behavior of ceramic volumetric absorbers for central receiver solar power plants: A review. Renew. Sustain. Energy Rev. 2016, 57, 648–658. [Google Scholar] [CrossRef]
  13. Wang, P.; Li, J.B.; Xu, R.N.; Jiang, P.X. Non-uniform and volumetric effect on the hydrodynamic and thermal characteristic in a unit solar absorber. Energy 2021, 225, 120130. [Google Scholar] [CrossRef]
  14. Du, S.; Xia, T.; He, Y.-L.; Li, Z.-Y.; Li, D.; Xie, X.-Q. Experiment and optimization study on the radial graded porous volumetric solar receiver matching non-uniform solar flux distribution. Appl. Energy 2020, 275, 115343. [Google Scholar] [CrossRef]
  15. Kasaeian, A.; Barghamadi, H.; Pourfayaz, F. Performance comparison between the geometry models of multi-channel absorbers in solar volumetric receivers. Renew. Energy 2017, 105, 1–12. [Google Scholar] [CrossRef]
  16. Li, J.B.; Wang, P.; Liu, D.Y. Optimization on the gradually varied pore structure distribution for the irradiated absorber. Energy 2022, 240, 122787. [Google Scholar] [CrossRef]
  17. Capuano, R.; Fend, T.; Stadler, H.; Hoffschmidt, B.; Pitz-Paal, R. Optimized volumetric solar receiver: Thermal performance prediction and experimental validation. Renew. Energy 2017, 114, 556–566. [Google Scholar] [CrossRef] [Green Version]
  18. Shi, X.; Wang, F.; Cheng, Z.; Liang, H.; Dong, Y.; Chen, X. Numerical analysis of the biomimetic leaf-type hierarchical porous structure to improve the energy storage efficiency of solar driven steam methane reforming. Int. J. Hydrogen Energy 2021, 46, 17653–17665. [Google Scholar] [CrossRef]
  19. Shi, X.; Zhang, X.; Wang, F.; Yang, L.; Dong, Y.; Shuai, Y. Thermochemical analysis of dry methane reforming hydrogen production in biomimetic venous hierarchical porous structure solar reactor for improving energy storage. Int. J. Hydrogen Energy 2021, 46, 7733–7744. [Google Scholar] [CrossRef]
  20. Liu, X.; Cheng, B.; Zhu, Q.; Gao, K.; Sun, N.; Tian, C.; Wang, J.; Zheng, H.; Wang, X.; Dang, C.; et al. Highly efficient solar-driven CO2 reforming of methane via concave foam reactors. Energy 2022, 261, 125141. [Google Scholar] [CrossRef]
  21. Bellos, E.; Bousi, E.; Tzivanidis, C.; Pavlovic, S. Optical and thermal analysis of different cavity receiver designs for solar dish concentrators. Energy Convers. Manag. X 2019, 2, 100013. [Google Scholar] [CrossRef]
  22. Sedighi, M.; Taylor, R.A.; Lake, M.; Rose, A.; Izadgoshasb, I.; Vasquez Padilla, R. Development of a novel high-temperature, pressurised, indirectly-irradiated cavity receiver. Energy Convers. Manag. 2020, 204, 112175. [Google Scholar] [CrossRef]
  23. Huang, H.; Lin, M. Optimization of solar receivers for high-temperature solar conversion processes: Direct vs. Indirect illumination designs. Appl. Energy 2021, 304, 117675. [Google Scholar] [CrossRef]
  24. Sánchez-González, A.; Santana, D. Solar flux distribution on central receivers: A projection method from analytic function. Renew. Energy 2015, 74, 576–587. [Google Scholar] [CrossRef]
  25. Yan, J.; Peng, Y.; Cheng, Z. Optimization of a discrete dish concentrator for uniform flux distribution on the cavity receiver of solar concentrator system. Renew. Energy 2018, 129, 431–445. [Google Scholar] [CrossRef]
  26. Fang, J.; Tu, N.; Wei, J.; Du, X. Effects of surface optical and radiative properties on the thermal performance of a solar cavity receiver. Sol. Energy 2018, 171, 157–170. [Google Scholar] [CrossRef]
  27. Chen, F.; Li, M.; Hassanien Emam Hassanien, R.; Luo, X.; Hong, Y.; Feng, Z.; Ji, M.; Zhang, P. Study on the Optical Properties of Triangular Cavity Absorber for Parabolic Trough Solar Concentrator. Int. J. Photoenergy 2015, 2015, 1–9. [Google Scholar] [CrossRef] [Green Version]
  28. Xiao, G.; Yang, T.; Ni, D.; Cen, K.; Ni, M. A model-based approach for optical performance assessment and optimization of a solar dish. Renew. Energy 2017, 100, 103–113. [Google Scholar] [CrossRef]
  29. Tu, N.; Wei, J.; Fang, J. Numerical investigation on uniformity of heat flux for semi-gray surfaces inside a solar cavity receiver. Sol. Energy 2015, 112, 128–143. [Google Scholar] [CrossRef]
  30. Wang, F.; Shuai, Y.; Yuan, Y.; Yang, G.; Tan, H. Thermal stress analysis of eccentric tube receiver using concentrated solar radiation. Sol. Energy 2010, 84, 1809–1815. [Google Scholar] [CrossRef]
  31. Wang, K.; He, Y.-L.; Li, P.; Li, M.-J.; Tao, W.-Q. Multi-objective optimization of the solar absorptivity distribution inside a cavity solar receiver for solar power towers. Sol. Energy 2017, 158, 247–258. [Google Scholar] [CrossRef]
  32. Tang, X.; Yang, W.; Dai, Z.; Yang, Y. Inverse Design of Local Solar Flux Distribution for a Solar Methanol Reforming Reactor Based on Shape Optimization. Front. Energy Res. 2022, 10, 881822. [Google Scholar] [CrossRef]
  33. Tang, X.Y.; Yang, W.W.; Yang, Y.; Jiao, Y.H.; Zhang, T. A design method for optimizing the secondary reflector of a parabolic trough solar concentrator to achieve uniform heat flux distribution. Energy 2021, 229, 120749. [Google Scholar] [CrossRef]
  34. Dai, Z.-Q.; Yang, Y.-J.; Yang, W.-W.; Rong, L.; Tang, X.-Y. A thermochemical reactor design with better thermal management and improved performance for methane/carbon dioxide dry reforming. Int. J. Hydrogen Energy 2022, 47, 34794–34809. [Google Scholar] [CrossRef]
  35. Wu, Z.; Caliot, C.; Flamant, G.; Wang, Z. Coupled radiation and flow modeling in ceramic foam volumetric solar air receivers. Sol. Energy 2011, 85, 2374–2385. [Google Scholar] [CrossRef]
  36. Zheng, L.; Zhang, C.; Zhang, X.; Zhang, J. Flow and radiation heat transfer of a nanofluid over a stretching sheet with velocity slip and temperature jump in porous medium. J. Frankl. Inst. 2013, 350, 990–1007. [Google Scholar] [CrossRef]
  37. Wu, Z.; Wang, Z. Fully coupled transient modeling of ceramic foam volumetric solar air receiver. Sol. Energy 2013, 89, 122–133. [Google Scholar] [CrossRef]
  38. Wang, F.; Tan, J.; Yong, S.; Tan, H.; Chu, S. Thermal performance analyses of porous media solar receiver with different irradiative transfer models. Int. J. Heat Mass Transf. 2014, 78, 7–16. [Google Scholar] [CrossRef]
  39. Lee, B.; Yun, S.-W.; Kim, S.; Heo, J.; Kim, Y.-T.; Lee, S.; Lim, H. CO2 reforming of methane for H2 production in a membrane reactor as CO2 utilization: Computational fluid dynamics studies with a reactor geometry. Int. J. Hydrogen Energy 2019, 44, 2298–2311. [Google Scholar] [CrossRef]
  40. Zhang, H.; Shuai, Y.; Lougou, B.G.; Jiang, B.; Wang, F.; Cheng, Z.; Tan, H. Effects of multilayer porous ceramics on thermochemical energy conversion and storage efficiency in solar dry reforming of methane reactor. Appl. Energy 2020, 265, 114799. [Google Scholar] [CrossRef]
  41. Richardson, J.T.; Paripatyadar, S.A. Carbon dioxide reforming of methane with supported rhodium. Appl. Catal. 1990, 61, 293–309. [Google Scholar] [CrossRef]
  42. Snoeck, J.-W.; Froment, G.F.; Fowles, M. Kinetic Study of the Carbon Filament Formation by Methane Cracking on a Nickel Catalyst. J. Catal. 1997, 169, 250–262. [Google Scholar] [CrossRef]
  43. Tsai, C.-Y. Design of free-form trough reflector for solar thermal concentrator system based on quadratic Bézier curves. Opt. Commun. 2022, 511, 128024. [Google Scholar] [CrossRef]
  44. Tang, X.-Y.; Dou, P.-Y.; Dai, Z.-Q.; Yang, W.-W. Structural design and analysis of a solar thermochemical reactor partially filled with phase change material based on shape optimization. Sol. Energy 2022, 236, 613–625. [Google Scholar] [CrossRef]
  45. Duraklı, Z.; Nabiyev, V. A new approach based on Bezier curves to solve path planning problems for mobile robots. J. Comput. Sci. 2022, 58, 101540. [Google Scholar] [CrossRef]
  46. Xu, L.; Cao, M.; Song, B. A new approach to smooth path planning of mobile robot based on quartic Bezier transition curve and improved PSO algorithm. Neurocomputing 2022, 473, 98–106. [Google Scholar] [CrossRef]
  47. Biegler, L.T.; Zavala, V.M. Large-scale nonlinear programming using IPOPT: An integrating framework for enterprise-wide dynamic optimization. Comput. Chem. Eng. 2009, 33, 575–582. [Google Scholar] [CrossRef]
  48. Saad, Y.; Schultz, M.H. GMRES: A Generalized Minimal Residual Algorithm for Solving Nonsymmetric Linear Systems. SIAM J. Sci. Stat. Comput. 1986, 7, 856–869. [Google Scholar] [CrossRef] [Green Version]
  49. Schenk, O.; Gartner, K. Solving unsymmetric sparse systems of linear equations with PARDISO. Futur. Gener. Comp. Syst. 2004, 20, 475–487. [Google Scholar] [CrossRef]
  50. Lee, H. The geometric-optics relation between surface slope error and reflected ray error in solar concentrators. Sol. Energy 2014, 101, 299–307. [Google Scholar] [CrossRef]
  51. Benguerba, Y.; Dehimi, L.; Virginie, M.; Dumas, C.; Ernst, B. Modelling of methane dry reforming over Ni/Al2O3 catalyst in a fixed-bed catalytic reactor. Reac. Kinet. Mech. Cat. 2015, 114, 109–119. [Google Scholar] [CrossRef]
Figure 1. Schematic diagram of cavity-type solar thermochemical reactor with dish concentrator and the achievement of optimal heat flux distribution.
Energies 16 02781 g001
Figure 2. (a) Schematic diagram of dish concentrator system, and (b) 2D schematic diagram of cavity-type solar thermochemical reactor.
Energies 16 02781 g002
Figure 3. Overall simulation and optimization flow chart.
Energies 16 02781 g003
Figure 4. Verifications of (a) optical model of dish concentrator, (b) and of chemical reaction [50,51].
Energies 16 02781 g004
Figure 5. (a) Effect of rim angle and absorptivity on total incident solar energy, and (b) comparison of two flux distributions.
Energies 16 02781 g005
Figure 6. (a) Comprehensive performance and (b) energy utilization comparison at two solar fluxes.
Energies 16 02781 g006
Figure 7. Temperature distributions in two cases: (a) solid phase, and (b) fluid phase.
Energies 16 02781 g007
Figure 8. Comparison and analysis of the hydrogen production rate, hydrogen mass flow, and fluid temperature.
Energies 16 02781 g008
Figure 9. Performance comparison at different inlet volume flows for the optimal solar flux.
Energies 16 02781 g009
Figure 10. (a) Genetic algorithm optimization iteration and (b) achievement of optimal solar flux and optimization results of cavity wall absorptivity.
Energies 16 02781 g010
Figure 11. Performance comparison at different inlet volume flows for the real flux distribution achieved by varying the absorptivity.
Energies 16 02781 g011
Table 1. Relevant parameters of dish concentrator and DRM reactor.
ParameterValuesParameterValue
Dish diameter1.20 (m)R30.047 (m)
Surface reflectivity0.9dp0.003 (m)
Slope error2 (mrad)L10.086 (m)
Solar half angle4.65 (mrad)L20.13 (m)
R10.03 (m)L30.14 (m)
R20.017 (m) φ 0.8
Table 2. Chemical reaction kinetic parameters.
ParameterValuesParameterValue
k11.29 × 106e−102,065/(RT) K CO 2 , 1 2.61 × 10⁻²e+37,641/(RT)
k20.35 × 106e−81,030/(RT) K CH 4 , 1 2.60 × 10⁻²e+40,684/(RT)
k36.95 × 103e−58,893/(RT) K CO 2 , 2 0.5771e+9262/(RT)
K p 1 6.78 × 10¹⁴e−259,660/(RT) K H 2 , 2 1.494e+6025/(RT)
K p 2 56.4971e−36,580/(RT) K CH 4 , 3 0.21e−567/(RT)
K p 3 2.98 × 10⁵e−84,400/(RT) K H 2 , 3 5.18 × 10⁷e−133,210/(RT)
Disclaimer/Publisher’s Note: The statements, opinions and data contained in all publications are solely those of the individual author(s) and contributor(s) and not of MDPI and/or the editor(s). MDPI and/or the editor(s) disclaim responsibility for any injury to people or property resulting from any ideas, methods, instructions or products referred to in the content.

