Article

Simulation of the Temperature of a Shielding Induction Motor of the Nuclear Main Pump under Different Turbulence Models

1
School of Electrical and Electronic Engineering, Harbin University of Science and Technology, Harbin 150080, China
2
School of Mechanical and Electronic Engineering, Qiqihar University, Qiqihar 161006, China
3
School of Mechanical and Power Engineering, Harbin University of Science and Technology, Harbin 150080, China
4
Harbin Electric and Power Equipment Co., Ltd., Harbin 150040, China
*
Author to whom correspondence should be addressed.
Energies 2023, 16(6), 2792; https://doi.org/10.3390/en16062792
Submission received: 12 February 2023 / Revised: 10 March 2023 / Accepted: 13 March 2023 / Published: 17 March 2023
(This article belongs to the Topic Clean and Low Carbon Energy)

Abstract

:
Thermal design and the choice of turbulence models are crucial for motors. In this project, the geometrical model of the vertical shielding induction motor for a small nuclear main pump was established by SolidWorks software and the finite volume method was adopted to investigate the temperature of the motor, especially the temperatures of bearings lubricated water. To make the numerical simulation of flow and heat transfer in the rotating clearance of the shielding induction motor more accurate, the effects of four types of different two equation turbulence models on the temperature field of the shielding induction motor were studied. The results showed that different choices of turbulence models had little effect on the temperature of the winding insulation but influenced the temperature of the lower guide bearing lubricating water and the secondary cooling water outlet. The SST k-ω model showed the lowest relative error result of the temperature of the winding insulation and the bearing lubricating water in the primary loop system of the shielding induction motor. The temperature of the clearance water, the spiral tube water and the spiral groove water increased approximately linearly along the axial direction.

1. Introduction

As one type of green and low-carbon energy, small-capacity nuclear power has a broad space for development in the current global world. The shielding induction motor of the nuclear main pump is used to drive the reactor cooling pump, and its thermal behavior, which is closely related to its lifespan and efficiency, and is crucial for the primary circuit loop system of a nuclear reactor in the nuclear power plant [1,2,3,4]. Thermal investigation of the shielding induction motor of the nuclear main pump is in the ascendant.
Generally, the thermal behavior of the motor can be determined by the losses and the cooling capacity [5,6,7,8]. The peak temperature of the stator winding insulation does not exceed the permitted temperature of 200 °C, and the temperature of the bearing lubricating water in the primary cooling water is lower than the alarm temperature of 95 °C, two important factors that affect the reliability and lifetime of the thermal design and the management of the shielding induction motor. In addition to prototype testing [7], many studies have been conducted to predict the temperature distribution of a motor with various motor types and operating conditions adopted by different simulation methods [1,2,3,4,5,6,7,8]. For example, Wang et al. used a thermal equivalent network to calculate the actual increase in temperature of the stator winding of a 5.5 MW shielded induction motor [8]. Ding et al. used the finite volume method to study the temperature distribution characteristics of the solid components of canned pump motors [9]. Lu et al. mainly studied the influence of water friction losses using different calculation methods [10], and the influence of the uncertainty of the thermal conductivity of the winding insulation and core lamination on the characteristics of the temperature field for the shielding motor [11]. There was no comparison of results between the numerical simulation by different types of turbulence models [8,9,10,11]. For the water clearance in the primary circuit loop, water lubricated bearings are the key supporting equipment in the rotor system. Xie et al. investigated the influences of the laminar model, the turbulent k-ε model, k-kl-Ω model, and k-Ω model on the bearing lubrication [12]. Furthermore, the influence factors of friction losses induced by clearance flow were also investigated for the flywheel [13,14] and the effect of viscosity-temperature on the dynamic characteristics of rotor of the rotor system was studied, the clearance design method between the stator and the rotor cans was also discussed [15], and many studies focused on obtaining the suitable heat transfer coefficient for the machines [16,17,18,19,20]. In addition, the effect of the turbulence model was also carried out on different types of machines [21,22]. Compared to the quasi-steady state RSM model, Kim et al. found that the SST k-ω model showed the lowest error result of the volumetric flow rate distribution of the ducts in a large-capacity high-speed air-cooled induction motor [22].
Based on the above-mentioned literature, the main focus of research on shielding induction motor of the nuclear main pump is mainly on the peak temperature of the winding, its influencing factors, and the flow and heat transfer behavior in water clearance. In addition, limited studies have been conducted on the effects of the selection of turbulence models on temperature prediction, especially for the clearance water temperature. The geometric structure and parameter range of the shielded induction motor studied in this paper are different from those in the previous literature. The research purpose of this paper is to identify the simulation accuracy of the temperature of a shielding induction motor under different turbulence models. The four types of two-equation turbulence models have been selected for numerical simulation of the flow and heat transfer of the shielding motor for the small reactor vertical nuclear main pump. A numerical analysis was also conducted to examine the effects of different turbulence models on the motor temperature with the prototype test results, the relative error analysis was carried out, and the lowest relative error turbulence model suitable for the rotating clearance flow of the shielding motor was finally determined. Additionally, the temperature distribution characteristics of the motor under this turbulence model were studied.

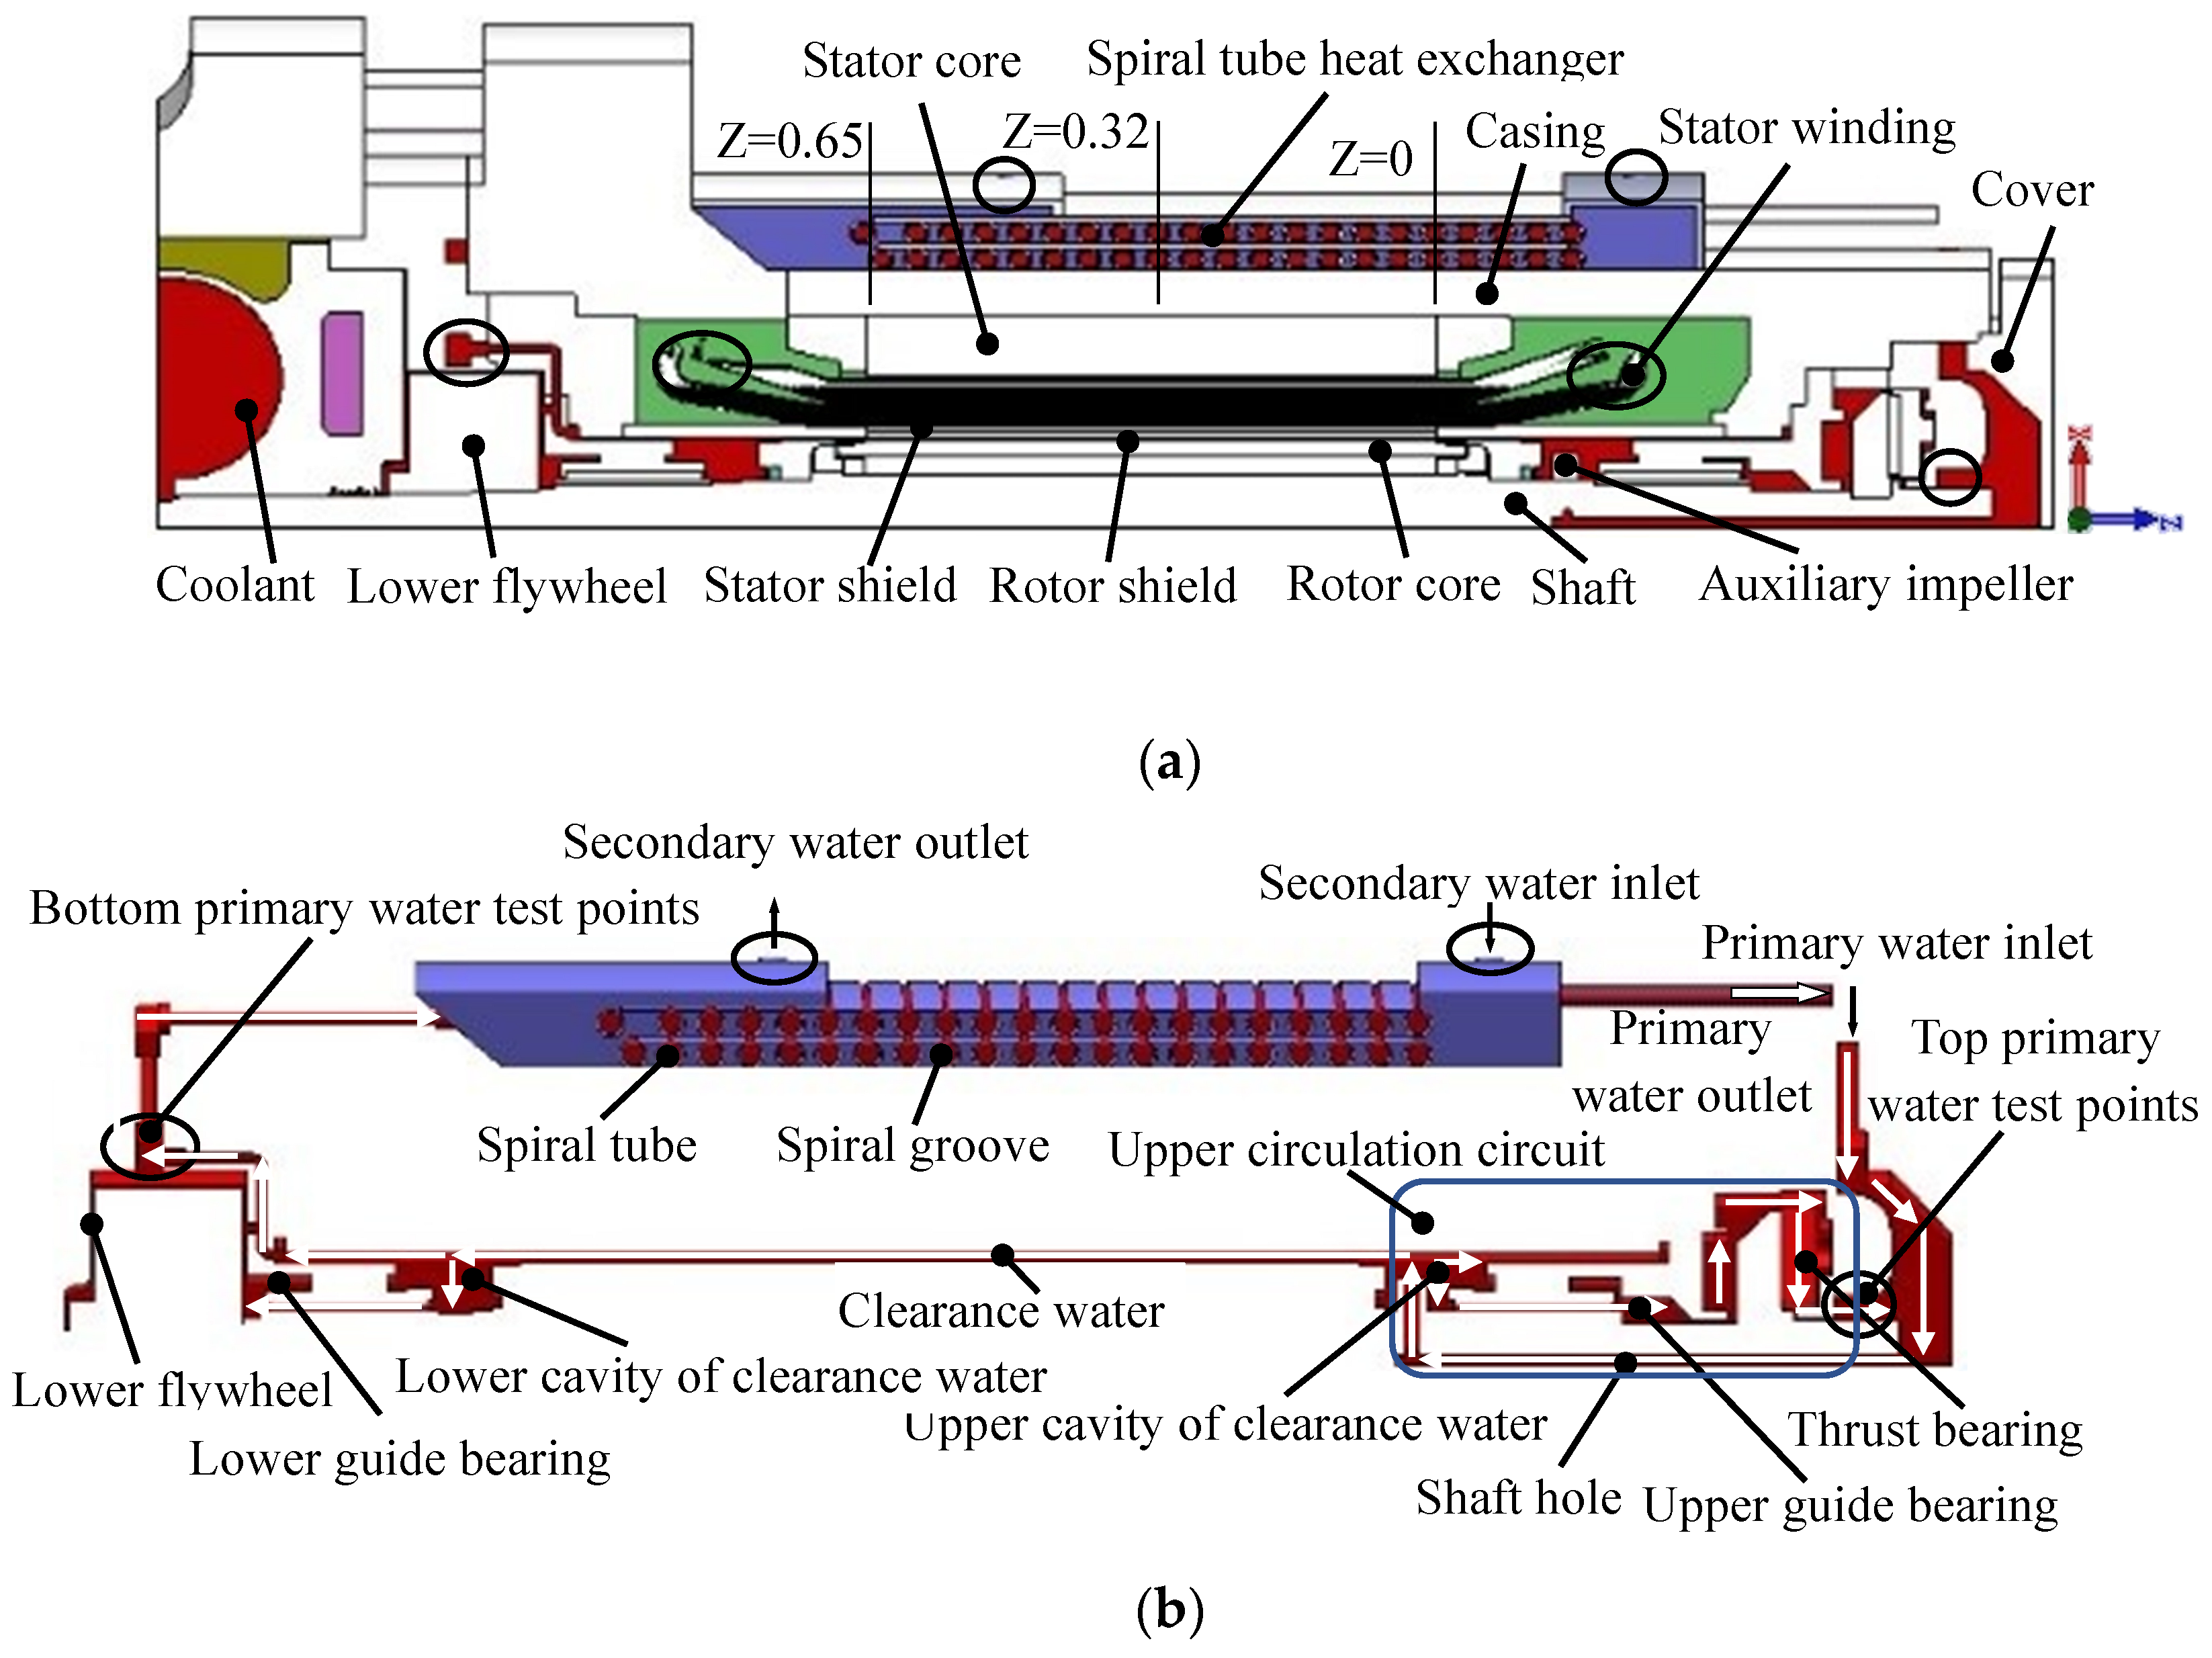
2. Geometrical Model Description

The geometrical model of this project was a small capacity nuclear main pump shielding induction motor, and it was a vertical arrangement. The main parameters of the analyzed motor are indicated in Table 1. The insulation materials at each part were N grade. Considering the structure of the motor and the layout characteristics of the primary and secondary cooling water, a quarter of the 3-D entity motor was selected as the calculation domain model. To make the calculation boundary correspond to reality, the coolant in the main pump of the reactor under the motor was also included in the calculation domain, as shown in Figure 1a.
Because the motor cooling capacity is limited, there were primary and secondary cooling water paths within the motor and its spiral heat exchanger. Primary cooling water that flows out of the spiral heat exchanger was sucked into the duct of the upper cover and down through the shaft hole above. The flow rate of primary cooling water depended mainly on the rotation speed of the auxiliary impeller to generate a driving pressure head. The water flow thrown away by the Coriolis force was divided into two parts at the outlet of the auxiliary impeller. A part turned to flow upward, lubricating the upper guide bearing and the thrust bearing, and then returned to the duct of the top cover to form an upper circulation circuit. The other part flowed downward, through the clearance of the stator and rotor shield, the lower guide bearing, and then into the four spiral tubes outside the casing, forming the main cooling loop of the motor. The spiral heat exchanger was directly wrapped outside the motor casing and is arranged in the same height position as the iron core. Secondary cooling water from the upper inlet flowed down into the four spiral grooves within a double layer between spiral tubes and baffled, conducting a countercurrent heat transfer process with the high-temperature primary cooling water in the spiral tubes, and exited at the outlet of the heat exchanger. The waterway structure of the primary and secondary cooling water is shown in Figure 1b.

3. Mathematical Model and Solution Conditions

3.1. Basic Assumptions

To simplify the solution process, during the cooling water flow in the motor, the flow was in a turbulent state, and it can be regarded as an incompressible fluid treatment because the Mach number was much less than 0.7, and the electric losses as a heat source in the components of the motor generated were assumed to be uniformly distributed in the simulation process. The stator winding was composed of multiturn coils. Each side of the turn had multiple flat strands in parallel for the purpose of suppressing the skin effect, which reduced the eddy current losses [23]. For the convenience of calculation, the equivalent simplification of the stator winding model was made without changing the actual physical process [24].

3.2. Mathematical Model

When the shielding induction motor was in operating condition, the water of the shaft hole rotated together with the shaft. Under the action of shear force, Taylor-Couette-Poisson flow would be formed in the water clearance of the bearing lubricating and between the stator and the rotor shield. For the fluid region, the three-dimensional incompressible flow is described based on the Reynolds-averaged Navier–Stokes equation (RANS). The N-S equation combined with different types of turbulence model is the most widely adopted by the CFD numerical simulation approach. Three-dimensional flow and heat transfer coupling equations including mass, momentum, and energy conservation equations can be sketched as follows.
( ρ u i ) x i = 0
( ρ u i u j ) x j = P x i + x j ( μ u i x j ρ u i u j ¯ )
( ρ u i T ) x i = x i ( λ c p T x i ) + S T
where, i, j = 1, 2, 3, xi, xj correspond to the three coordinate components x, y, z, ui, uj is the velocity component in the direction of x, y, z, p is the pressure, ST is the heat source term, T is the temperature, ρ is the density, cp is the specific heat at constant pressure, λ is the thermal conductivity. μ is the dynamic viscosity.
The four types of turbulence models with detailed two transport equations selected in this work are listed in Table 2 [25]. These models represent the turbulent properties of the flow. The first transported variable is the turbulent kinetic energy k, and the second transported variable is ω or ε.
In the foregoing equations, Gk and Gω are the generations of k and ω due to the mean velocity gradients. Gb is the k production due to buoyancy, YM is the contribution of fluctuating expansion in compressible turbulence at the rate of global dissipation, G1ε, G, and G3ε are constants, σk and σε are the same as in the standard k-epsilon model, σk and σε are turbulent Prandtl numbers, Sk, Sε, and Sω are user-defined source terms, αk and αε inverse effective Prandtl numbers, μeff is effective viscosity, Γk and Γω are the effective diffusivity of k and ω, respectively, Yk and Yω are the dissipation of k and ω due to turbulence, Dω is the cross-diffusion term. The units of quantities encountered in this paper were used by the SI system.

3.3. Solution Conditions

3.3.1. Boundary Conditions

In the shielding induction motor test, the corresponding primary and secondary cooling water inlet temperature were set as 32.6/19.7 °C, and the inlet flow rate of primary and secondary cooling water in the internal clearance and heat exchanger grooves of the motor was 10/14.2 m3/h. The gauge pressure at the primary and secondary cooling water outlet was set at 0 Pa. The outer wall of the physical model was exposed to ambient room air of 25 °C, the combined convection and radiation heat transfer coefficient was set at 10 W/(m2·K), and the surface emissivity of the steel wall was taken as 0.8. The temperature of the reactor coolant was maintained at 287.3 °C, see Figure 1a. On the left and right boundary surfaces of the geometric model, the primary cooling water in the spiral tube and the motor and the secondary cooling water in the spiral groove are periodically connected one by one to form a continuous flow channel of primary and secondary cooling water. Figure 2 shows the schematic diagram of the periodic connection of the spiral tube, in which the radius difference and the height difference of the spiral line were ignored, as well as the corresponding influence on the temperature and velocity distribution. After periodic connections, the height, pitch, and number of spiral tubes in the model remain unchanged. The yellow, blue, green, and gray spiral tubes were connected in turn to form a connected flow channel.

3.3.2. Heat Source and Physical Property Parameters

In addition to the above conditions, the electric losses in the motor were vital heat source data leading to the increase in temperature of solid components, including rotor and stator shield losses, stator winding losses, rotor copper losses, rotor end ring losses, iron losses, etc. The values of electric losses and eddy current losses in the main components could be obtained by the finite element method (FEM) [26] at a rated speed of 2923 r/min, and the thermal conductivity λ of typical components of the motor are shown in Table 3. The heat source was assigned according to the body average. Due to the high rotational speed, the friction losses of the waters were also considered and calculated using a modular program embedded in fluent software [10]. The thermal conductivity of the stator and rotor core lamination was anisotropic, while the others were isotropic. Parameters of the properties of primary and secondary cooling water, such as thermal conductivity, density, specific heat capacity, and dynamic viscosity, were set linearly with temperature according to the fitting curve by UDF under the gauge pressure 15.05/0.41 MPa.

3.4. Solving Method

The verification of grid independence was detailed, and finally an independent solution was obtained. For parts with a large influence on temperature rise, the mesh was finely divided. Four groups of grids with different numbers were designed to verify independence, and the total number of grids in the calculated domain eventually chosen was approximately 3.54 million [11]. ANSYS FLUENT 19.1 was applied in the numerical simulations. The mass, pressure, momentum, and energy equations were each discretized using a second-order upwind scheme. A separation and implicit solution scheme based on a pressure solver was adopted. The SIMPLE scheme was used for pressure–velocity coupling, the convergence residuals of the discrete equations of flow and temperature field were 1 × 10⁻³ and 1 × 10⁻⁶, respectively. The convective heat transfer coefficient between the coolant and the motor wall was automatically calculated according to the convective heat transfer and conduction equilibrium equations in the software module program.

4. Results and Discussion
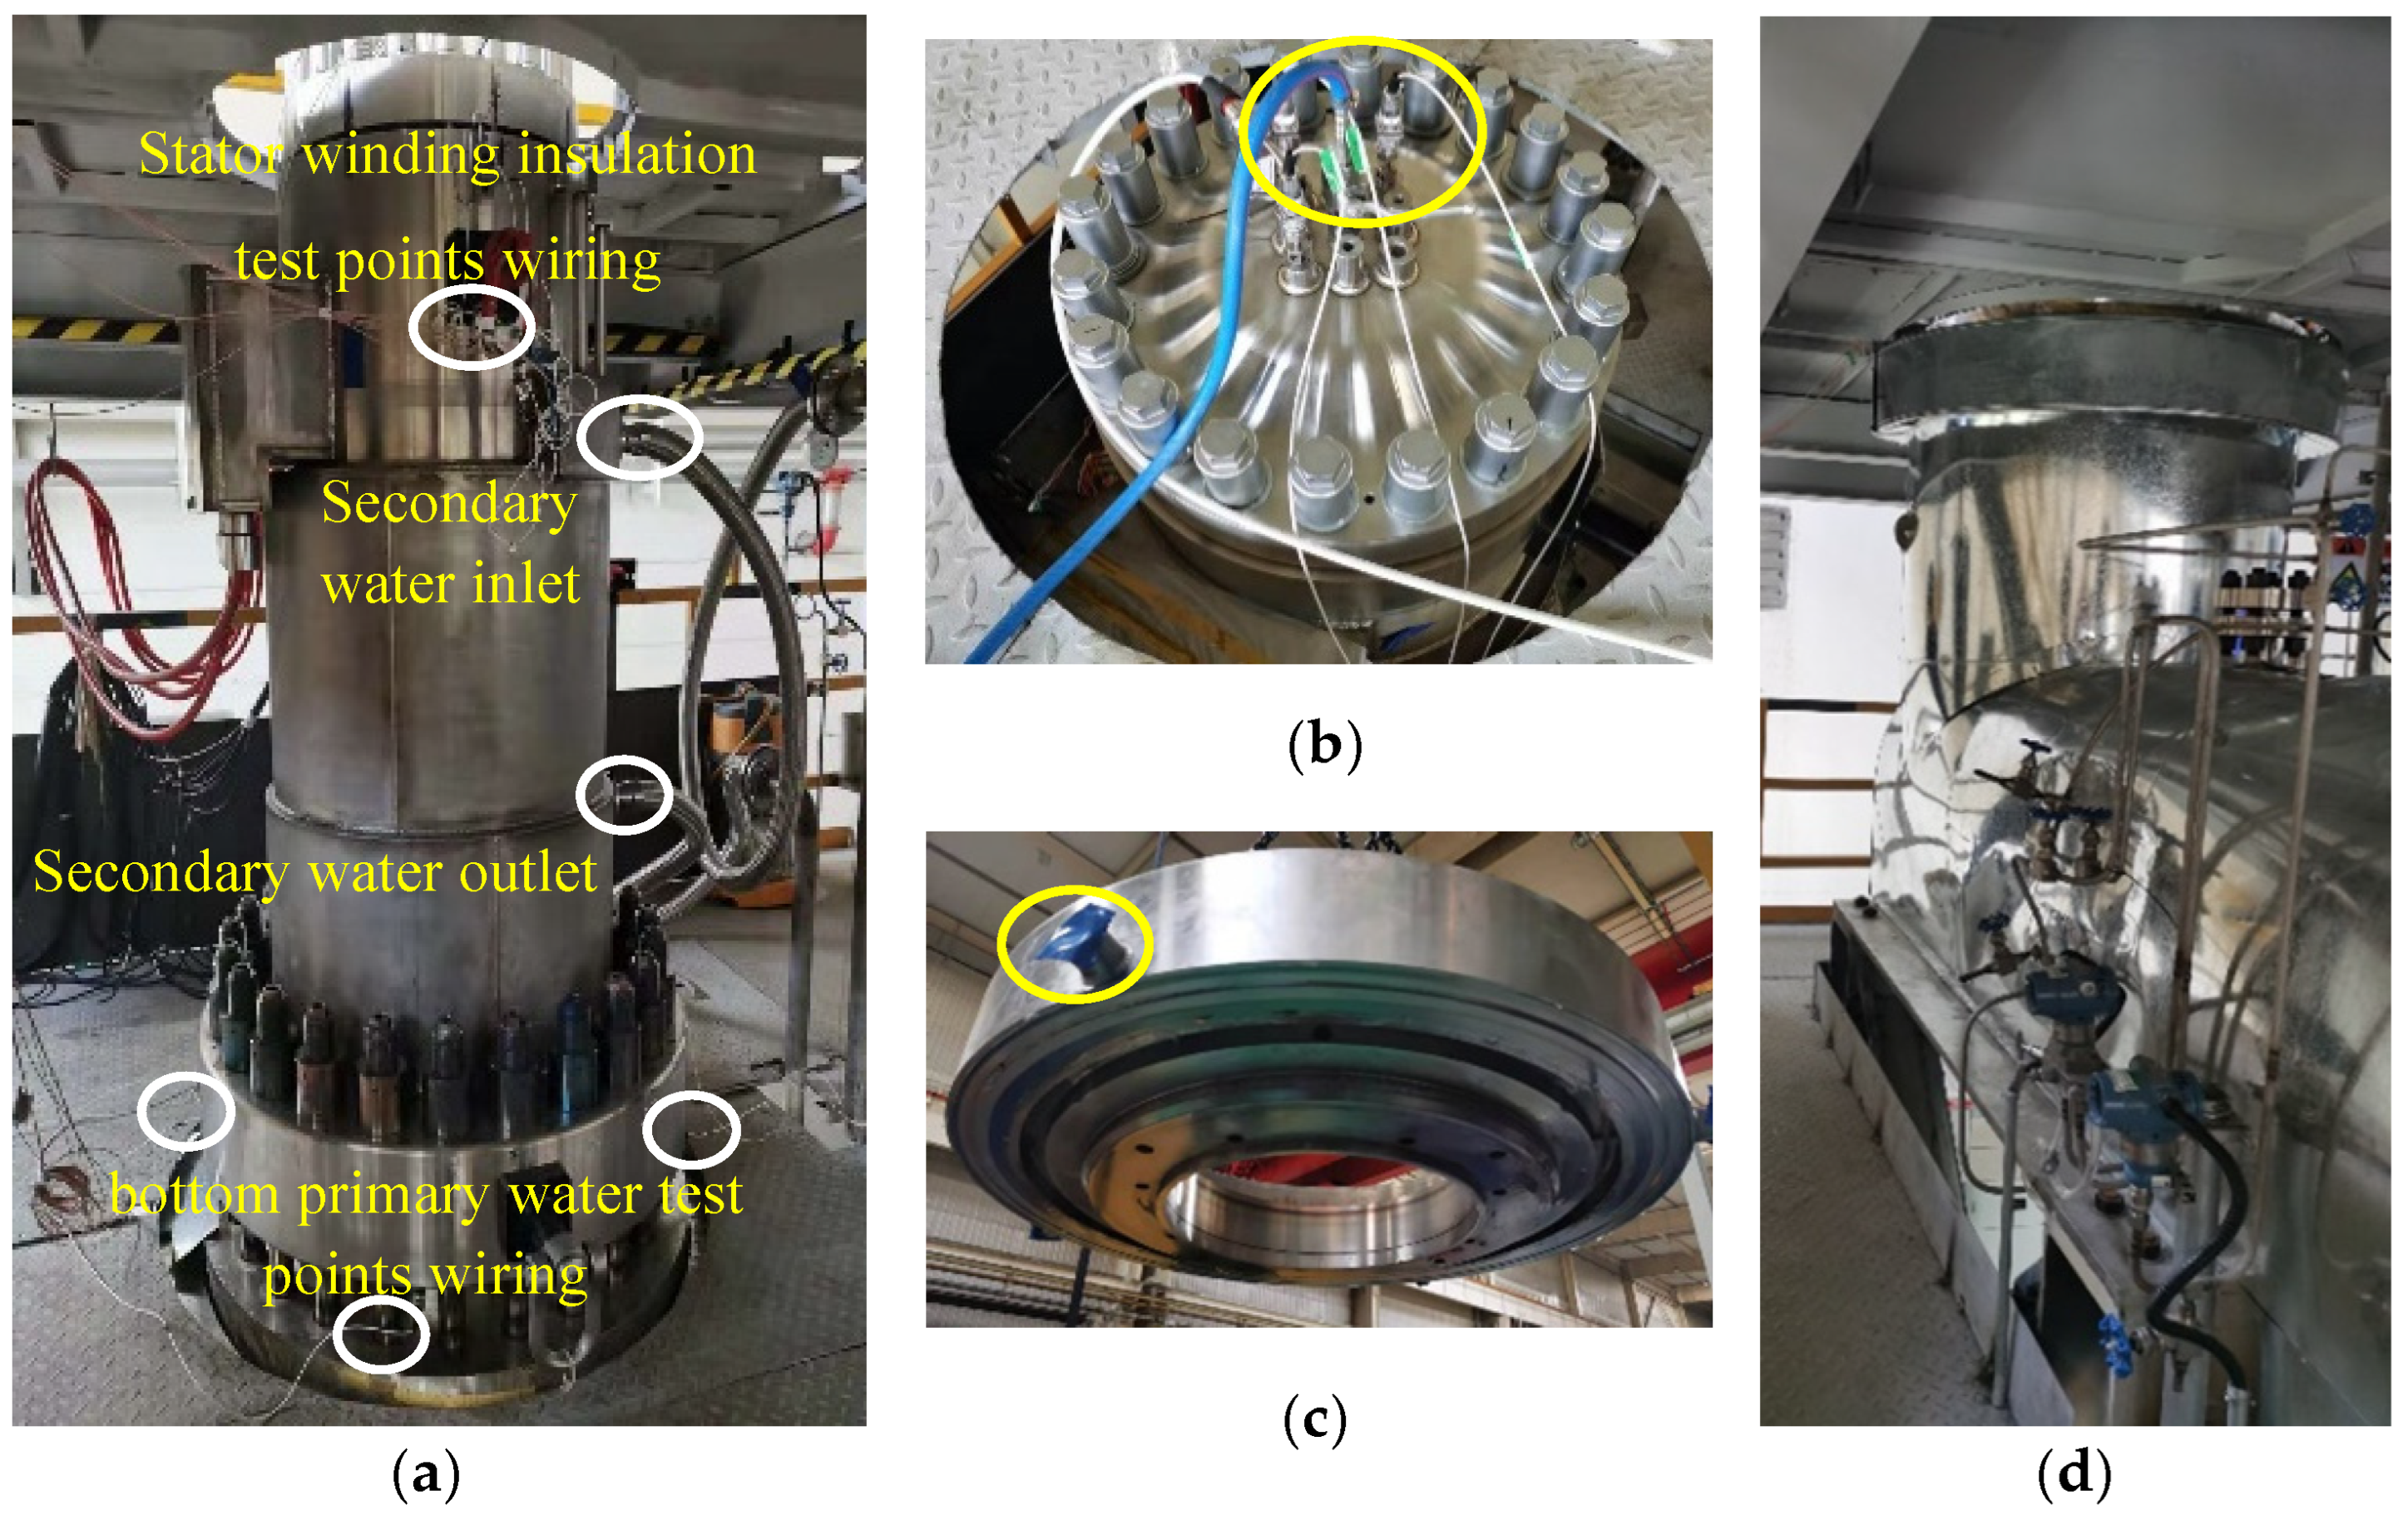
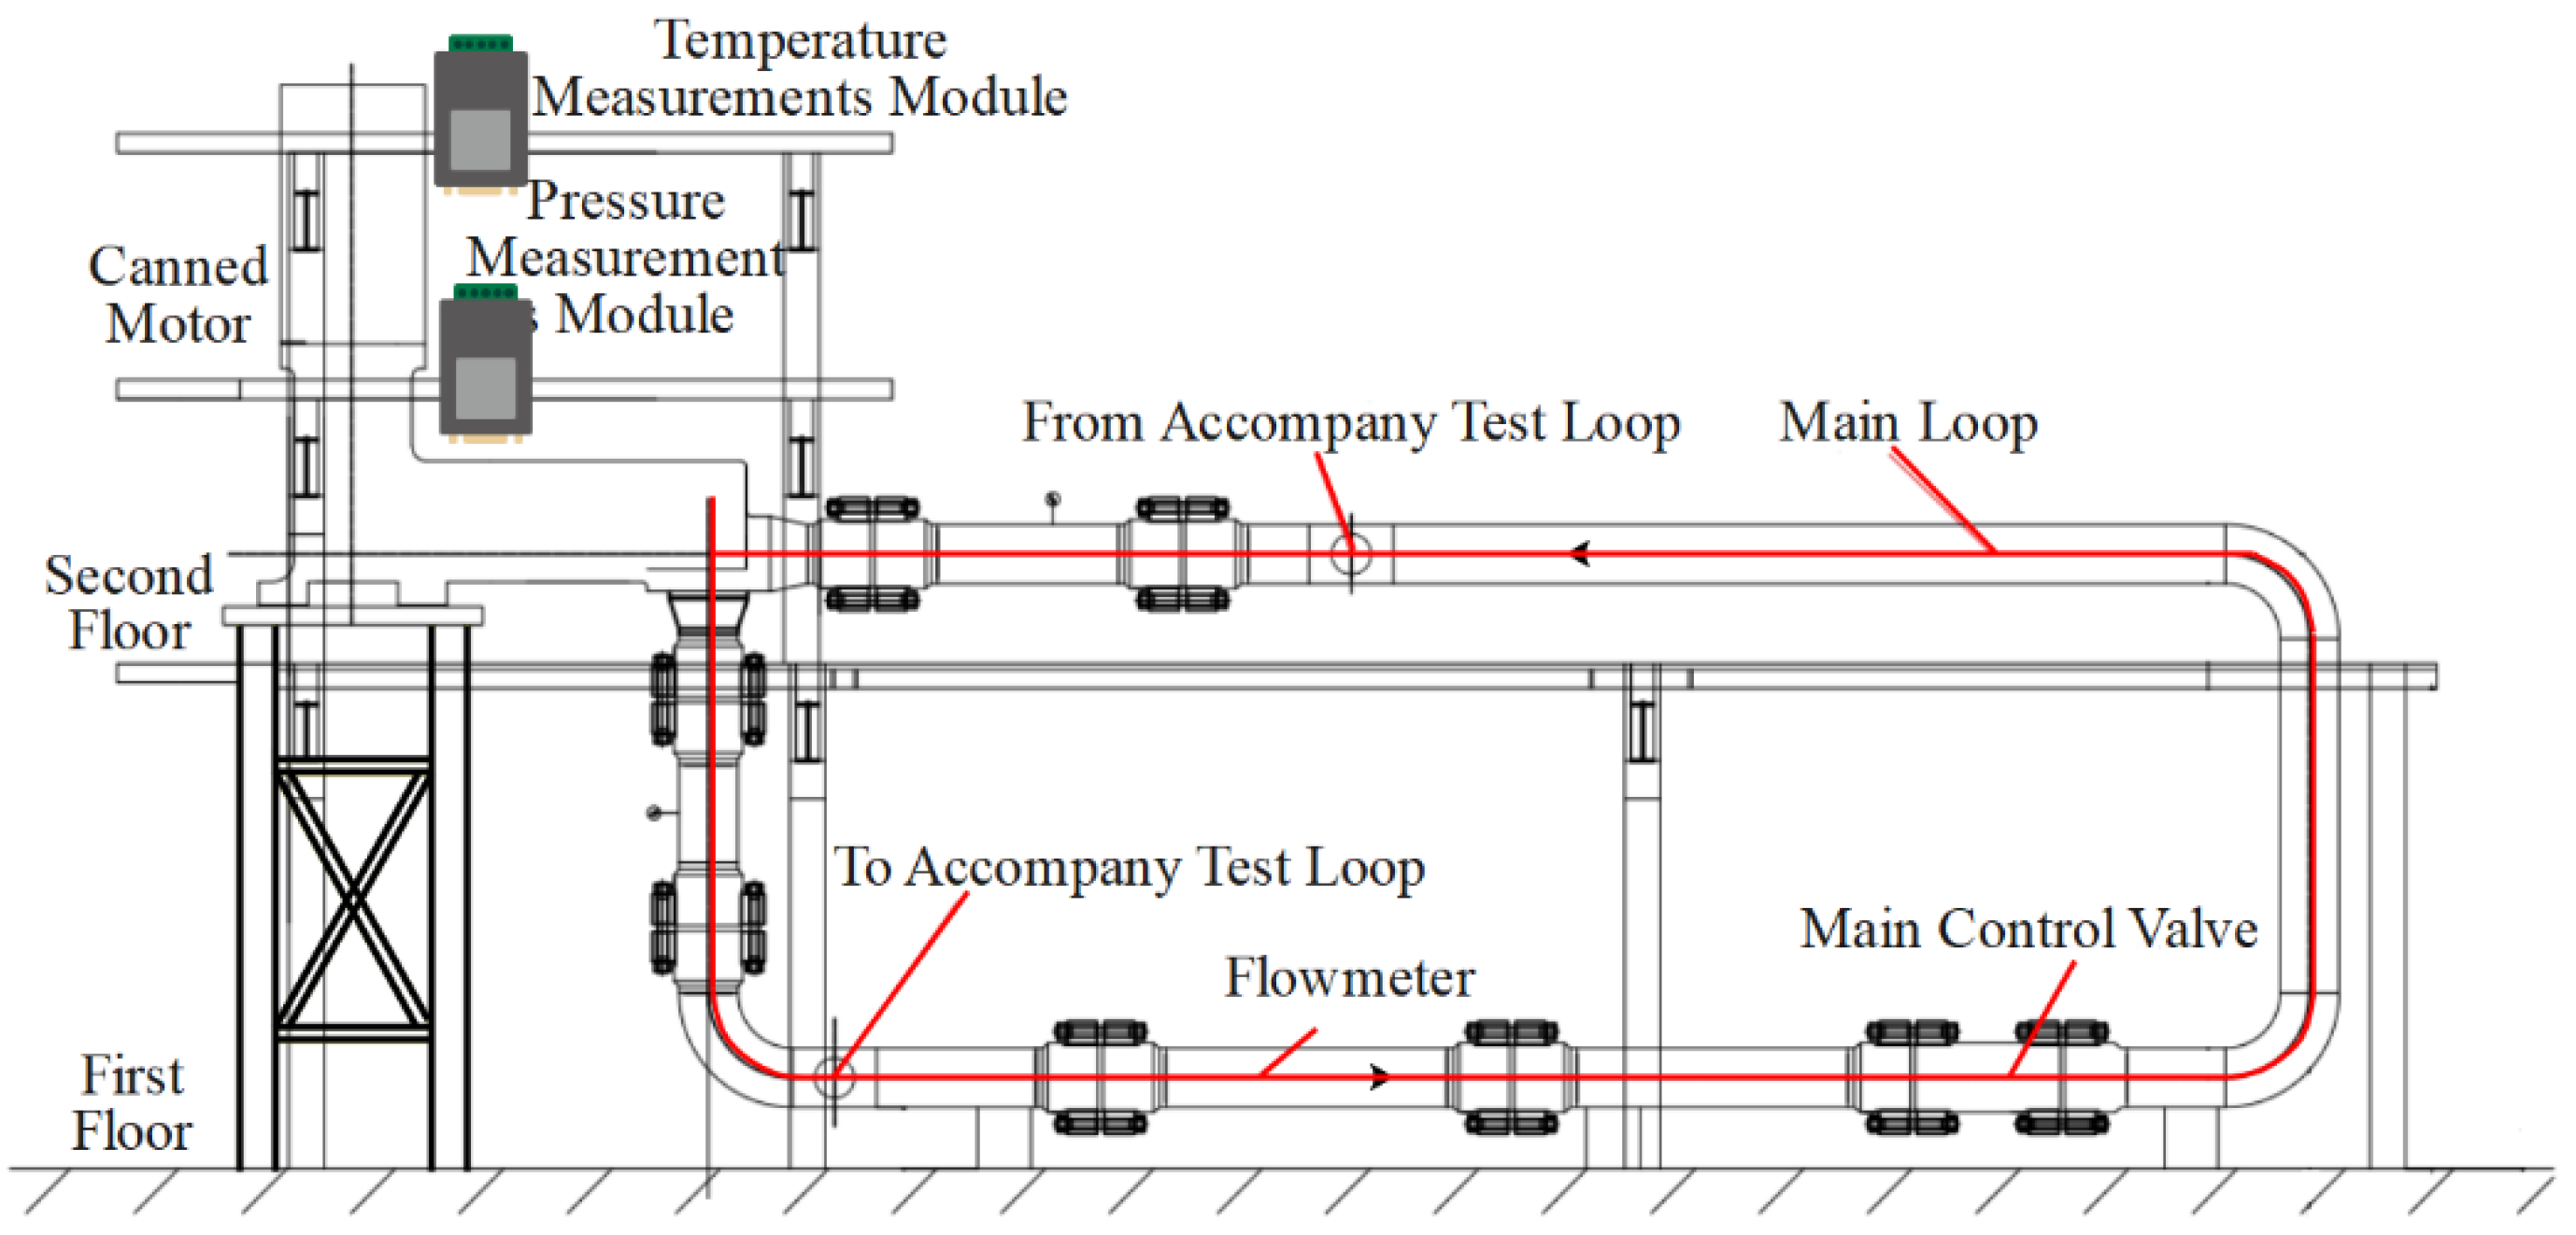
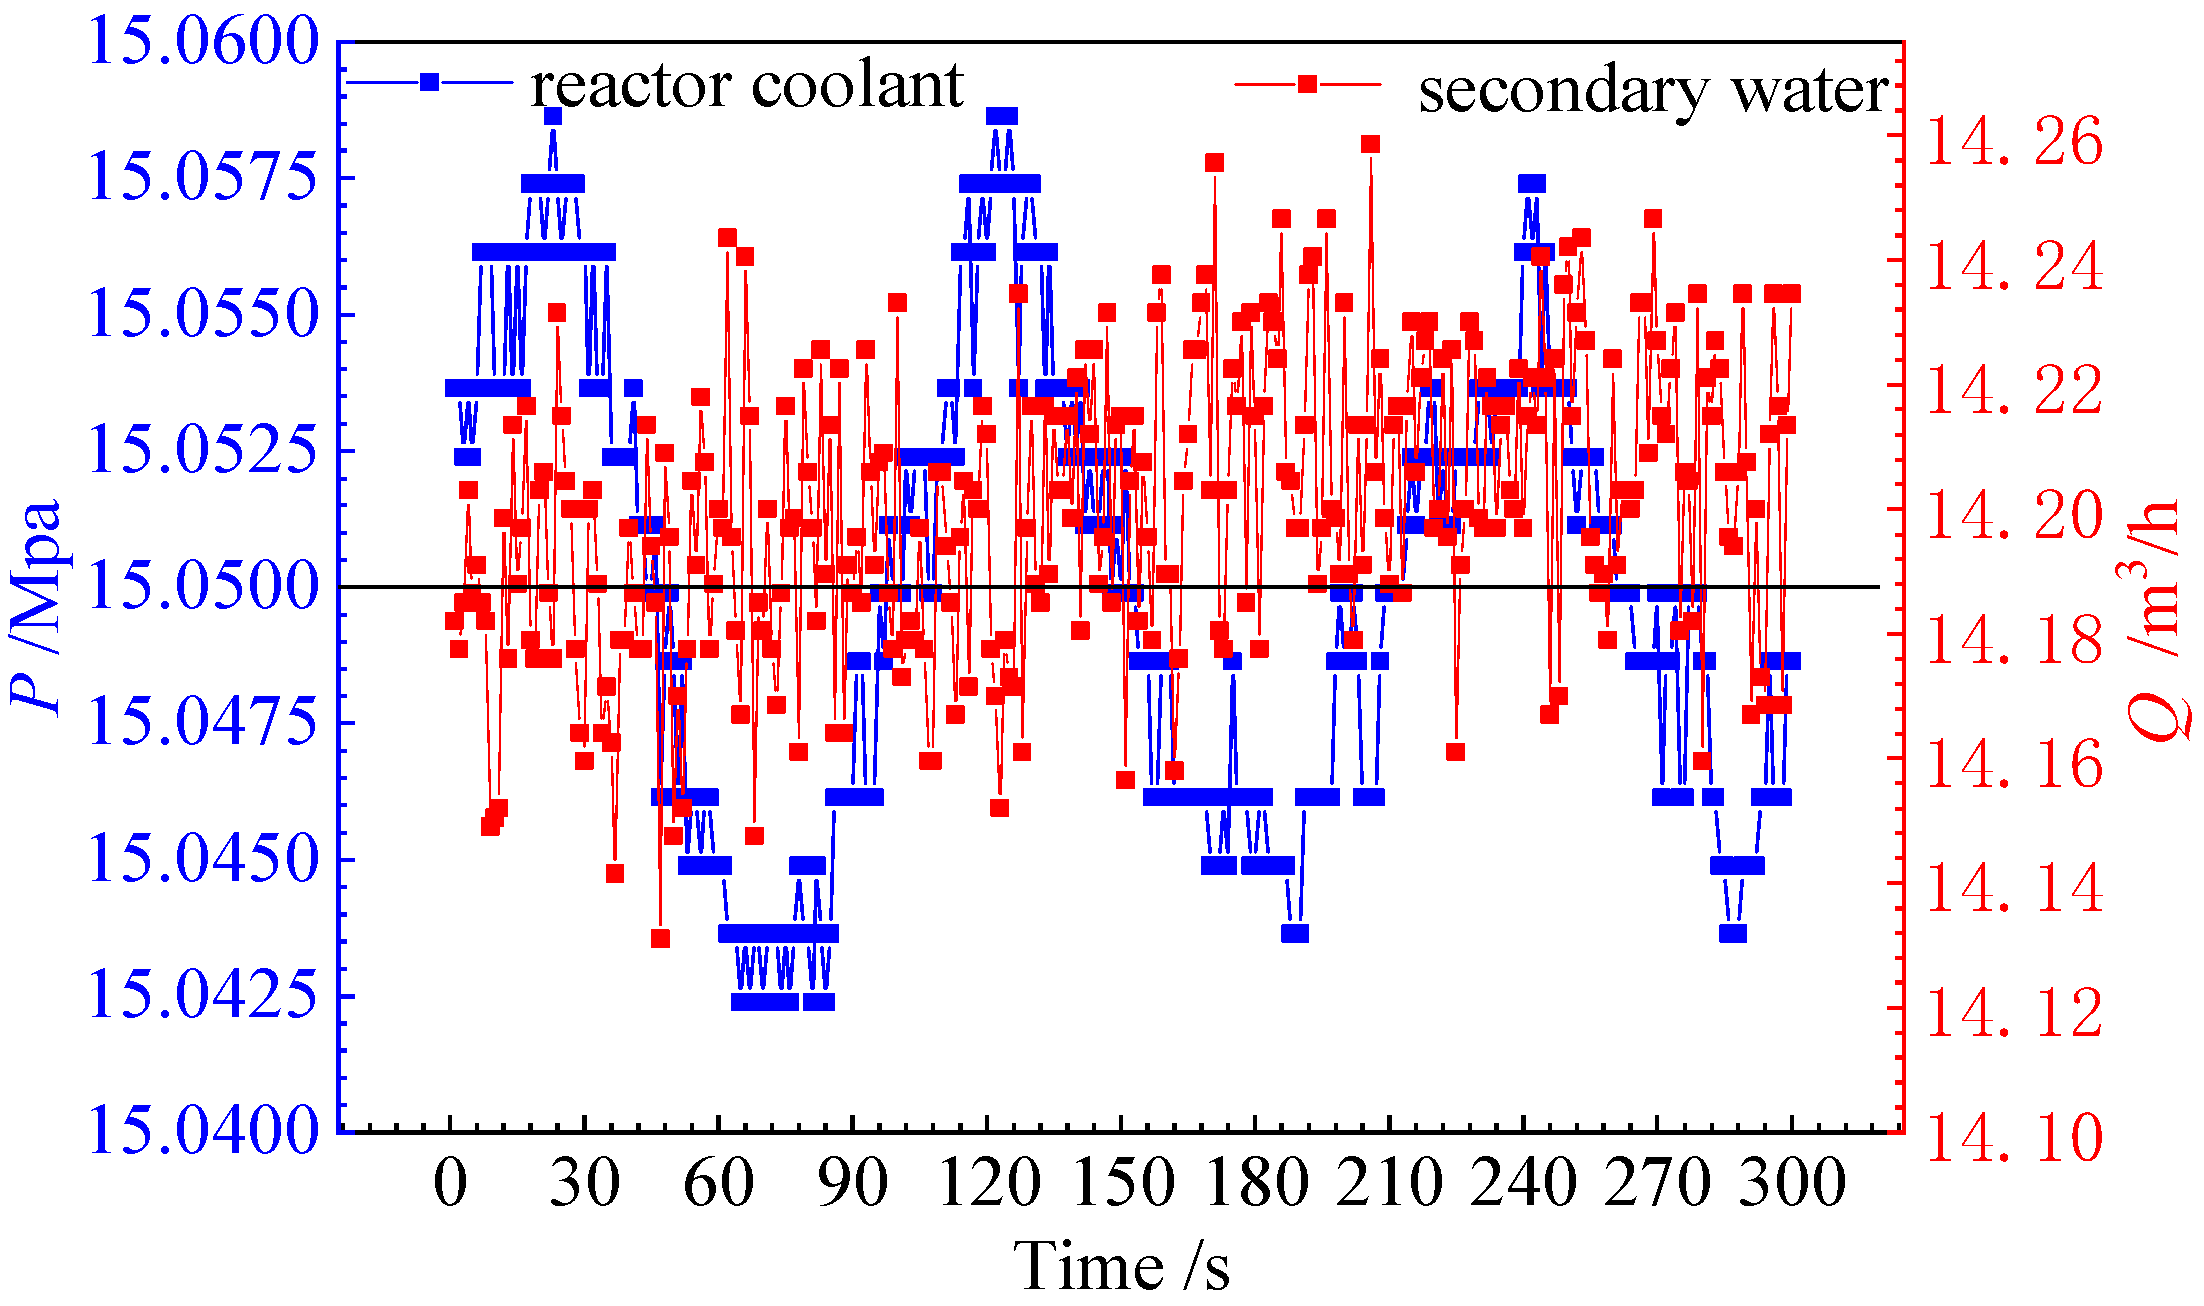
4.1. Prototype Test

To obtain comprehensive performance, a multi-parameters test rig of the 0.24 MW shielding induction motor was established in the factory for the reactor coolant pump for small reactors, as shown in Figure 3. As previously mentioned, the water temperature for bearings lubricating and the insulation temperature were the key testing parameters for performance. Therefore, four temperature test points were installed in the lubricating water above the thrust bearing through the end cover considering that the water clearance was too narrow and the inconvenience of arrangement of the measuring holes and were called top primary cooling water test points for brevity. At the same time, the four test points were installed in the lower annular duct at 90° intervals along the circumferential direction under the lower position of the motor to monitor the water temperature of the lubricated lower guide bearing not exceeding the alarming temperature for real time, and they were called bottom primary cooling water test points (see Figure 1b). For the thermo-safety of stator winding insulation, a total of 6 temperature test points were embedded on the surface of the insulating material at the centers of the winding nose with the worst heat dissipation in the upper and lower end rooms of the stator winding based on previous research and experience, and this means that the insulation temperature measured can be taken as the peak temperature of the motor. Furthermore, two water temperature test points were also installed at the position of the inlet and outlet of secondary cooling water. The specific test point positions are shown in the circles in Figure 1 and Figure 3.
Before the test, all measuring instruments were calibrated and the PT100 platinum thermistor sensor four-wire was used. The error of the test instrument itself is very small. In addition to the inlet and outlet temperature of the secondary cooling water, there were many other test points and the accidental error was relatively small. The position of the sensor installation at the top and bottom of the primary cooling water measuring points is shown in Figure 3b,c. When the sensors were installed, it should ensure that they were closely attached to the ambient wall to avoid thermal contact resistance, which was convenient for heat conduction and reduces the response time of the temperature change.
The test system scheme is shown in Figure 4. The main pump coolant circuit, flowmeters, and main control valve system were installed on the first floor, and the accompanying test loop was connected. The motors pressure and temperature measurements module system were installed on the second floor. They can also be seen in the pictures shown in Figure 3d.
The motor prototypical experiment has been conducted for 48 h continuously in the steady thermal rated operating condition. Fragments extracted from the test data of some parameters recorded by the instrument in the 300 s interval of the steady state are shown in Figure 5.
Figure 6 shows the average and standard deviation of the test data for the temperature of the upper and lower end rooms of the stator winding insulation test points (Tup-ins/Tlo-ins), the temperature of the top primary cooling water test points (Ttop), and the temperature of the bottom primary cooling water test points (Tbottom). The error bar can visually display the uncertainty of the test data. In Figure 6, it can be seen that the standard deviation of the Ttop measurement point was the smallest (0.072), and the standard deviation of the Tlow-ins measuring points was the largest (1.029). This shows that the test data were relatively stable and reliable. The temperature of the secondary cooling water outlet test points (Tsecond) was 28.17 °C. In the subsequent analysis, the results simulated by different types of turbulence models were compared with the test averages of the prototype machine according to the same position in Figure 6.

4.2. Effect of Turbulence Models on the Temperature of Stator Winding Insulation

In this project, the primary cooling water was in a highly turbulent state, the rotational Reynolds number and the axial Reynolds number were 9.3 × 10⁴ and 5.6 × 10³, respectively, which belong to the Taylor-Couette-Poiseuille flow in the motor. For convenience in subsequent analysis, the relative error δ is defined as the ratio of the absolute error of the simulated value δ to the average tested value T test ¯ multiplied by 100%. Generally speaking, the magnitude of relative error can better reflect the credibility of the measurement, as shown in Formula (4):
δ = T simu T test ¯ T test ¯ × 100 %
As mentioned above, the test temperature of the stator winding insulation could be taken as the peak temperature of the motor. Therefore, it was one of the key parameters for verifying the accuracy of the predictions. Figure 7 showed δ the relative error of the temperature of the stator winding insulation adopted by four types of turbulence models by CFD simulation.
It can be seen from Figure 7 that the selection of four types of turbulence models had little effect on the temperature of the stator winding insulation by the finite volume method. The temperature of stator winding insulation was affected by both the convective and thermal conduction resistance. Part of the heat generated by the stator end winding was transferred to its surface insulation by heat conduction. The weak natural convection existed on the surface of the insulation in the end rooms of the stator winding. Another part of the heat was transferred to the stator shield and casing through heat conduction. The heat conduction path was relatively long. The turbulent transport equation mainly affected the convective heat transfer between the rotating clearance water and the stator and rotor shield. The heat source density of the stator shield (157.1 MW/m3) was much higher than that of the stator winding (0.23 MW/m3). The above reasons led to the temperature of the winding insulation not being sensitive to change in the turbulence model.
The relative error of the insulation simulation results compared to the experimental results is observed in Figure 7 by the SST k-ω model (0.22%, in the lower end room) followed by the standard k-ε (0.35%, in the lower end room) and the standard k-ω (0.62%, in the lower end room) models, whereas the RNG k-ε model provided the maximum relative error of 1.16% (in the lower end room). The error of the RNG k-ε model was relatively large, includes false diffusion error, discrete error, and rounding error. However, the maximum relative error did not exceed 2%. The relative error of the upper end room of the stator winding insulation was smaller than that of the lower part of the stator. Comparatively speaking, it is more accurate to use the SST k-ω model to calculate the peak temperature of the stator winding insulation of the shielding induction motor.

4.3. Effect of Turbulence Models on the Temperature of Primary and Secondary Cooling Water

The relative error of the temperatures of the primary and secondary cooling water with four turbulence models is shown in Figure 8. It can be seen from Figure 8 that the relative error of Ttop was large, but it basically did not change with the turbulence model. The value of Ttop calculated by four types of turbulence model was basically the same. The minimum relative error compared to the experimental results was observed in the SST k-ω model (−9.078%) followed by the RNG k-ε (−9.173%) and standard k-ε (−9.179%) models, whereas the standard k-ω model provided the maximum relative error of −9.184%, all of which were lower than the experimental results. The temperature rise of the lubricating water of the thrust bearing was mainly caused by the friction losses of the water. Due to its narrow internal water clearance (see Figure 1b), the four temperature measuring sleeves inserted at this place were ignored when the physical model was established, resulting in the simulated value of flow resistance being less than the prototype test value. The simulated value of the Ttop was lower than the actual value and the relative error was negative. In addition, the top primary cooling water test points were far away from the heat generating parts of the motor, and their position was near the primary cooling water inlet. The mixing effect of some primary cooling water and the water from the measuring point was obviously stronger than that of turbulent convection heat transfer. The effect of the four turbulence models on the temperature of the top primary cooling water test points was not distinct.
Furthermore, it can be seen from Figure 8 that the Tbottom calculated by four types of turbulence models was different, and the relative error was relatively larger than the Tsecond. The minimum relative error compared to the experimental results was observed in the SST k-ω model (3.26%) followed by the standard k-ε (4.96%) and RNG k-ε (6.59%) models, whereas the standard k-ω model provided the maximum relative error of 11.84%. This was due to the relatively strong sensitivity of the calculation results of the standard k-ω model, which depended on the k and ω values of the free flow inside and outside the shear layer, which must be corrected.
Moreover, the Tsecond calculated by four types of turbulence models was different. The minimum relative error compared to the experimental results was observed in the SST k-ω model (1.92%) followed by the standard k-ε (2.85%) and standard k-ω (2.91%) models, whereas the RNG k-ε model provided the maximum relative error of 4.85%. The relative error of the SST kω model was the smallest.
This result may have been due to the better boundary layer flow analytical ability of the SST k-ω model compared to other turbulence models. Accounting for the transport of the turbulence shear stress in the definition of turbulent viscosity and incorporating a damped cross-diffusion derivative term in the ω equation, these features made the SST k-ω model more accurate and reliable for a narrow clearance water flow with a rotating inner cylinder and the temperature field for the shielding induction motor with spiral tube heat exchanger outside the casing.
From the above analysis, it can be concluded that the SST k-ω model is suitable to simulate the temperature field in a combination of a shielding induction motor and a spiral heat exchanger, followed by the standard k-ε, standard k-ω, and RNG k-ε, which are the worst.

4.4. Temperature Distribution Characteristics of the Motor

The temperature of the solid parts of the motor was mainly determined by the magnitude of the heat source and the cooling capability. In this project, the selection of four types of turbulence models for numerical simulation had little effect on the temperature and distribution characteristics of the solid parts of the shielding induction. Figure 9 shows one of the typical temperature distributions of the computational domain model adopted with the SST k-ω model. It can be seen from Figure 9 that the reactor coolant pump is located below the motor [11]. The lower clearance water of the flywheel was in direct contact with the reactor coolant water leaked from the labyrinth seal. The heat of the high-temperature coolant was transferred to the rotor and stator parts above due to a temperature difference, resulting in the temperature of the winding and its insulation at the lower stator end being relatively higher than that at the upper stator end. In addition, although the electric losses inside the shielding induction motor were mainly generated by components at the middle position of the stator and rotor segment, such as the iron core, winding, stator, rotor shield, and so on, the heat was mainly transferred to the wall near the cooling water by conduction, then it was carried away mainly by rotational convective heat transfer of the primary cooling water in the annular clearance between the stator and rotor shield, the temperature of the winding and its insulation was lower in the middle position of the core than in the end room, but significantly higher than ambient other parts. The temperature of the casing in the middle position of the core was also a key parameter for thermal stress.
Figure 9b shows the temperature contour of the casing extract of Figure 9a. It can be seen from Figure 9b that the inner surface of the casing ambient the stator core was with high temperature, and the temperature gradually decreased along the radius direction with about 20 °C temperature drops. The accurate temperature distribution of the casing provided important basic data for thermal stress calculation.
The spiral heat exchanger was located between the upper and lower stator end room in the middle of the motor, which was the main position of the heat source of the motor and the primary and secondary cooling water heat exchange. Therefore, it was necessary to study the temperature distribution characteristics in the middle of the motor. Figure 9c shows the temperature contour of the cross section at z = 0.32 m. It can be seen from Figure 9c that the temperature of the stator winding was the highest, and the temperature of the solid parts decreased gradually in both directions of increasing and decreasing radius. The temperature of the primary cooling water in the spiral tube of the heat exchanger was higher than the temperature of the secondary cooling water and the casing, the temperature difference between the casing and the secondary cooling water was small, and the heat exchanger had good heat exchange performance. At the same time, a total of six sampling lines for analysis were established along the axial range z = 0–0.65 m of the motor (see Figure 1), through the radial center position of the clearance water, the stator core tooth, the stator winding, the stator core yoke, the spiral tube water, the spiral groove water (see Figure 9c), and the basic characteristic curve of the temperature distribution along the axial direction is given in Figure 10.
It can be seen from Figure 10a that the temperature curve of the stator winding was low in the middle and high at both ends, and the lower end was higher than the upper end. The distribution characteristics of the stator winding temperature were the same as those previously studied [10]. The temperature curve of the stator core yoke gradually increased along the axial position and basically changed linearly. Because of its small heat source density, the temperature was low. The temperature curve of the stator core tooth increased non-linearly along the axial direction. The temperature of the lower end of the stator core tooth was higher than that of the upper end and its heat flux density was higher, so the temperature was higher. In addition to the upper and lower end positions, the temperature of the core lamination was lower than that of the stator winding, which absorbed the heat from the stator winding. The axial thermal conductivity of the laminated core was relatively small, and the axial temperature difference was small. The accurate temperature distribution of the stator core could also provide important basic data for the thermal stress calculation of the motor.
It can be seen from Figure 10b that the temperature curves of the clearance water, the spiral tube water, and the spiral groove water curves increased linearly along the axial direction. The temperature of the spiral tube water was the highest, followed by the clearance water, and the spiral groove water was the lowest. Therefore, the low temperature secondary cooling water in the spiral groove could absorb the heat of the high temperature primary cooling water in the spiral tube, and the heating rates of the secondary and primary cooling water were basically the same, which were higher than the heating rate of the clearance water.
Figure 11 presents the temperature contour of primary cooling water in the computational domain and some periodic boundary at the middle position using the SST k-ω model models. It can be seen from Figure 11a that the temperature of the primary cooling water gradually increased from top to bottom in the motor, while, on the contrary, the temperature gradually decreased in the spiral tube of the heat exchanger. The maximum temperature of primary cooling water was located on the coplanar cell of the local adjacent body at the lower annular ducts near the high temperature coolant below, the maximum simulated temperature was 91.8 °C.
Meanwhile, it can be seen from Figure 11b that the maximum temperature of the primary cooling water from the motor to the heat exchanger was 44.8 °C. Secondary cooling water in the spiral groove gradually flowed from the upper inlet section to the bottom, and the maximum temperature was at the bottom of the heat exchanger, the primary cooling water inlet position. The characteristics of the temperature distribution for the primary and secondary cooling water in the spiral tube and groove were consistent with those of the countercurrent heat exchanger in this project.

5. Conclusions

To ensure accurate thermal design of the shielding induction motor and obtain temperature characteristics, the four kinds of two equation turbulence models (namely the standard k-ε model, the RNG k-ε model, the standard k-ω, and the SST k-ω model) were adopted to predict the temperature field results of the shielding induction motor in CFD analyses, and the results were compared with experiments data. Some main conclusions can be obtained as below:
(1)
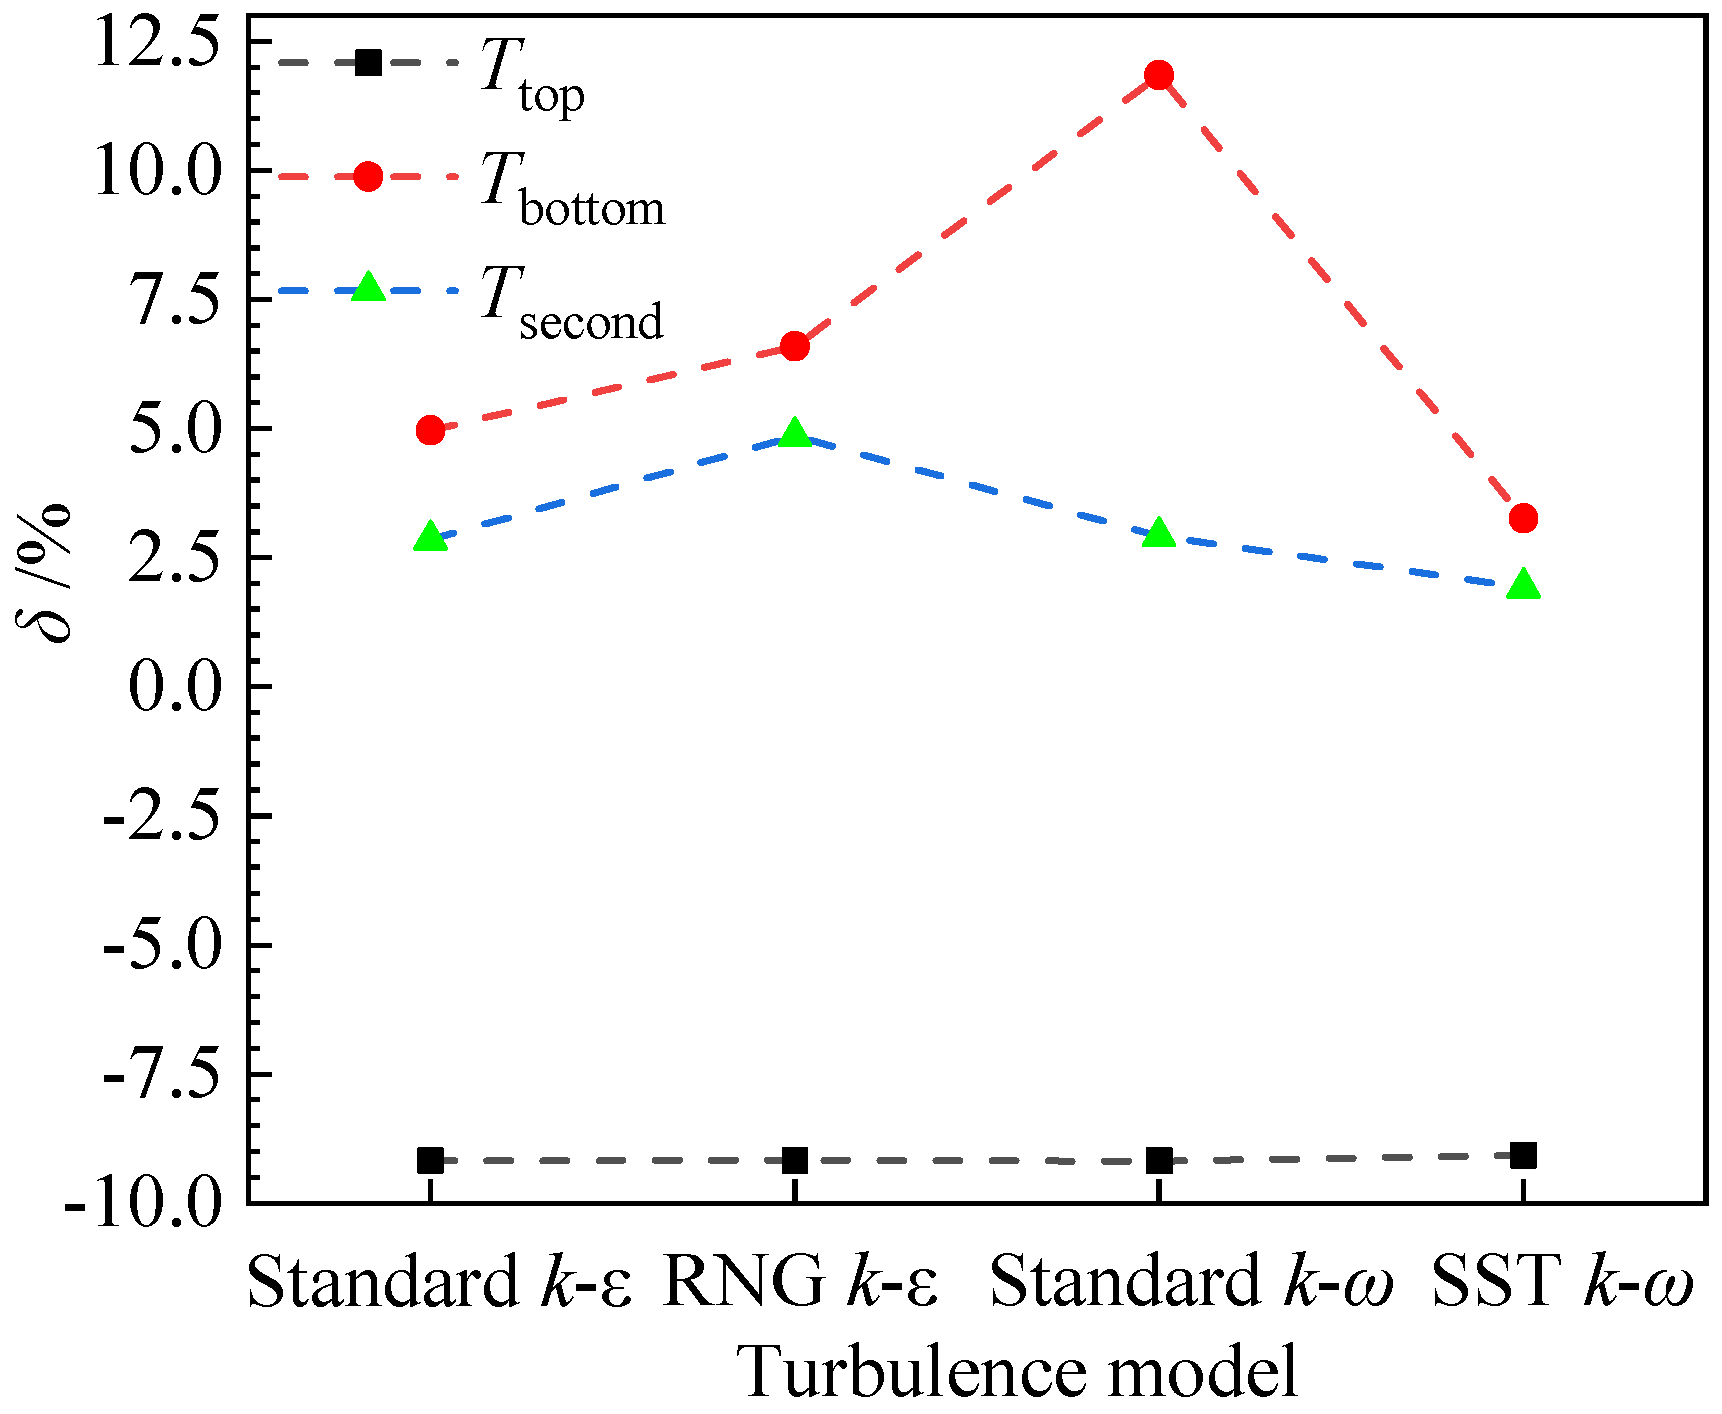
Changes in the four types of turbulence models had little effect on the temperature of the winding insulation. The maximum relative error was 1.16% and the minimum relative error provided by the SST k-ω model was 0.22%.
(2)
The selection of the turbulence model influenced the temperature of the lower guide bearing lubricating water and the temperature of the secondary cooling water outlet. The SST k-ω model showed the lowest relative error result of the temperature of the lower guide bearing lubricating water and the secondary cooling water outlet. The minimum relative error provided by the SST k-ω model was 3.26% and 1.92%, respectively. The SST k-ω model is more suitable for simulation of the temperature field of the shielded induction motor.
(3)
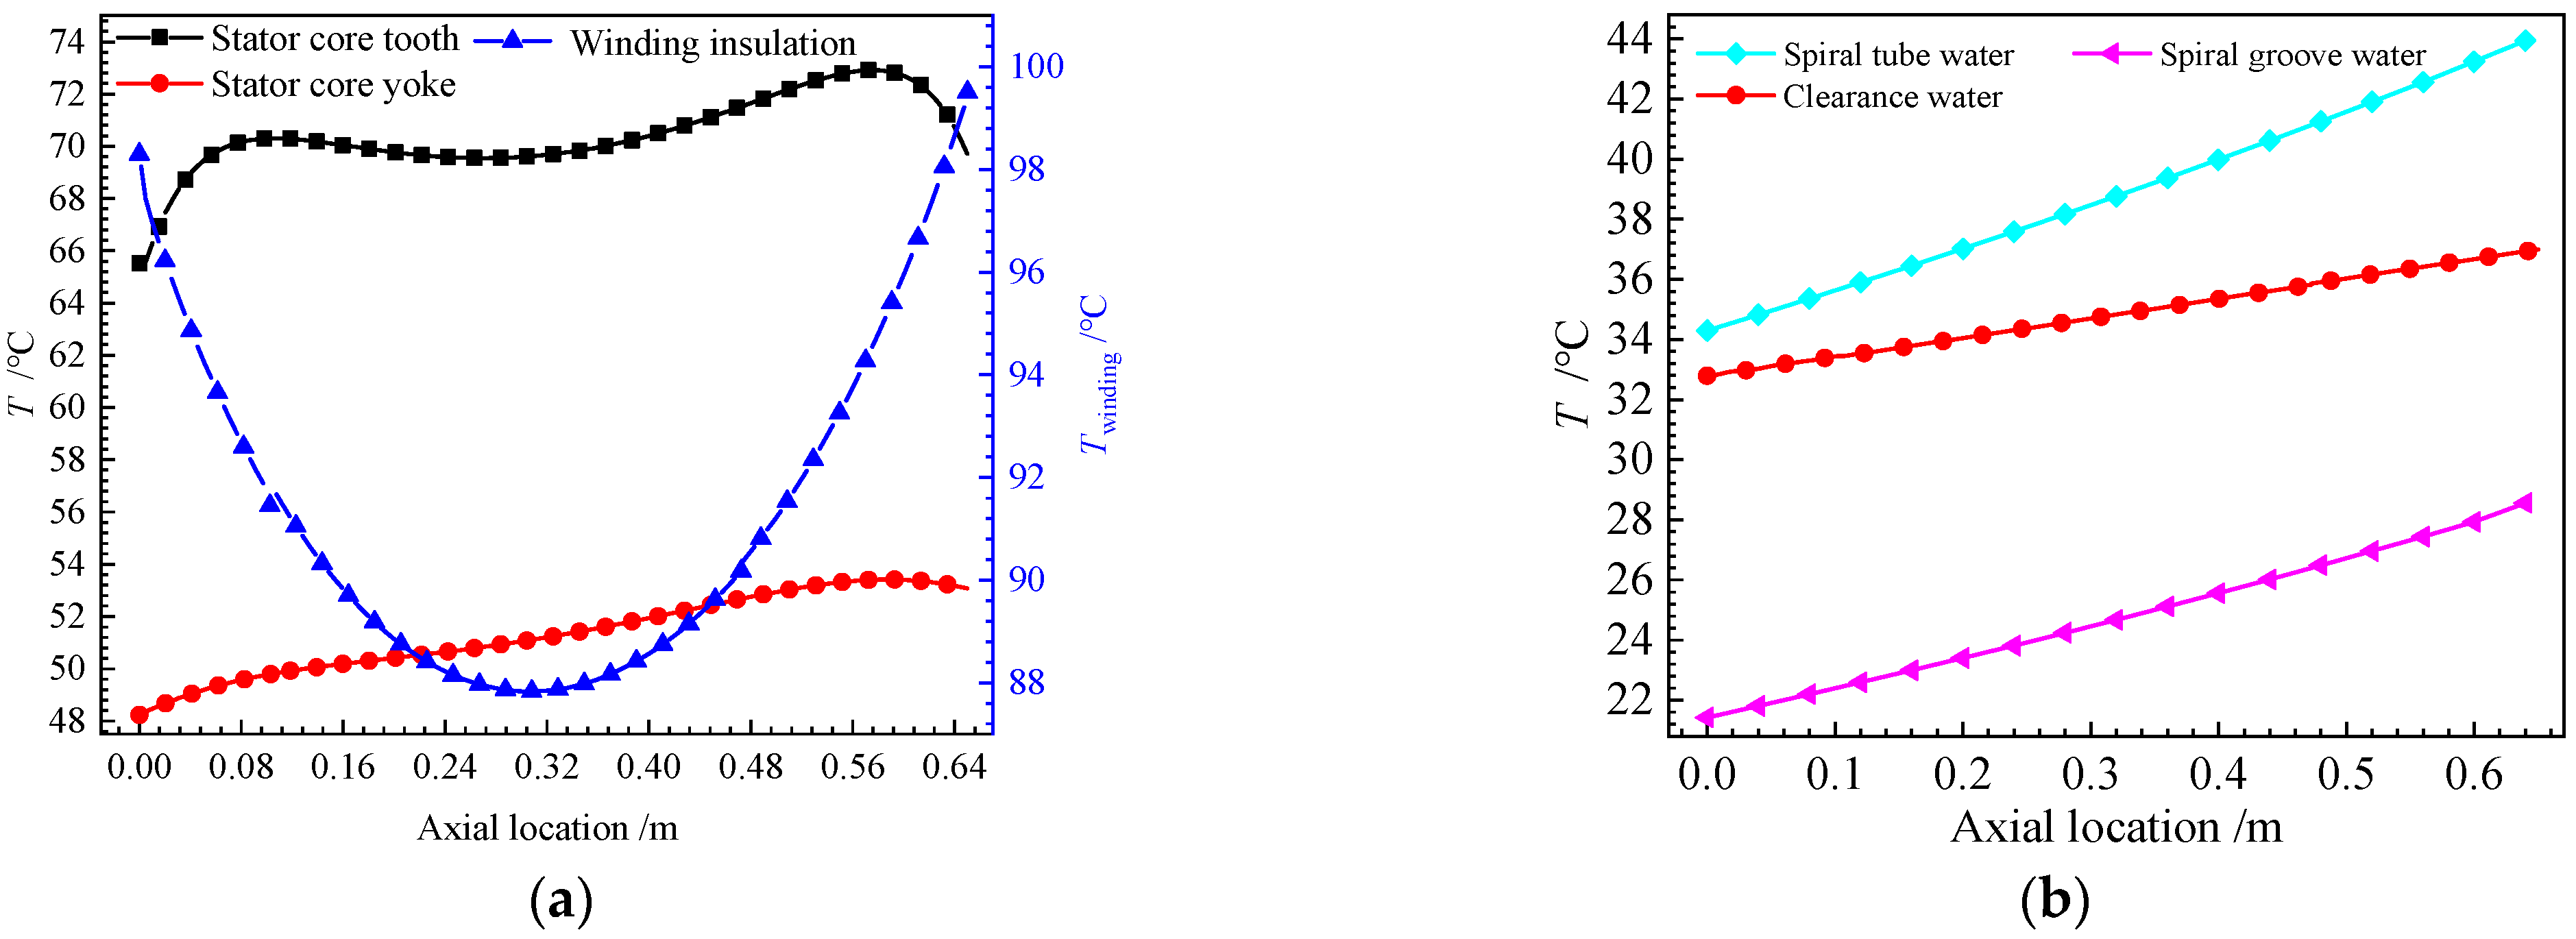
The temperature in the clearance water, the spiral tube water, the spiral groove water, and the stator core yoke increased approximately linearly along the axial direction in the position of the spiral heat exchanger and the stator core located. Accurate calculation and research of the temperature field will provide basic data for the thermal stress calculation of the shielding induction motor. This paper will lay the foundation for the efficient and stable operation of shielded induction motor.

Author Contributions

L.A. and Y.L. are the main authors of this manuscript. All the authors contributed to this manuscript. Y.L. and L.A. conceived the novel idea; L.A. and J.H. performed the analysis; L.A. analyzed the data and contributed analysis tools; W.S. provided experimental data; L.A. wrote the entire paper. Y.L. checked, reviewed and revised the paper. All authors have read and agreed to the published version of the manuscript.

Funding

This research was funded by the Heilongjiang Education Department special Project in Funda-mental Business, grant number 135509110.

Data Availability Statement

The measurement data presented in this study are not publicly available due to restrictions of privacy.

Conflicts of Interest

The authors declare no conflict of interest.

References

  1. Kim, C.; Lee, K. Numerical investigation of the air-gap flow heating phenomena in large-capacity induction motors. Int. J. Heat Mass Transf. 2017, 110, 746–752. [Google Scholar] [CrossRef]
  2. Janga, J.; Chiub, H.; Yanet, W.; Tsai, M.C.; Wang, P. Numerical study on electromagnetics and thermal cooling of a switched reluctance motor. Case Stud. Therm. Eng. 2015, 6, 16–27. [Google Scholar] [CrossRef] [Green Version]
  3. Bonnett, A.H. Operating temperature considerations and performance characteristics for IEEE 841 motors. In Proceedings of the Industry Applications Society Forty-Seventh Annual Conference 2002, Houston, TX, USA, 13 September 2002; pp. 1120–1131. [Google Scholar]
  4. Yoon, M.K.; Jeon, C.S.; Kauh, S.K. Efficiency increase of an induction motor by improving cooling performance. IEEE Trans. Energy Convers. 2002, 17, 1–6. [Google Scholar] [CrossRef] [PubMed]
  5. Rehman, Z.; Seong, K. Three-D Numerical Thermal Analysis of Electric Motor with Cooling Jacket. Energies 2018, 11, 95. [Google Scholar] [CrossRef] [Green Version]
  6. Gundabattini, E.; Mystkowski, A.; Idzkowski, A. Thermal Mapping of a High-Speed Electric Motor Used for Traction Applications and Analysis of Various Cooling Methods—A Review. Energies 2021, 14, 1472. [Google Scholar] [CrossRef]
  7. Boglietti, A.; Mandrile, F.; Carpaneto, E.; Popescu, M.; Staton, D. Stator Winding Second-Order Thermal Model including End-Winding Thermal Effects. Energies 2021, 14, 6578. [Google Scholar] [CrossRef]
  8. Wang, D.; Liang, Y.; Li, C.; Yang, P.; Zhou, C.; Gao, L. Thermal equivalent network method for calculating stator temperature of a shielding induction motor. Int. J. Therm. Sci. 2020, 147, 106–149. [Google Scholar] [CrossRef]
  9. Ding, S.; Meng, F.; Ge, Y. Temperature field investigation of canned primary pump motors in nuclear power stations. Proc. CSEE 2012, 32, 149–155. [Google Scholar]
  10. Lu, Y.; Mustafa, A.; Rehan, M.A.; Razzaq, S.; Ali, S.; Shahid, M.; Adnan, A.W. The effects of water friction loss calculation on the thermal field of the canned motor. Processes 2019, 7, 256. [Google Scholar] [CrossRef] [Green Version]
  11. Lu, Y.; Ai, L.; Han, J.; Wang, B.; Suo, W. Sensitivity Investigation of Uncertainty Factors to Temperature Rise of Nuclear Main Pump Motor for Small Reactor. Proc. CSEE 2022, 1–10. [Google Scholar]
  12. Xie, Z.; Song, P.; Hao, L.; Shen, N.; Zhu, W.; Liu, H.; Shi, J.; Wang, Y.; Tian, W. Investigation on effects of Fluid-Structure-Interaction (FSI) on the lubrication performances of water lubricated bearing in primary circuit loop system of nuclear power plant. Ann. Nucl. Energy 2020, 141, 107355. [Google Scholar] [CrossRef]
  13. Xu, R.; Song, Y.; Gu, X.; Wang, Y.; Wang, D. Research on the flywheel clearance flow in canned motor RCP. Ann. Nucl. Energy 2021, 150, 107816. [Google Scholar] [CrossRef]
  14. Wang, Y.J.; Wang, D.Z.; Guo, W.Z.; Yin, J.L.; Hu, Y.Y. The effect of smaller turbulent motions on heat transfer in the annular gap flow of flywheel. Ann. Nucl. Energy 2016, 91, 1–7. [Google Scholar] [CrossRef] [Green Version]
  15. Xu, R.; Song, Y.; Gu, X.; Linb, B.; Wang, D. Research on the clearance flow between stator and rotor cans in canned motor RCP. Ann. Nucl. Energy 2021, 164, 108583. [Google Scholar] [CrossRef]
  16. Howey, D.A.; Childs, P.R.N.; Holmes, A.S. Air-Gap Convection in Rotating Electrical Machines. IEEE Trans. Ind. Electron. 2012, 59, 1367–1375. [Google Scholar] [CrossRef]
  17. Luo, G.; Yao, Z. Decoupling tests on axial heat-transfer in highly turbulent Taylor-Couette flow using thermal waves. Exp. Therm. Fluid Sci. 2021, 128, 110439. [Google Scholar] [CrossRef]
  18. Leng, X.Y.; Krasnov, D.; Li, B.W.; Zhong, J.Q. Flow structures and heat transport in Taylor–Couette systems with axial temperature gradient. J. Fluid Mech. 2021, 920, A42. [Google Scholar] [CrossRef]
  19. Staton, D.A.; Cavagnino, A. Convection Heat Transfer and Flow Calculations Suitable for Electric Machines Thermal Models. IEEE Trans. Ind. Electron. 2008, 55, 3509–3516. [Google Scholar] [CrossRef] [Green Version]
  20. Sun, P.; Lu, Y.; Tong, J.; Lu, Y.; Liang, T.; Zhu, L. Study on the Convective Heat Transfer and Fluid Flow of Mini-Channel with High Aspect Ratio of Neutron Production Target. Energies 2021, 14, 4020. [Google Scholar] [CrossRef]
  21. Lu, Y.; Ge, Y.; Wang, H.; Wang, F. Verification and analysis on turbulence model of flow field simulation for multiple ventilation stator ducts of air- cooled turbo generators. Electr. Mach. Control. 2018, 22, 63–69. [Google Scholar]
  22. Kim, C.; Lee, K.; Yook, S. Effect of air-gap fans on cooling of windings in a large-capacity, high-speed induction motor. Appl. Therm. Eng. 2016, 100, 658–667. [Google Scholar] [CrossRef]
  23. Khang, H.V.; Arkkio, A. Eddy-current loss modeling for a form-wound induction motor using circuit model. IEEE Trans. Magn. 2012, 48, 1059–1062. [Google Scholar] [CrossRef]
  24. Simpson, N.; Wrobel, R.; Mellor, P.H. An accurate mesh-based equivalent circuit approach to thermal modeling. IEEE Trans. Magn. 2014, 50, 269–272. [Google Scholar] [CrossRef]
  25. Bazgir, A.; Nikou, M.K.; Heydari, A. Numerical CFD analysis and experimental investigation of the geometric performance parameter influences on the counter-flow Ranque-Hilsch vortex tube (C-RHVT) by using optimized turbulence model. Heat Mass Transf. 2019, 55, 2559–2591. [Google Scholar] [CrossRef]
  26. Gao, L.; Wang, D.; Liang, Y.; Wang, C. Evaluation of can eddy current losses and can circulating current losses between the can and end structures in double canned induction motors. IET Electr. Power Appl. 2019, 13, 635–642. [Google Scholar] [CrossRef]
Figure 1. Geometrical model of the solution region. (a) Model of shielding induction motor. (b) Waterway schematic.
Energies 16 02792 g001
Figure 2. Schematic diagram of the periodic connection of spiral tubes on the left and right sides.
Energies 16 02792 g002
Figure 3. Experimental equipment and locations of the test point. (a) Test rig on the second floor. (b) Top primary cooling water test points wiring. (c) Bottom primary cooling water test points annular duct. (d) Test loop on the first floor.
Energies 16 02792 g003
Figure 4. Schematic diagram of the motor test rig.
Energies 16 02792 g004
Figure 5. Extracted fragments from experimental data.
Energies 16 02792 g005
Figure 6. Temperature error bar curve of the test points.
Energies 16 02792 g006
Figure 7. Relative error of the peak temperature of the stator winding insulation with four turbulence models.
Energies 16 02792 g007
Figure 8. Relative error of primary and secondary cooling water temperatures with four turbulence models.
Energies 16 02792 g008
Figure 9. Temperature contour of the shielding induction motor. (a) A quarter of the motor. (b) Casing. (c) Sampling line position and temperature contour of cross section at z = 0.32 m.
Energies 16 02792 g009
Figure 10. Temperature distribution on the sampling lines. (a) Solid components. (b) Primary and secondary cooling water.
Energies 16 02792 g010
Figure 11. Temperature contour of the water. (a) Primary cooling water. (b) Primary and secondary cooling water on both sides of the periodic boundary.
Energies 16 02792 g011
Table 1. Main parameters of the small capacity shielding induction motor.
Parameters (Unit)Value
Rated current (A)78.3
Rated rotational speed (r/min)2923
Rated frequency (Hz)50
Number of stator slots30
Number of rotor slots22
Number of poles2
Stator core length (mm)660
Water clearance thickness (mm)2
Table 2. Details of four types of turbulence models.
Types of ModelsValue
Standard k-ε ( ρ k u i ) x i = x j [ ( μ + μ t σ k ) k x j ] + G k + G b ρ ε Y M + S k
( ρ ε u i ) x i = x j [ ( μ + μ t σ ε ) ε x j ] + G 1 ε ε k ( G k + C 3 ε G b ) C 2 ε ρ ε 2 k + S ε
RNG k-ε ( ρ k u i ) x i = x j ( α k μ e f f k x j ) + G k + G b ρ ε Y M + S K
( ρ ε u i ) x i = x j ( α ε μ e f f ε x j ) + C 1 ε ε k ( G k + C 3 ε G b ) C 2 ε ρ ε 2 k R ε + S ε
standard k-ω x i ( ρ k u i ) = x j ( Γ k k x j ) + G K Y K + S K
x i ( ρ ω u i ) = x j ( Γ ω ω x j ) + G ω Y ω + S ω
SST k-ω x i ( ρ k u i ) = x j ( Γ k k x j ) + G K Y K + S K
x i ( ρ ω u i ) = x j ( Γ ω ω x j ) + G ω Y ω + D ω + S ω
Table 3. Values of electric losses and thermal conductivity of main components of the motor.
ComponentsElectric Losses (kW)Thermal Conductivity(W/m·k)
Stator shield29.27λ = 0.015T + 9.697
Rotor shield8.308up ↑
Rotor copper bar10.32λ = 0.14T + 115.16
Rotor core0.49λradial, tangent = 23.6, λaxial = 3.2
Stator core0.9082up ↑
Stator winding6.17λ = 400.99 − 0.08T
Rotor end ring0.454up ↑
Insulation0.18
The mean of ‘up ↑’ is the same as the above data.
Disclaimer/Publisher’s Note: The statements, opinions and data contained in all publications are solely those of the individual author(s) and contributor(s) and not of MDPI and/or the editor(s). MDPI and/or the editor(s) disclaim responsibility for any injury to people or property resulting from any ideas, methods, instructions or products referred to in the content.

