Article

Enhancing the Energy Efficiency of Wastewater Treatment Plants through the Optimization of the Aeration Systems

by
Giuseppe Campo
*,
Antonella Miggiano
,
Deborah Panepinto
* and
Mariachiara Zanetti
Department of Environment, Land and Infrastructure Engineering (DIATI), Politecnico di Torino, Corso Duca degli Abruzzi 24, 10129 Torino, Italy
*
Authors to whom correspondence should be addressed.
Energies 2023, 16(6), 2819; https://doi.org/10.3390/en16062819
Submission received: 7 February 2023 / Revised: 13 March 2023 / Accepted: 15 March 2023 / Published: 17 March 2023
(This article belongs to the Special Issue Challenges of Transition to a Net-Zero Emissions Energy System)

Abstract

:
The current geopolitical landscape of the European Union has made it clear that the energy sector must be a top priority in EU policy, especially in light of the sudden escalation of Russian–Ukrainian conflicts. Energy efficiency has been used as the first tool of EU policy to tackle energy and climate crises, given the issues surrounding energy vulnerability and the need to limit gas emissions that contribute to climate change. The white certificate mechanism in Italy has played a pivotal role in encouraging measures to achieve the country’s energy-saving goals. Given the high energy requirements of Wastewater Treatment Plants (WWTPs), especially for aeration in the biological section, this paper examines the replacement of the air distribution system for a large WWTP as a viable intervention. In order to provide economic perspective for the plant, both the discounted Payback Period (dPBP) and the Net Present Value (NPV) were calculated for the investment. When viewed through an economic lens, the dPBP metric exhibits values that span from less than 1 year to nearly 4.5 years. Additionally, the investment’s cost-effectiveness was emphasized by the NPV, which, depending on the factors considered, can exceed 17.5 million euros. Finally, given the centrality of the theme of climate change, the avoided greenhouse gas emissions generated by the efficiency intervention were calculated, according to the GHG Protocol, resulting in a quantity of avoided emissions equivalent to over 57,770 tonnes of CO2e. These results highlight important achievements in terms of both the cost-effectiveness of the plant and the reduction of greenhouse gas emissions.

1. Introduction

Since 2013, all 27 EU member states have been net energy importers, and in 2020, 58.3% of the total energy required in the EU was imported [1]. Furthermore, considering the gross available energy in EU and its source, 24.4% of the total energy is related to imports from Russia. The current geopolitical scenario highlights the need for action to reduce the reliance of member nations on energy, and energy efficiency is the most readily available tool to rapidly achieve results.
In May 2022, the European Commission unveiled the REPowerUE Plan to address the issues and interruptions in the global energy market resulting from Russia’s invasion of Ukraine [2]. The significance of energy conservation, and therefore efficiency, is further highlighted in this design. Saving energy is seen as “the cheapest, safest, and cleanest approach to lessen our dependence on imports of fossil fuels from Russia” [3]. With an anticipated primary energy usage of 750 Mtoe and a final energy consumption of 980 Mtoe by 2030, the revised energy efficiency target increased from 9% to 13%.
Wastewater treatment (WWT), which eliminates biological and chemical impurities from water, has become crucial in the fight to safeguard the environment and the general population. In order to comply with the discharge restrictions stipulated by the law, which have grown more stringent every year, WWTPs (Wastewater Treatment Facilities) have developed and adopted new technologies over the past few years [4].
Meeting water quality standards has always been the primary focus of the WWT sector in order to maintain public trust [4]. Consequently, without taking into account significant energy considerations, WWTPs are typically created to satisfy specific effluent criteria [5,6].
The Wastewater treatment facilities consume a lot of energy. There are 22,558 WWTPs installed in Europe, and they utilize 15,021 GWh annually [7], which is more than 1% of the total electricity consumed in the EU [8]. Additionally, the cost of energy accounts for 15% to 40% of the total operating expenses [9].
The operational expenses of a traditional WWTP can be attributed to energy consumption to the extent of around 25–40%, according to the literature and management experience [9,10,11,12]. This value fluctuates between 0.3 and 2.1 kW h/m3 of treated wastewater [13].
Aeration in biological treatments (normally 50–70% of energy consumption in a standard WWT plant), primary and secondary settling with sludge pumping (14%), and solids dewatering (usually 7%) are key contributors [9].
Given this scenario, it is essential to consider the importance of introducing measures that optimize processes in WWTPs in terms of energy efficiency as a key issue. This is particularly relevant considering EU energy dependency and the need to minimize greenhouse gas emissions [13,14,15].
The improvement of energy efficiency in WWT is a subject that receives a lot of attention from scientists. In particular, Descoins et al. [16,17] noted that implicit energy components had received very little attention, whereas wastewater modeling experts had previously concentrated on modeling effluent characteristics. Furthermore, Holenda et al. [17] concentrated on aeration, whereas Fikar et al. [18] examined energy efficiency optimization with reference to various activated sludge processes. Studies on the economic and environmental sustainability of various types of WWT plants that carry out biological processes have been conducted in Spain, Portugal, Norway, and Australia [19,20], among other countries [19]. Some researchers [13,20,21,22] underlined the potential of wastewater as an energy carrier from the perspectives of both chemical and thermal energy recovery when looking at energy efficiency in WWT from a broader perspective. For instance, Moli-nos-Senante et al. [23] explored ways to boost the amount of energy produced by wastewater treatment facilities and the production of substitute natural gas (Bio-SNG) from the biogas created during the anaerobic digestion process. Cano et al. [24] examined energy optimization for wastewater treatment plants that adopt multiple sludge pre-treatment methods before the anaerobic digestion process. Recent studies [24,25,26] have examined the energy consumption and greenhouse gas (GHG) emissions of various sewage sludge treatment system scenarios, emphasizing the efficiency of using biogas to meet the energy requirements of WWT processes in lowering GHG emissions. According to the Easter Research Group Inc., there are 554 WWT factories in the USA that are developing CHP facilities [27]. The installation of CHP units for facilities performing anaerobic sludge digestion with inflows exceeding 18,500 m3/d was one of the key findings of the study.
In other articles [27,28,29,30,31,32], energetic elements related to chemical manufacturing, external energy production, and indirect energy usage were taken into account, resulting in an overall assessment of the technology’s significance in terms of life cycle analyses [33,34,35].
The proposed paper examines the potential energy savings that can be achieved by replacing diffusers in the biological treatment section of an established, large-scale WWTP. This intervention was designed to enhance the plant’s energy efficiency and represents the primary focus of the study. The evaluation of the avoided costs and GHG gases are discussed. The economic and environmental returns from the implementation are evaluated in order to appreciate how an energy efficiency intervention can positively affect the footprint of WWTPs. These evaluations were conducted using the results obtained with and without consideration of the White Certificate mechanism. This mechanism, adopted by Italian legislation (D.M. 21 May 2021) in order to boost energy efficiency interventions, could enhance the willingness to consider WWT in the energy efficiency framework. Different interventions in the integrated water service may utilize this mechanism. The results obtained are reported considering biological treatment that works with two different types of configurations: intermittent aeration and step-feed aeration.

2. Materials and Methods

2.1. White Certificates in the Integrated Water Service

As presented, the White Certificates serve as tools for pushing energy efficiency interventions in different sectors. The main actors involved in the mechanism are obliged and eligible parties who can obtain Energy Efficiency Obligations (EEO), GSE (Gestore Servizi Energetici), and GME (Gestore Mercati Energetici), which are responsible for emitting, controlling, and regulating the market of obligations and authorities that control and improve guidelines and regulations in this context. Figure 1 shows the actors involved in the White Certificate mechanism.
Although the mechanism has undergone complex historical development over time, it has ultimately yielded significant results that cannot be ignored. This incentive system for energy efficiency has been successfully used since 2005. Between 2005 and 2017, the program produced more than 26 million tons of total energy savings, accounting for 62% of the industry’s energy reductions, and more than 6 million tons of CO2 emissions were avoided. In the integrated water service, different implementation methods allow for participation in the scheme. This paper considers the replacement of diffusers in the aeration system of the secondary treatment part of a WWTP. According to the guidelines, the lifetime of the intervention (i.e., the time for which the obligations are matured) is 5 years. The RISP (energy savings) is calculated according to the guidelines, using algorithm number four, as provided by GSE [36]:
RISP = 1 SAE baseline 1 SAE ex   post × kgO 2 × f e
where:
  • RISP is the energy saved in EEO;
  • KgO2 is the quantity of oxygen present in the volume of the air processed by the production system of compressed air in the ex-post situation, and is equal to the amount of air in Sm3 multiplied by 0.285 KgO2/Sm3;
  • fe is the conversion factor (equal to 0.000187 toe/kWh) when withdrawing electricity from the grid;
  • SAEbaseline is the aeration efficiency, which is referred to as the baseline solution. It is equal to the ratio between KgO2 and the energy consumed for the production of compressed air in KgO2/kWh;
  • SAEex post is the aeration efficiency in operational conditions, referred to as the ex-post situation, measured in KgO2/kWh.

2.2. WWTP Configuration and Calculation of Energy Saving

The biological section of the existing large WWTP that was analyzed is composed of four moduli. Moduli 1, 2, and 3 work with intermittent aeration, whereas modulus 4 uses step-feed aeration. A diffuser density (DD) of 7% was used, with 59,000 diffusers evenly distributed. The Transferred Oxygen, OTR (Oxygen Transfer Rate), and the type of diffusers were assumed to remain constant in baseline and ex-post configurations. Climatic data for Turin, Italy were used, and the mean monthly temperature was considered in the calculations. The mean temperatures used are reported in Figure 2.
The site altitude for the WWTP was assumed equal to 304 m.
The airflow in the baseline configuration was considered based on the project hypothesis, and the SOTR (Standard Oxygen Transfer Efficiency) was calculated using Equation (2) (considering a Qdiff baseline of 6.5 Nm3/h). The resulting SOTR was equal to 0.44 kgO2/h per diffuser.
SOTR baseline = SOTE · kgO 2 m 3 · Q diff   baseline  
where SOTE is the Standard Oxygen Transfer Efficiency.
Then, the Oxygen Transfer Rate at site conditions was calculated using an F value taken from the literature, which was equal to 0.73.
OTR f = SOTR τ β ω C 20 * C C 20 * θ T 20 α F
where:
  • C is the average dissolved oxygen concentration within the process water volume, measured in mg/L;
  • OTRf is the field oxygen transfer rate estimated for the system operating under process conditions at an average dissolved oxygen concentration (C) and temperature (T), measured in kg O2/h;
  • SOTR is the oxygen transfer rate under standard conditions (20 °C, 1 atm, C = 0 mg/L), measured in kg O2/h;
  • T is the field temperature;
  • C*st is the dissolved oxygen surface saturation concentration at the operating temperature, measured in mg/L;
  • C*s20 is the dissolved oxygen surface saturation concentration at a standard temperature (20 °C), measured in mg/L;
  • τ is the temperature correction factor = C*st/C*s20;
  • β is the relative DO saturation to clean water, expressed as C*wastewater/C*tap water;
  • Pb is the barometric pressure at the test site (kPa);
  • Ps is the standard barometric pressure (101.325 kPa);
  • ω is the pressure correction factor, expressed as Pb/Ps;
  • de is the mid-depth correction factor (0.40);
  • Df is the depth of diffusers in the basins, measured in m;
  • C*∞,20 is the saturated dissolved oxygen value at sea level and the standard temperature (20 °C) for diffused aeration, measured in mg/L. It is higher than Cst as it is affected by the oxygen transfer from bubbles under pressure in the water column. The value of C∞,20 can be estimated using the following equation:
C * , 20 = C * s , 20 × 1 + d e D f P s
  • θ is the empirical temperature correction factor (1.024);
  • α is the relative oxygen transfer rate in process water versus clean water (KLaf,20(wastewater)/KLaf,20(tap water));
  • F is the fouling factor.
The transferred oxygen was calculated assuming an aeration system operating time of 9.8 h/d for moduli that use intermittent aeration and 24 h/d for the modulus that uses step-feed aeration.
Transferred   Oxygen = OTR f · n   of   diffusers
The dry air that must be compressed was then estimated, as well as the power needed by the turbochargers to inject air into the biological basin.
P w = wRT 1 29.7   n   e × p 2 p 1 n 1
Where:
  • Pw is the power requirement by blowers (kW);
  • w is the weight of air flowrate (kg/s);
  • R is the universal gas constant, R = 8.314 (J/mole K);
  • T1 is the air absolute inlet temperature (K);
  • p1 is the air absolute inlet pressure (atm);
  • p2 is the air absolute outlet pressure (atm);
  • n is (k − 1)/k, where k is the specific heat ratio, K = 1.395;
  • 28.97 is the molecular weight of dry air;
  • e is the efficiency of the blowers.
Finally, the consumed energy was calculated.
The same calculations were performed for the ex-post situation, where the OTR was held constant and the SOTR was recalculated using an F value taken from the literature, which was equal to 1.
Starting from the transferred oxygen and energy consumed over the years, the SAE (Standard Aeration Efficiency) can be estimated in both situations:
SAE =   Transferred   Oxygen Energy used   for   air   compression  
After the calculations, the energy savings could be retrieved, and the following evaluations were performed.
Considering the economic benefit from the investment, the discounted Payback Period (dPBP) was calculated together with the Net Present Value (NPV). In this calculation, the avoided costs of energy were considered as revenue, whereas the investment and the maintenance were considered as costs. The lifespan of the project was assumed to be equal to 25 years.
t = 1 PBP F At F 0 = 0
NPV = t = 1 lifetime   project F At F 0
where:
  • F 0   is   the   cost   of   the   investment   ;
  • F At = F t 1 + k t = discounted   cashflow ;
  • F t   is   the   cashflow   given   by   the   revenue   minus   the   annual   costs   ;
  • k   is   the   discount   rate   % ;
  • t   is   the   umpteenth   year   between   zero   and   the   lifetime   of   the   project .
For the calculation of the avoided emissions, the GHG protocol was used, specifically referring to Scope 2 and using a location-based emission factor for Italy, which was equal to 0.2583 kgCO2e/kWh [37]. This approach was used in order to maintain a generic approach.
Avoided   Emission GHG ,   i = Emission   Factor     · Δ   kWh i  
Figure 3 shows the scheme of the implemented work and serves as a guide for operations that are useful for ensuring repeatability of the work.

3. Results and Discussion

3.1. Wastewater Treatment Plant Studies

The plant that was analyzed was a large wastewater treatment plant in Italy. The wastewater treatment plant manages a large metropolitan area (which covers about 450 km2 and 2.2 M inhabitants) and operates on about 615,000 m3/d of municipal and industrial wastewater, corresponding to a potential organic load equivalent to 2.7 M inhabitants.
The water line uses four parallel process lines (or moduli) in order to perform primary, secondary, and tertiary treatments (chemical for phosphorous removal and biological for nitrogen removal). The reclaimed water is primarily discharged into the nearby river, but is also partially reused for industrial or agricultural purposes through a 5 km industrial network.
The capacity of the sludge line is equivalent to roughly 6000 m3/d (2% d.s.). Sludge goes through pre-thickening, post-thickening, and mechanical/thermal drying after anaerobic digestion.

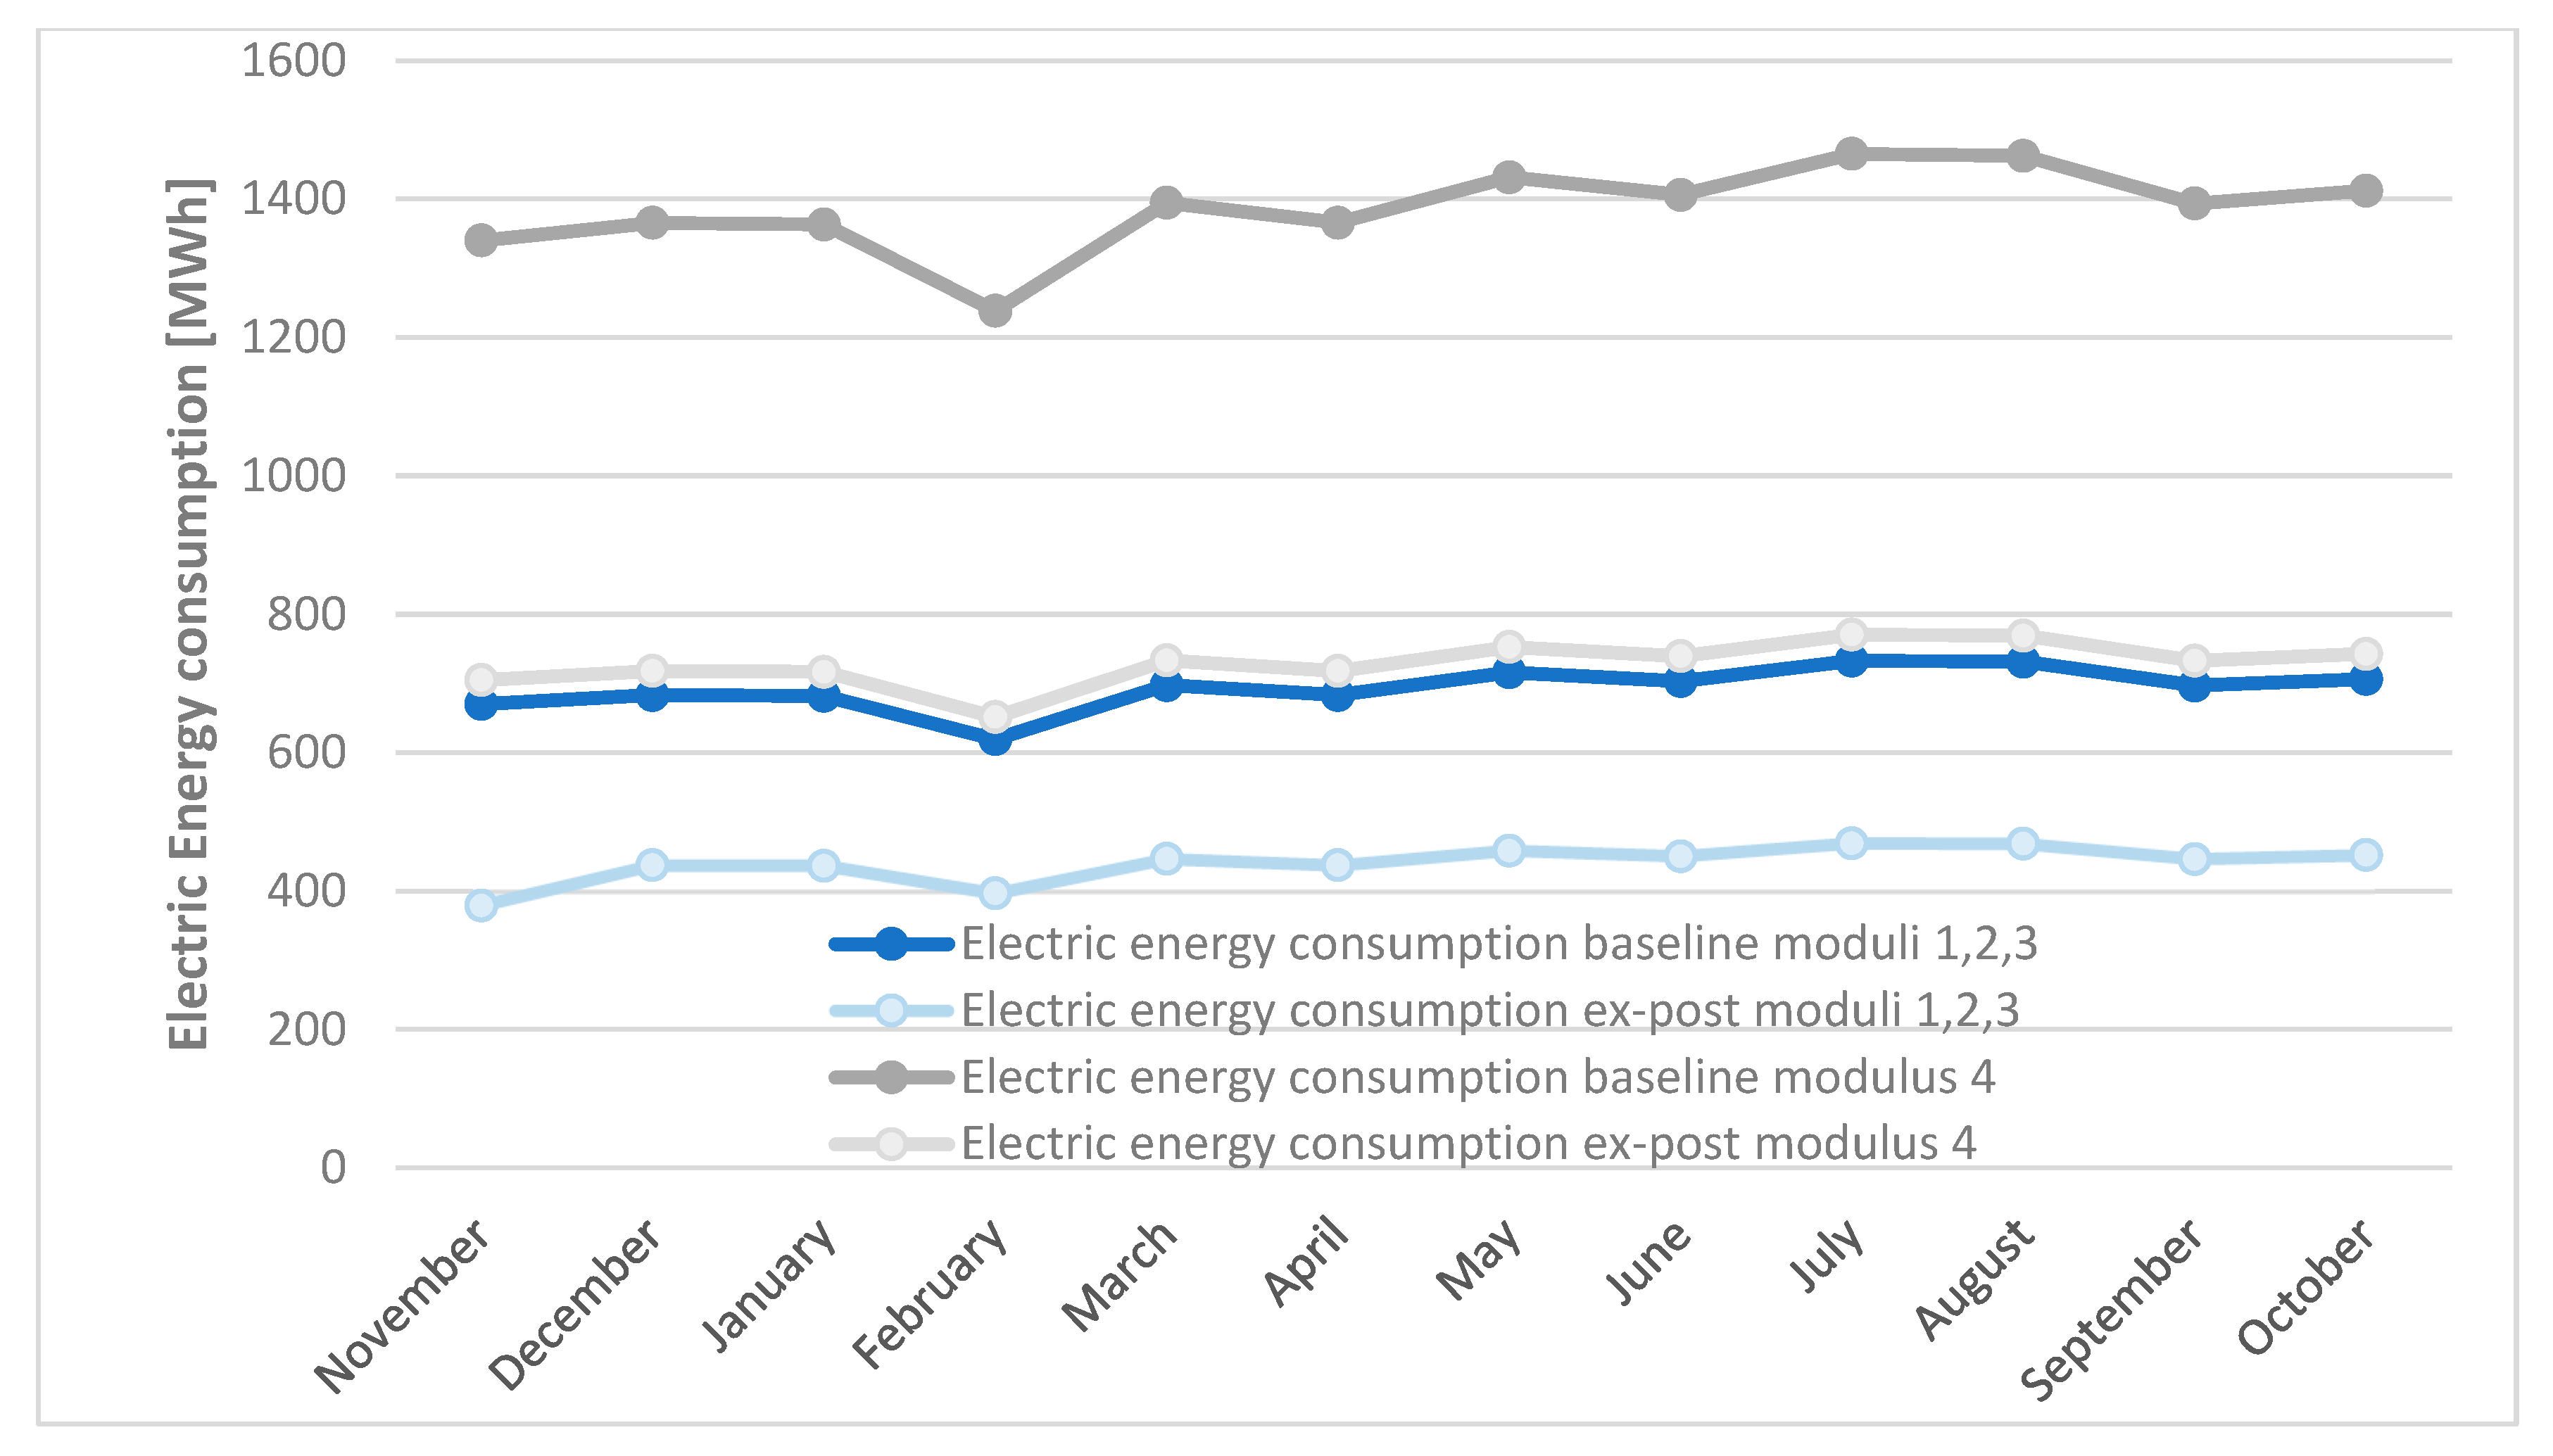
3.2. Power Requirement and Energy Consumption in Baseline and Ex-Post Configuration and Energy Savings Calculations

Varying temperatures, the power requirement, and energy consumption were calculated for the situation before and after substitution of the diffusers.
Moduli 1, 2, and 3 were considered together, whereas modulus 4 was analyzed separately in the presented results. Figure 4 shows the power requirements for the moduli.
Table 1 shows the results obtained for the power requirement in the ex-post and baseline configurations for the different moduli.
Considering the energy demand, Figure 5 shows the electric energy consumption for the moduli.
Table 2 shows the results obtained for the electric energy consumption over the course of a year in the baseline and ex-post configurations for moduli 1, 2, 3, and 4.
It can already be appreciated from the obtained results that energy consumption was strongly reduced by the intervention.
Once the required quantities were obtained, the SAE could be calculated, considering the Transferred Oxygen and the energy consumed.
For moduli 1, 2, and 3, the SAEbaseline was equal to 2.86 kgO2/kWh, and the SAEex post was equal to 4.51 kgO2/kWh.
The RISP obtained was calculated as previously described in the Materials and Methods section, and was calculated to be 557.3 Energy Efficiency Obligations (EEO)/year.
For modulus 4, the SAEbaseline was equal to 1.17 kgO2/kWh, and the SAEex post was equal to 2.22 kgO2/kWh.
The obtained energy saving for this modulus was 1443.7 Energy Efficiency Obligations (EEO)/year.
In total, jointly considering moduli 1, 2, 3, and 4, the obtained energy that was not consumed was equal to 2001 Energy Efficiency Obligations (EEO)/year.
Based on these findings, and after observing the SAE of the different moduli, it is evident that intermittent aeration requires less energy expenditure than step-feed aeration, while still achieving equivalent results in terms of treatment. Moreover, in addition to the cost savings realized across the entire plant, intermittent aeration offers additional benefits.
In conclusion, it can be asserted that the total energy savings achieved are substantial, emphasizing the importance of this intervention with respect to the operating costs of the plant.

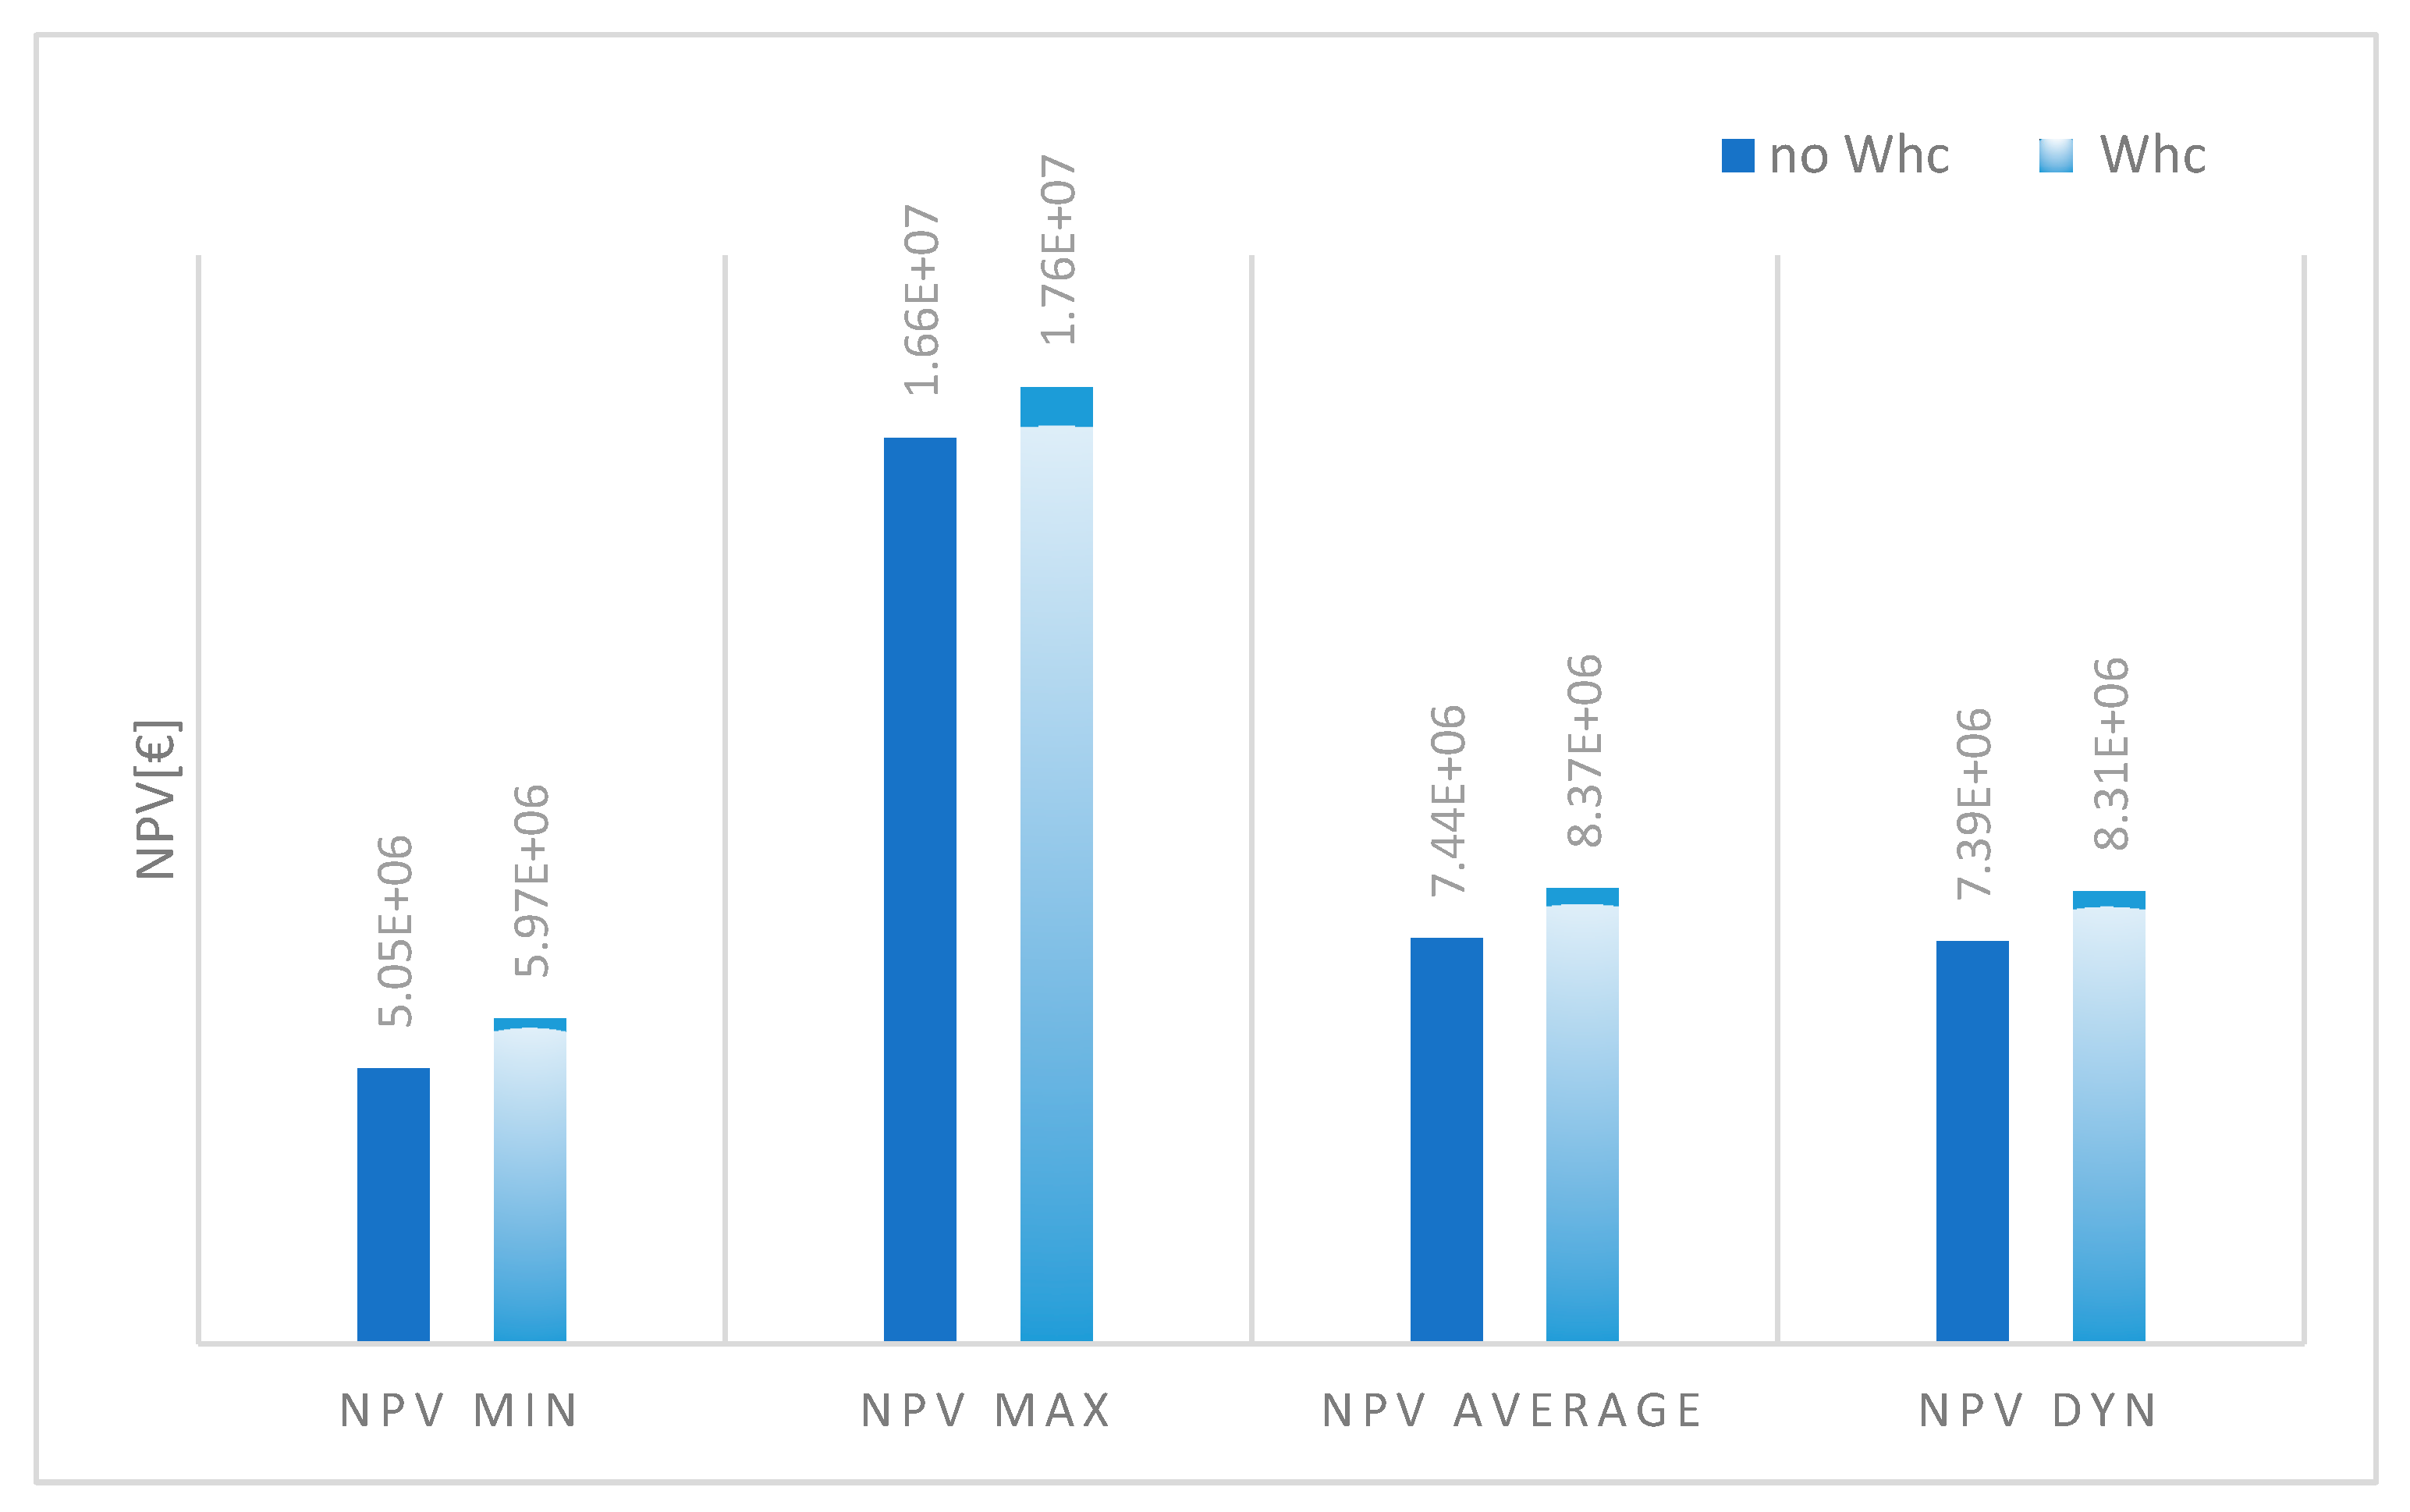
3.3. Economical Evaluation of the Investment from the Company Side

In order to assess the economic feasibility of the investment, the return on investment was evaluated.
Table 3 reports the initial cost of the intervention used for this evaluation.
The annual maintenance cost was estimated to be 6% [38,39] of the supply and installation cost of the system.
The revenues come from energy savings, which were considered avoided costs. The lifespan of the project was assumed to equal 25 years. Cleaning of the diffusers will be planned after 12 years of operation. It is assumed that there will be a decrease in savings until the energy consumption reaches 75% of the baseline before cleaning is performed in order to bring the energy consumption to the ex-post situation. The obtained results are presented in Figure 6.
Based on the available Eurostat data and historical trends from 2008 to 2022, the cost of energy was analyzed using minimum, maximum, mean, and dynamic electricity costs, varying as observed in the period between 2008 and 2022 (Figure 7).
Table 4 shows the energy costs considered in the present study.
The other revenues come from participation in the WhC mechanism, with income from each certificate equal to 260 €/Energy Efficiency Obligations (EEO).
Once the flow, dPBP, and NPV were defined, they were used in the calculations with and without participation in the WhC mechanism. The results are reported in Figure 8.
As shown in Figure 9, the dPBP was quite low for the investment, underlining the return in a very short time of the investment, which was enhanced by participation in the White Certificates mechanism.
As can be appreciated, in all the cases, the energy efficiency intervention leads to good results in terms of economic benefit for the company, with a dPBP that is higher than 3 years considering non-participation in the incentive mechanism with a minimum and dynamic cost of electric energy. Across the various examined cases, the dPBP metric ranged from 0.9 to 4.4 years.
The Net Present Value (NPV) varies from roughly 5 million to 7.4 million euros when only accounting for the avoided costs associated with energy savings. However, when factoring in participation in the incentive scheme, the NPV ranges from almost 6 million to over 17.5 million euros.

3.4. GHG Emissions Avoided with the Intervention

In order to evaluate the real convenience of the investment from an environmental viewpoint, reductions in greenhouse gas emissions were evaluated. In fact, the reduction of GHG emissions represents another key aspect that is related to energy efficiency interventions. The calculations, in this particular context, were performed using the GHG Protocol, specifically referring to Scope 2.
As reported in Figure 10, considering the total tCO2 equivalent over the lifespan of the intervention, the calculated avoided emissions were equal to 57,672 tCO2e.
An equivalent measure of the CO2 absorbed by trees was computed in order to better understand the project’s contribution to reducing GHG emissions.
In order to offset the same amount of CO2, 88,727 trees are required, assuming that an average tree absorbs 25 kgCO2/year. Given that 0.2 trees may be grown on a square meter of land, the investigated energy efficiency intervention equates to reforesting a 44.4 ha area. This areal extension is equal to 62 football fields.

4. Conclusions

This intervention to improve the energy efficiency of a large WWTP brings different benefits. From the company’s perspective, implementing an intervention of this type leads to important avoided costs, particularly given the actual cost of electric energy and considering the EU’s energy vulnerability. The participation in incentive mechanisms, such as White Certificates in this paper, makes this type of intervention even more attractive. However, it is clear that the largest revenue stream comes from energy savings.
Furthermore, the related economic gain is coupled with a reduction in GHG emissions, which is not negligible in the current context of heightened climate change awareness.
According to the European Environmental Agency (EEA), the energy supply sector accounted for the majority of Italy’s GHG emissions in 2021, with 87,788 ktCO2e.
Energy efficiency must be viewed as a tool for reducing the impact of this sector on Italy’s GHG inventory, given its significant contribution.
Given the achieved results impacting these two key aspects, a rethinking of wastewater treatment from an energy efficiency perspective could lead to significant improvements and contributions to decarbonization and the attainment of energy savings.
Based on the results presented in this paper, from an economic standpoint, it can be seen that there is a very low discounted payback period for the investment, ranging from a minimum of 0.9 to a maximum of 4.4 years, depending on the costs of electricity and the investor’s participation in incentives. The NPV varies from a minimum of approximately 5 million to a maximum of approximately 17.5 million.
Considering the environmental advantages, it can be appreciated that over 57,700 tons of CO2e emissions can be prevented, which is the same as the amount absorbed by nearly 90,000 planted trees.
It is important that future studies address the general optimization of global WWTPs within the context of a circular economy, including the recovery of materials (e.g., struvite) and the optimization of energy recovery from anaerobic digestion (AD) systems, including electric and thermal or biomethane production. Continuous monitoring of GHG emissions is also important.

Author Contributions

Conceptualization, G.C., A.M., D.P. and M.Z.; methodology, G.C., A.M., D.P. and M.Z.; software, G.C., A.M., D.P. and M.Z.; validation, G.C., A.M., D.P. and M.Z.; formal analysis, G.C., A.M., D.P. and M.Z.; investigation, G.C., A.M., D.P. and M.Z.; resources, G.C., A.M., D.P. and M.Z.; data curation, G.C., A.M., D.P. and M.Z.; writing—original draft preparation, G.C., A.M., D.P. and M.Z.; writing—review and editing, G.C., A.M., D.P. and M.Z.; visualization, G.C., A.M., D.P. and M.Z.; supervision, G.C., A.M., D.P. and M.Z.; project administration, G.C., A.M., D.P. and M.Z.; funding acquisition, G.C., A.M., D.P. and M.Z. All authors have read and agreed to the published version of the manuscript.

Funding

This research received no external funding.

Conflicts of Interest

The authors declare no conflict of interest.

References

  1. EUROSTAT. EU Energy Mix and Import Dependency [Internet]. 2022. Available online: https://ec.europa.eu/eurostat/statistics-explained/index.php?title=EU_energy_mix_and_import_dependency (accessed on 29 September 2022).
  2. REPowerEU: Affordable, Secure and Sustainable Energy for Europe [Internet]. European Commission—European Commission. Available online: https://ec.europa.eu/info/strategy/priorities-2019-2024/european-green-deal/repowereu-affordable-secure-and-sustainable-energy-europe_en (accessed on 29 September 2022).
  3. Factsheet on Energy Savings [Internet]. European Commission—European Commission. Available online: https://ec.europa.eu/commission/presscorner/detail/en/fs_22_3137 (accessed on 29 September 2022).
  4. European Commission. Best Available Techniques (BAT) Reference Document on Wastewater Treatment Facilities. 2016. Available online: chrome-extension://efaidnbmnnnibpcajpcglclefindmkaj/https://eippcb.jrc.ec.europa.eu/sites/default/files/2019-11/CWW_Bref_2016_published.pdf (accessed on 7 March 2023).
  5. Focus on Energy. Water and Wastewater Energy Best Practice Guidebook; Prepared for Wisconsin Department of Administration by the Focus on Energy Program; Focus on Energy: Madison, WI, USA, 2006. [Google Scholar]
  6. Ahmetovic, E.; Ibric, N.; Kravanja, Z. Optimal design for heat-integrated waterusing and wastewater treatment networks. Appl. Energy 2014, 135, 791–808. [Google Scholar] [CrossRef]
  7. ENERWATER. Standard Method and Online Tool for Assessing and Improving the Energy Efficiency of Wastewater Treatment Plants|ENERWATER Project|Fact Sheet|H2020 [Internet]. CORDIS|European Commission. Available online: https://cordis.europa.eu/project/id/649819 (accessed on 5 October 2022).
  8. Borzooei, S.; Amerlinck, Y.; Panepinto, D.; Abolfathi, S.; Nopens, I.; Scibilia, G.; Meucci, L.; Zanetti, M.C. Energy optimization of a wastewater treatment plant based on energy audit data: Small investment with high return. Environ. Sci. Pollut. Res. 2020, 27, 17972–17985. [Google Scholar] [CrossRef]
  9. Metcalf & Eddy Inc. Wastewater Engineering: Treatment and Resource Recovery, 5th ed.; McGraw-Hill Professional: New York, NY, USA, 2013. [Google Scholar]
  10. Rojas, J.; Zhelev, T. Energy efficiency optimisation of wastewater treatment: Study of ATAD. Comput. Chem. Eng. 2012, 38, 52–63. [Google Scholar] [CrossRef]
  11. Descoins, N.; Deleris, S.; Lestienne, R.; Trouvé, E.; Maréchal, F. Energy efficiency in waste water treatments plants: Optimization of activated sludge process coupled with anaerobic digestion. Energy 2012, 41, 153–164. [Google Scholar] [CrossRef]
  12. Metcalf and Eddy Inc. Wastewater Engineering: Treatment and Reuse, 4th ed.; McGraw-Hill: New York, NY, USA, 2006. [Google Scholar]
  13. Elías-Maxil, J.; van der Hoek, J.P.; Hofman, J.; Rietveld, L. Energy in the urban water cycle: Actions to reduce the total expenditure of fossil fuels with emphasis on heat reclamation from urban water. Renew. Sustain. Energy Rev. 2014, 30, 808–820. [Google Scholar] [CrossRef] [Green Version]
  14. Nakkasunchi, S.; Hewitt, N.J.; Zoppi, C.; Brandoni, C. A review of energy optimization modelling tools for the decarbonisation of wastewater treatment plants. J. Clean. Prod. 2021, 279, 123811. [Google Scholar] [CrossRef]
  15. Chen, Y.; Zhang, H.; Yin, Y.; Zeng, F.; Cui, Z. Smart energy savings for aeration control in wastewater treatment. Energy Rep. 2022, 8, 1711–1721. [Google Scholar] [CrossRef]
  16. Venkatesh, G.; Brattebø, H. Energy consumption, costs and environmental impacts for urban water cycle services: Case study of Oslo (Norway). Energy 2011, 36, 792–800. [Google Scholar] [CrossRef]
  17. Liu, H.; Ramnarayanan, R.; Logan, B.E. Production of electricity during waste-water treatment using a single chamber microbial fuel cell. Environ. Sci. Technol. 2004, 38, 2281–2285. [Google Scholar] [CrossRef]
  18. Descoins, N.; Stephane, D.; Remi, L.; Marechal, F. Energetic efficiency in Waste Water Treatments Plants: Optimization of activated sludge process coupled with anaerobic digestion. In Proceedings of the 23rd International Conference on Efficiency, Cost, Optimization, Simulation and Environmental Impact of Energy Systems, Lausanne, Switzerland, 14–17 June 2010; pp. 1062–1069. [Google Scholar]
  19. Holenda, B.; Domokos, E.; Redey, A.; Fazakas, J. Aeration optimization of a wastewater treatment plant using genetic algorithm. Optim. Control. Appl. Methods 2007, 28, 191–208. [Google Scholar] [CrossRef]
  20. Fikar, M.; Chachuat, B.; Latifi, M.A. Optimal operation of alternating activated sludge processes. Control. Eng. Pr. 2005, 13, 853–861. [Google Scholar] [CrossRef] [Green Version]
  21. Lemos, D.; Dias, A.C.; Gabarrell, X.; Arroja, L. Environmental assessment of an urban water system. J. Clean. Prod. 2013, 54, 157–165. [Google Scholar] [CrossRef]
  22. Lundie, S.; Peters, G.M.; Beavis, P.C. Life Cycle Assessment for Sustainable Metropolitan Water Systems Planning. Environ. Sci. Technol. 2004, 38, 3465–3473. [Google Scholar] [CrossRef] [Green Version]
  23. Funamizu, N.; Iida, M.; Sakakura, Y.; Takakuwa, T. Reuse of heat energy in wastewater: Implementation examples in Japan. Water Sci. Technol. 2001, 43, 277–285. [Google Scholar] [CrossRef]
  24. Frijns, J.; Hofman, J.; Nederlof, M. The potential of (waste)water as energy carrier. Energy Convers. Manag. 2013, 65, 357–363. [Google Scholar] [CrossRef]
  25. Molinos-Senante, M.; Hanley, N.; Sala-Garrido, R. Measuring the CO2 shadow price for wastewater treatment: A directional distance function approach. Appl. Energy 2015, 144, 241–249. [Google Scholar] [CrossRef]
  26. Cano, R.; Pérez-Elvira, S.; Fdz-Polanco, F. Energy feasibility study of sludge pretreatments: A review. Appl. Energy 2015, 149, 176–185. [Google Scholar] [CrossRef]
  27. Soda, S.; Iwai, Y.; Sei, K.; Shimod, Y.; Ike, M. Model analysis of energy consumption and greenhouse gas emissions of sewage sludge treatment systems with different processes and scales. Water Sci. Technol. 2010, 61, 365–373. [Google Scholar] [CrossRef]
  28. Venkatesh, G.; Elmi, R.A. Economic–environmental analysis of handling biogas from sewage sludge digesters in WWTPs (wastewater treatment plants) for energy recovery: Case study of Bekkelaget WWTP in Oslo (Norway). Energy 2013, 58, 220–235. [Google Scholar] [CrossRef]
  29. Eastern Research Group, Inc. & Energy and Environmental Analysis Inc. Opportunities for and Benefits of Combined Heat and Power at Wastewater Treatment Facilities. Prepared for the United States Environmental Protection Agency. 2007. Available online: www.epa.gov/chp (accessed on 2 November 2015).
  30. Bidart, C.; Fröhling, M.; Schultmann, F. Electricity and substitute natural gas generation from the conversion of wastewater treatment plant sludge. Appl. Energy 2014, 113, 404–413. [Google Scholar] [CrossRef]
  31. Dixon, A.; Simon, M.; Burkitt, T. Assessing the environmental impact of two options for small-scale wastewater treatment: Comparing a reedbed and an aerated biological filter using a life cycle approach. Ecol. Eng. 2003, 20, 297–308. [Google Scholar] [CrossRef]
  32. Ko, J.Y.; Day, J.W.; Lane, R.R.; Day, J.N. A comparative evaluation of money-based and energy-based cost-benefit analyses of tertiary municipal wastewater treatment using forested wetlands vs. sand filtration in Louisiana. Ecol. Econ. 2004, 49, 331–347. [Google Scholar] [CrossRef]
  33. Panepinto, D.; Fiore, S.; Zappone, M.; Genon, G.; Meucci, L. Evaluation of the energy efficiency of a large wastewater treatment plant in Italy. Appl. Energy 2016, 161, 404–411. [Google Scholar] [CrossRef]
  34. Borzooei, S.; Campo, G.; Cerutti, A.; Meucci, L.; Panepinto, D.; Ravina, M.; Riggio, V.A.; Ruffino, B.; Scibilia, G.; Zanetti, M. Feasibility analysis for reduction of carbon footprint in a wastewater treatment plant. J. Clean. Prod. 2020, 271, 122526. [Google Scholar] [CrossRef]
  35. Ruffino, B.; Campo, G.; Genon, G.; Lorenzi, E.; Novarino, D.; Scibilia, G.; Zanetti, M. Improvement of anaerobic digestion of sewage sludge in a wastewater treatment plant by means of mechanical and thermal pre-treatments: Performance, energy and economical assessment. Bioresour. Technol. 2015, 175, 298–308. [Google Scholar] [CrossRef]
  36. GSE. Guida Operativa Certificati Bianchi; GSE: Rome, Italy, 1 January 2022. Available online: https://www.isprambiente.gov.it/files2022/pubblicazioni/rapporti/r363-2022.pdf (accessed on 1 January 2023).
  37. ISPRA. Indicatori di Efficienza e Decarbonizzazione del Sistema Energetico Nazionale e del Settore Elettrico; Report No.: 363; ISPRA: Rome, Italy, 2021. [Google Scholar]
  38. Sanaye, S.; Yazdani, M. Energy, exergy, economic and environmental analysis of a running integrated anaerobic digester-combined heat and power system in a municipal wastewater treatment plant. Energy Rep. 2022, 8, 9724–9741. [Google Scholar] [CrossRef]
  39. Arnd Wendland. Operation Cost of Wastewater Treatment Plant; Arnd Wendland: Ahrensburg, Germany, 2005. [Google Scholar]
Figure 1. Actors involved in the White Certificate mechanism.
Energies 16 02819 g001
Figure 2. The temperatures used for the calculations from different months of the year, including temperatures from climatic data, temperatures in the basin, and ilet temperatures at turbochargers.
Energies 16 02819 g002
Figure 3. Guide for operations.
Energies 16 02819 g003
Figure 4. Power requirement for moduli 1, 2, 3, and 4.
Energies 16 02819 g004
Figure 5. Electric energy consumption for moduli 1, 2, 3, and 4.
Energies 16 02819 g005
Figure 6. Decrease in energy savings for the WWTP and the electricity consumed after the intervention over the lifespan of the project, considering planned cleaning after 12 years.
Energies 16 02819 g006
Figure 7. Historical series with electricity costs in Italy between 2008 and 2022. S1 = the first semester of the year (January to June) and S2 = the second semester of the year (July to December).
Energies 16 02819 g007
Figure 8. Discounted Payback Period (dPBP) calculated by varying the energy cost, where “no WhC” = no participation in the White Certificates mechanism, and “WhC” = participation in the White Certificates mechanism.
Energies 16 02819 g008
Figure 9. NPV calculation for 25 years, which was assumed as the lifespan of the project, where “no WhC” = no participation in the White Certificates mechanism, and “WhC” = participation in the White Certificates mechanism.
Energies 16 02819 g009
Figure 10. Avoided emissions over the lifespan of the project as tons of CO2 per year.
Energies 16 02819 g010
Table 1. Power requirements in ex-post and baseline configurations for the different moduli.
ModulusPower Requirement Baseline [kW]Power Requirement Ex-Post [kW]
1, 2, 327,916.717,699.2
422,789.211,984.1
Table 2. Electric energy consumption during a year in baseline and ex-post configurations for moduli 1, 2, 3, and 4.
ModulusElectric Energy Consumption Baseline [MWh]Electric Energy Consumption Ex-Post [MWh]
1, 2, 383235277
416,6398750
Table 3. Investment costs for the substitution of diffusers (market values).
OperationCosts [€]
Cleaning of the tanks702,172
Demolition of existing infrastructure and disposal of waste materials324,704
Supply and installation of air diffusion network2,857,395
Various completion works64,613
Safety charges (not subject to rebate) related to services15,919.24
Safety charges (not subject to rebate) related to the work23,878.86
Total3,988,683
Table 4. Costs of energy considered in the study.
Costs of Energy[€/kWh]
cmax0.249
caverage0.185
cmin0.156
cdynAs in the period from 2008–2022
Disclaimer/Publisher’s Note: The statements, opinions and data contained in all publications are solely those of the individual author(s) and contributor(s) and not of MDPI and/or the editor(s). MDPI and/or the editor(s) disclaim responsibility for any injury to people or property resulting from any ideas, methods, instructions or products referred to in the content.

