
Molecular Reconstruction Method Based on NIR Spectroscopy for Reformates

Abstract
:1. Introduction
2. Method
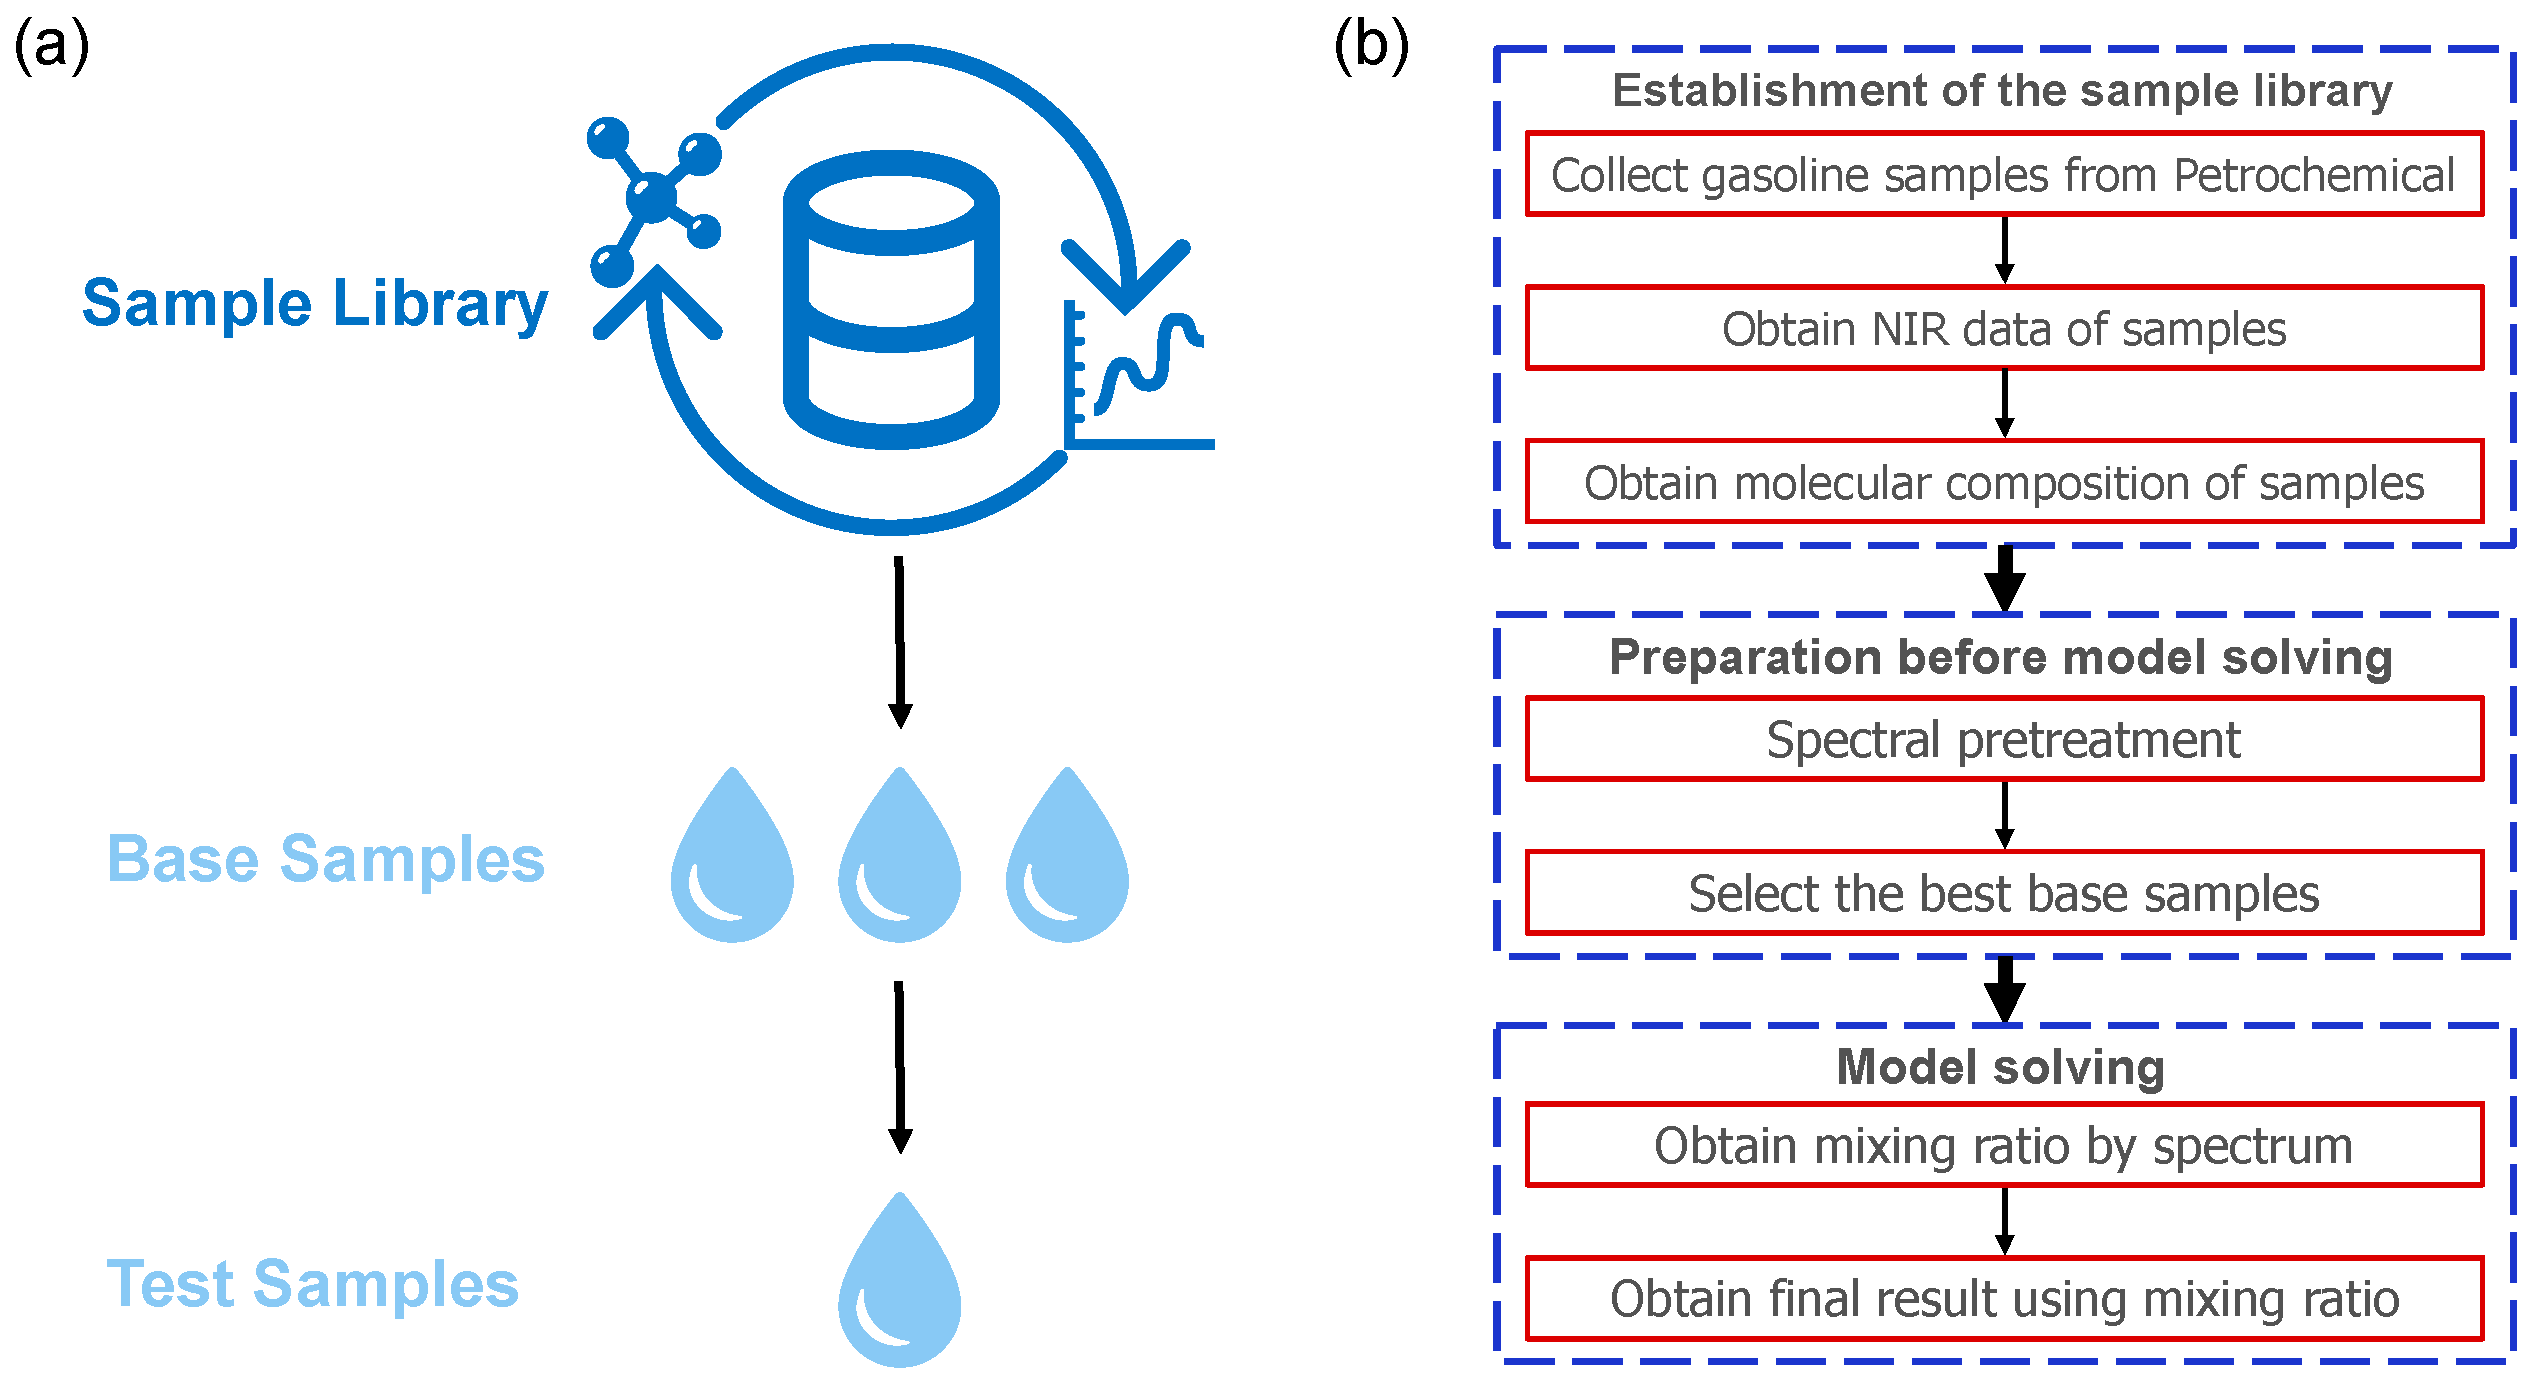
2.1. Fundamentals
2.2. Sample Library
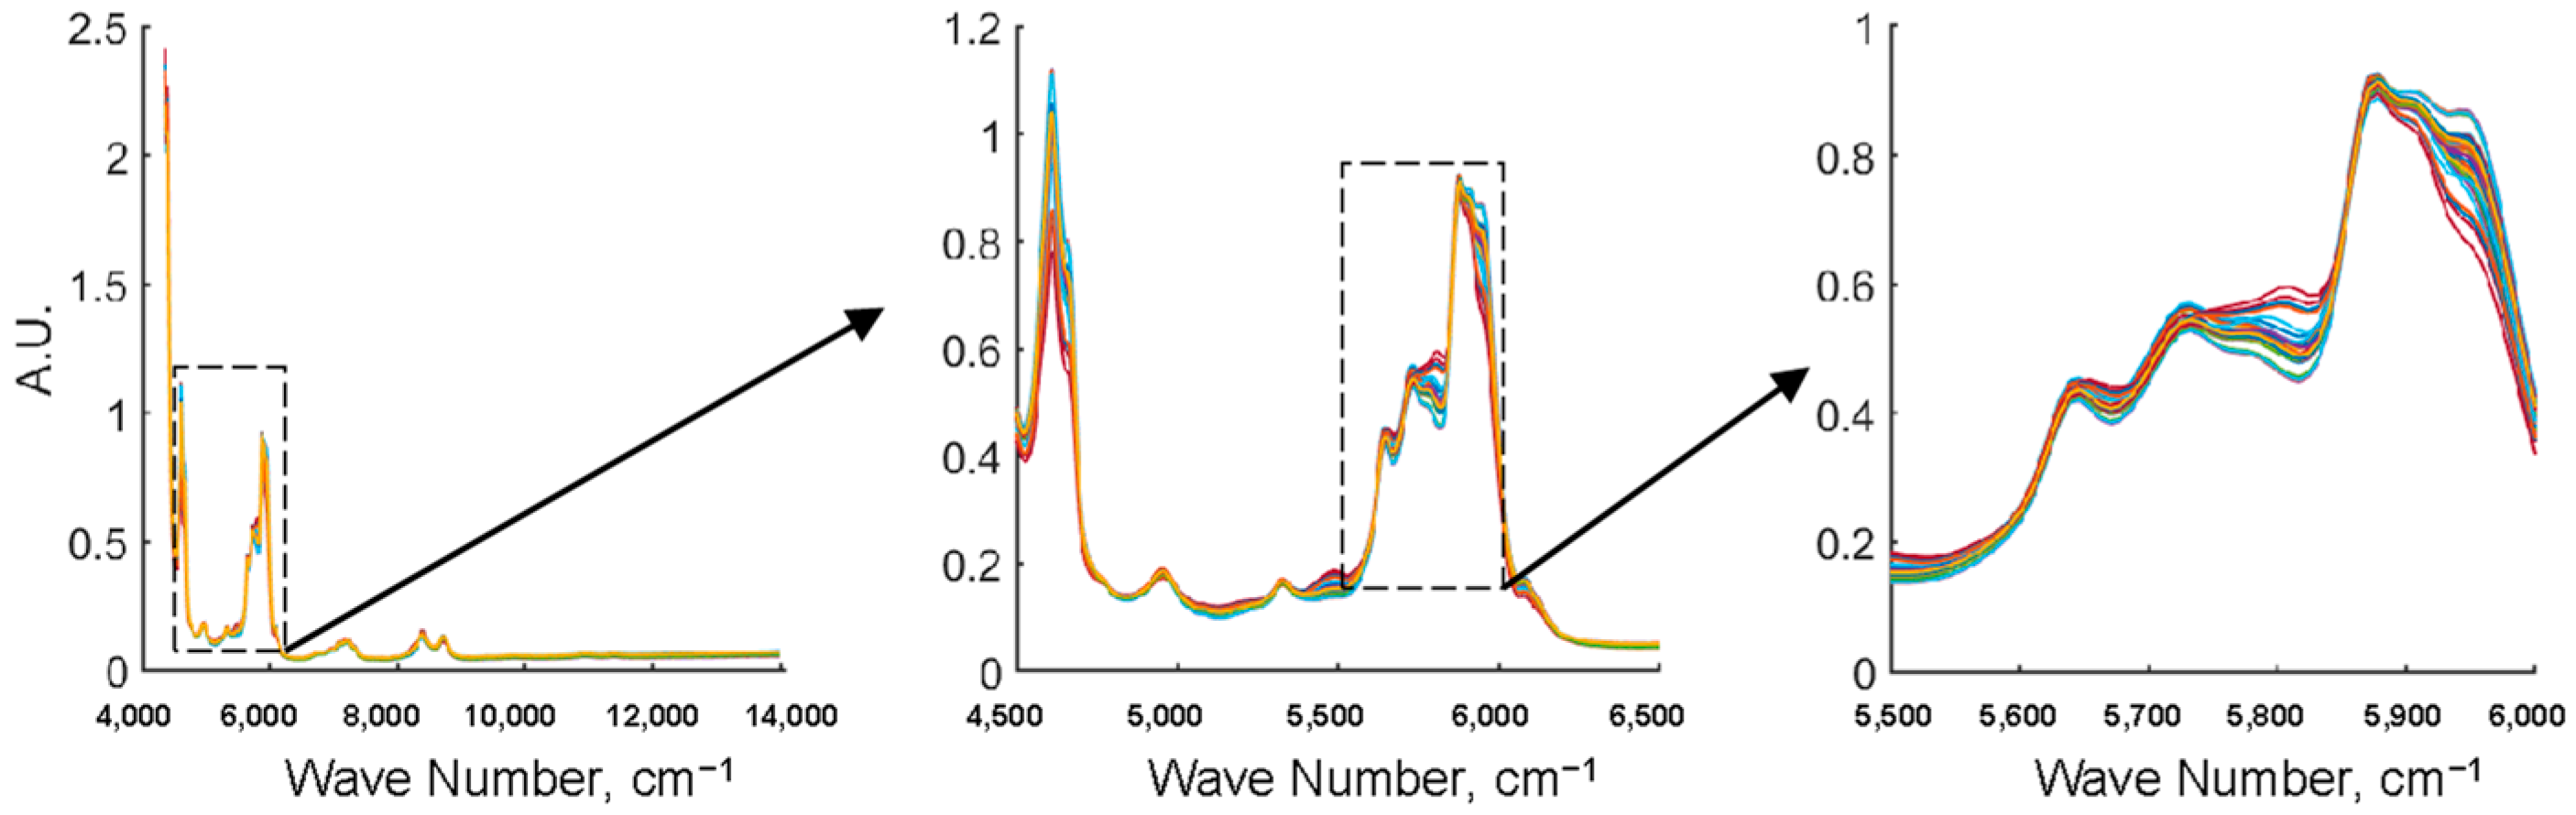
2.3. Preprocessing of Spectra
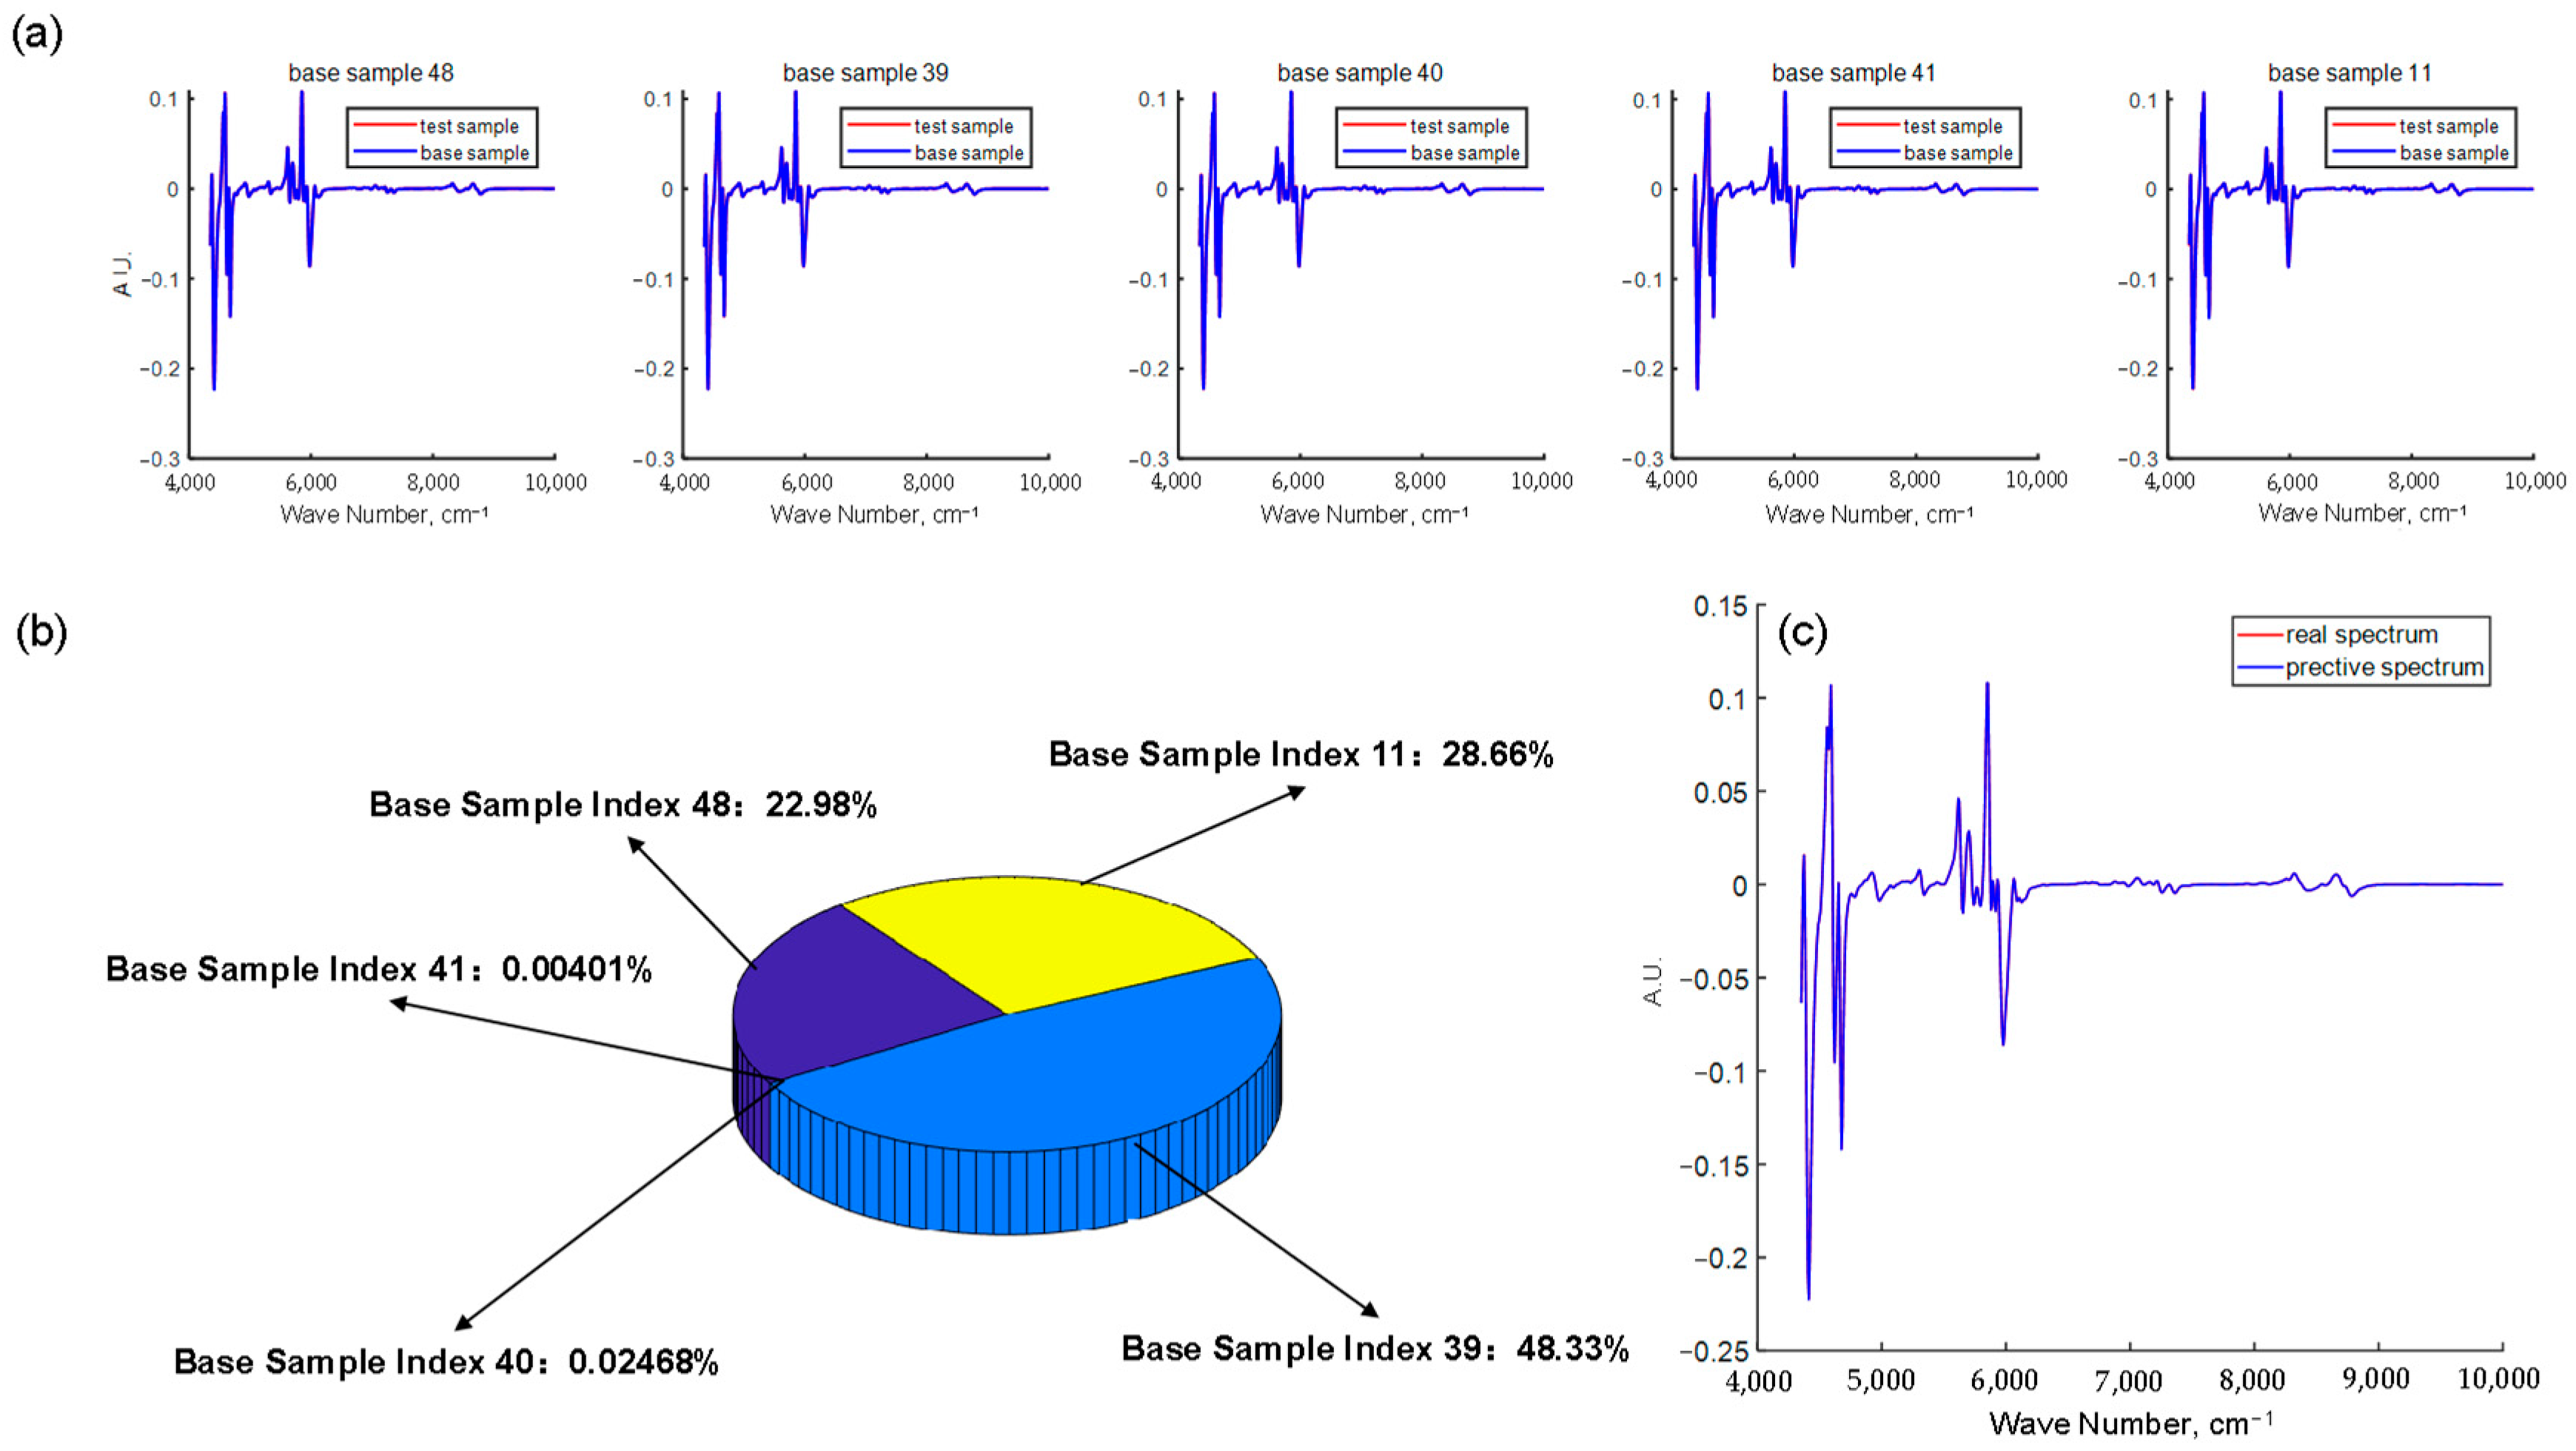
2.4. Sample Selection Algorithm
2.5. Base Oil Blending Algorithm
3. Application on Typical Reformates
4. Applications on Different Reformates
5. Conclusions
Author Contributions
Funding
Data Availability Statement
Conflicts of Interest
References
- Healy, W.C.; Maassen, C.W.; Peterson, R.T. A new approach to blending octane. Proc. Am. Inst. 1959, 39, 132–136. [Google Scholar]
- Stewart, W.E. Predict octanes for gasoline blending. Pet. Refin. 1956, 38, 135–139. [Google Scholar]
- Muller, A. New method produces accurate octane blending values. Oil Gas J. 1992, 90, 80–90. [Google Scholar]
- Morris, W.E. Optimum blending gives best pool octane. Oil Gas J. 1986, 63, 63–68. [Google Scholar]
- Gary, J.H.; Handwerk, G.E.; Kaiser, M.J. Petroleum Refining Technology and Economics; CRC Press: Boca Raton, FL, USA, 2007. [Google Scholar]
- Rusinm, H.; Chungh, S.; Marshallj, F. A “transformation” method for calculating the research and motor octane numbers of gasoline blends. Ind. Eng. Chem. Fundam. 1981, 20, 195–204. [Google Scholar] [CrossRef]
- Twu, C.H.; Coon, J.E. Predict octane numbers using a generalized interaction method. Hydrocarb. Process. 1996, 75, 51–56. [Google Scholar]
- Sivaramakrishnan, K.; Nie, J.J.; de Klerk, A.; Prasad, V. Least Squares-Support Vector Regression for Determining Product Concentrations in Acid-Catalyzed Propylene Oligomerization. Ind. Eng. Chem. Res. 2018, 57, 13156–13176. [Google Scholar] [CrossRef]
- Lopez-Zamora, S.; de Lasa, H. A Mid-Infrared Region (MIR) lumped Group Contribution based method for monitoring light gases and gasolines in Fluid Catalytic Cracking. Chem. Eng. Sci. 2020, 212, 115324. [Google Scholar] [CrossRef]
- Balabin, R.M.; Safieva, R.Z. Gasoline classification by source and type based on near infrared (NIR) spectroscopy data. Fuel 2008, 87, 1096–1101. [Google Scholar] [CrossRef]
- Balabin, R.M.; Safieva, R.Z.; Lomakina, E.I. Comparison of linear and nonlinear calibration models based on near infrared (NIR) spectroscopy data for gasoline properties prediction. Chemom. Intell. Lab. 2007, 88, 183–188. [Google Scholar] [CrossRef]
- Balabin, R.M.; Safieva, R.Z.; Lomakina, E.I. Wavelet neural network (WNN) approach for calibration model building based on gasoline near infrared (NIR) spectra. Chemom. Intell. Lab. 2008, 93, 58–62. [Google Scholar] [CrossRef]
- Balabin, R.M.; Safieva, R.Z.; Lomakina, E.I. Gasoline classification using near infrared (NIR) spectroscopy data: Comparison of multivariate techniques. Anal. Chim. Acta 2010, 671, 27–35. [Google Scholar] [CrossRef] [PubMed]
- Da Silva, N.C.; Cavalcanti, C.J.; Honorato, F.A.; Amigo, J.M.; Pimentel, M.F. Standardization from a benchtop to a handheld NIR spectrometer using mathematically mixed NIR spectra to determine fuel quality parameters. Anal. Chim. Acta 2017, 954, 32–42. [Google Scholar] [CrossRef] [PubMed]
- Leal, A.L.; Silva, A.M.S.; Ribeiro, J.C.; Martins, F.G. Data driven models exploring the combination of NIR and H-1 NMR spectroscopies in the determination of gasoline properties. Microchem. J. 2022, 175, 107217. [Google Scholar] [CrossRef]
- Lee, S.; Choi, H.; Cha, K.; Chung, H. Random forest as a potential multivariate method for near-infrared (NIR) spectroscopic analysis of complex mixture samples: Gasoline and naphtha. Microchem. J. 2013, 110, 739–748. [Google Scholar] [CrossRef]
- Pereira, C.F.; Pimentel, M.F.; Galvao, R.K.H.; Honorato, F.A.; Stragevitch, L.; Martins, M.N. A comparative study of calibration transfer methods for determination of gasoline quality parameters in three different near infrared spectrometers. Anal. Chim. Acta 2008, 611, 41–47. [Google Scholar] [CrossRef] [PubMed]
- Wang, S.T.; Liu, S.Y.; Zhang, J.K.; Che, X.G.; Wang, Z.F.; Kong, D.M. Feasibility study on prediction of gasoline octane number using NIR spectroscopy combined with manifold learning and neural network. Spectrochim. Acta A 2020, 228, 117836. [Google Scholar] [CrossRef]
- Yu, H.J.; Wang, X.J.; Shen, F.F.; Long, J.; Du, W.L. Novel automatic model construction method for the rapid characterization of petroleum properties from near-infrared spectroscopy. Fuel 2022, 316, 123101. [Google Scholar] [CrossRef]
- Femandes, H.L.; Raimundo, I.M.; Pasquini, C.; Rohwedder, J.J.R. Simultaneous determination of methanol and ethanol in gasoline using NIR spectroscopy: Effect of gasoline composition. Talanta 2008, 75, 804–810. [Google Scholar] [CrossRef]
- Wu, Y.S.; Liu, Y.S.; Li, X.L.; Huang, Z.; Han, D. Gasoline octane number prediction from near-infrared spectroscopy with an ANN-based model. Fuel 2022, 318, 123543. [Google Scholar] [CrossRef]
- Da Silva, N.C.; Massa, A.R.C.D.; Domingos, D.; Amigo, J.M.; Reboucas, M.D.; Pasquini, C.; Pimentel, M.F. NIR-based octane rating simulator for use in gasoline compounding processes. Fuel 2019, 243, 381–389. [Google Scholar] [CrossRef]
- He, K.X.; Qian, F.; Cheng, H.; Du, W.L. A novel adaptive algorithm with near-infrared spectroscopy and its application in online gasoline blending processes. Chemom. Intell. Lab. 2015, 140, 117–125. [Google Scholar] [CrossRef]
- He, K.X.; Zhong, M.Y.; Du, W.L. Weighted incremental minimax probability machine-based method for quality prediction in gasoline blending process. Chemom. Intell. Lab. 2020, 196, 103909. [Google Scholar] [CrossRef]
- Wang, K.; He, K.X.; Du, W.L.; Long, J. Novel adaptive sample space expansion approach of NIR model for in-situ measurement of gasoline octane number in online gasoline blending processes. Chem. Eng. Sci. 2021, 239, 116672. [Google Scholar] [CrossRef]
- Long, J.; Jiang, S.Y.; Liu, T.B.; Wang, K.; He, R.C.; Zhao, L. Modified Hybrid Strategy Integrating Online Adjustable Oil Property Characterization and Data-Driven Robust Optimization under Uncertainty: Application in Gasoline Blending. Energy Fuels 2022, 36, 6581–6596. [Google Scholar] [CrossRef]
- He, K.X.; Zhong, M.Y.; Fang, J.Z.; Li, Y.R. Biased Minimax Probability Machine-Based Adaptive Regression for Online Analysis of Gasoline Property. IEEE Trans. Ind. Inform. 2020, 16, 2799–2808. [Google Scholar] [CrossRef]
- Chen, W.H.; Yang, J. A double loop optimization method for gasoline online blending. In Proceedings of the 2016 IEEE International Conference on Industrial Technology (ICIT), Taipei, Taiwan, 14–17 March 2016; pp. 622–627. [Google Scholar]
- Cui, C.; Zhang, L.Z.; Ma, Y.J.; Billa, T.; Hou, Z.; Shi, Q.; Zhao, S.Q.; Xu, C.M.; Klein, M.T. Computer-Aided Gasoline Compositional Model Development Based on GC-FID Analysis. Energy Fuels 2018, 32, 8366–8373. [Google Scholar] [CrossRef]
- Cui, C.; Billa, T.; Zhang, L.Z.; Shi, Q.; Zhao, S.Q.; Klein, M.T.; Xu, C.M. Molecular Representation of the Petroleum Gasoline Fraction. Energy Fuels 2018, 32, 1525–1533. [Google Scholar] [CrossRef]
- Durand, J.P.; Gautier, S.; Robert, E.; Guilhem, M.C.; Phan-Tan-Luu, R. Experimental design optimization of the analysis of gasoline by capillary gas chromatography. J. High Resolut. Chromatogr. 1997, 20, 289–294. [Google Scholar] [CrossRef]
- Bruckner, C.A.; Prazen, B.J.; Synovec, R.E. Comprehensive Two-Dimensional High-Speed Gas Chromatography with Chemometric Analysis. Anal. Chem. 1998, 70, 2796–2804. [Google Scholar] [CrossRef]
- Jaffe, S.B.; Freund, H.; Olmstead, W.N. Extension of structure-oriented lumping to vacuum residua. Ind. Eng. Chem. Res. 2005, 44, 9840–9852. [Google Scholar] [CrossRef]
- Quann, R.J.; Jaffe, S.B. Structure-oriented lumping: Describing the chemistry of complex hydrocarbon mixtures. Ind. Eng. Chem. Res. 1992, 31, 2483–2497. [Google Scholar] [CrossRef]
- Feng, S.; Cui, C.; Li, K.Y.; Zhang, L.Z.; Shi, Q.; Zhao, S.Q.; Xu, C.M. Molecular composition modelling of petroleum fractions based on a hybrid structural unit and bond-electron matrix (SU-BEM) framework. Chem. Eng. Sci. 2019, 201, 145–156. [Google Scholar] [CrossRef]
- Klein, M.T.; Hou, G.; Bertolacini, R.; Broadbelt, L.J.; Kumar, A. Molecular Modeling in Heavy Hydrocarbon Conversions; CRC Press: Boca Raton, FL, USA, 2005. [Google Scholar]
- Brudzewski, K.; Kesik, A.; Kolodziejczyk, K.; Zborowska, U.; Ulaczyk, J. Gasoline quality prediction using gas chromatography and FTIR spectroscopy: An artificial intelligence approach. Fuel 2006, 85, 553–558. [Google Scholar] [CrossRef]
- Ghosh, P.; Hickey, K.J.; Jaffe, S.B. Development of a detailed gasoline composition-based octane model. Ind. Eng. Chem. Res. 2006, 45, 337–345. [Google Scholar] [CrossRef]
- Haas, F.M.; Dryer, F.L. Application of blending rules for ignition quality metrics: A comment on “A linear-by-mole blending rule for octane numbers of n-heptane/iso-octane/toluene mixtures”. Fuel 2014, 120, 240–242. [Google Scholar] [CrossRef]
- Knop, V.; Loos, M.; Pera, C.; Jeuland, N. A linear-by-mole blending rule for octane numbers of n-heptane/iso-octane/toluene mixtures. Fuel 2014, 115, 666–673. [Google Scholar] [CrossRef]
- Fioroni, G.M.; Rahimi, M.J.; Westbrook, C.K.; Wagnon, S.W.; Pitz, W.J.; Kim, S.; McCormick, R.L. Chemical kinetic basis of synergistic blending for research octane number. Fuel 2022, 307, 121865. [Google Scholar] [CrossRef]
- Li, R.Z.; Herreros, J.M.; Tsolakis, A.; Yang, W.Z. Machine learning regression based group contribution method for cetane and octane numbers prediction of pure fuel compounds and mixtures. Fuel 2020, 280, 118589. [Google Scholar] [CrossRef]
- Fabe, N.K.M. Multivariate Sensitivity for the Interpretation of the Effect of Spectral Pretreatment Methods on Near-Infrared Calibration Model Predictions. Anal. Chem. 1999, 71, 557–565. [Google Scholar] [CrossRef]


| Bulk Property | VIA | VIB | Bulk Property | VIA | VIB |
|---|---|---|---|---|---|
| RON | 89 92 95 | 89 92 95 | Residual amount (volume fraction)/% | 2 | 2 |
| (RON + MON)/2 | 84 87 90 | 84 87 90 | Sulfur content/(mg/kg) | ≤10 | ≤10 |
| Vapor pressure, kPa (winter) | 45–85 | 45–85 | Aromatic content (volume fraction)/% | ≤35 | ≤35 |
| Vapor pressure, kPa (summer) | 40–65 | 40–65 | Benzene content (volume fraction)/% | ≤0.8 | ≤0.8 |
| Distillation range: | Olefin content (volume fraction)/% | ≤18 | ≤15 | ||
| T10/°C | ≯70 | ≯70 | Manganese content /(mg/L) | ≤2 | ≤2 |
| T50/°C | ≯110 | ≯110 | Oxygen content (mass fraction)/% | ≤2.7 | ≤2.7 |
| T90/°C | ≯190 | ≯190 | Methanol content (mass fraction)/% | ≤0.3 | ≤0.3 |
| Final distillation point/°C | ≯205 | ≯205 | Residual amount (volume fraction)/% | 2 | 2 |
| Classification of Group and Molecular Composition | Predicted | GC-FID | ABS |
|---|---|---|---|
| paraffins (P) | 0.0058 | 0.0062 | 0.0004 |
| isoparaffins (I) | 0.0125 | 0.0132 | 0.0007 |
| olefins (O) | 0.0001 | 0.0000 | 0.0001 |
| naphthenics (N) | 0.0046 | 0.0049 | 0.0003 |
| aromatics (A) | 0.977 | 0.9756 | 0.0014 |
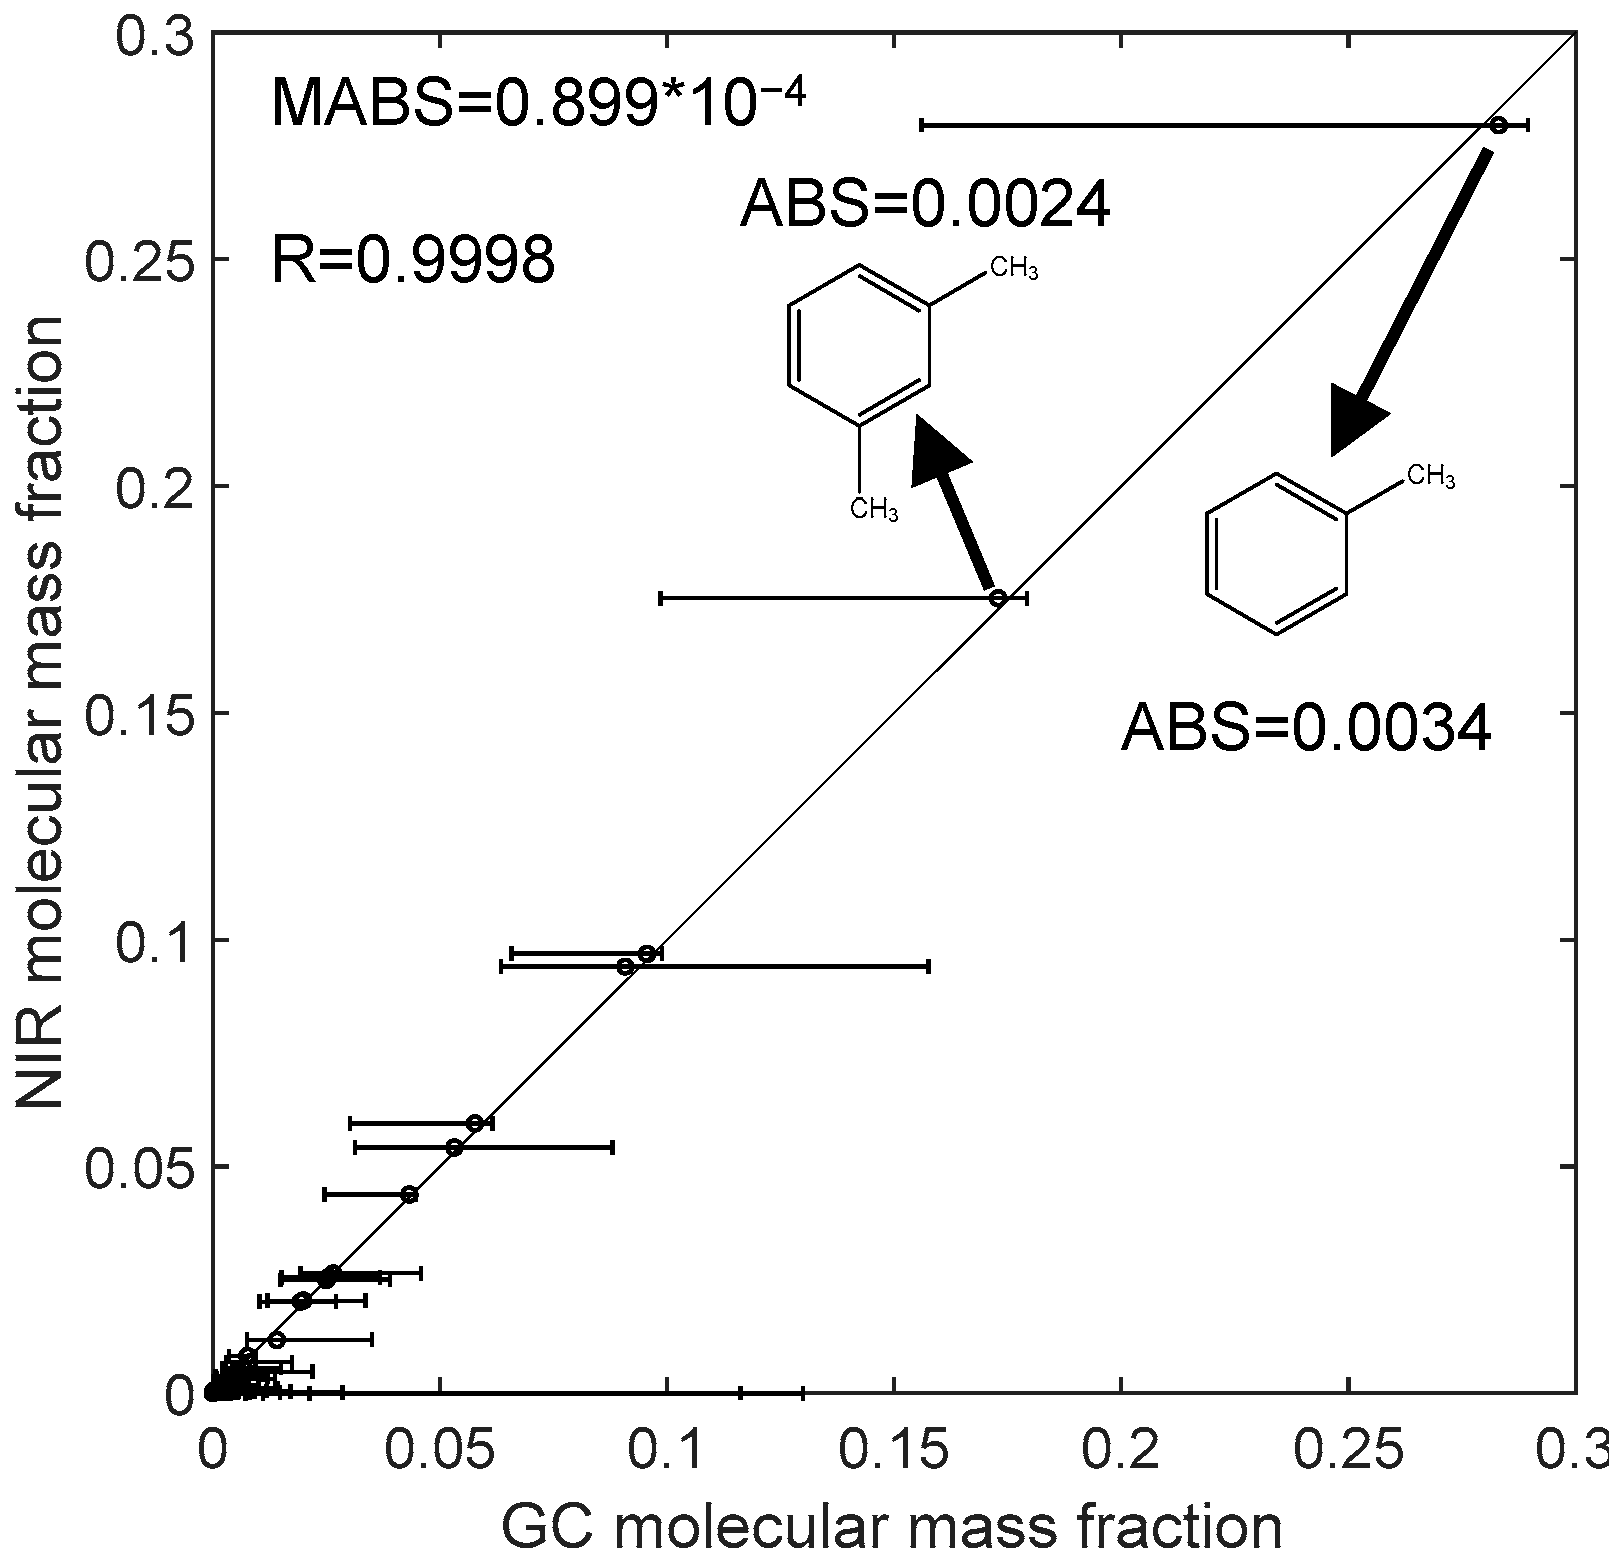
| methylbenzene | 0.2796 | 0.2831 | 0.0035 |
| ethylbenzene | 0.0595 | 0.0577 | 0.0018 |
| m-xylene | 0.1753 | 0.1729 | 0.0024 |
| p-xylene | 0.0438 | 0.0432 | 0.0006 |
| o-xylene | 0.0969 | 0.0956 | 0.0013 |
| n-butylbenzene | 0.0202 | 0.0194 | 0.0008 |
| 1-methyl-3-ethylbenzene | 0.0542 | 0.0532 | 0.001 |
| 1-methyl-4-ethylbenzene | 0.025 | 0.025 | 0.000 |
| 1-methyl-2-ethylbenzene | 0.0256 | 0.0254 | 0.0002 |
| 1,3,5-trimethylbenzene | 0.0204 | 0.0199 | 0.0005 |
| 1,2,4-trimethylbenzene | 0.0941 | 0.0908 | 0.0033 |
| 1,2,3-trimethylbenzene | 0.0264 | 0.0265 | 0.0001 |
| C10 aromatics | 0.0118 | 0.0141 | 0.0023 |
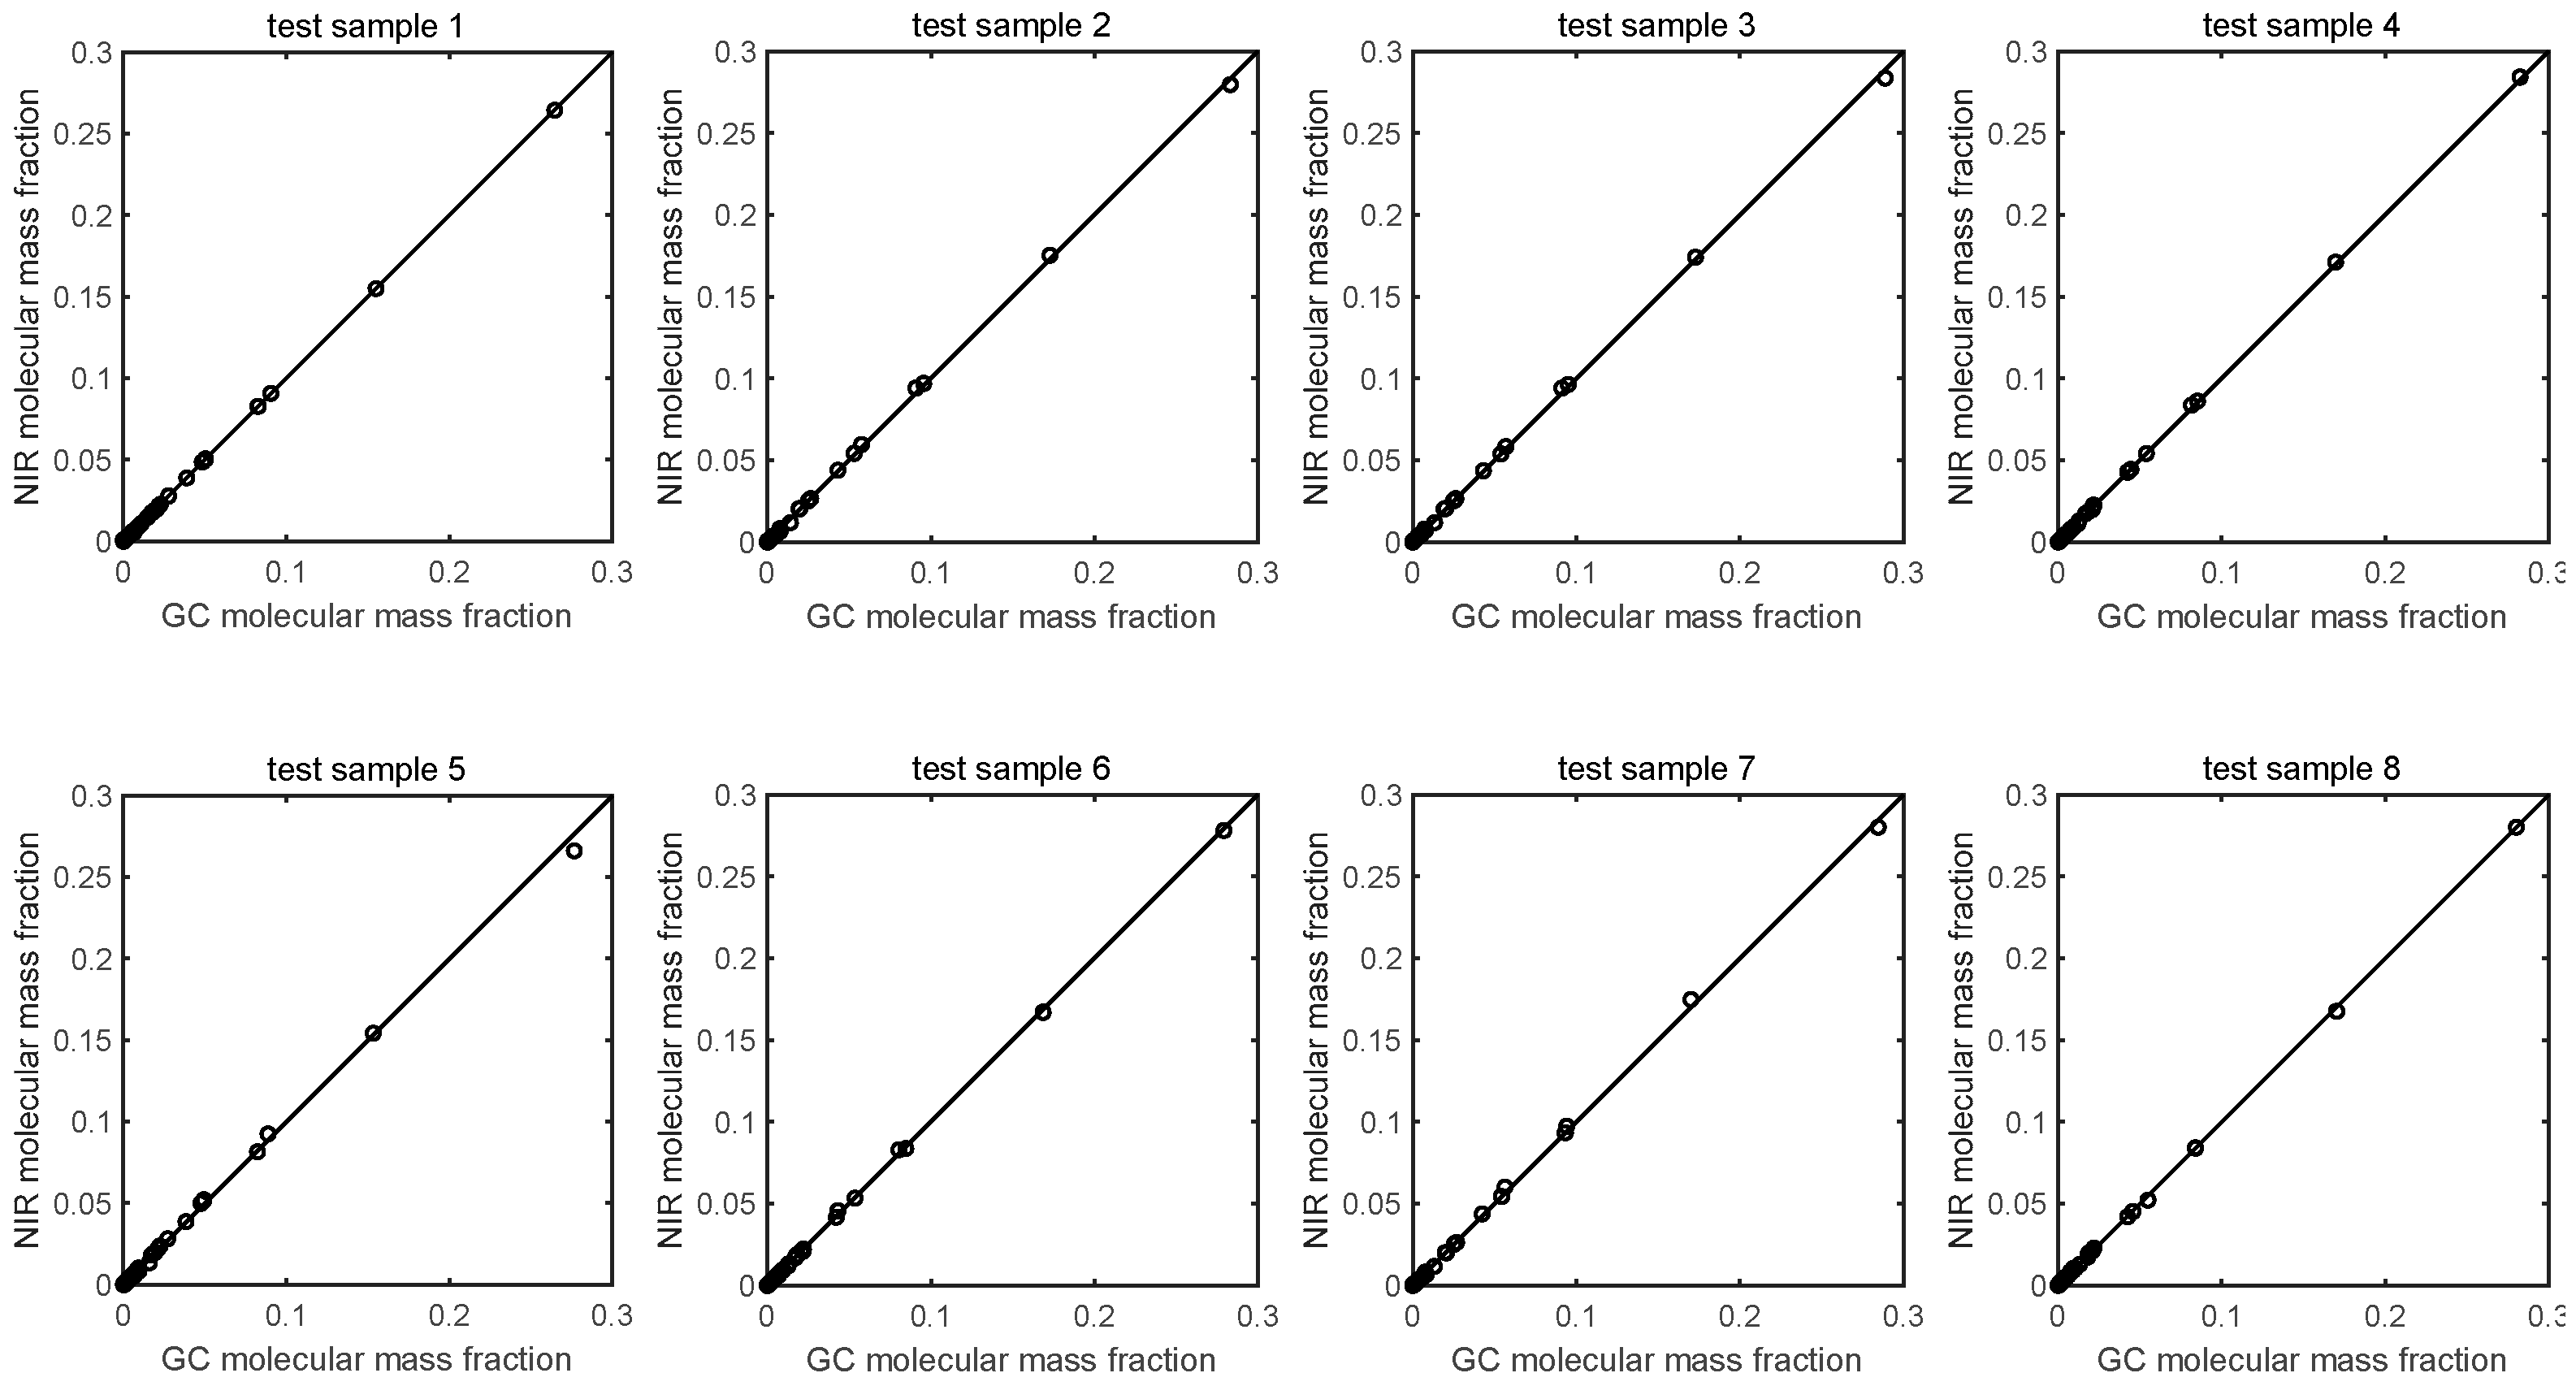
| Sample Index | MABS/×10−4 | R | Spectral Residual/×10−5 |
|---|---|---|---|
| 1 | 0.261 | 0.9999 | 1.491 |
| 2 | 0.899 | 0.9998 | 3.156 |
| 3 | 0.717 | 0.9998 | 3.555 |
| 4 | 0.639 | 0.9999 | 2.754 |
| 5 | 1.515 | 0.9994 | 4.584 |
| 6 | 0.591 | 0.9999 | 4.054 |
| 7 | 1.0069 | 0.9997 | 3.356 |
| 8 | 0.616 | 0.9999 | 3.115 |
| mean | 0.781 | 0.9998 | 3.258 |
Disclaimer/Publisher’s Note: The statements, opinions and data contained in all publications are solely those of the individual author(s) and contributor(s) and not of MDPI and/or the editor(s). MDPI and/or the editor(s) disclaim responsibility for any injury to people or property resulting from any ideas, methods, instructions or products referred to in the content. |
© 2023 by the authors. Licensee MDPI, Basel, Switzerland. This article is an open access article distributed under the terms and conditions of the Creative Commons Attribution (CC BY) license (https://creativecommons.org/licenses/by/4.0/).
Share and Cite
Cheng, M.; Zhang, L. Molecular Reconstruction Method Based on NIR Spectroscopy for Reformates. Energies 2023, 16, 2982. https://doi.org/10.3390/en16072982
Cheng M, Zhang L. Molecular Reconstruction Method Based on NIR Spectroscopy for Reformates. Energies. 2023; 16(7):2982. https://doi.org/10.3390/en16072982
Chicago/Turabian StyleCheng, Mingyuan, and Linzhou Zhang. 2023. "Molecular Reconstruction Method Based on NIR Spectroscopy for Reformates" Energies 16, no. 7: 2982. https://doi.org/10.3390/en16072982