Article

Quantitative Evaluation of the Effects of Heat Island on Building Energy Simulation: A Case Study in Wuhan, China

Mines Paris, PSL University, Centre for Energy Efficiency of Systems (CES), 75006 Paris, France
*
Author to whom correspondence should be addressed.
Energies 2023, 16(7), 3032; https://doi.org/10.3390/en16073032
Submission received: 22 February 2023 / Revised: 22 March 2023 / Accepted: 23 March 2023 / Published: 26 March 2023
(This article belongs to the Special Issue Solutions towards Zero Carbon Buildings)

Abstract

:
The climate data used for dynamic energy simulation of buildings located in urban regions are usually collected in meteorological stations situated in rural areas, which do not accurately represent the urban microclimate (e.g., urban heat island effect), and this might affect the simulation accuracy. This paper aims at quantitatively evaluating the effects of heat island on a high-rise building’s energy performance based on the microclimate simulation tool ENVI-met and the building energy simulation tool COMFIE. However, the computation of microclimate models is time consuming; it is not possible to simulate every day of a year in a reasonable time. This paper proposes a method that generates hourly “site-specific climate data” to avoid long microclimate simulation times. A coupling method of ENVI-met and COMFIE was developed for more precise building energy simulation, accounting for the heat island effect. It was applied to a high-rise building in Wuhan, China. The results showed that the yearly average urban heat island effect intensity at the height of 3 m was estimated to be 0.55 °C and decreased with height. Compared to the simulation considering the outdoor temperature variation with the height and orientation, using the original climate data collected in rural areas led to an overestimation of the heating load by around 5.8% and an underestimation of the cooling load by around 8.7%. Compared to the weather file at the height of 3 m near the north facade neglecting the temperature variation along the height, the heating load was overestimated by 8.2% and the cooling load was underestimated by 10.8%. The methods proposed in this paper can be used for the more precise application of urban building energy simulation.

1. Introduction

Building energy consumption is one of the three main energy consumption domains including industry and transportation, accounting for approximately 36% of the global final energy in 2018 [1]. One potential way to reduce building energy consumption corresponds to decisions made during the design phase, which can be aided by dynamic building energy simulation (DBES) tools. The simulation results of a building’s energy consumption are closely related to the accuracy of the weather file comprising 8760 h of various climatic parameters such as air temperature and solar radiation [2]. In present DBES tools, one mostly used weather file format is the Typical Meteorological Year (TMY) format [3], which consists of twelve Typical Meteorological Months (TMM) from the past decades [2]. These data usually come from meteorological stations located in the rural zones (e.g., an airport), which have a very different morphological form compared to the urban areas composed of urban settlements.
China is moving towards urbanisation and this will last for decades [4]. During this process, urban settlements are formed by replacing natural or agricultural land with urban environments. For example, the ground surface is covered with impermeable materials such as concrete and asphalt, and the vegetation area is sharply reduced [5]. This leads to specific microclimates in the urban areas. Urban microclimate can be defined as the local climate observed in urban areas, which can be significantly different from the climate of surrounding rural areas [6]. The urban microclimate involves the local climate characteristics between the near-ground atmosphere and the topsoil in a relatively small space, including temperature, solar radiation, wind, humidity, etc. [7]. The difference between an urban microclimate and a rural climate might bring potential simulation errors if the TMY weather file is directly used in an urban building’s energy performance evaluation. To avoid this, it is essential to take the microclimate’s effects into account in DBES.
The urban heat island (UHI) effect is a well-known phenomenon among the microclimate features. It describes the phenomenon that air temperature in urban areas is higher than the surrounding rural areas. It is reported in many urban areas regardless of the size and location [8,9,10,11,12,13,14]. It could be observed by the application of infrared thermography at different scales such as the city scale using satellites and the neighbourhood scale using aerial vehicles and rooftop observatories [15,16]. Drones are used more and more to detect the UHI effect or analyse urban heat fluxes [17,18,19]. The UHI effect can be quantitatively described by the urban heat island intensity (UHII) which is the urban air temperature minus the rural air temperature [14]. Occasionally, the urban air temperature can be lower than the rural air temperature, which is called the urban cool island (UCI) effect, and the temperature difference is the urban cool island intensity (UCII). Air temperature is one of the most important factors as it directly drives the operation of a cooling/heating system and influences the corresponding building cooling and heating energy consumption [20]. Many studies reported that the UHI effect increases the cooling energy consumption and decreases the heating energy consumption [20,21,22,23]. A weather input file considering the UHI effects can yield a more accurate evaluation of buildings’ energy consumption.
Li et al. [20] summarised the procedure in evaluating UHI impacts on building energy consumption, which includes three steps: (1) preparing two temperature datasets with and without the UHI effect; (2) simulating/estimating building energy consumption respectively using these two temperature datasets; and (3) evaluating the impacts of UHI on building energy consumption by comparing the two results. The urban temperatures are mainly obtained by measurements or simulation. This paper focuses on the simulation of UHI, because as abovementioned the weather files in DBES are normally in TMY format, reflecting representative climates during a long period. On the contrary, measurements can only record the climate in a short time which might not be representative. This problem can be avoided using simulation.
Microclimate simulation tools (e.g., ENVI-met) can be used to model UHI effects. However, the calculation time is quite long for a standard PC (e.g., nearly 24 h to simulate one day in our case), such that it is not possible to obtain the hourly microclimate data for the whole year in a timely manner, especially if the energy performance optimisation of a building or a block is needed in the design phase. A method for the generation of hourly microclimate parameters could be beneficial. In addition to this, the new buildings are usually high-rise and dense in China. Contrary to low-rise buildings, little research has focused on the effect of UHI on a high-rise building in a densely built region. Normally, one measure of air temperature is used for the whole building in DBES, neglecting the temperature variation in terms of height and orientation. This might bring simulation errors for a high-rise building, especially where the UHI effect occurs.
This paper aims to investigate these two questions: what error is induced by using regional instead of microclimate data in DBES? How can DBES and microclimate simulation tools be chained? Firstly, a site-specific weather file generation method is proposed to account for the hourly UHI effect for a TMY weather file, avoiding long simulation time. Secondly, the coupling methodology of a microclimate simulation tool and a DBES tool is presented to perform a more accurate simulation of the building energy performance under the UHI effect. Finally, the methods are applied to a high-rise residential building in Wuhan (China) to quantitatively evaluate the effects of UHI on its energy performance.

2. Methodology

2.1. Site-Specific Weather File Generation Method

In this paper, the microclimate simulation tool used is ENVI-met v4.4.6, which is a three-dimensional (3D) numerical model initially developed by Bruse and Fleer [24] to analyse microclimates through the fundamental laws of fluids and thermodynamics. The interactions between buildings, soil, vegetation and atmosphere can be simulated with a typical spatial resolution between 0.5 m and 10 m and a timestep of 1–10 s. Every single plant and every urban structure can explicitly be simulated, making ENVI-met the perfect tool for urban planners, architects and urban climatologists who want to simulate the meteorological components of the urban environment [25]. This model has been validated by several studies [2,26,27,28,29,30] for different cities with different microclimate conditions. The DBES tool is COMFIE [31], which is a multizone model based on the finite volume method and modal reduction. It has been validated in several projects [32,33,34,35,36], including in the Wuhan context [37].
As mentioned in the introduction, it is not possible to obtain the hourly UHIIs for one whole year in ENVI-met with a standard PC in a reasonable calculation time. Therefore, a key point for the association of the DBES simulation tool and the microclimate tool is to propose a method which can generate a “site-specific weather file” containing the hourly UHIIs appropriately in reasonable simulation time.
The core idea of the proposed method to solve this problem is only simulating four representative days in ENVI-met to obtain their hourly UHIIs, and then deriving the hourly UHII of other days by linear interpolation. To better identify the UHII, one representative day is chosen for each season: extreme hot/cold days in summer/winter (in order to obtain potential largest/smallest UHII) and average temperature days in spring/autumn (in order to obtain reasonable interpolation between largest and smallest UHII). Once the hourly UHIIs for the whole year have been obtained, they could be added to the original weather file without considering the UHI effect to generate the site-specific weather file. It should be noted that, if not especially indicated, spring refers to March, April and May; summer refers to June, July and August; autumn refers to September, October and November; and winter refers to December, January and February.
The original weather file for DBES in COMFIE in this paper is an EnergyPlus Weather (EPW) format file downloaded from the website of EnergyPlus [38]. The reason why an EPW file was chosen is that it can be directly used in ENVI-met for microclimate simulation. The other reason is that this file also records the extreme air temperature weeks in summer and winter and the average air temperature weeks for all four seasons, which is convenient to select the representative days of the four seasons.
The proposed site-specific weather file generation method considering the UHI effect consists of four steps, as shown in Figure 1 (MATLAB was used in steps 1, 3 and 4):
Step 1: representative days selection. One representative day of the representative week (extreme hot/cold week for summer/winter and average week for spring/autumn, which are directly given in EPW file) of each season is chosen based on the day with the hourly temperature closest to the average hourly temperature of the week (see hereunder). Since this study focuses on the UHI effect, which is directly related to the ambient temperature, it is reasonable to select the representative days based on the air temperature. It should be noted that it is not the extreme hot/cold day in extreme hot/cold weeks for summer/winter, in order to be more representative. These four representative days can be abbreviated to ex-summer, ex-winter, av-spring and av-autumn;
Step 2: microclimate simulation. These four representative days are then simulated in ENVI-met to obtain the local microclimate parameters and the UHIIs;
Step 3: hourly UHII generation. The hourly UHIIs are obtained by linear interpolation for 24 h between two representative days;
Step 4: site-specific weather file generation. The air temperature of the site-specific weather file is generated by adding the hourly UHII to the original EPW file.
In step 1, in order to determine the representative day of the representative week of each season, the average temperature of the ith hour Tav,i of the representative week is firstly to be identified:
T av , i = j = 1 7 T i j 7         i = 1 24  
where T i j is temperature of the ith hour of the jth day in the representative week.
The root mean square error (RMSE) and the mean absolute error (MAE) of each day for the 24 h are calculated by:
RMSE j = i = 1 24 T i j T av , i 2 24  
MAE j = i = 1 24 T i j T av , i 24  
The day with the smallest RMSE is chosen as the representative day of each season; if RMSE is similar, the day with smallest MAE is selected.
In step 3, knowing the four representative days, the UHII of the ith hour of the kth day in the whole year can be calculated by linear interpolation. For example, the hourly UHII between the first (av-spring) and the second (ex-summer) representative days:
UHII i k = UHII i k re 2 UHII i k re 1 k re 2 k re 1 k k re 1 + UHII i k re 1  
where kre1 and kre2 are the day numbers of the 1st and 2nd representative day. The UHII between other representative days could be obtained by the same way.
It should be noted that the linear interpolation between two representative days to obtain the hourly UHII for the whole year is a highly simplified assumption. The hourly variation of UHII in cities is much more complex due to enormous factors such as complicated urban planning, various constructions, vegetation and climate conditions. The main aim of this study is to identify the UHI effect on building energy consumption for a long period (usually one year), rather than accurately estimate the UHI variation of one day. It mainly relies on the estimation of a general UHI feature, so there is a certain tolerance on the biases of hourly UHII [39].

2.2. Coupling Microclimate Simulation Tool with DBES Tool

The coupling methods of a microclimate tool and a DBES tool are classified into one-way coupling and double-way coupling [40]. The double-way coupling method considers the effect of the microclimate on the building, as well as the effect of the building on the microclimate (e.g., the anthropogenic emissions released outside due to air-conditioning or heating systems such as heat pumps), which is more realistic, but more complex. It requires the microclimate tools to deal with such heat sources, and needs user parameter inputs.
In this paper, the coupling of ENVI-met and COMFIE is a one-way coupling (ENVI-met v4.4.6 only allows one-way coupling), meaning the simulation results of ENVI-met are transferred to COMFIE but without feedback. The key point is modifying the weather input file from the original one (e.g., the meteorological data from rural stations) to the new one (which considers the urban microclimate). In COMFIE, a building is modelled by defining thermal zones according to orientations and heights. An identical temperature profile is used for the whole building, regardless of zone height and orientation. As mentioned in the introduction, this might bring simulation errors for a high-rise building in a dense block where the UHI effect occurs.
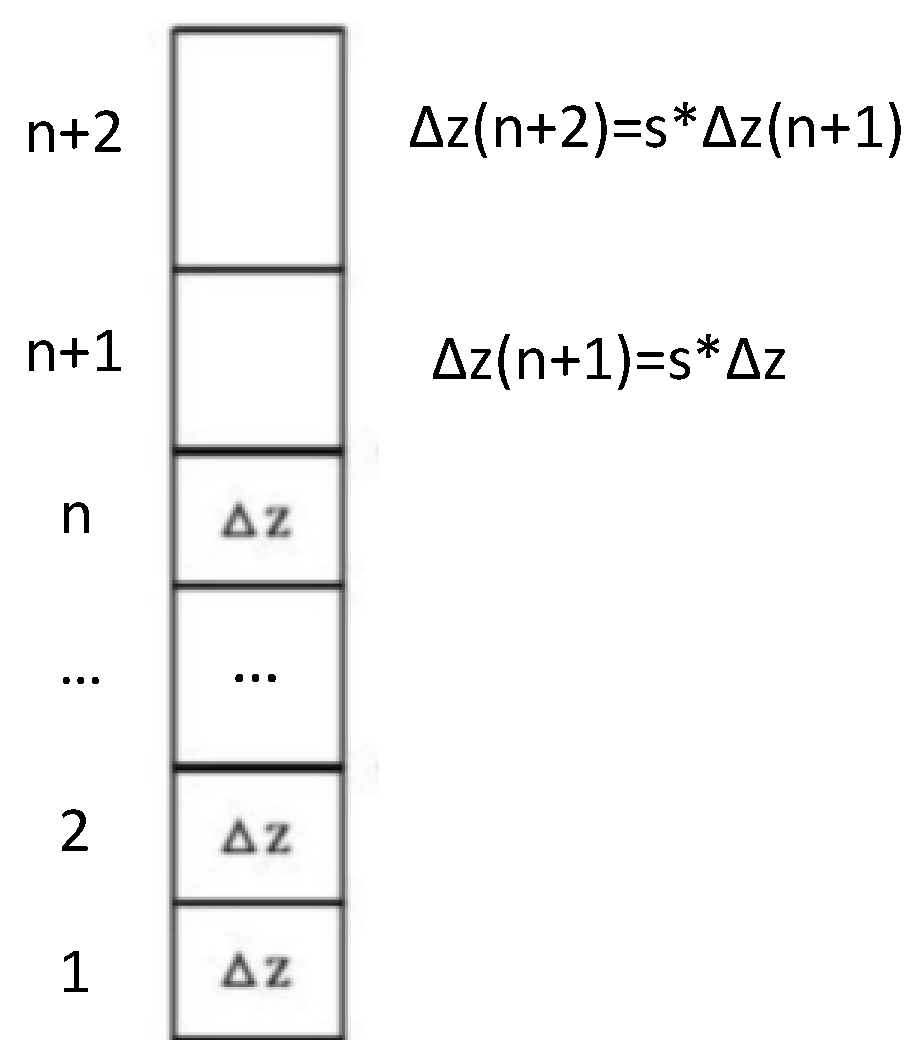
The coupling method proposed in this paper considers the air temperature variation with height and orientation, based on the microclimate simulation results. The main 3D model in ENVI-met (e.g., a district and its soil and atmosphere) is divided into I × J × K grid cells with dimensions Δx × Δy × Δz, respectively. Buildings, vegetation and the digital elevation model are constricted to this grid cell. This means that a cell is either fully occupied by one of these obstacles or not at all. On the horizontal surface, Δx and Δy (usually from 0.5 m to 10 m) are constant for all the cells. In the vertical direction, the dimension Δz of the first n cells are identical, and afterwards the dimension of one cell is that of the previous cell multiplied by a scaling factor s (s > 1), as shown in Figure 2. This is because the cell close to the ground surface should have a smaller dimension in order to have a more accurate simulation of the interactions between the ground and the atmosphere.
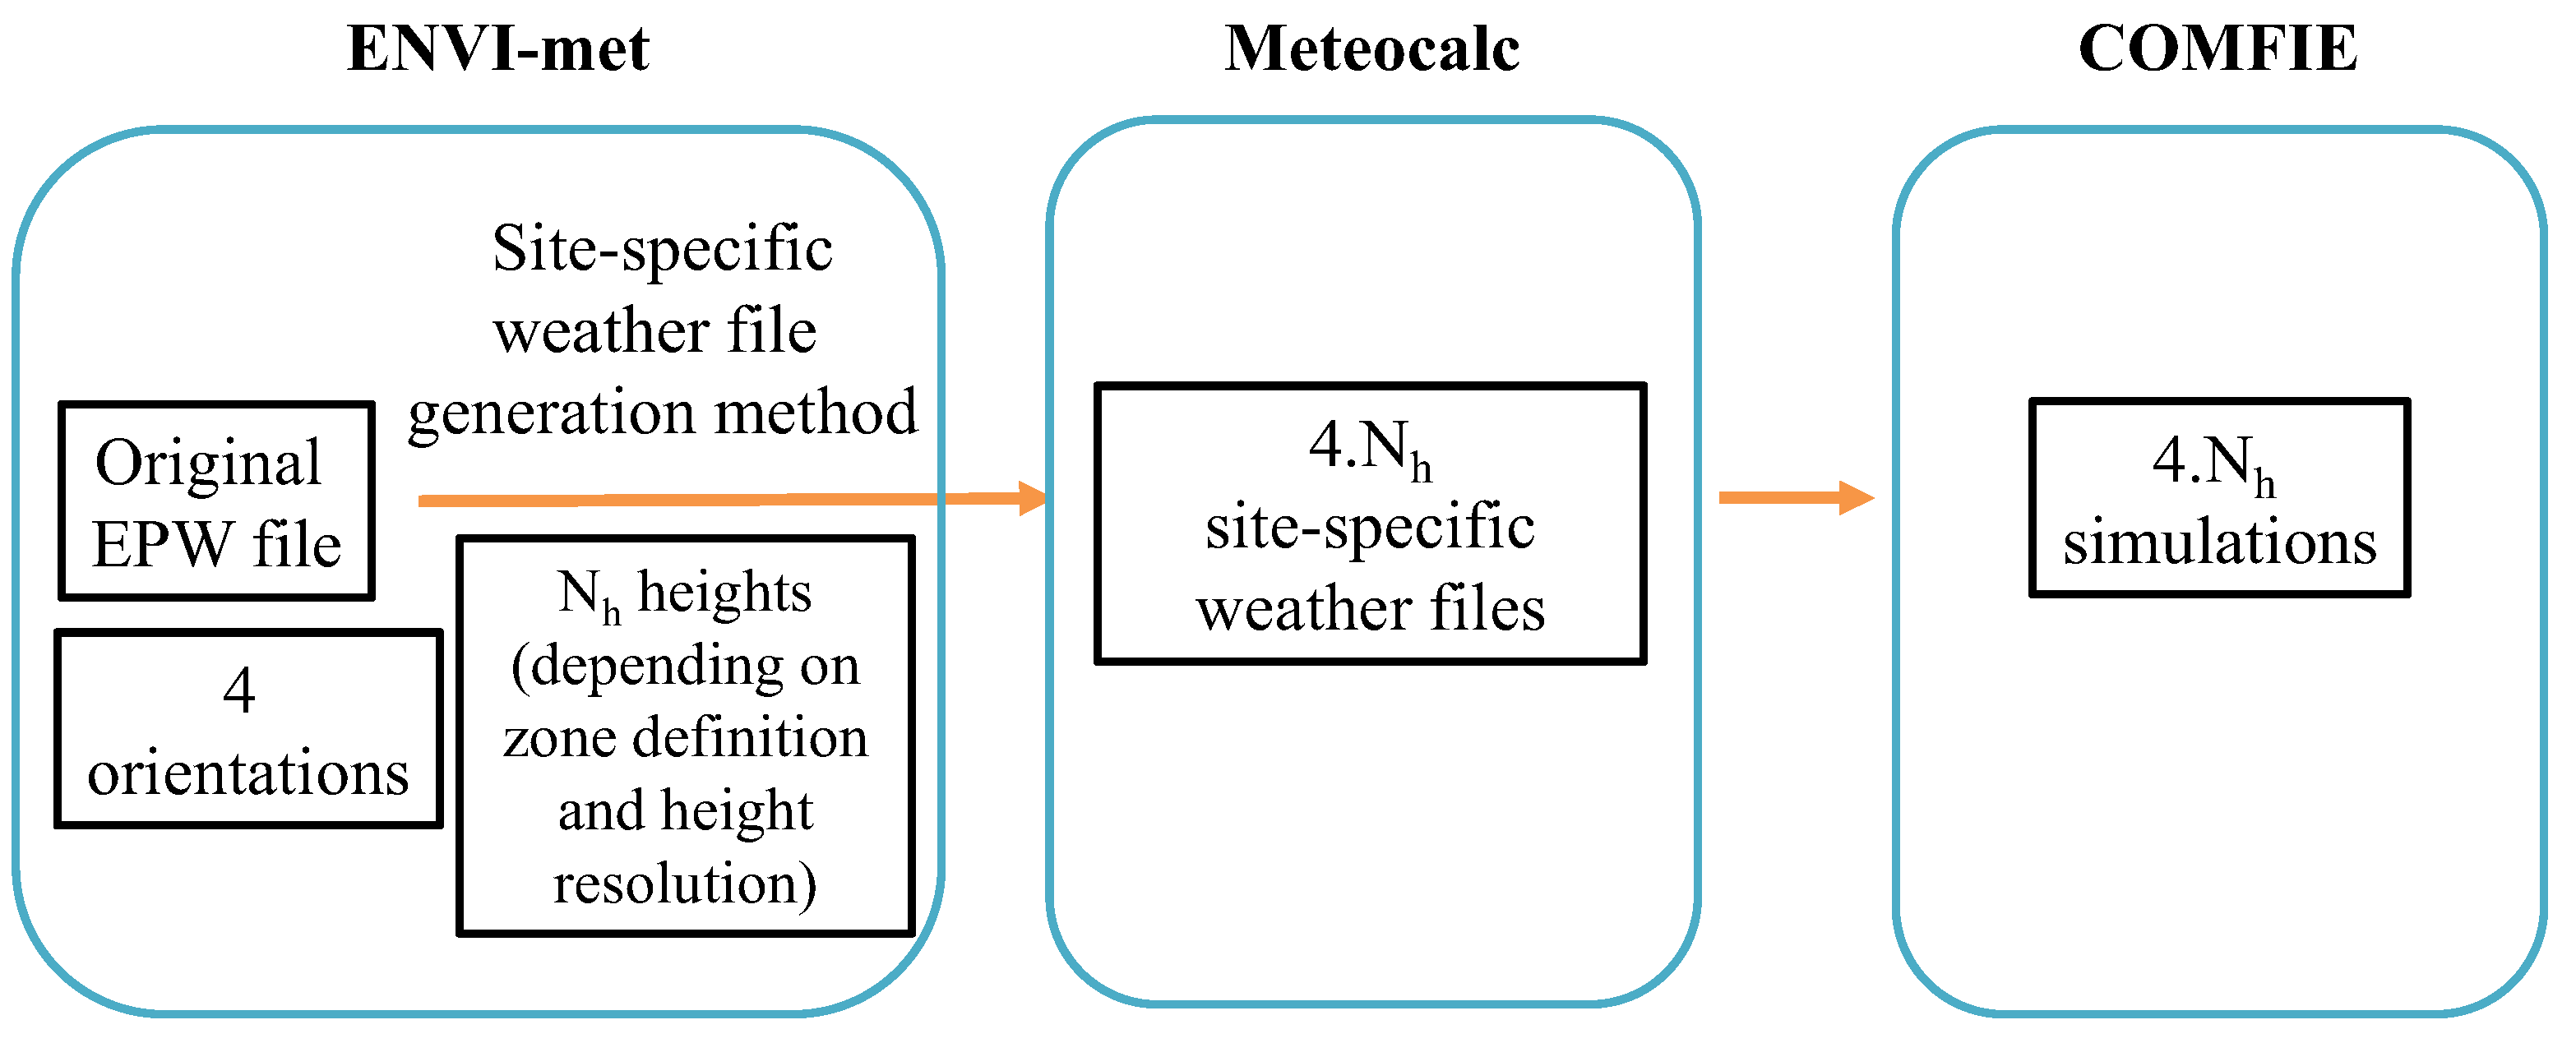
The temperature profiles of four orientations (north, south, west and east) along Nh different heights are generated from ENVI-met. The value of Nh should respect the thermal zone definition regarding the height and in DBES tool and the cell definition in the vertical direction in ENVI-met. This will be described in detail in Section 3.3. The temperature profiles are inputted in the weather generation tool Meteocalc (which is integrated in COMFIE) and 4.Nh corresponding site-specific weather files are generated. Then, the simulation is performed 4.Nh times in COMFIE to obtain reference simulation results for each thermal zone. The whole coupling method is shown in Figure 3.

3. Case Study

3.1. Basic Information

The studied case is located in Wuhan, the capital city of Hubei Province, China. Its topography is dominated by relatively flat land between 22 m and 27 m above sea level except the hilly areas sporadically distributed in suburban districts. Water bodies occupy a high percentage (>20%) of its territory. Wuhan’s climate is humid subtropical with abundant rainfall and four distinctive seasons. Spring and autumn are generally mild, summer is hot and humid and winter is cold and dry.
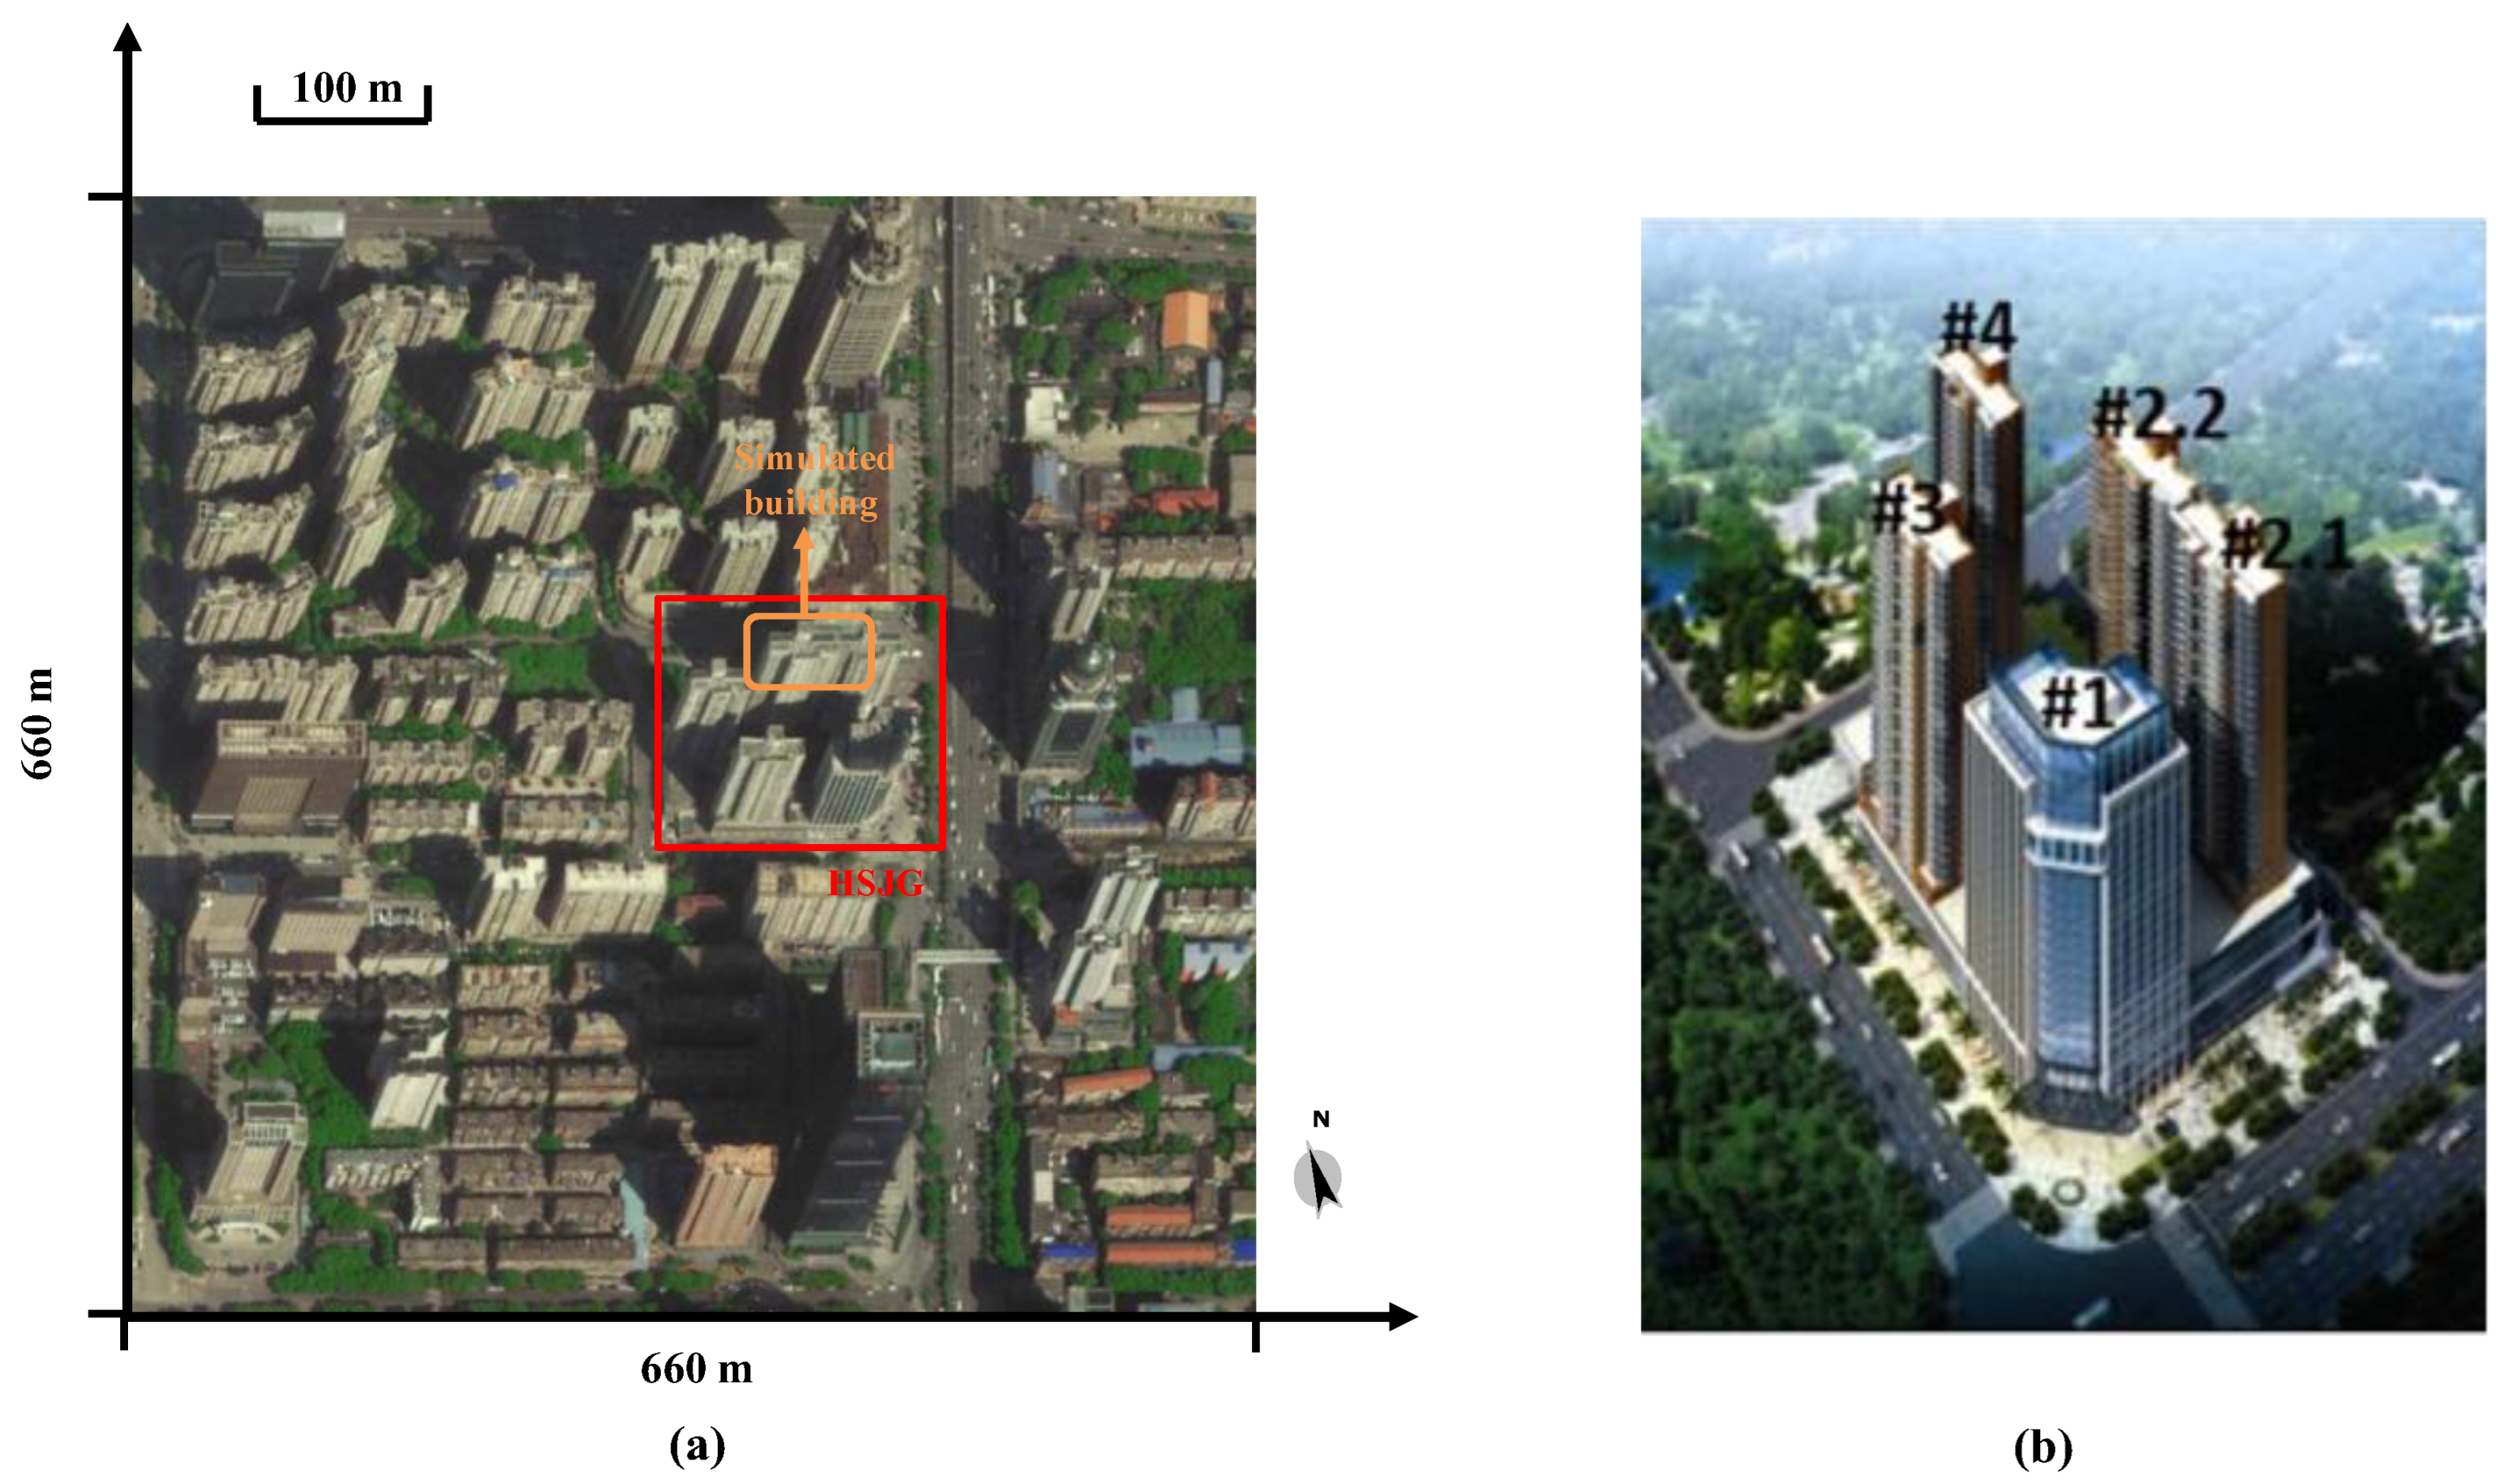
The simulated high-rise building is unit 2 of building #2 (#2.2) in the Haishan Jingu (HSJG) block. HSJG consists of one office building (#1) and three residential buildings (#2, #3 and #4). Its latitude is 30°32’ north and longitude is 114°20’ east. This area is a business and commercial centre, mixed with many recently built high-rise offices, commercial and residential buildings and old buildings, as shown in Figure 4a. This area faces south by east with an angle of 20°. The overall plan is shown in Figure 4b. The studied building #2.2 consists of 34 floors with an average height 3 m for each floor. The net floor area of the building is around 12,500 m2.

3.2. Microclimate Simulation Configuration

3.2.1. Representative Days Selection

The EPW file downloaded from the EnergyPlus website directly indicates the four representative weeks of the four seasons, as presented in Table 1. The extreme hot (in summer) and cold (in winter) weeks are the ones nearest to the maximal and minimal outdoor temperature in the corresponding periods. The average weeks in spring and autumn are the ones nearest to the average outdoor temperature in the corresponding periods. They are determined by a heuristic method in EnergyPlus. Using the site-specific weather file generation method, the representative day of each season was selected for the microclimate simulation. The day of each week with the smallest RMSE was chosen as the representative day for each season. The results are shown in Table 1.
It should be noted that instead of a normal air temperature (e.g., in EPW file), the air temperature in ENVI-met, Tair,pot, is the potential temperature. It can be converted from atmosphere pressure and normal temperature with the following Equation (5):
T air , pot = T air abs P 0 P 0.286  
where T air abs is the absolute normal air temperature (K), P0 is the reference pressure (100,000 Pa in ENVI-met) and P is the atmosphere pressure (Pa).

3.2.2. Simulation Configuration

Locating the studied building approximately in the centre, the total area for microclimate simulation is a region of 660 m × 660 m, as shown in Figure 4a. Although it is very difficult to obtain detailed information regarding the surroundings, it is still possible to get a rough picture of the surroundings including the heights of the buildings, the green areas and the roads by using Google Maps and Google Earth. This information allows one to use ENVI-met to evaluate the site-specific climatic conditions. If detailed data of the surroundings can be obtained, a more accurate simulation can be performed. Accounting for the calculation speed and the model accuracy, 110 × 110 × 19 cells were used in this study, with a resolution of 6 m in the horizontal directions. In the vertical direction, the resolution of one cell is 6 m below 30 m (the first five cells) and afterwards the height of cell n + 1 is the height of cell n multiplied by 1.25 (n being the level of the cell from 6 to 19), as shown in Figure 2. In addition to this, eight empty cells were set at each border (which is called the “nesting area”) to increase the stability and accuracy of the simulation. The microclimate simulation has better accuracy with a buffering time. A sensitivity analysis showed that the maximal and mean absolute temperature differences for representative days were smaller than 0.35 °C and 0.2 °C between with two and five buffering days, which concluded that a buffering time of two days is sufficient in this case study. Thus each simulation includes the two days ahead of the representative day (72 h in total) to obtain more precise simulation results.
The ground in the simulated area mainly contains four types of ground profiles: the sidewalk, the built area, the green space and the asphalt concrete road. The compositions of the ground profiles are from [30] and listed in Table 2.
The initial temperature and the relative humidity for the four layers of the soil are also needed: upper layer (0–20 cm), middle layer (20–50 cm), deep layer (50–200 cm) and bedrock layer (below 200 cm). Assuming the soil is semi-infinite and with unique physical properties, the soil temperatures were estimated by the method from Thiers [41]. The corresponding soil relative humidities of the four layers in ENVI-met were calculated from Wu et al. [42]. They are summarised in Table 3.
It should be noted that the density of the plants’ leaves varies with the season in the simulation. Considering the aim of ENVI-met simulation is to obtain the outdoor air temperature, instead of the indoor thermal comfort or other parameters concerning the building envelope, the building’s envelope configuration is not as important as other configurations, especially in a “one-way” coupling method. Therefore, the envelope characteristics of all the buildings were set to be identical, as shown in Table 4. The initial indoor temperature of the buildings in the beginning of the simulation (including the buffering time) was set in ENVI-met. Considering the DBES configurations presented in Section 3.3, the studied building was simulated with the original EPW file in a first step. Then, the initial indoor temperatures of the whole building for the four representative days were set as the volume average of all thermal zones: 24.8 °C, 26 °C, 18.2 °C and 18 °C for av-spring, ex-summer, av-autumn and ex-winter, respectively. They were kept constant during the simulation and identical for all other buildings in the district.
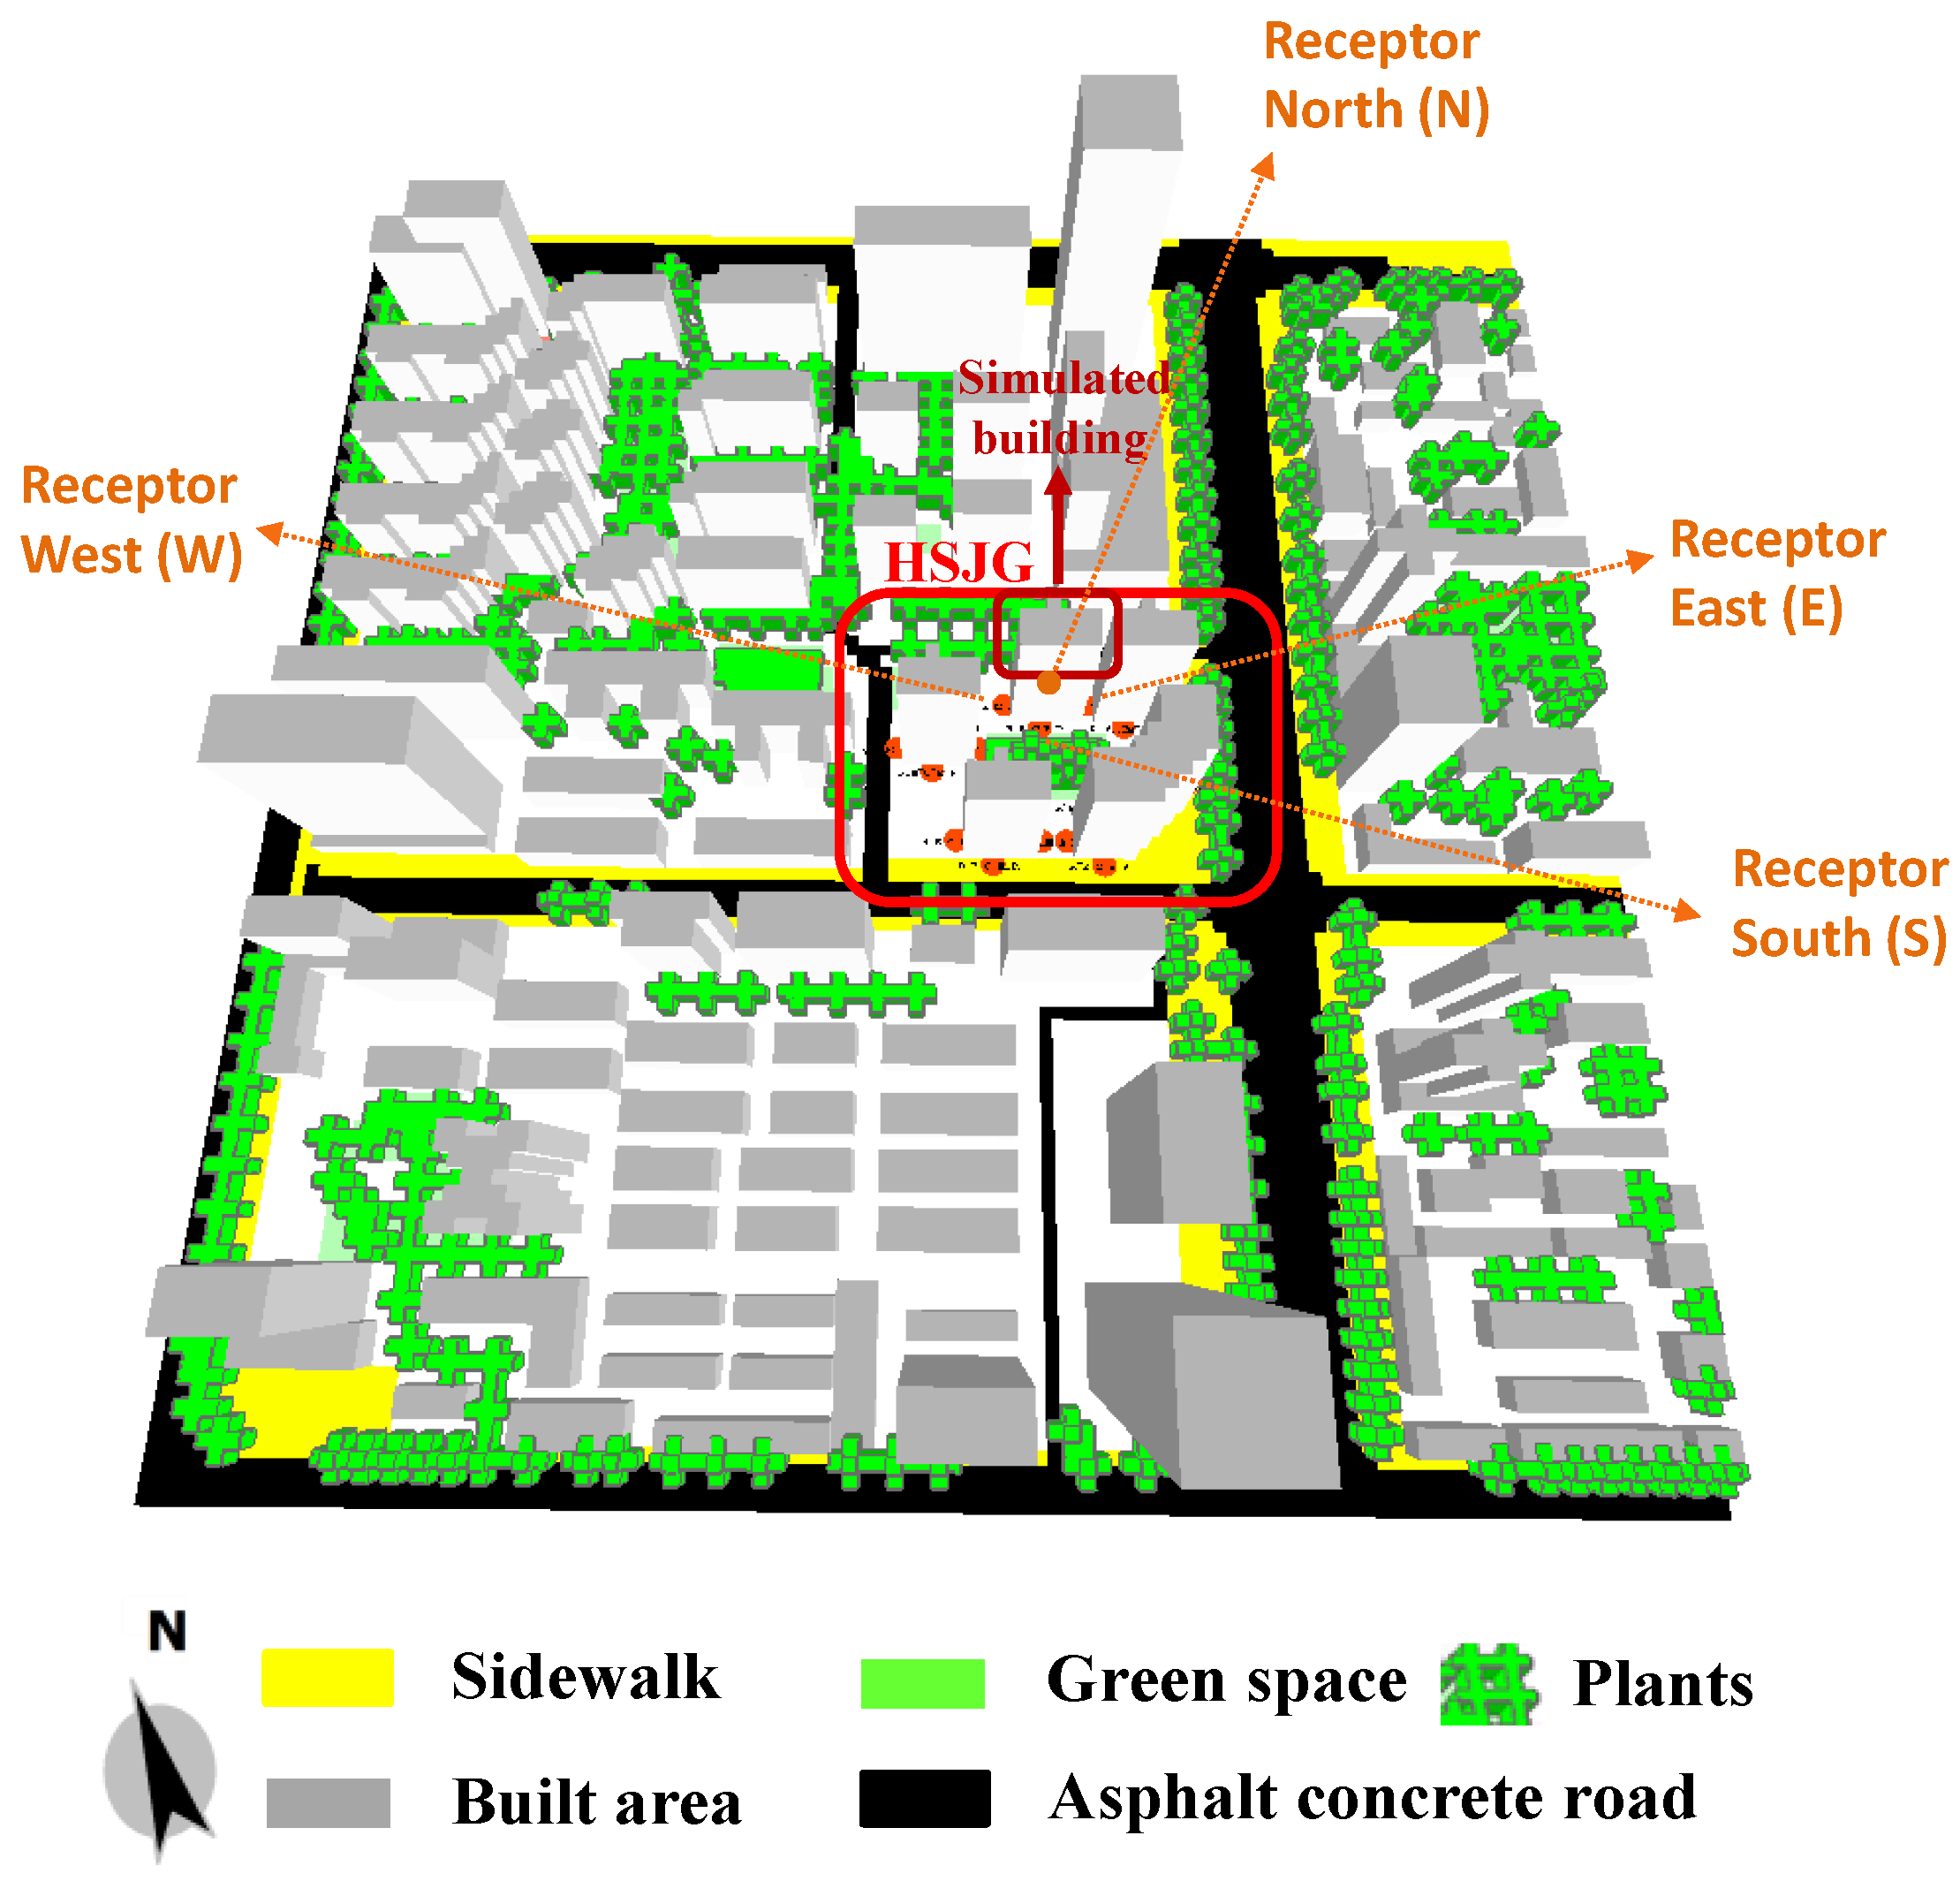
Receptors are the selected points inside the model area, where processes in the atmosphere and the soil are monitored in detail. They record the detailed simulation results for each height of the node on the vertical axis. As introduced in Section 2.2, in order to analyse the effects of the orientation on the building’s energy performance, four receptors located at 3 m away from the simulated building’s four facades were used: north (N), west (W), south (S) and east (E). The whole 3D model and the receptors are shown in Figure 5.

3.3. DBES Configuration

According to the Chinese building energy standards [43], the heating and cooling thermostat setpoints are 18 °C and 26 °C for the whole year. The natural ventilation is 1 ach (air change per hour) because residents in Wuhan prefer opening windows for ventilation; an additional 0.2 ach accounts for the infiltration ventilation. The internal heat gain is 4.3 W/m2 for the whole time. The occupancy is 0.02 person/m2 from 8h00 to 17h00 from Monday to Friday, and the rest of the time it is 0.04 person/m2.
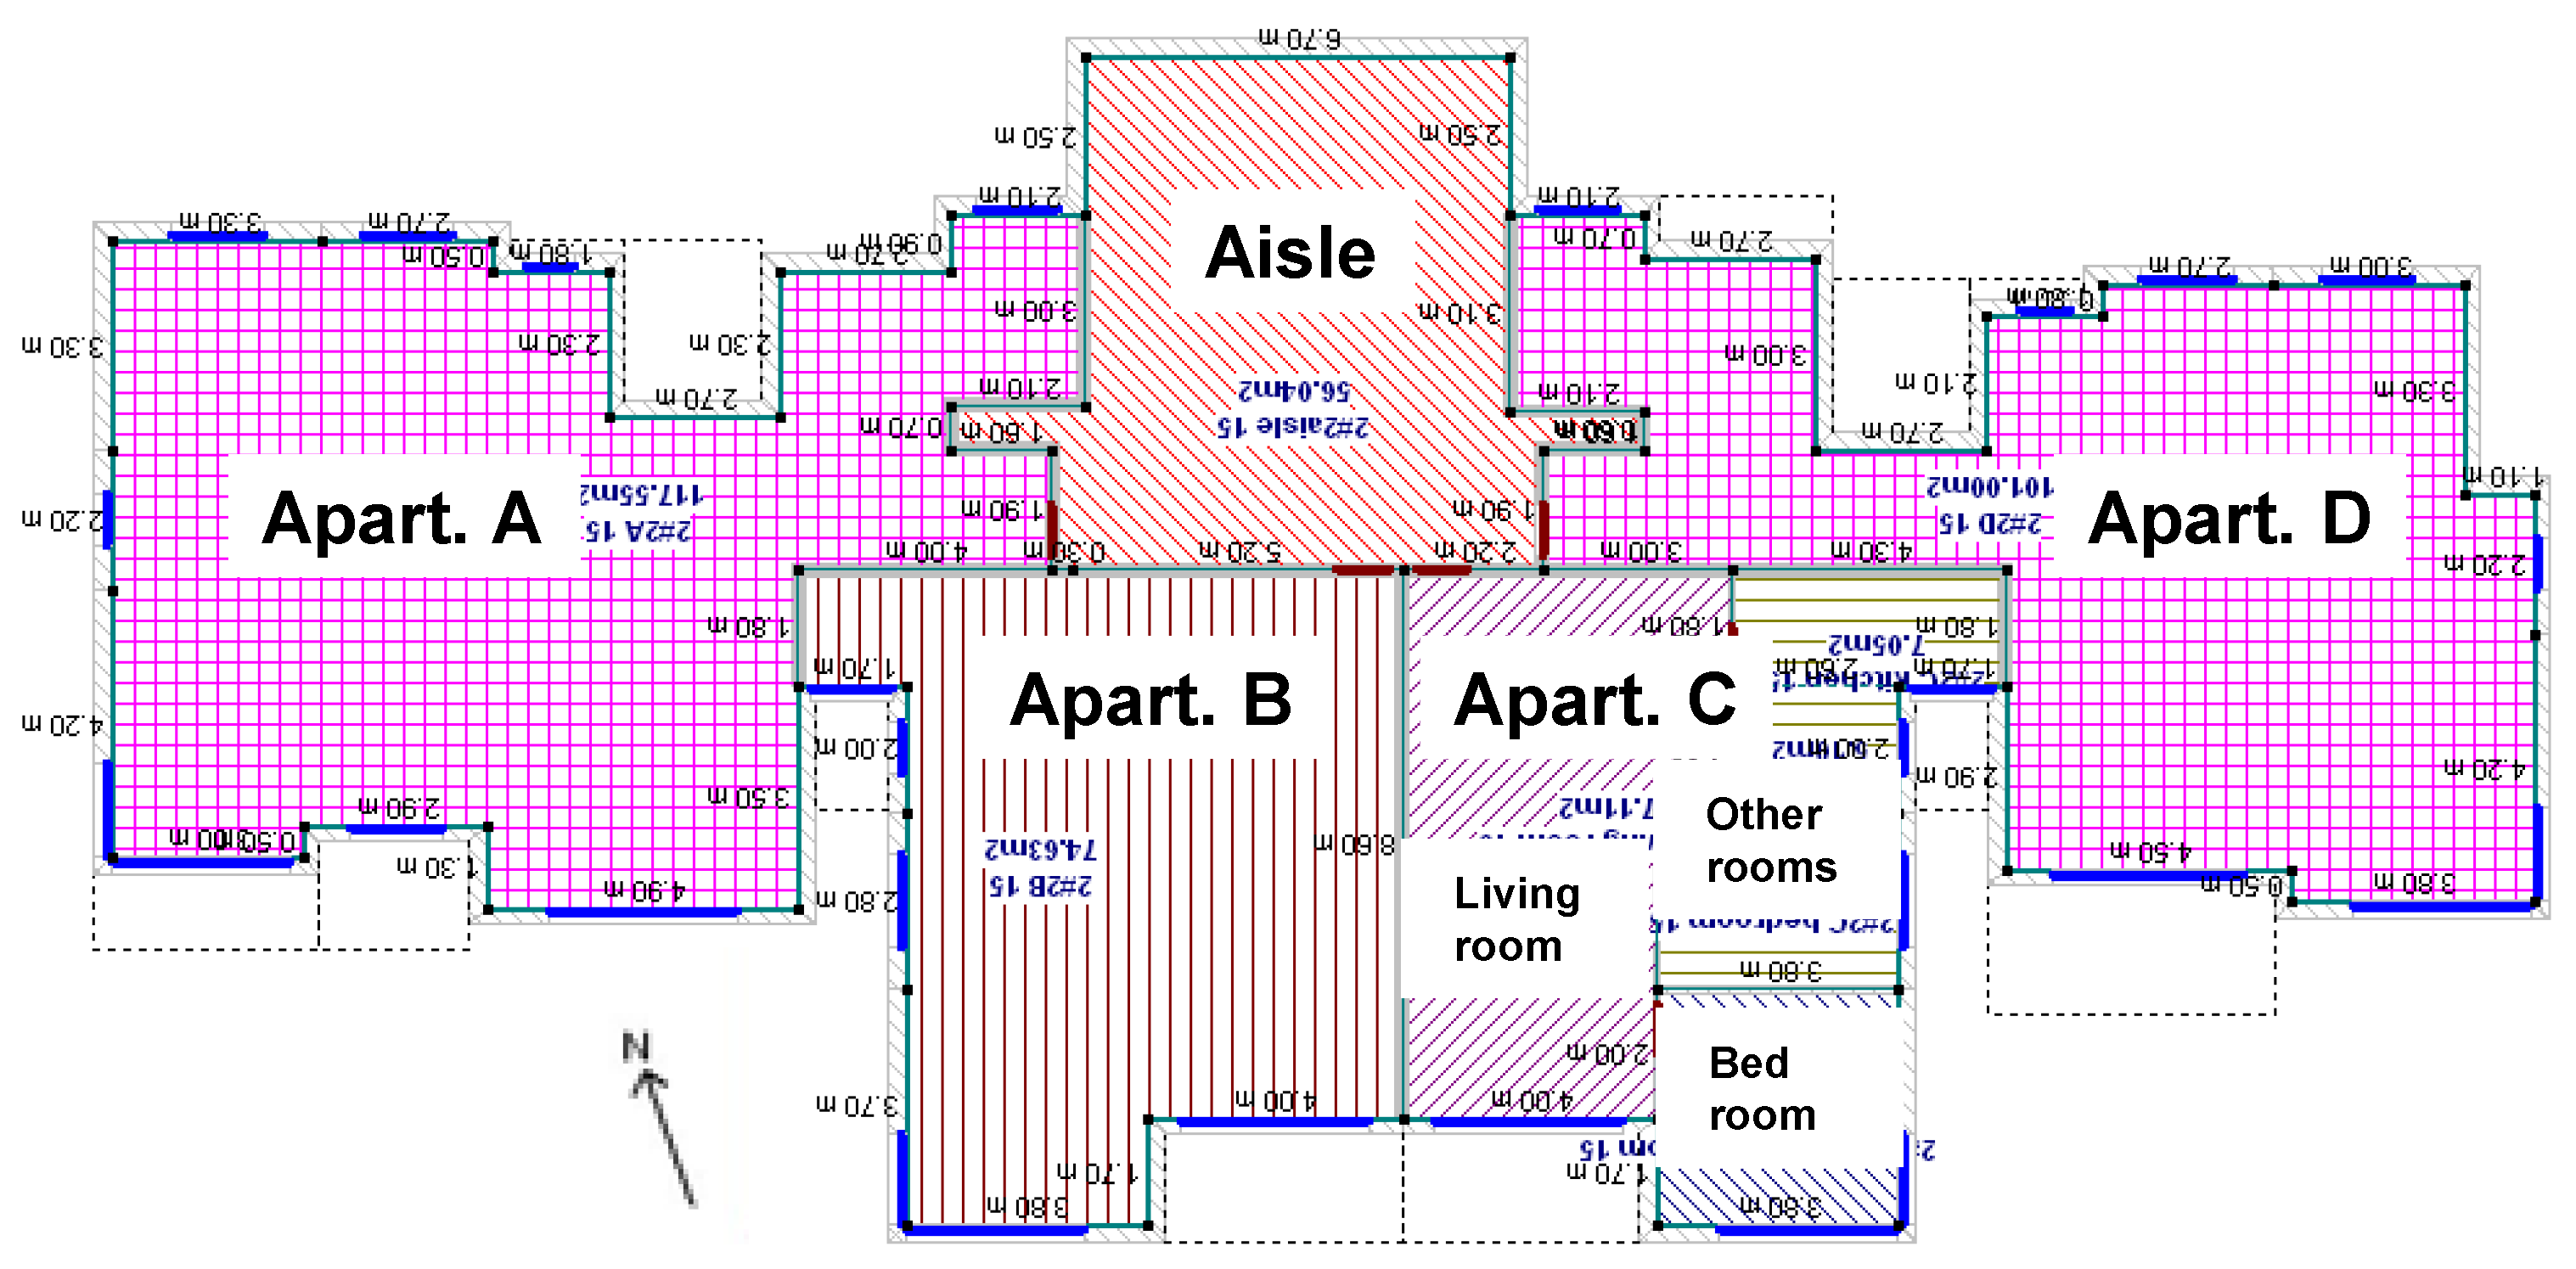
In the studied building, each floor consists of four apartments named A, B, C, D (from west to east) and aisle. The 15th floor plan of building #2.2 is shown in Figure 6 as an example, and the plan of each floor is similar. The areas surrounded by dotted lines are the balconies functioning as integrated shadings in the simulation. Windows and doors are shown in blue and brown lines on the walls, respectively. The building was divided into 17 thermal zones based on height and orientation. Apartments A and D consist of the north zone and apartments B and C consist of the south zone for one or several floors. It should be noted that apartment C on the 15th floor was an exception, which contains three zones: living room, bedroom and other rooms, because experiments were conducted in a previous work [37] in this apartment and a more detailed zone definition was required. The studied case and its zones are shown in Figure 7 (blue and grey buildings are not simulated and are just considered as shading the studied building).
Combining the zone definition and the height of ENVI-met cells, six different heights were chosen for the DBES weather file generation. It should be noted that the height of one vertical cell refers to the height of its middle point in ENVI-met. Taking levels 2–6 as an example, heights range from 6 m to 18 m. The vertical cells 2 and 3 (which occupy 6–12 m and 12–18 m in the vertical direction respectively) in ENVI-met record the air temperatures at 9 m and 15 m (middle points of cells 2 and 3), which are located between level 2–6. Thus we use the average of the air temperatures at 9 m and 15 m in ENVI-met to generate the weather input file for levels 2–6 (which contain two zones). Considering four orientations (N, W, S, E) and six heights (from #1 to #6), 24 DBES weather files were generated as inputs for the energy simulation, as illustrated in Table 5. The abbreviation of one file can be expressed by orientation#height number (e.g., N#1).
The 17 abovementioned thermal zones of the building are presented in Table 6. Based on the zone definition (Figure 6), the south zones are mainly affected by the air near the south facade, and the north zones are surrounded by the air in all the four orientations. To perform a precise energy performance simulation, the loads of each zone are calculated using the meteorological files according to the orientation and height, as shown in Table 6. The heating/cooling load of the north is the average of the corresponding simulation results from the four weather files of N, S, W and E. For the south zone, it is directly the simulation results from weather file S.

4. Results and Discussion

4.1. Microclimate Simulation Results

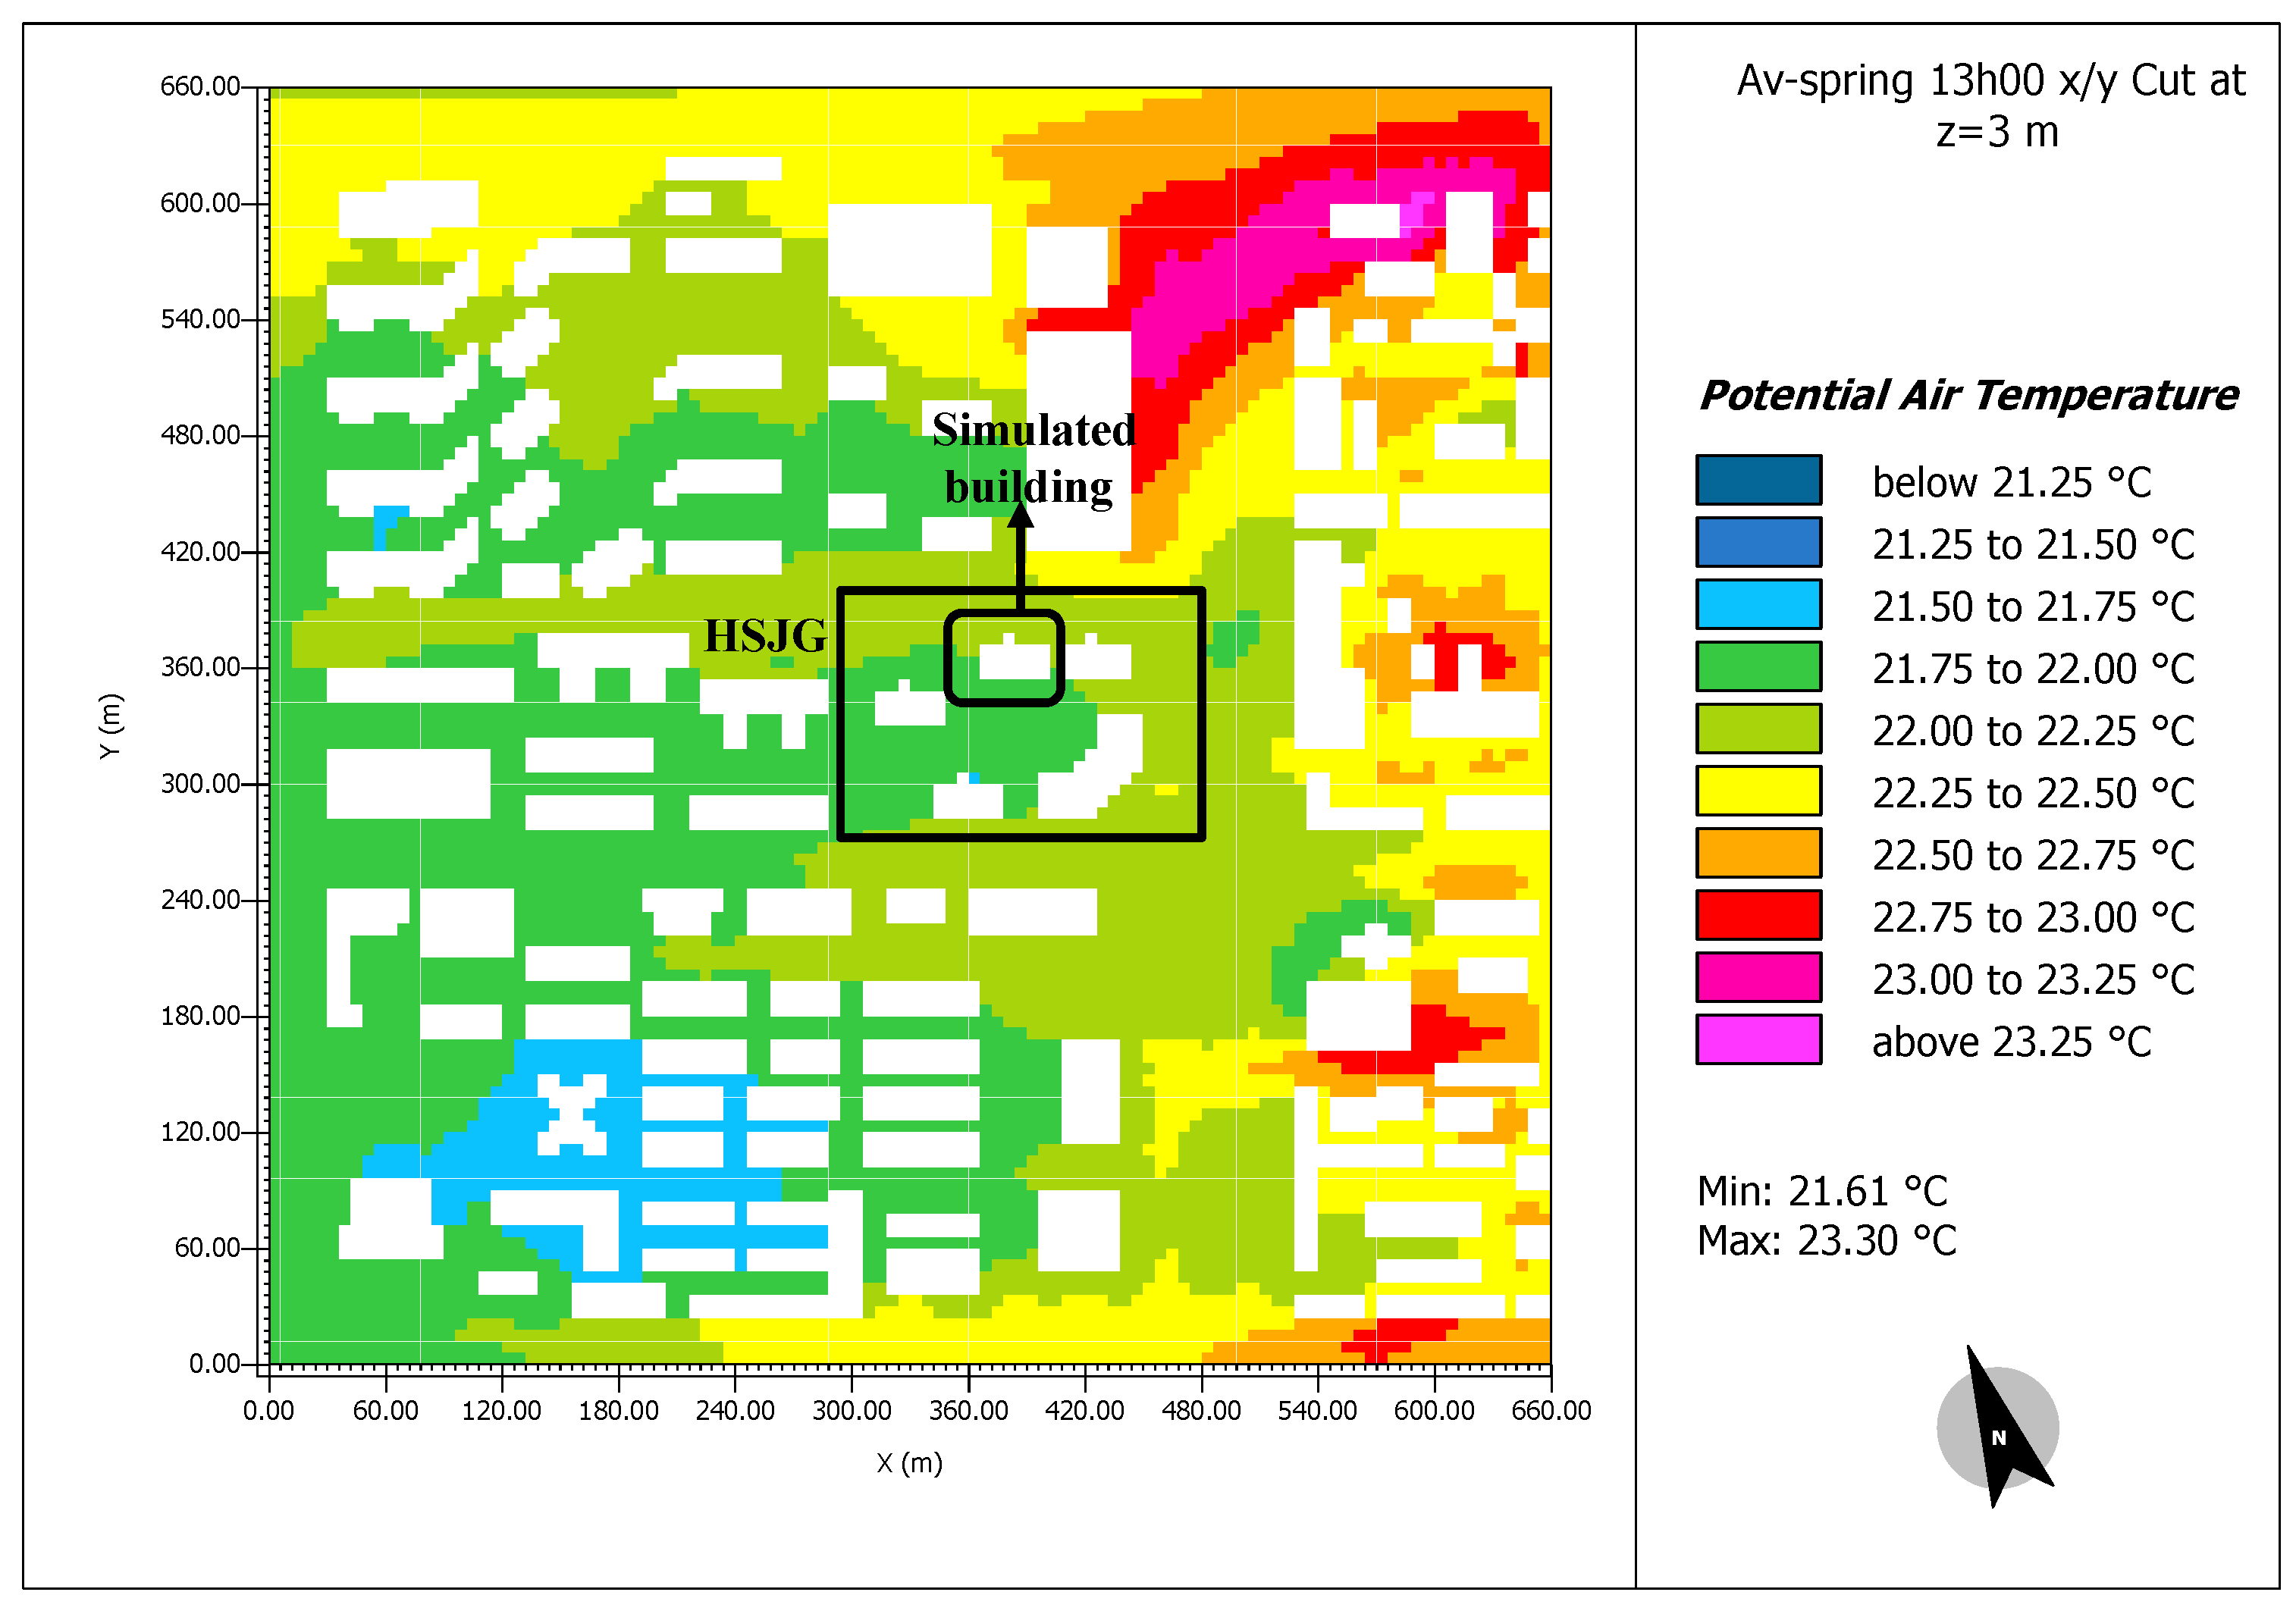
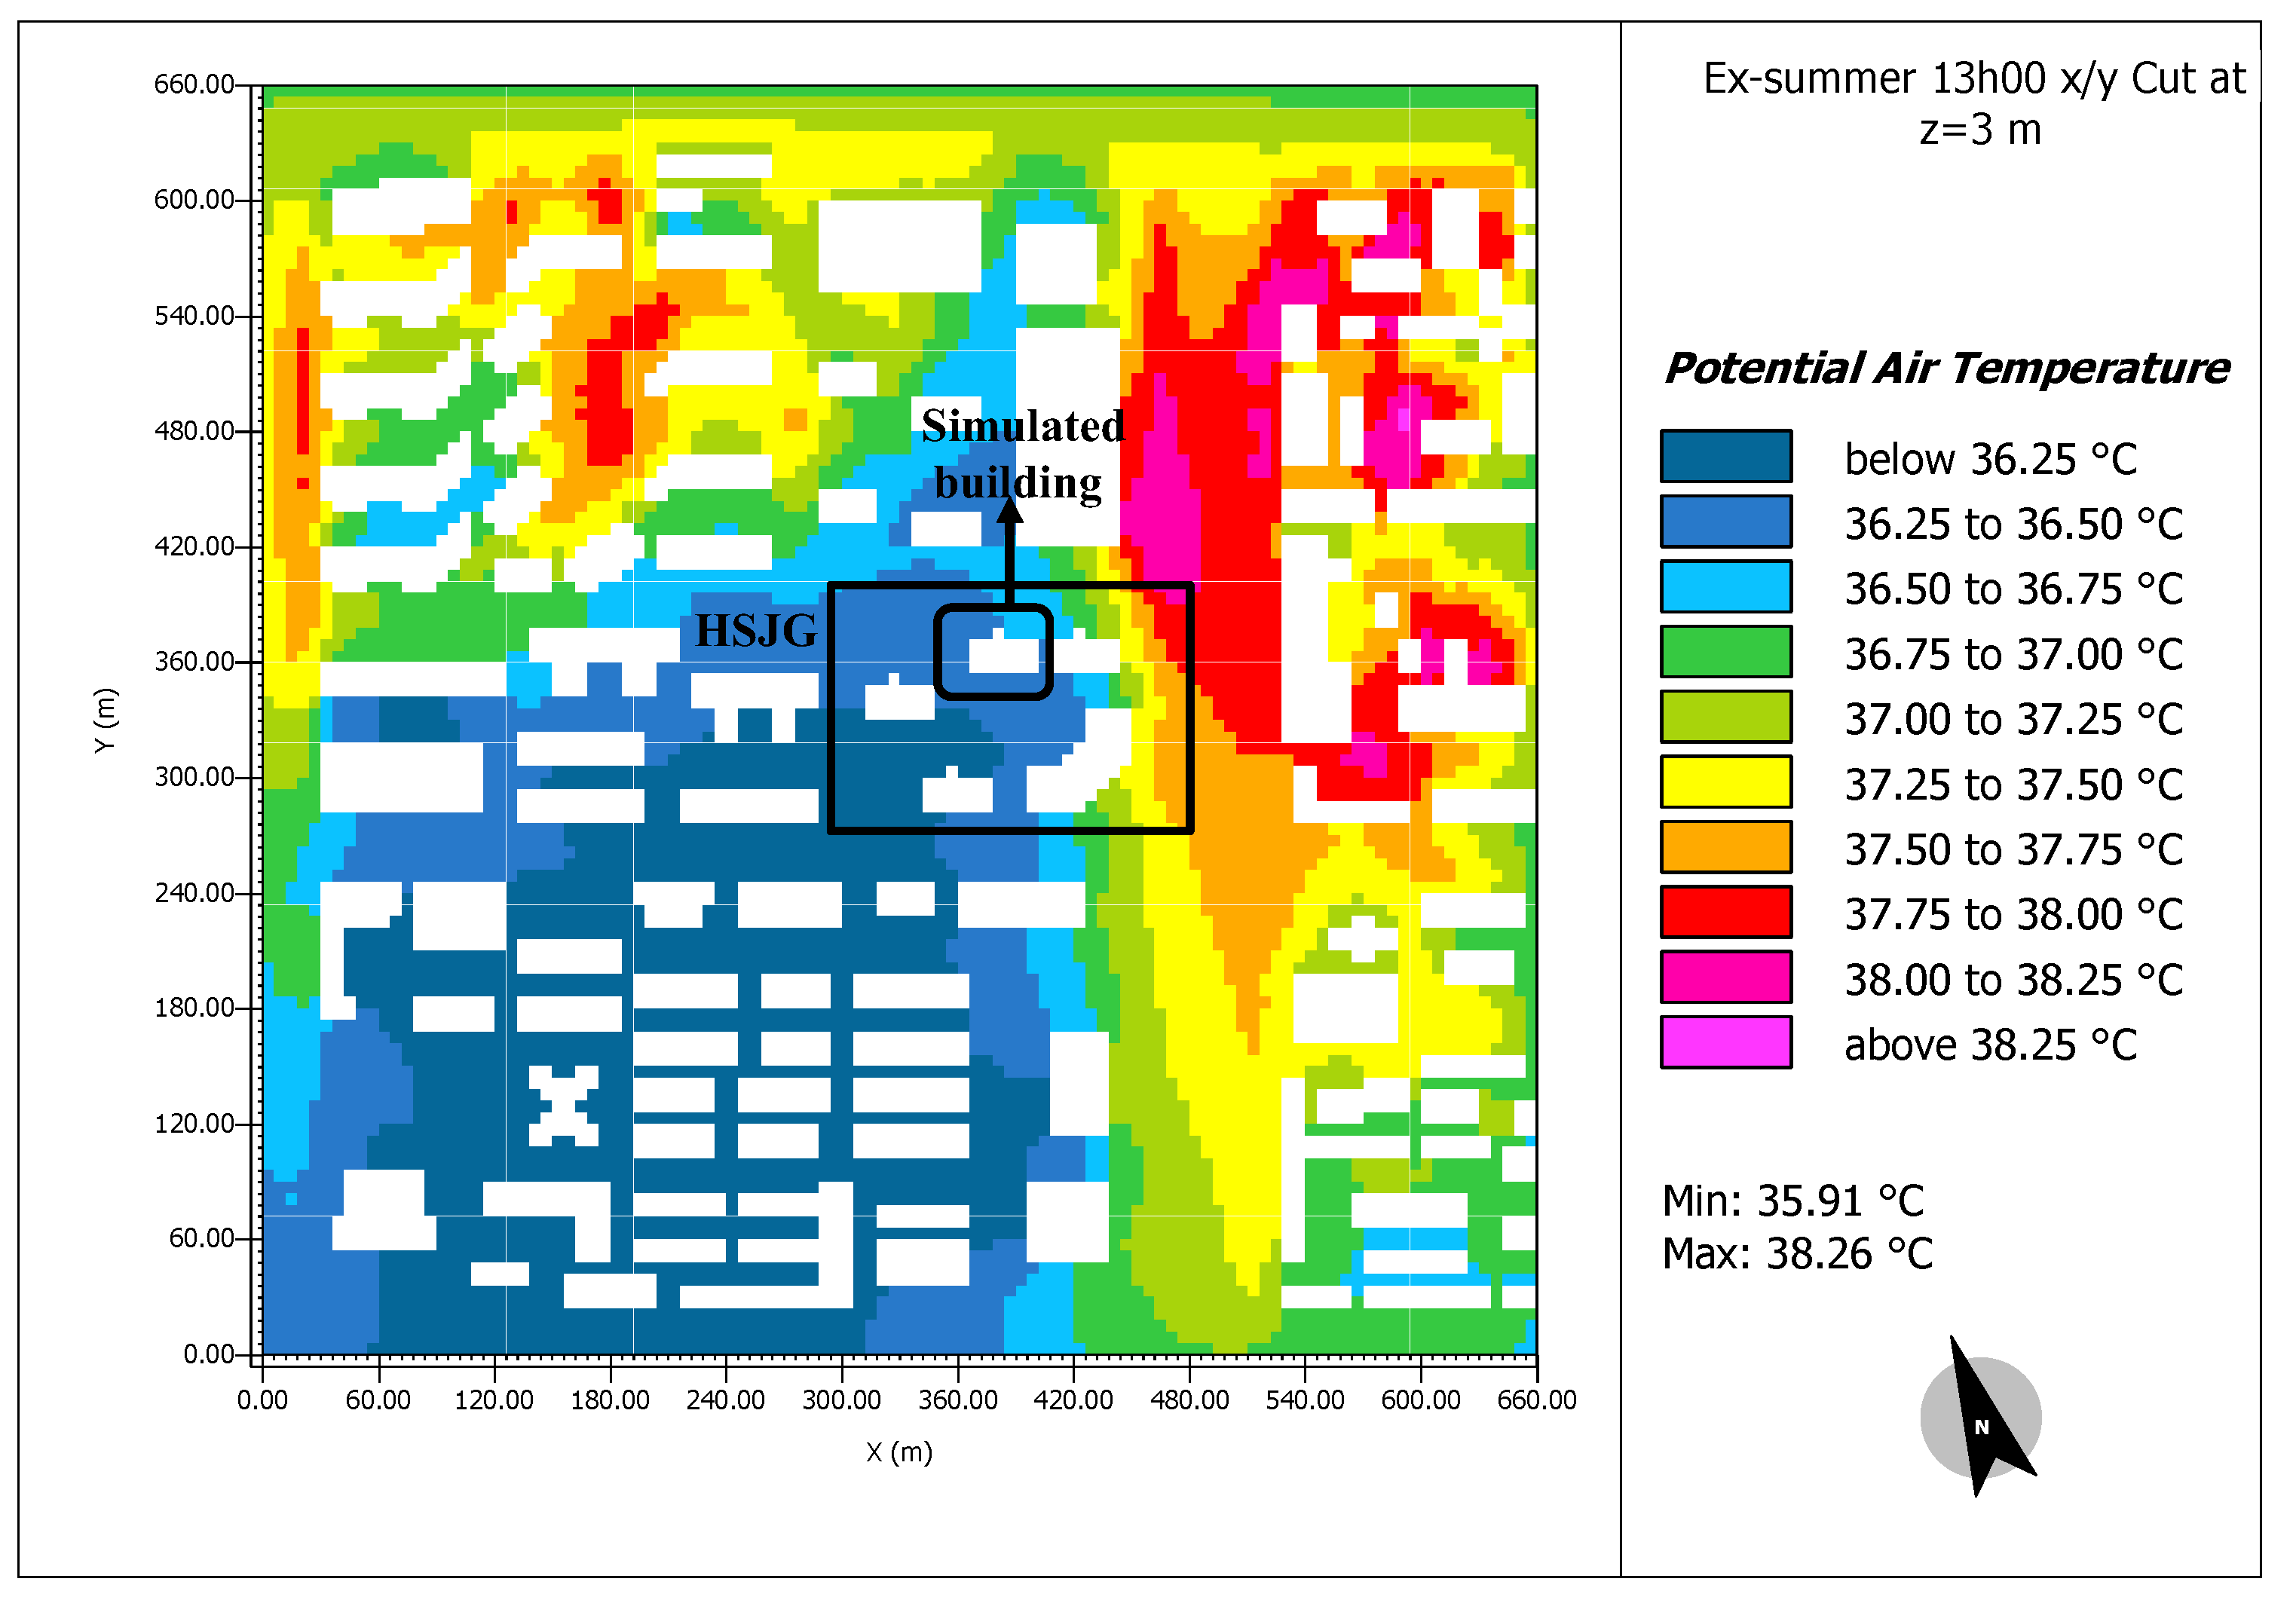
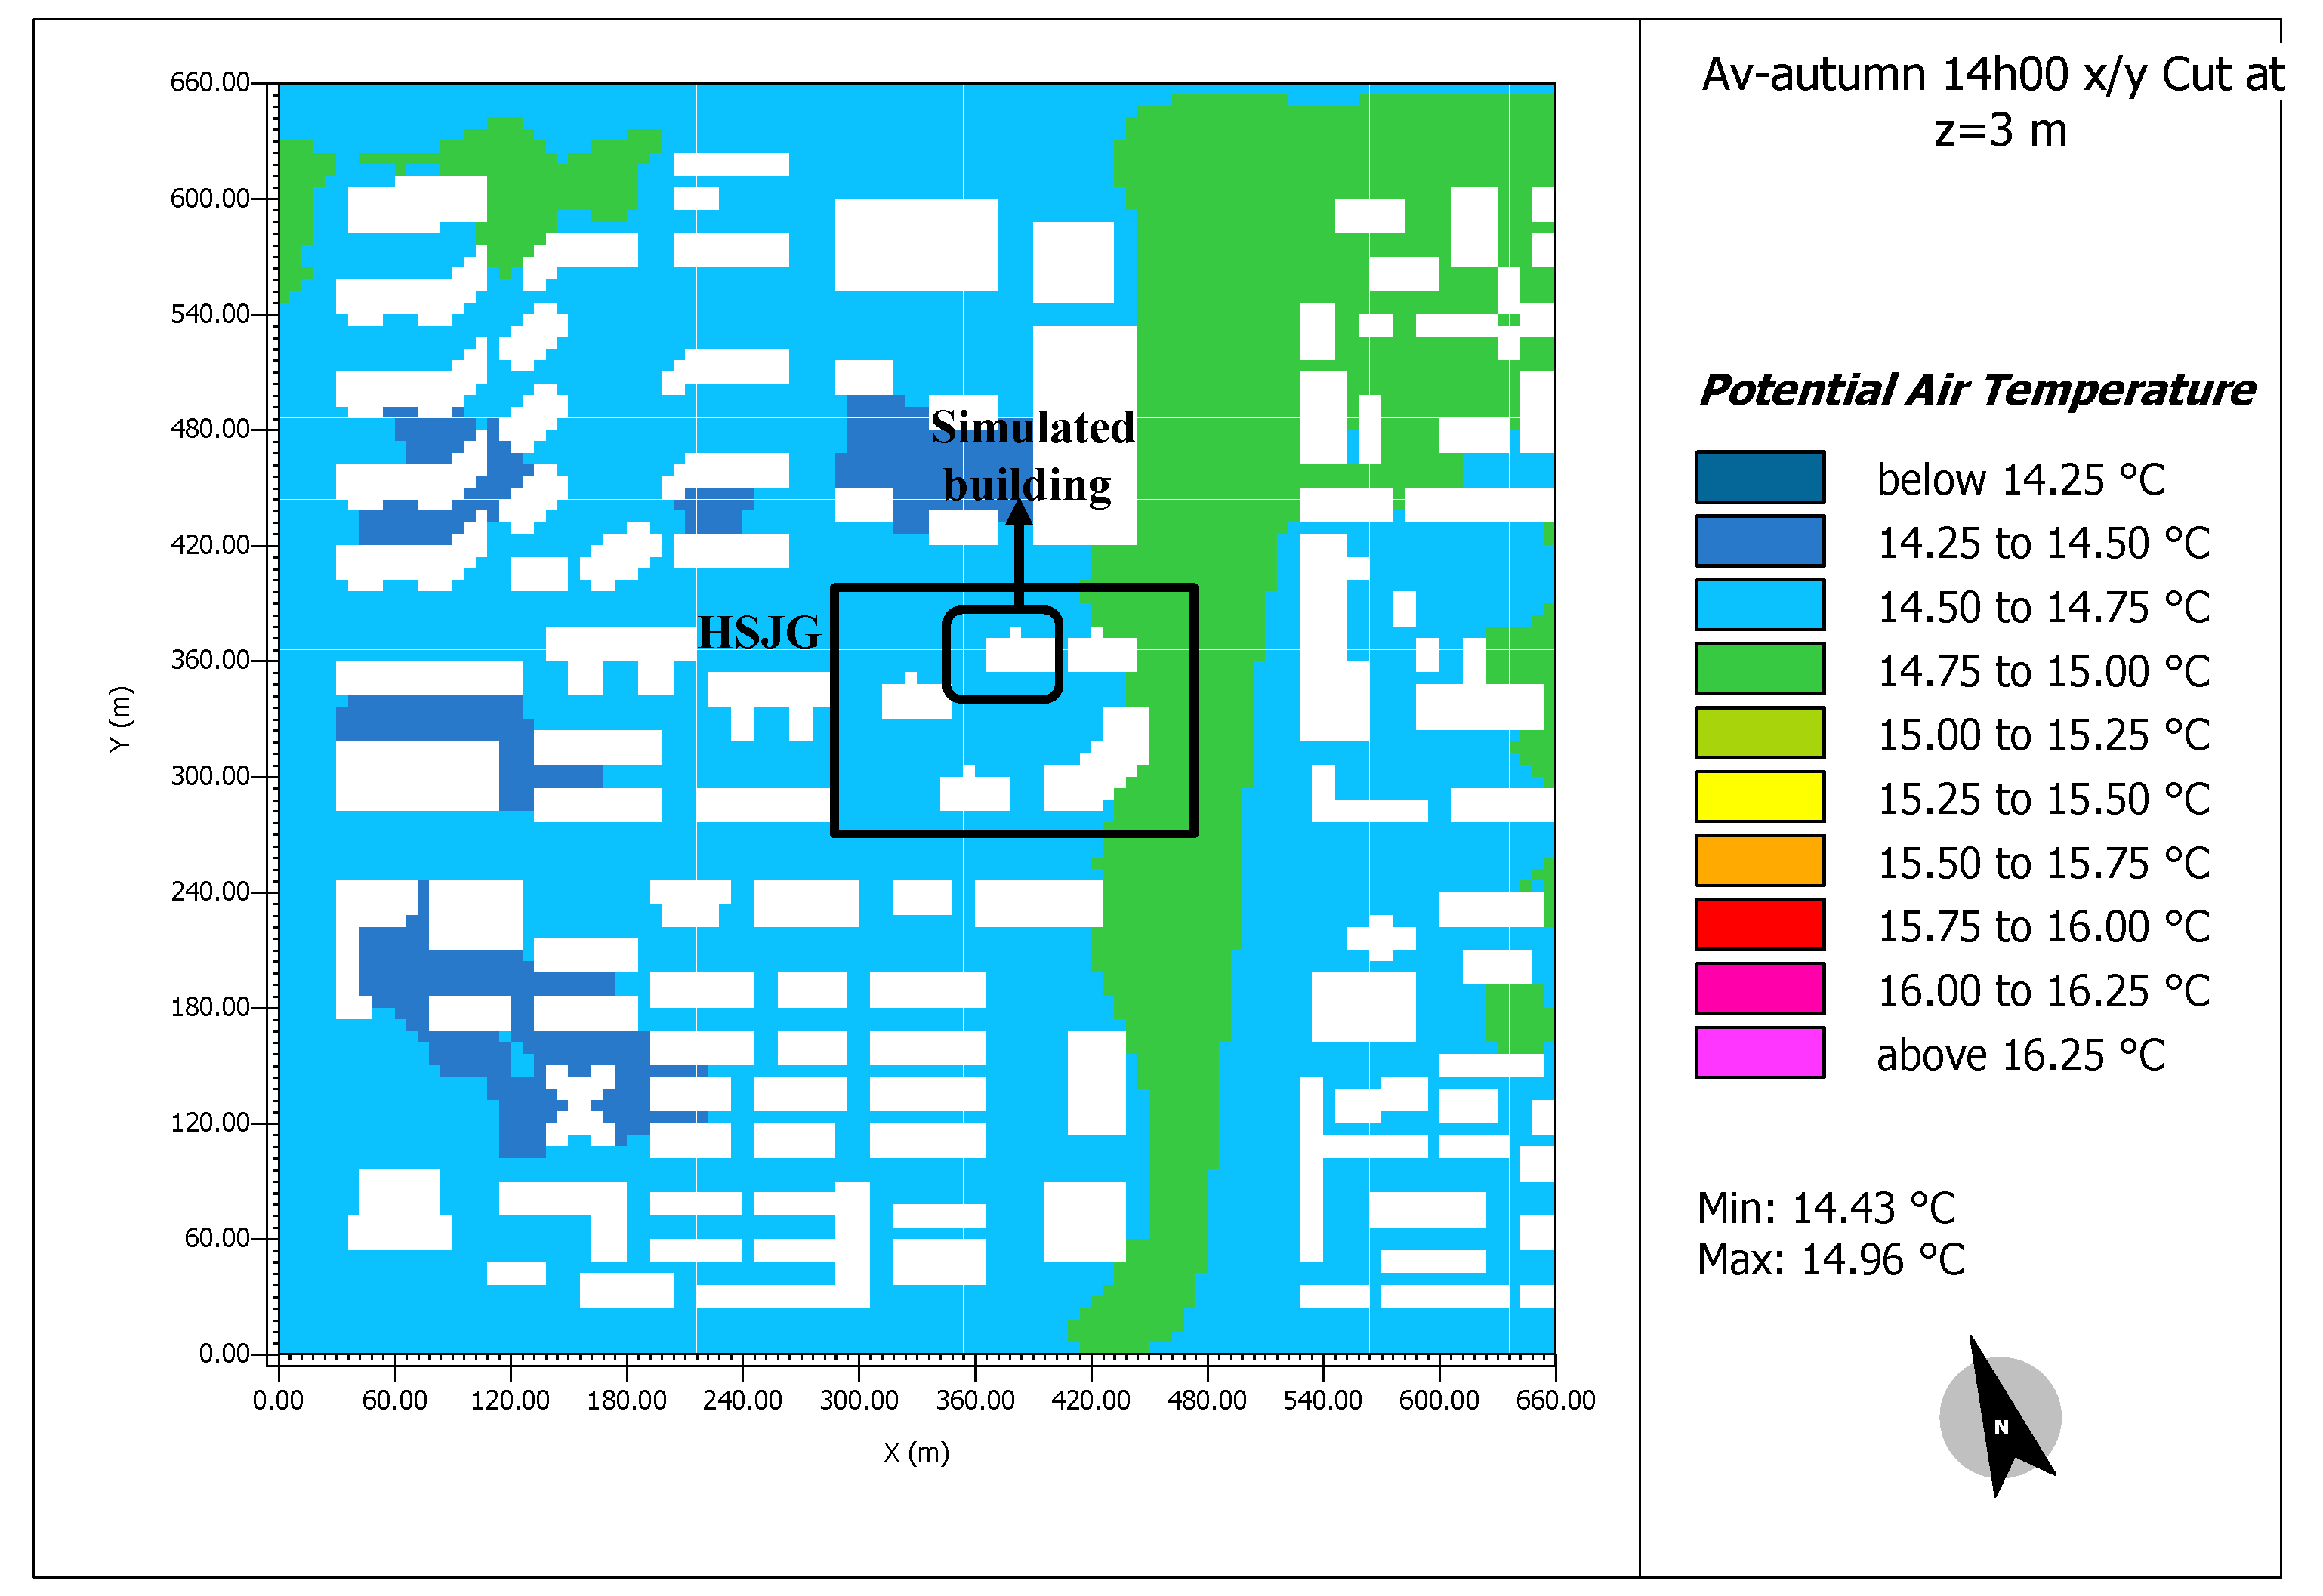
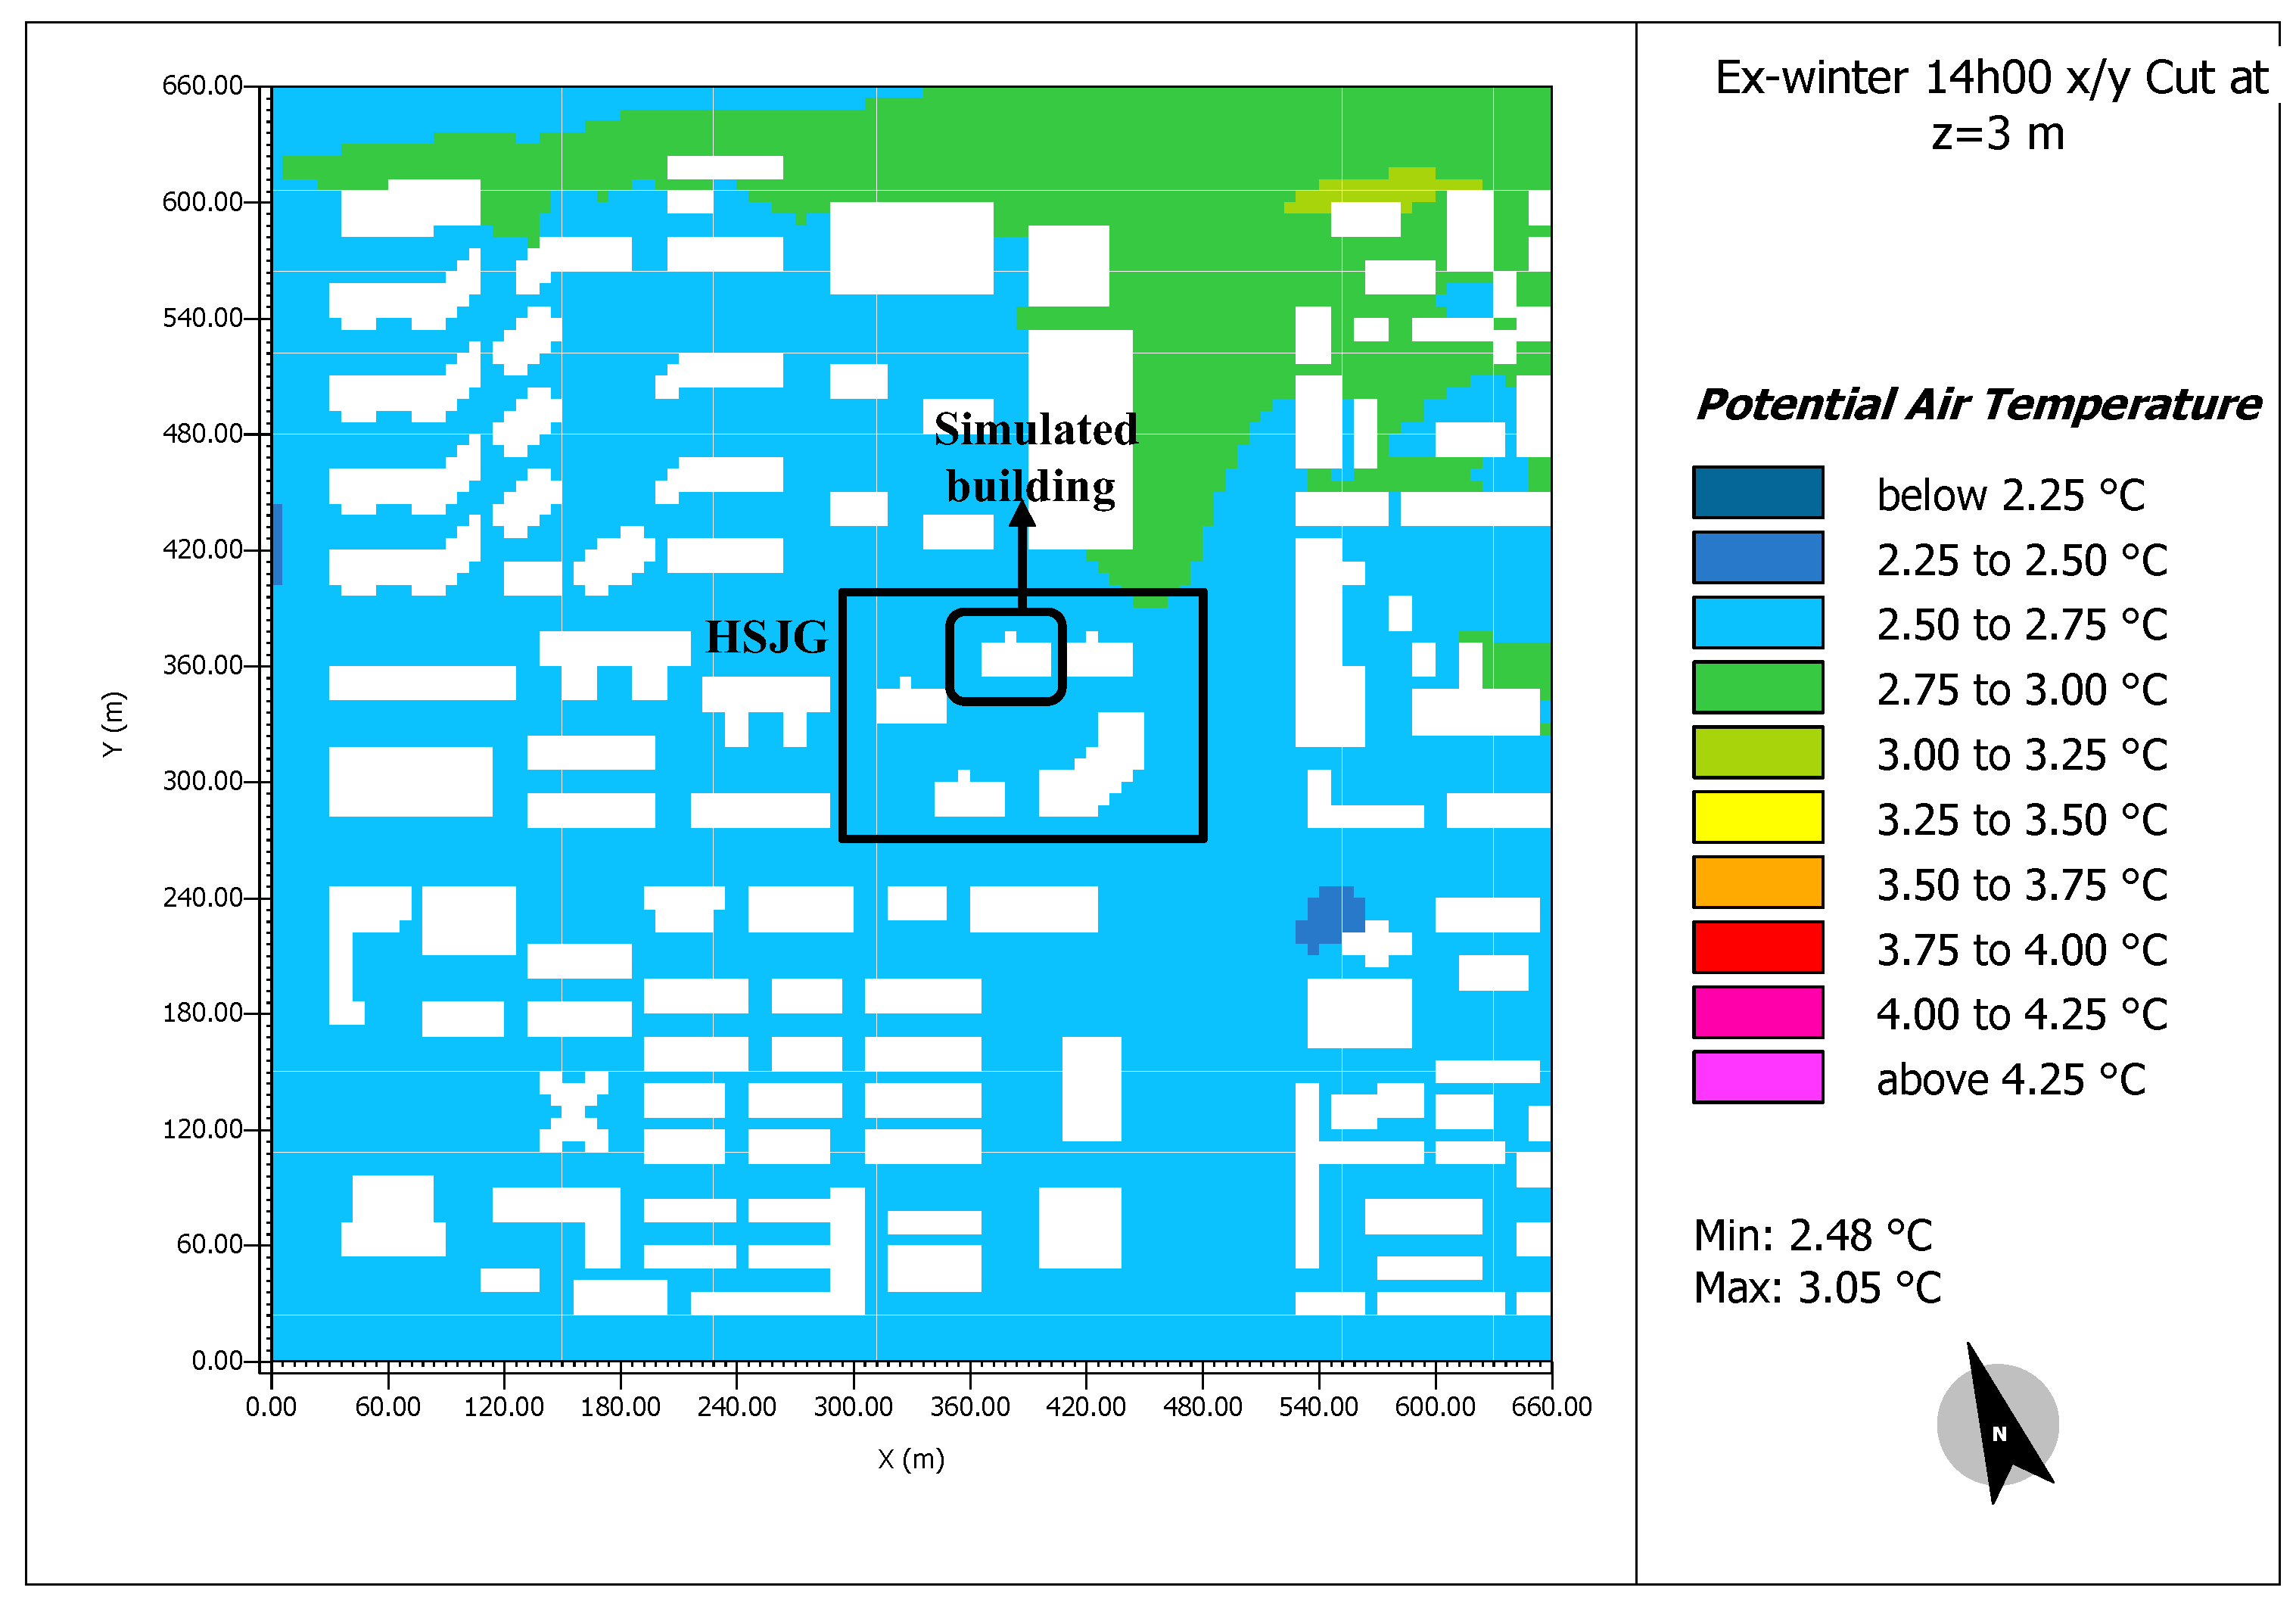
Figure 8, Figure 9, Figure 10 and Figure 11 show the potential air temperature maps of the simulated region for the four representative days at the height of 3 m at 13h00 (av-spring and ex-summer) and 14h00 (av-autumn and ex-winter) when the maximum UHIIs are observed. The whole simulation time for one representative day on a standard computer with an Intel i7-6700 CPU and 16 GB RAM is around 72 h (including the simulation of the buffering time of two days). The northeast region containing the asphalt road and the southwest region, respectively, show the highest and lowest UHI effect on all these four days. On ex-summer and av-autumn, the UHI effect is obvious along the north–south asphalt road; the north part has a stronger UHI effect. The temperature surrounding HSJG can vary over 1.5 °C on ex-summer, particularly higher on the side of the north–south asphalt road, but on other days the temperature difference is not very large (<0.5 °C). It should be noted that the representative day for spring is in June, resulting a higher air temperature compared to autumn.

4.2. UHI Results for the Four Representative Days

The heat island effect can be quantitatively described by UHII:
UHII = T air , ENVImet T air , EPW  
where Tair,ENVImet is the air temperature (°C) converted from the potential air temperature in the ENVI-met simulation and Tair,EPW is the air temperature (°C) in the EPW file.
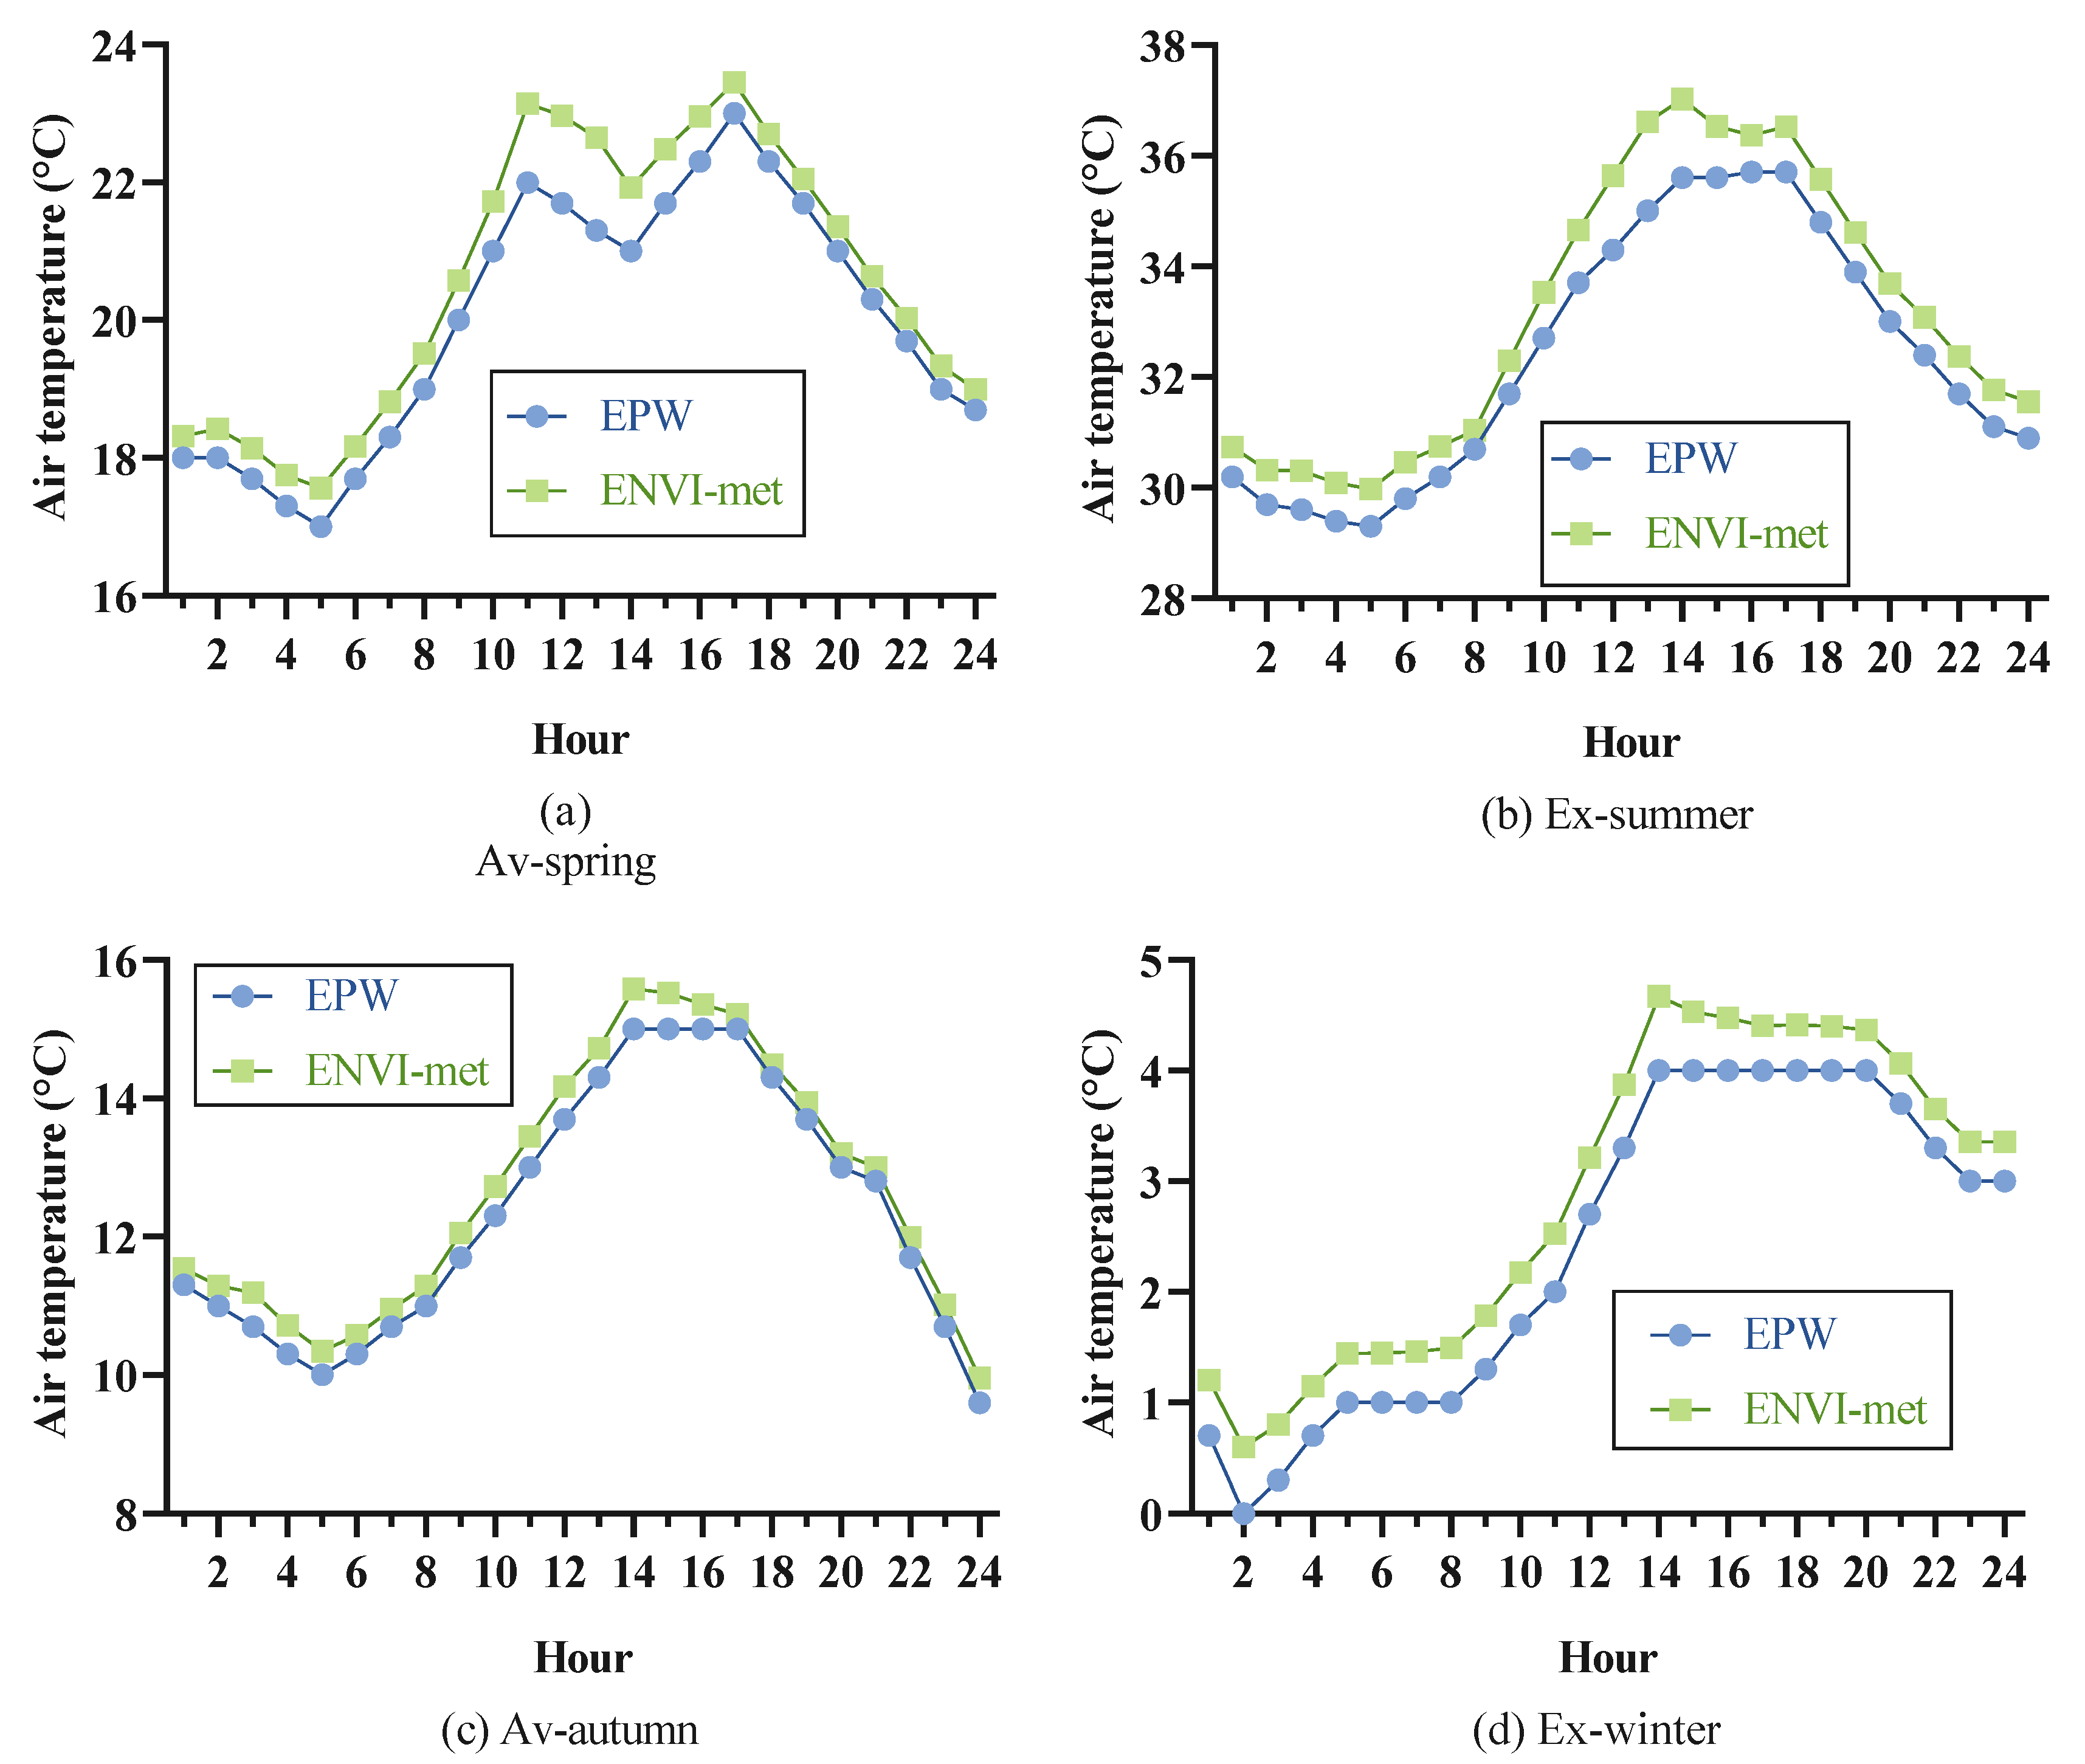
The air temperature at the height of 3 m of the north receptor is shown in Figure 12. For the four representative days, all the simulated air temperatures are higher than the input air temperatures. The maximal UHII occurs around 13h00 for av-spring and ex-summer and 14h00 for av-autumn and ex-winter. The hourly average UHII (UHIIav) and maximal UHII (UHIImax) of these representative days are listed in Table 7. It can be inferred that the largest UHIImax occurs on the extreme hot summer day and the smallest UHIImax occurs on the average autumn day. For the average UHII during one day, it is observed that ex-summer > av-spring > ex-winter > av-autumn.
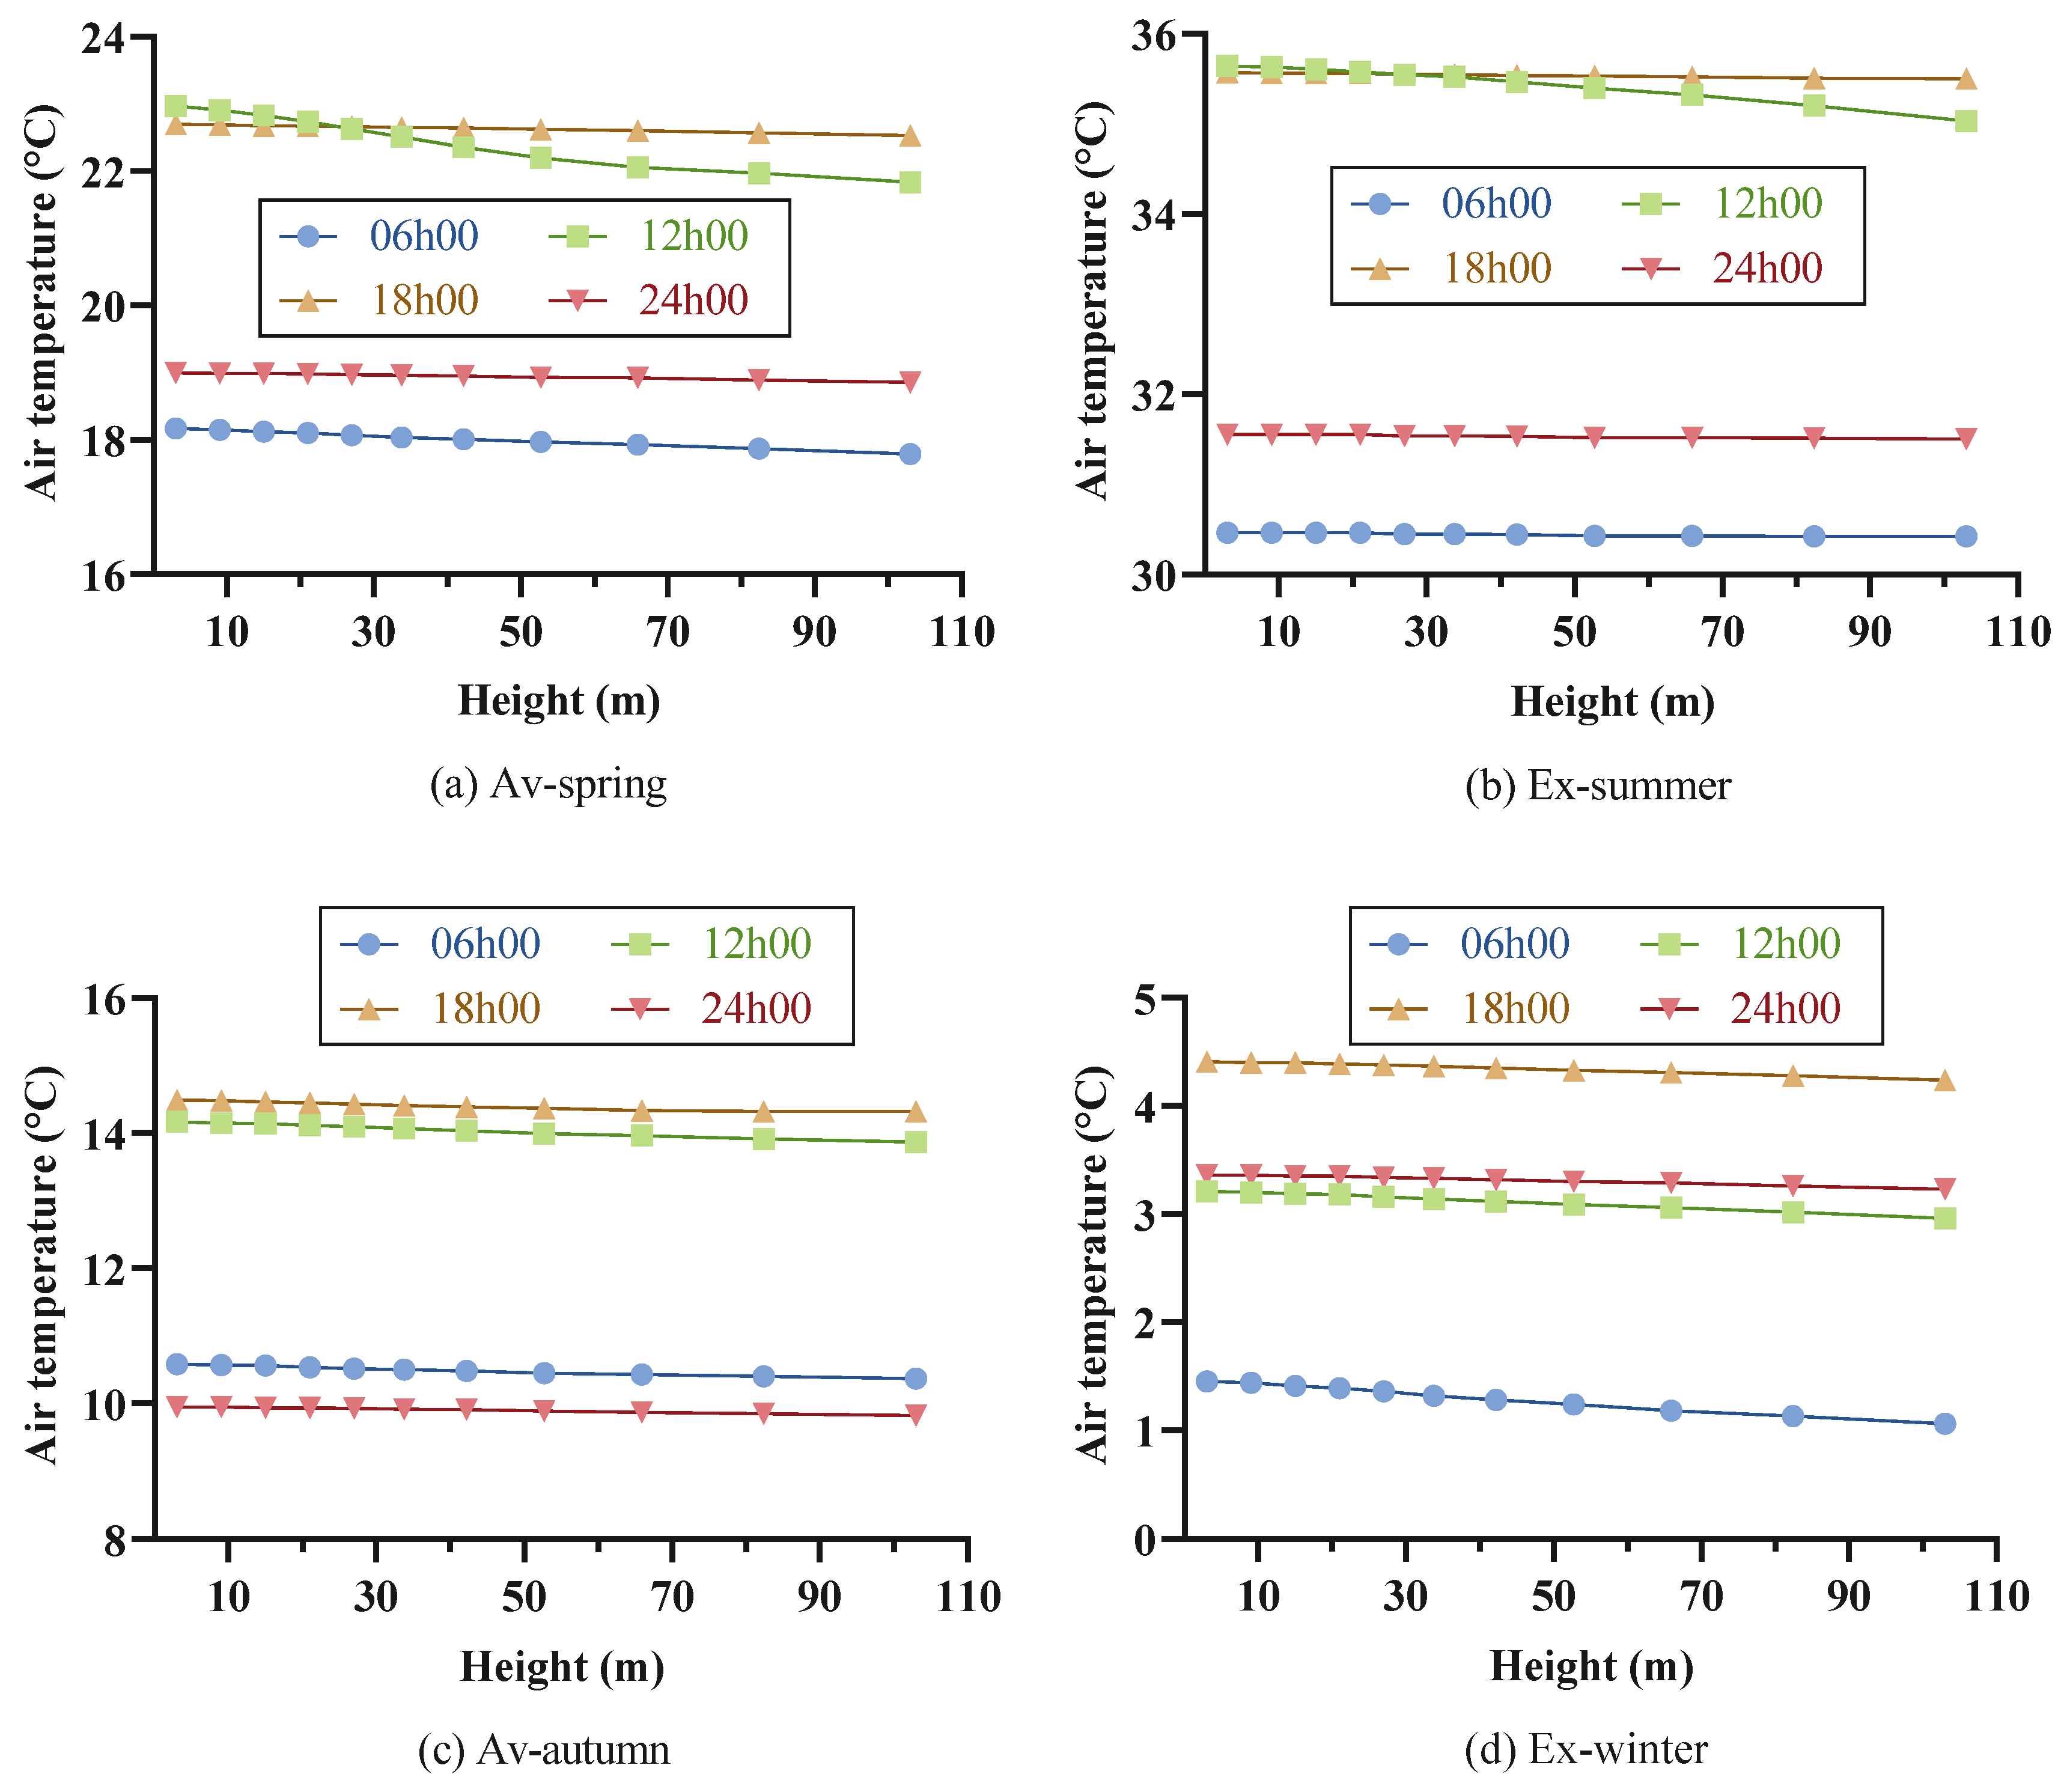
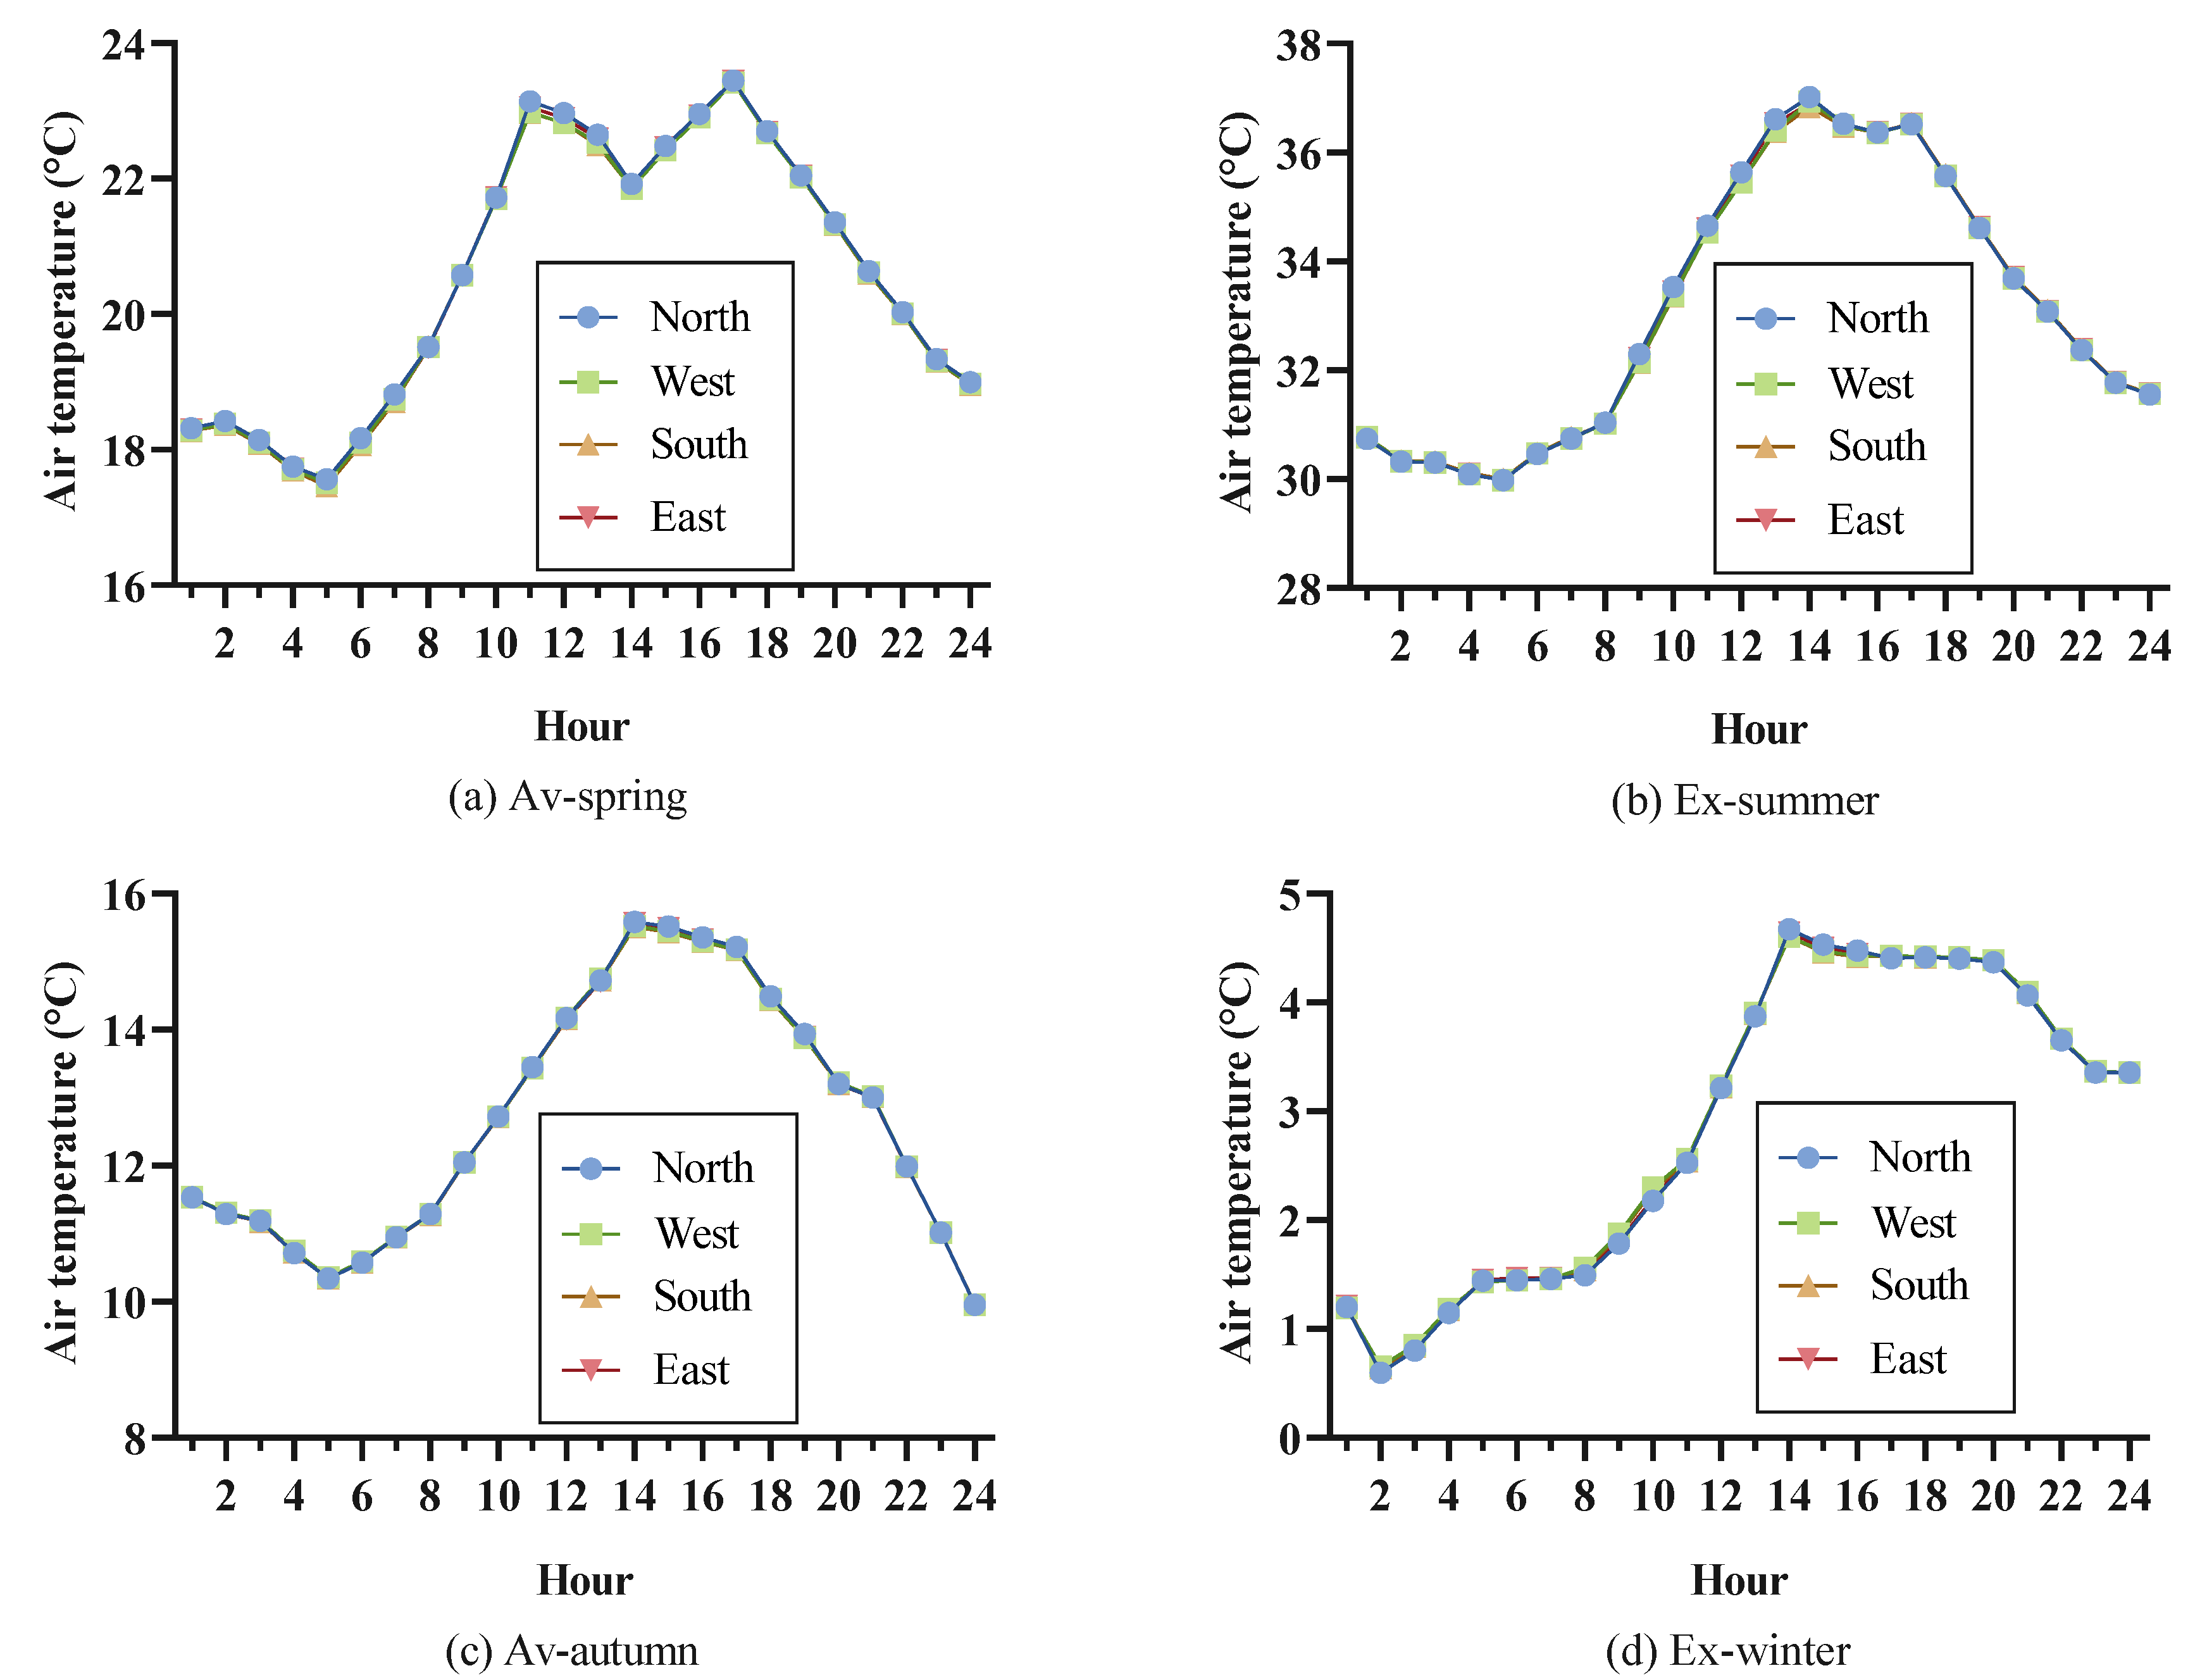
The air temperature along the height of the north receptor was investigated, as shown in Figure 13. In general, the air temperature decreases with the height. If the UHII is larger (e.g., 12h00 on av-spring), the air temperature decreases more sharply. The air temperature at the height #1 (3 m) is 1.1 °C higher than at height #6 (103 m). A more accurate building energy simulation should include the air temperature variation along the height. The air temperatures of the four orientations at 3 m are compared in Figure 14. The temperature difference is negligible for av-autumn and ex-winter for the four orientations; however the difference can be more obvious (maximal difference of 0.2 °C) from 11h00 to 14h00 on av-spring and ex-summer. This means the orientation might potentially have a larger influence on the cooling load than the heating load; it will be discussed in Section 4.4.

4.3. Generated Weather Files for COMFIE

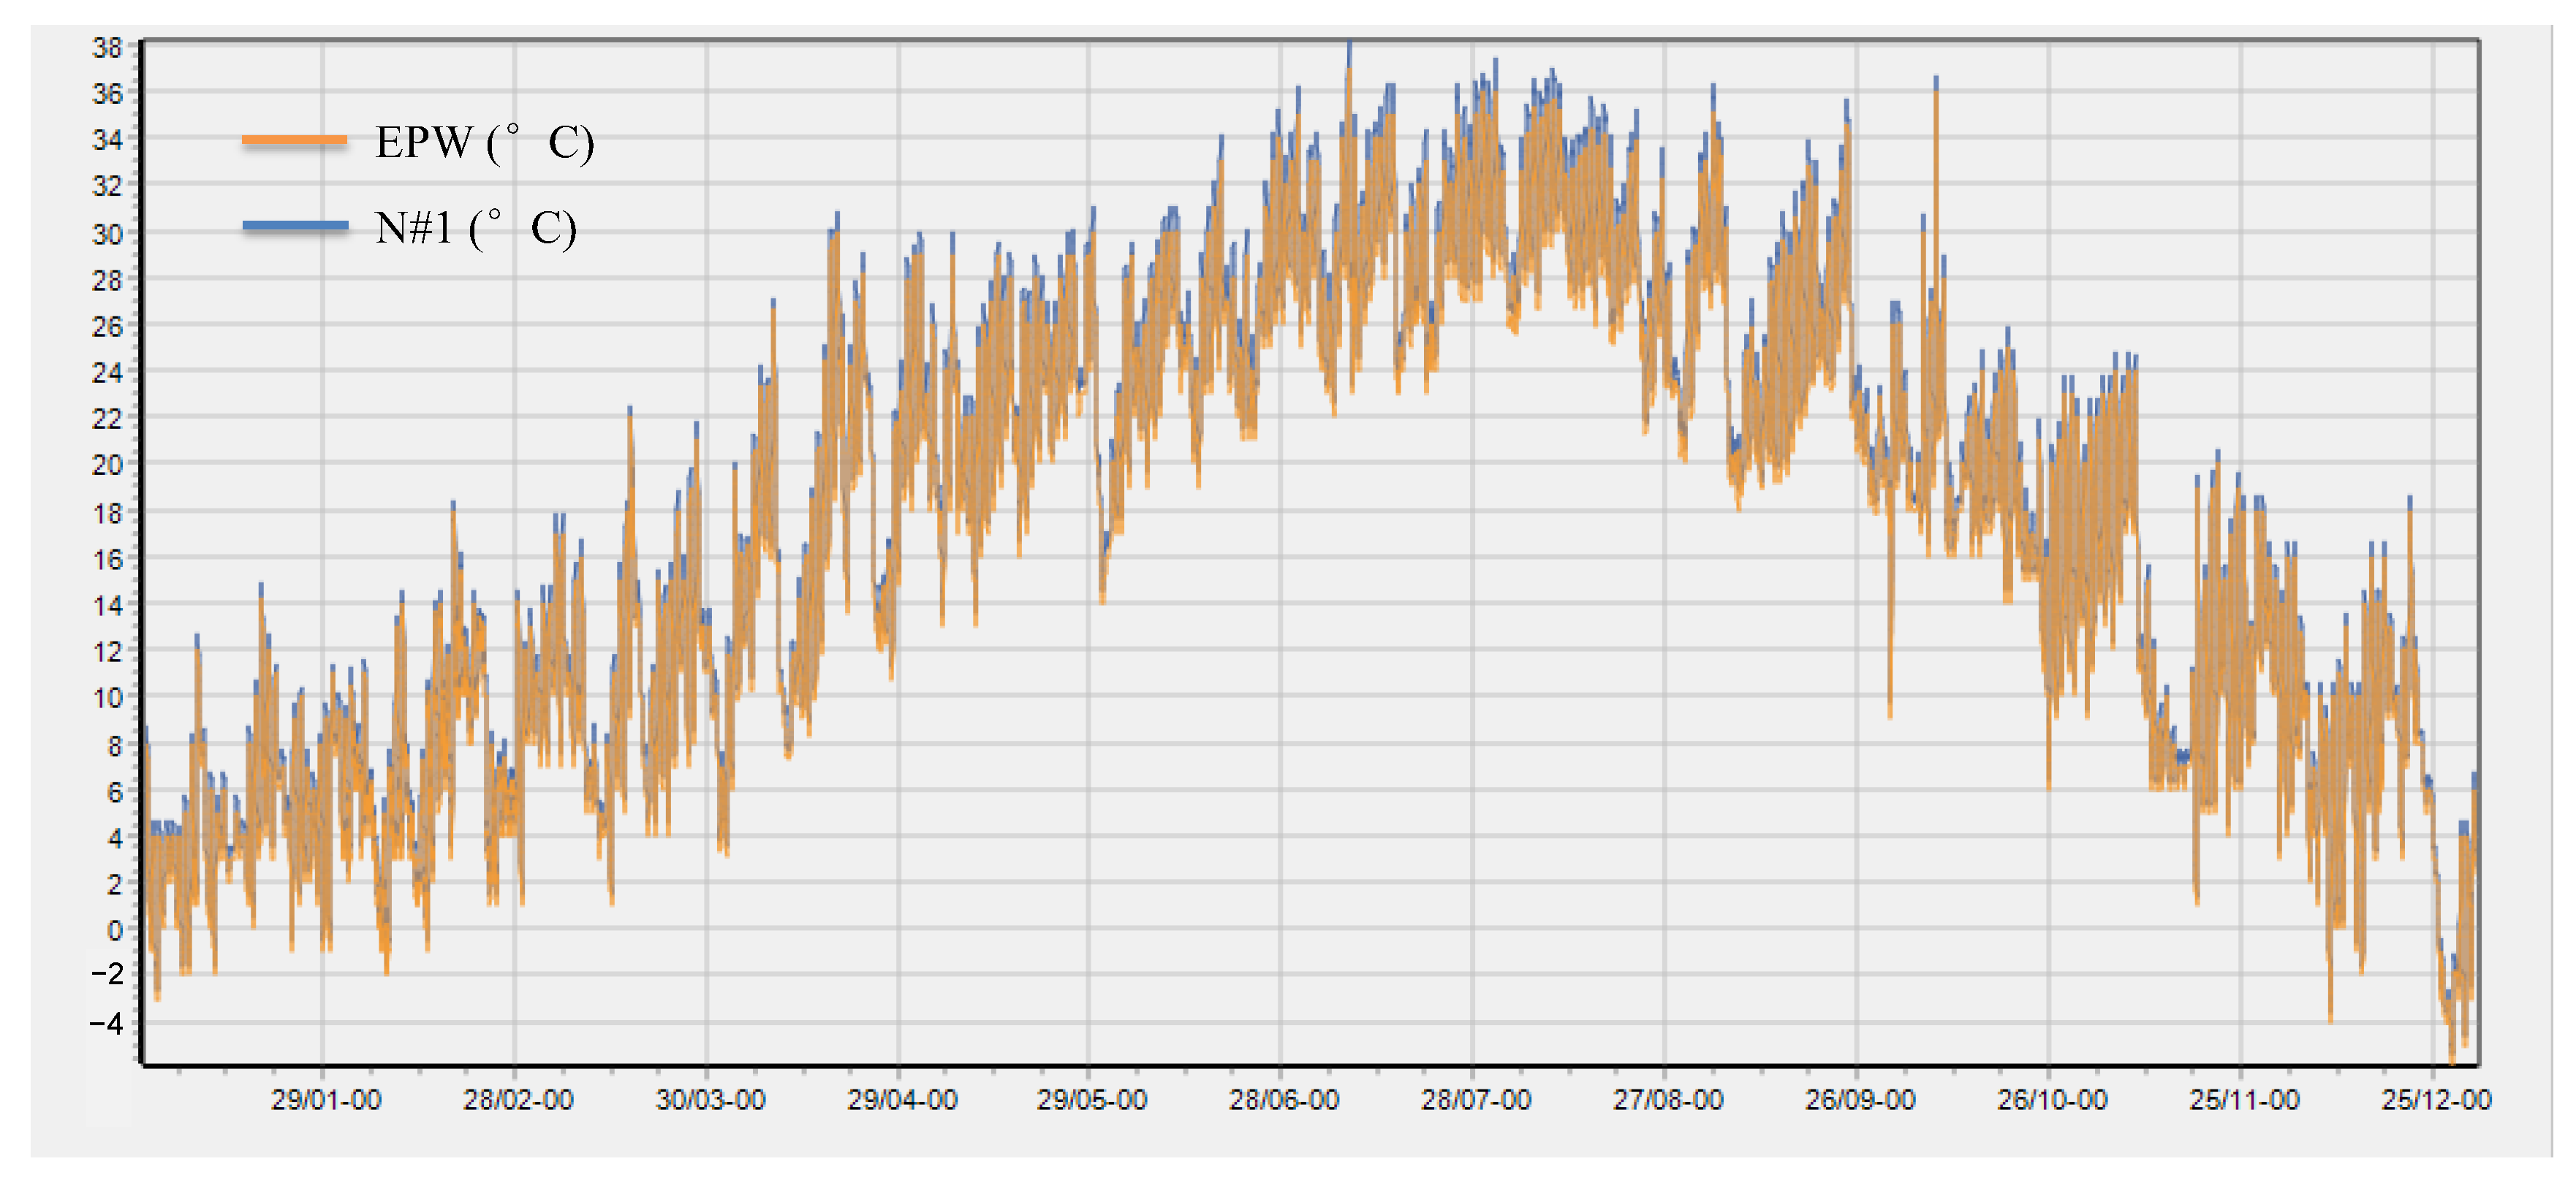
Applying the method illustrated in Section 4.2, the meteorological files for building energy simulation were generated. The UHIIs at six different heights of four orientations were calculated and added to the original EPW file; meanwhile, the other meteorological parameters were kept the same. In total 24 meteorological files taking into account the local UHI effect were generated and were used to simulate the building’s energy performance. The hourly temperature of N#1 is shown in Figure 15, compared to the original EPW. The yearly average UHII at the height of 3 m is estimated to be 0.55 °C (considering the average of four orientations).
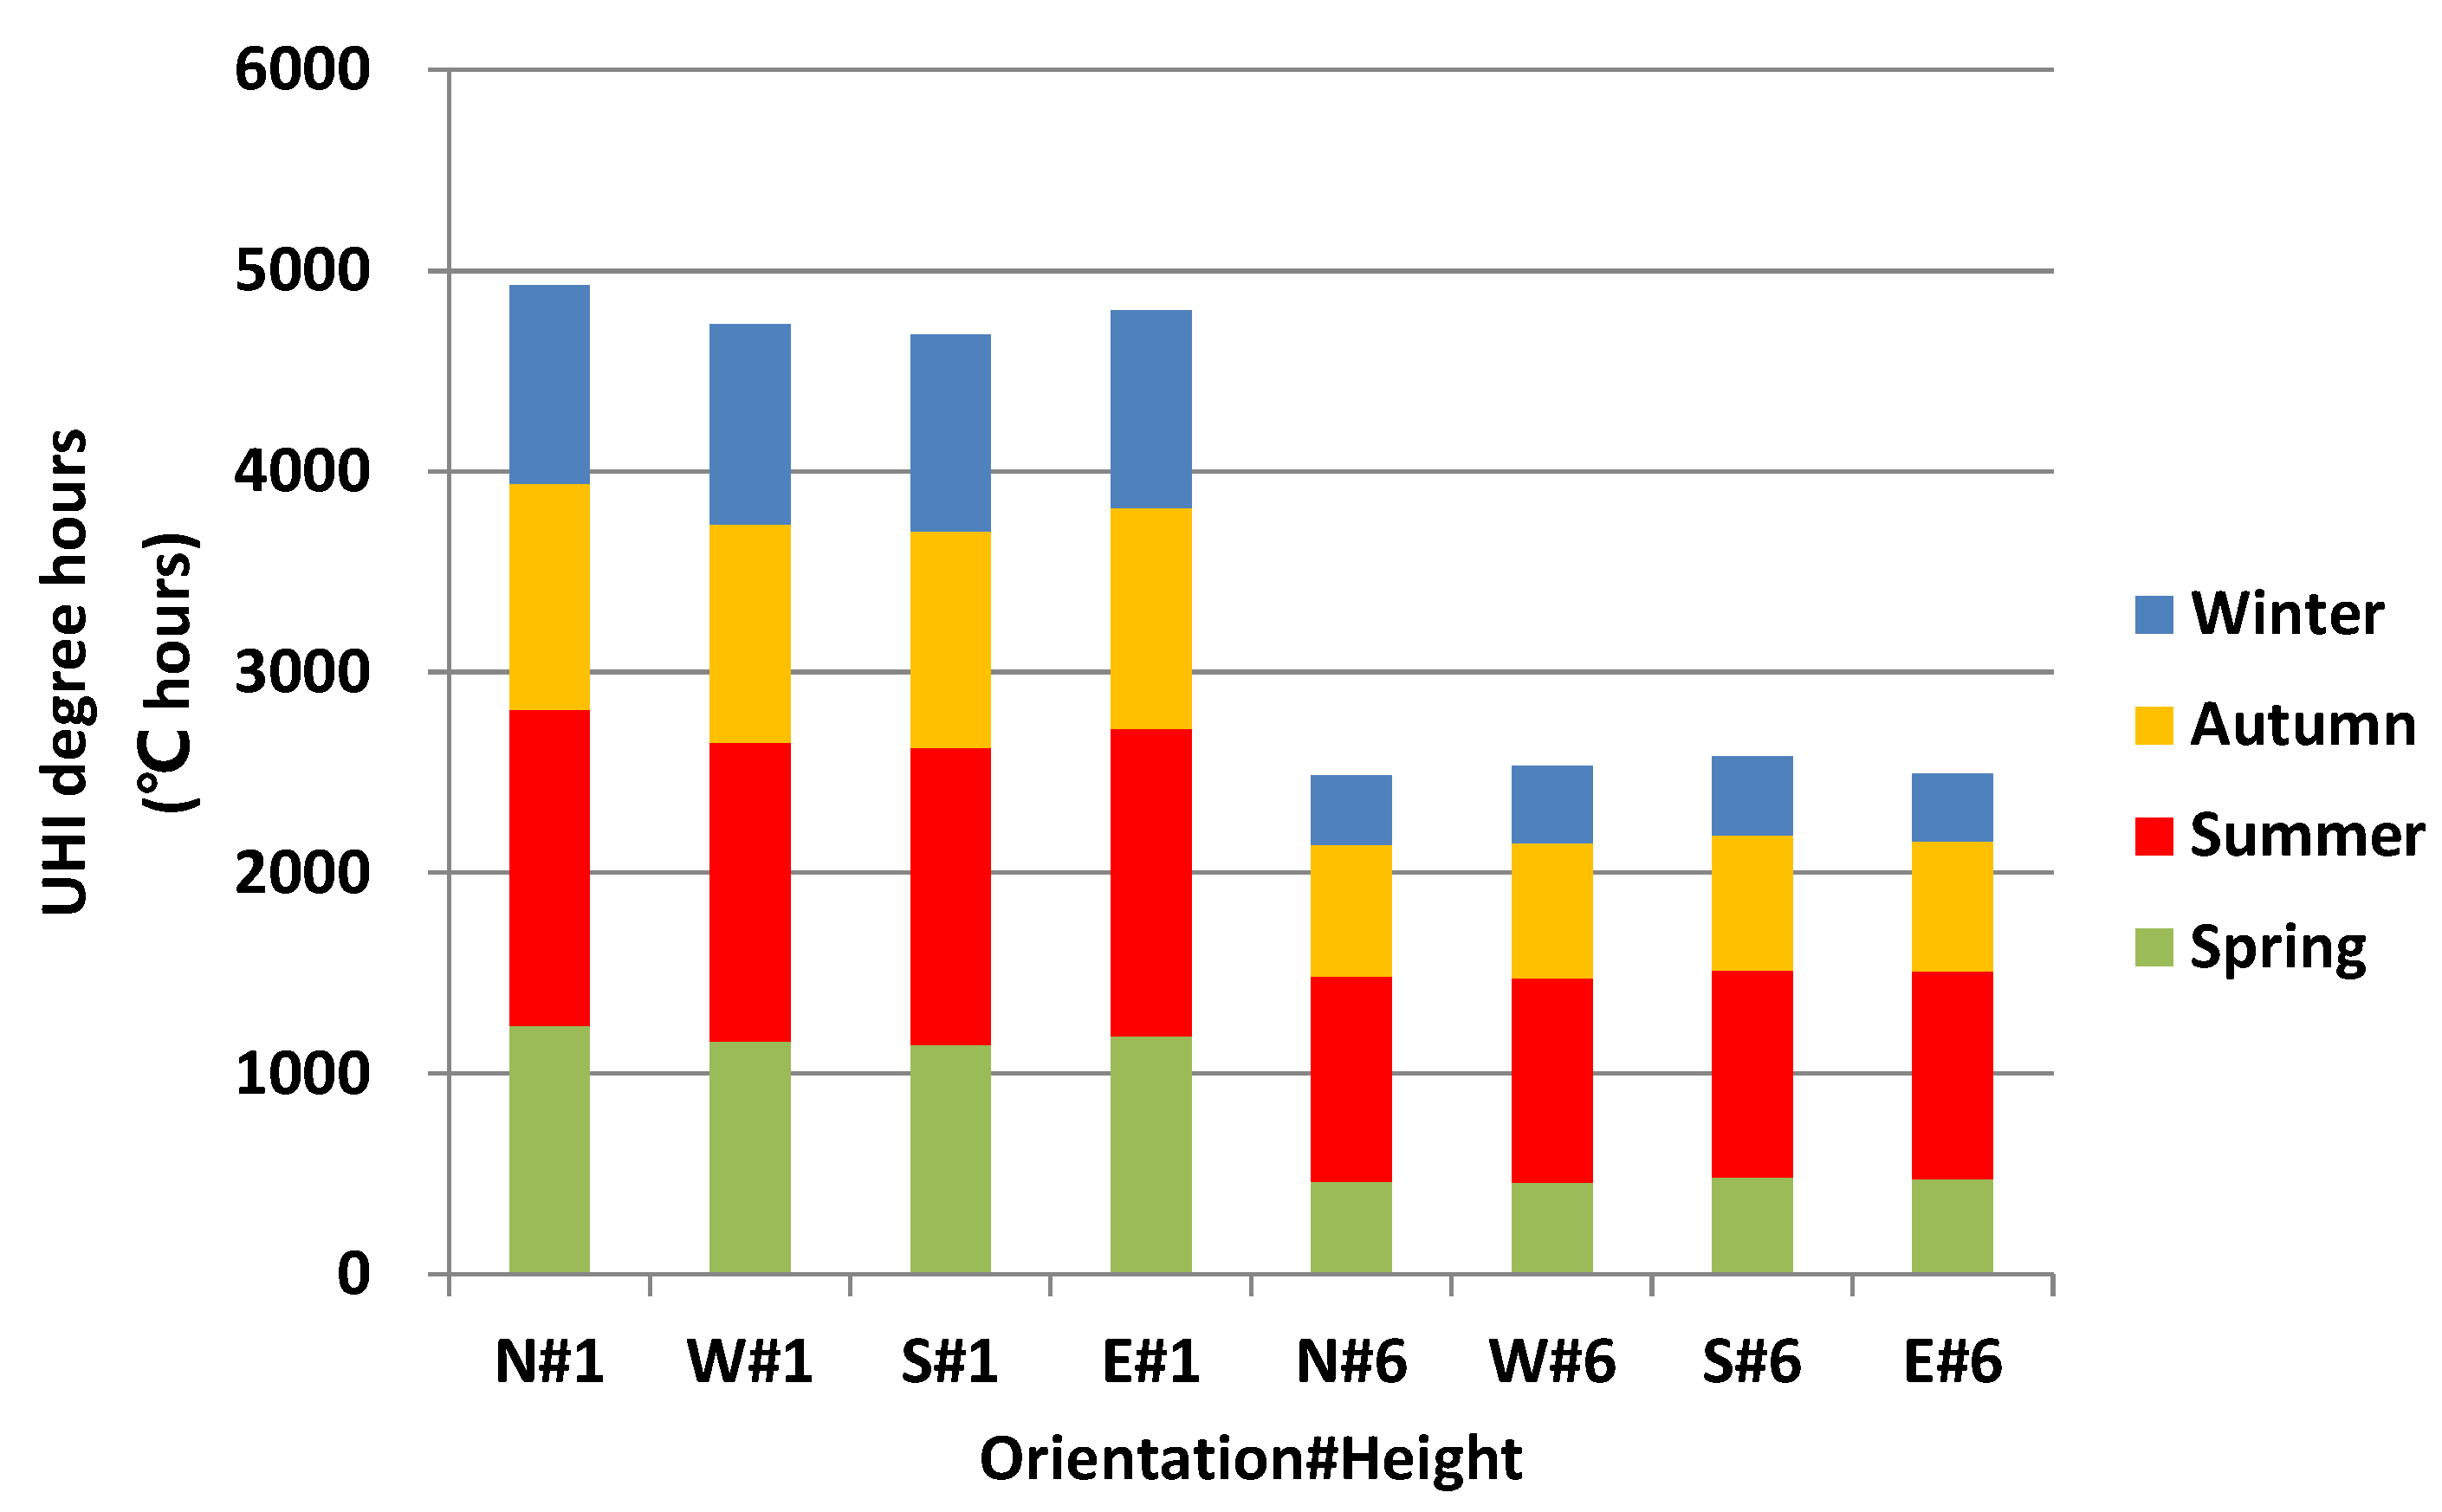
The accumulations of hourly heat island or cool island intensity over TMY were calculated—namely, urban heat island degree-hours (UHIdh) [44], as shown in Figure 16. UHIdh measures how much and how long the air temperature at a site is higher than the reference suburb. At height #1, the values of UHIdh are ranked in the following order for all four orientations: summer > spring > autumn > winter. For the whole year, at height #1, the order of the number of UHIdh is N#1 (4929 °C hours) > E#1 (4802 °C hours) > W#1 (4736 °C hours) > S#1 (4680 °C hours). At height #6, the order changes to S#6 (2578 °C hours) > W#6 (2533 °C hours) > E#6 (2492 °C hours) > N#6 (2485 °C hours). UHIdh decreases with the height.
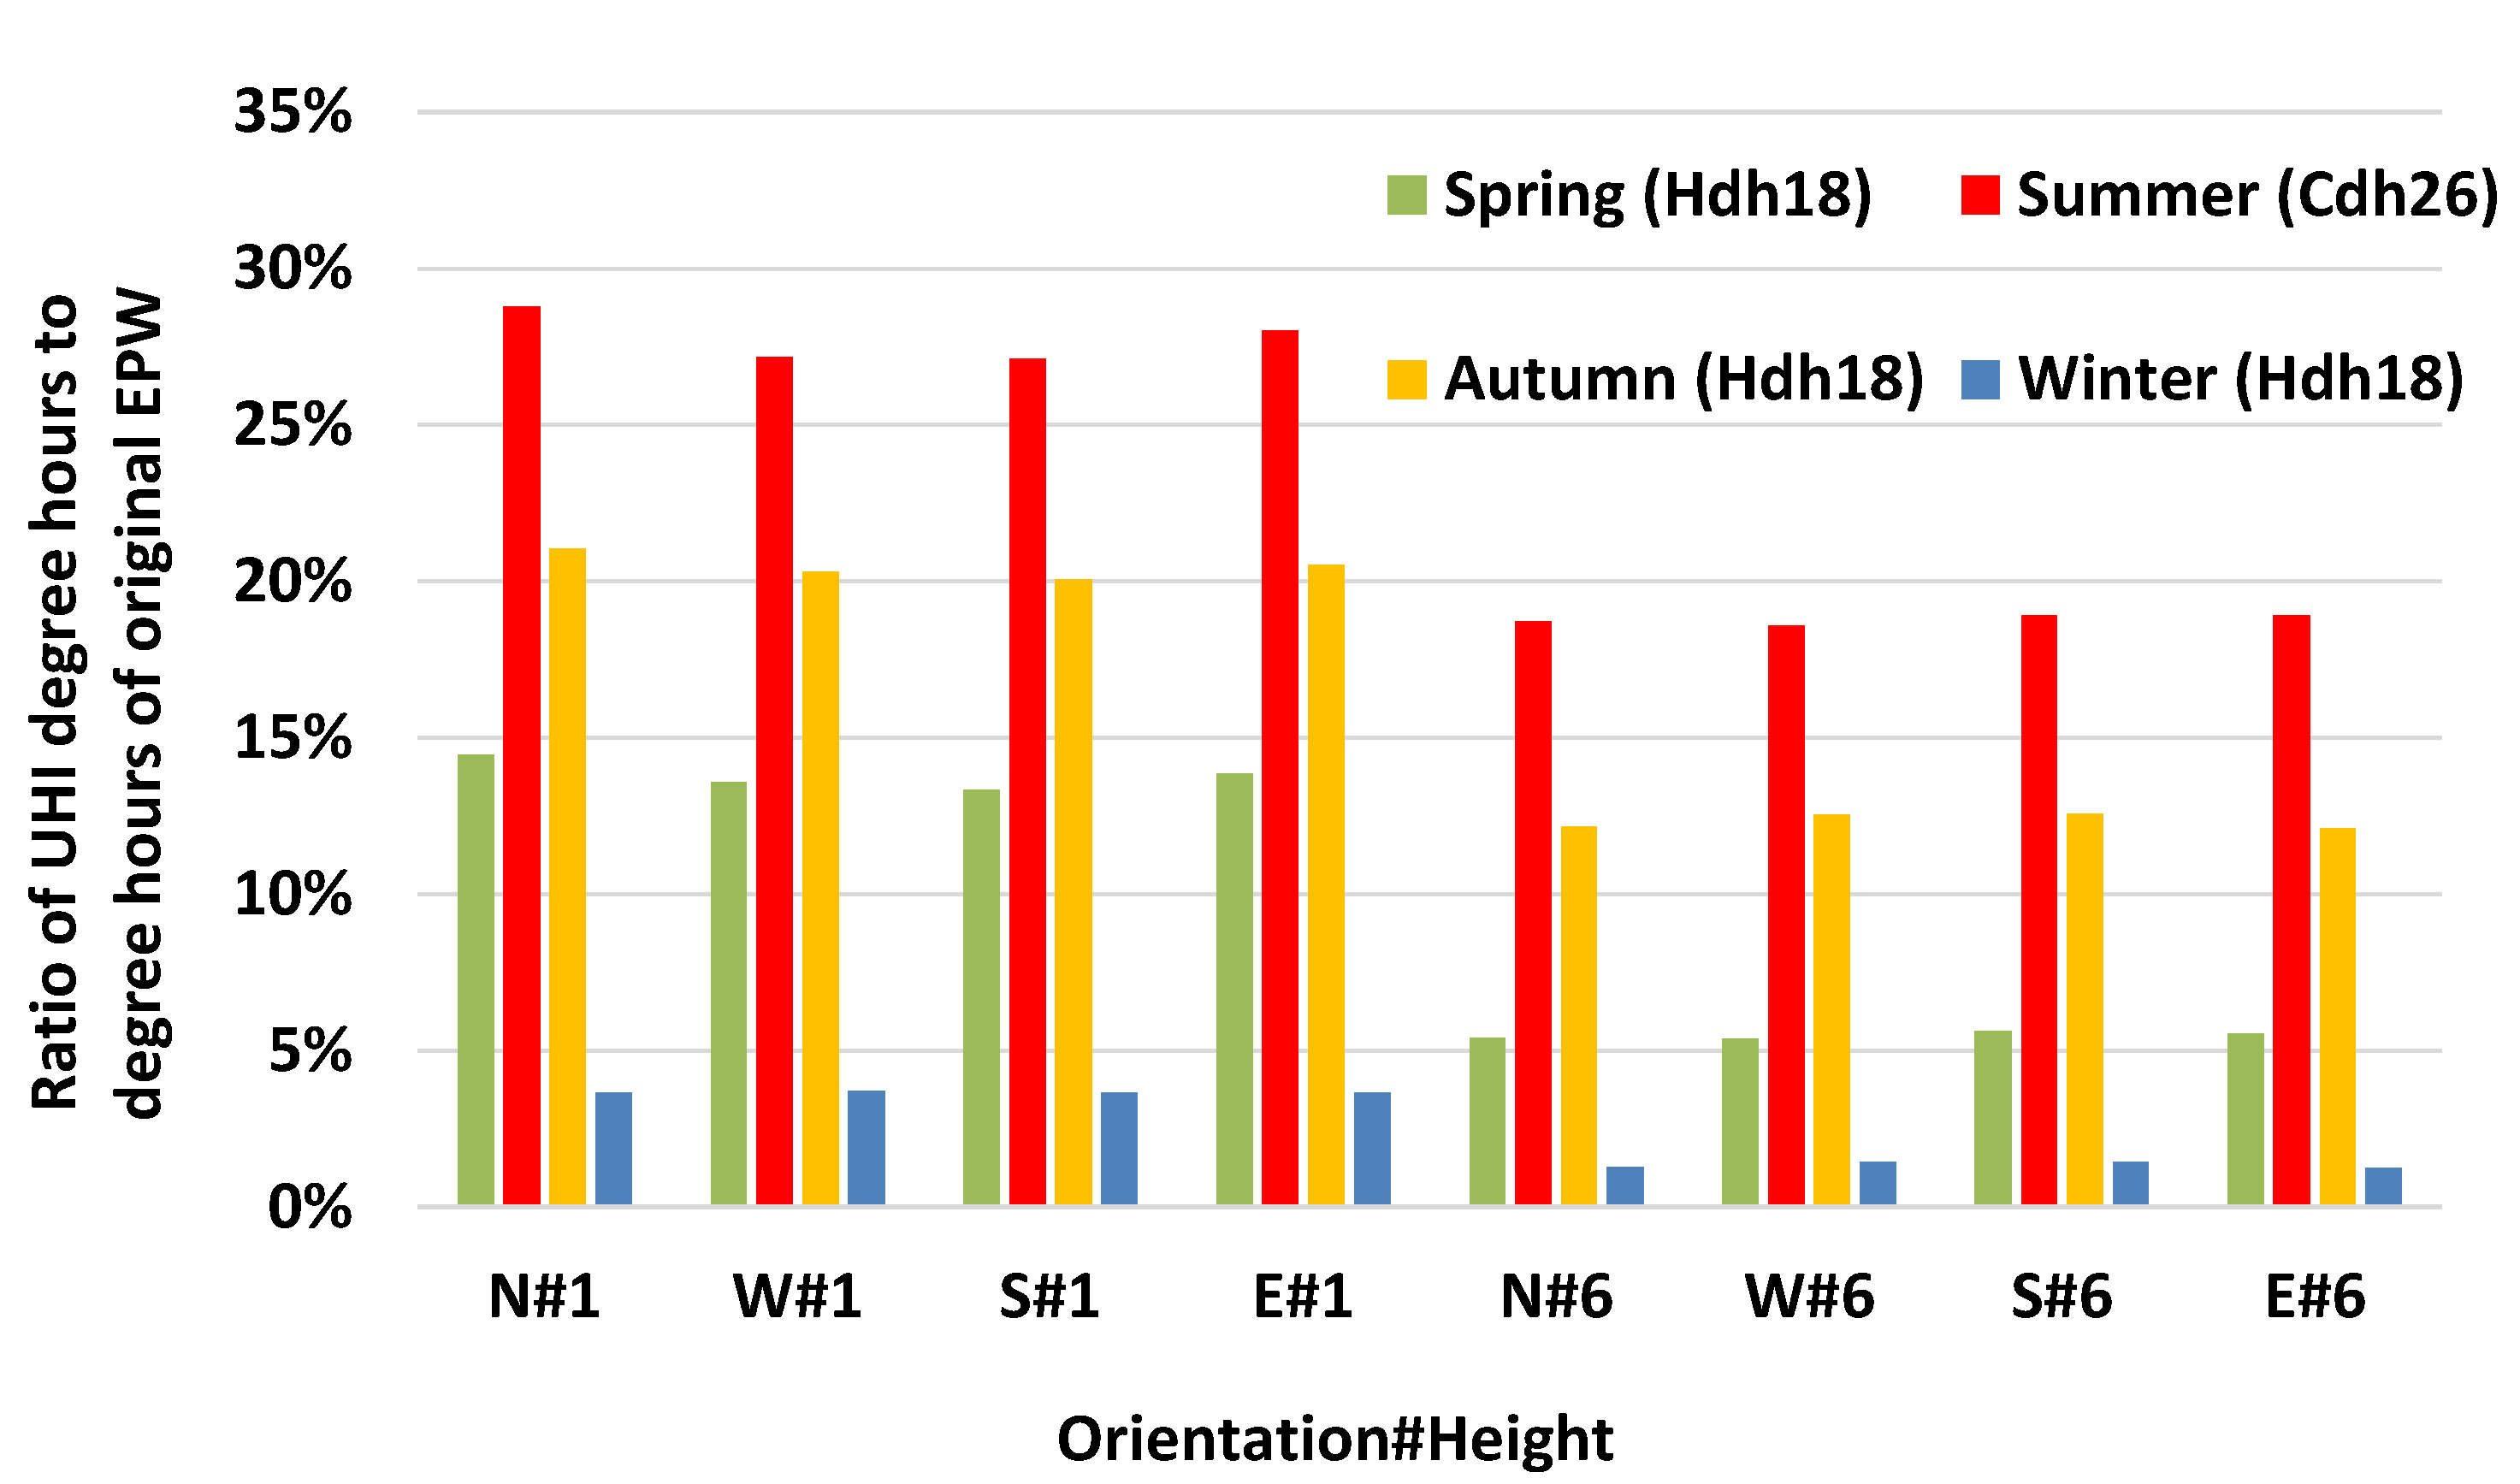
The ratio of UHI degree-hours to heating/cooling degree-hours of the original EPW are presented in Figure 17, based on 18 °C for heating (i.e., Hdh18) and 26 °C for cooling (i.e., Cdh26). Hdh18 is the accumulation of hourly differences between 18 °C and the external temperature (which is smaller than 18 °C) during a period, and Cdh26 is the accumulation of hourly differences between the external temperature (which is larger than 26 °C) and 26 °C during a period. This ratio shows the potential of changing the heating/cooling load. For summer, N#1 has the largest ratio of around 29%. For winter, the four orientations have similar ratios, indicating that the heating load is not strongly influenced by the orientation. The ratio decreases with the height. At height #6, the ratio drops to below 2% in winter and to around 19% in summer. This indicates that a smaller UHI effect is foreseen with an increase of height.

4.4. Building Energy Simulation Results

4.4.1. DBES with Detailed Microclimate Data

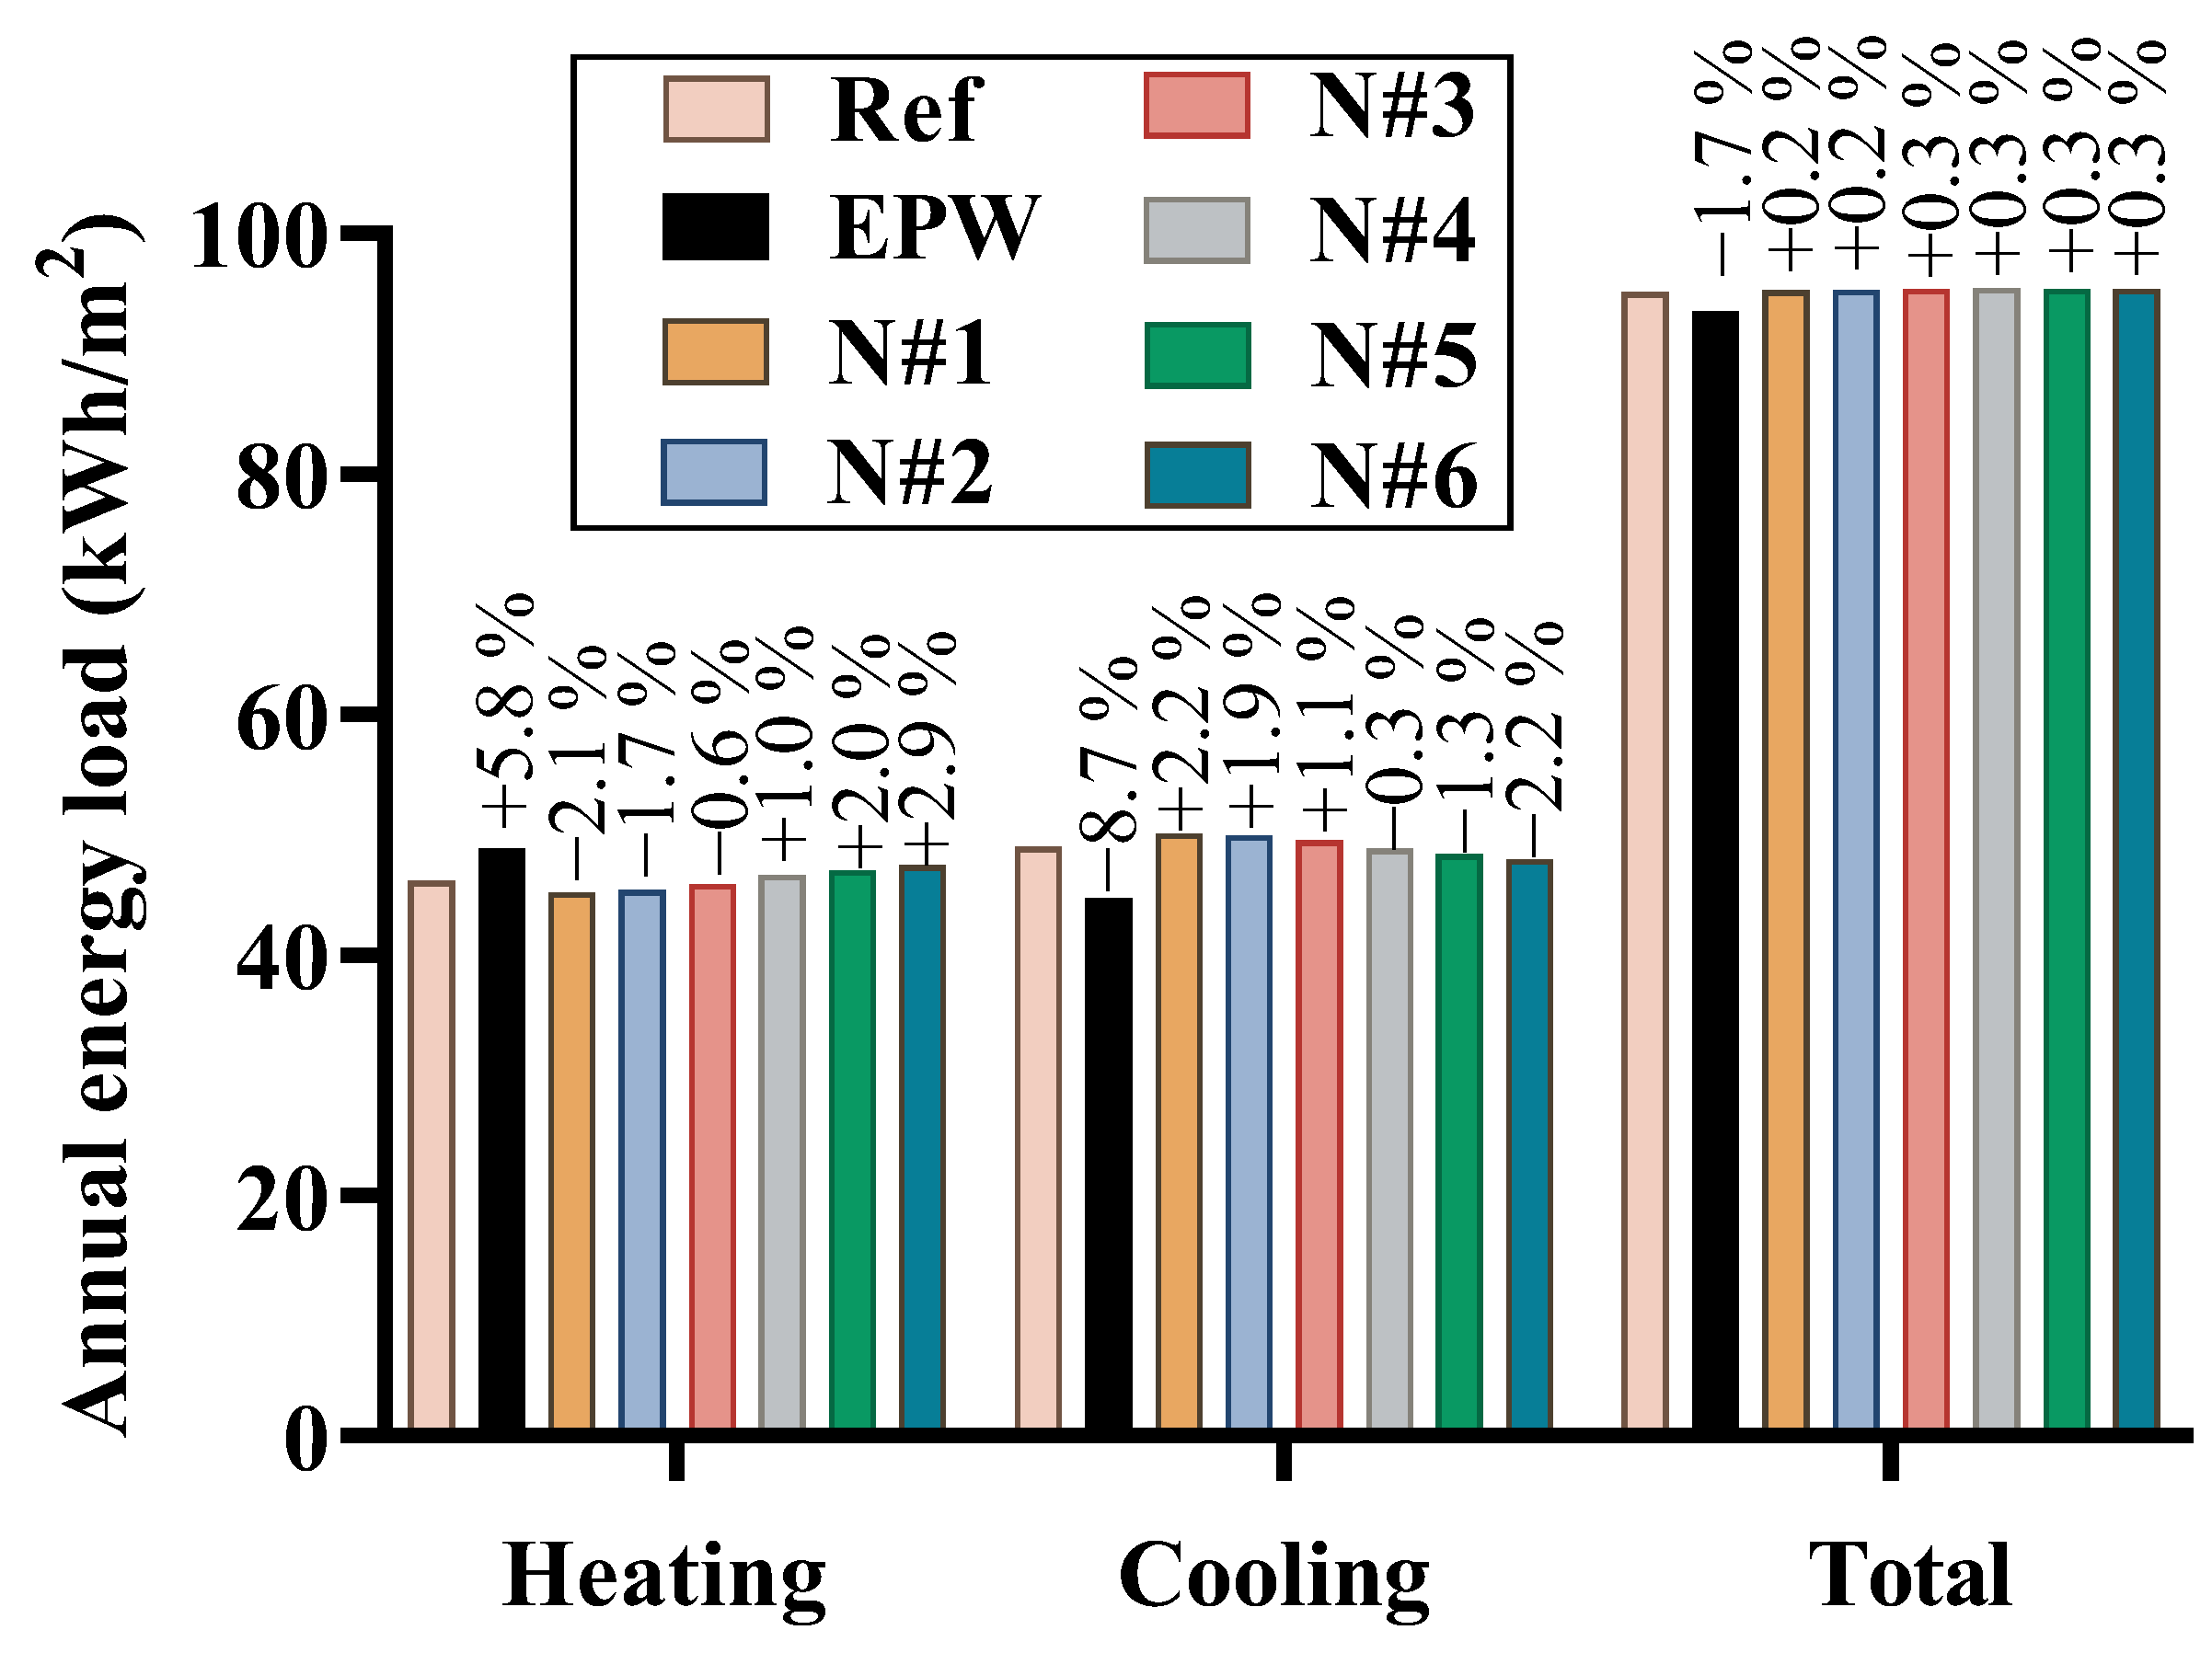
The time needed for one dynamic building simulation is around 1 min. Applying the proposed methods, the energy simulation results with detailed microclimate data were obtained: the total heating and cooling loads are 575,000 kWh (46.2 kWh/m2) and 610,000 kWh (49 kWh/m2), respectively. Since this simulation considers the air temperature variation with height and orientation, it can be regarded as being closer to reality and it is, therefore, used as a reference (legend “Ref” in Figure 18 and Figure 19) to compare the differences of other simulation results such as the simulation with the original EPW file.

4.4.2. Impact of Orientation and Height

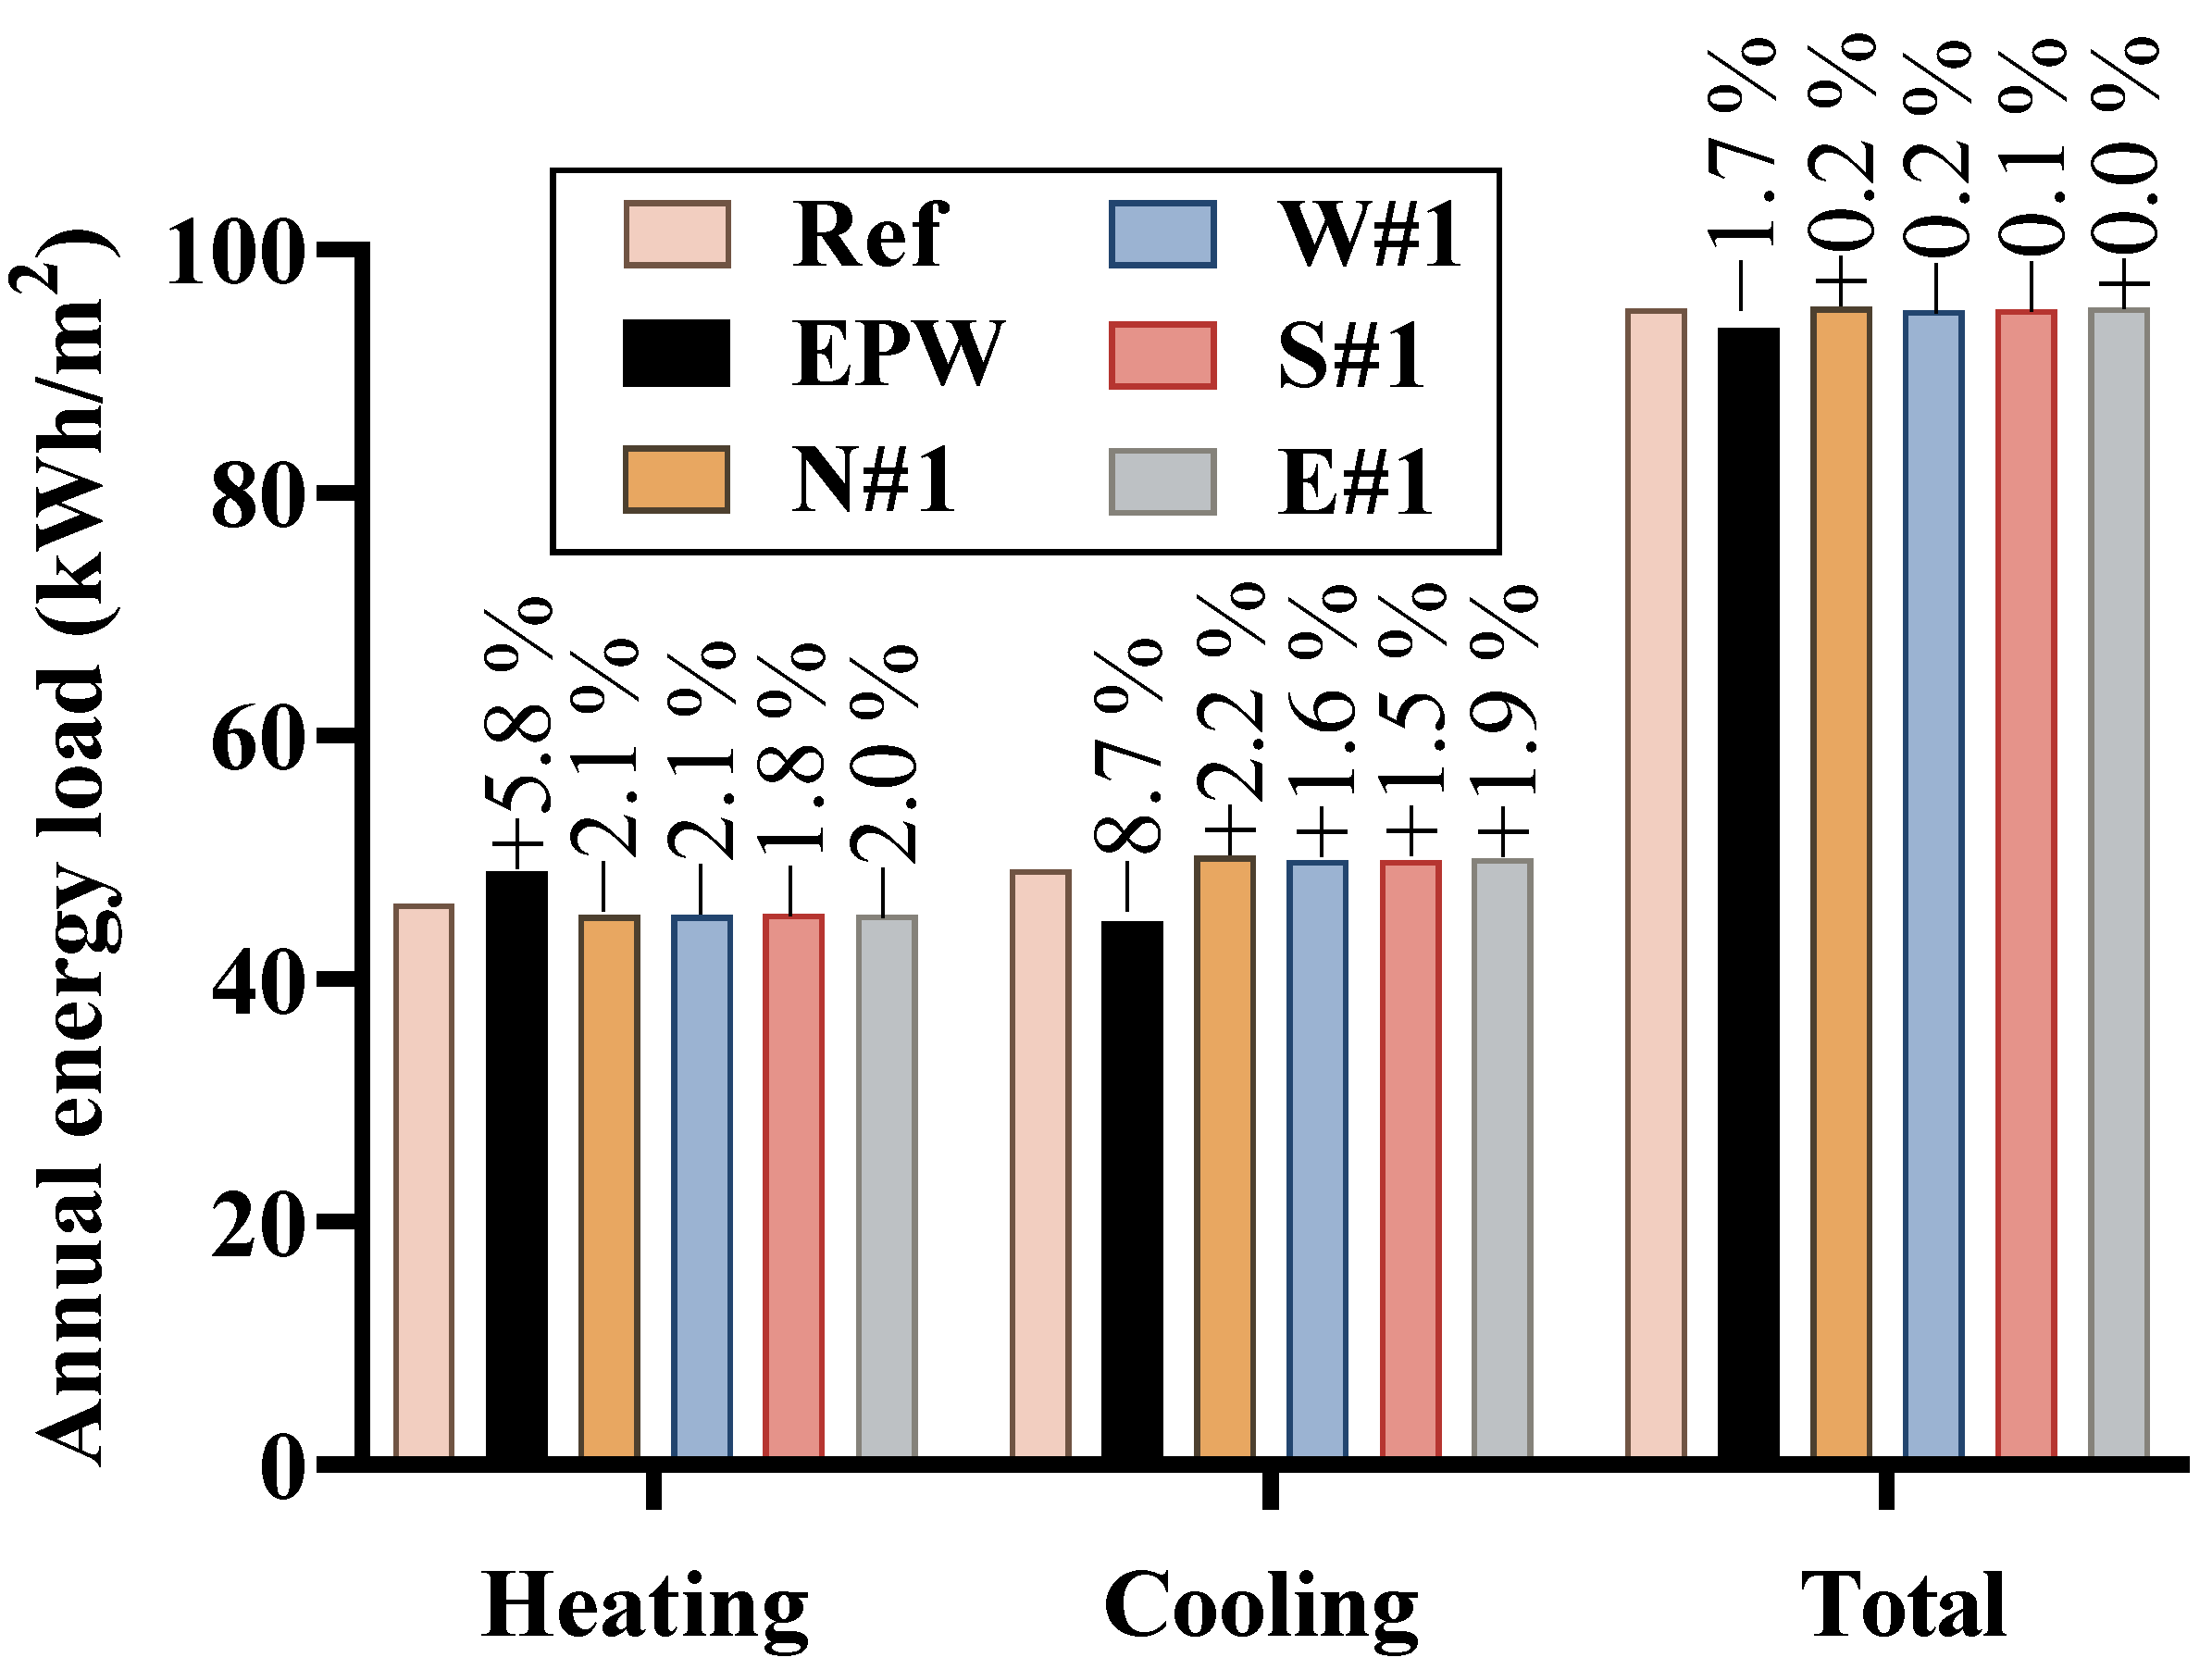
The simulation results of different meteorological files were compared including the original EPW and the reference simulation. Figure 18 shows the simulated annual loads of different orientation at a height of 3 m. Compared to the reference simulation, the simulation with the EPW file overestimates the heating load by 5.8% and underestimates the cooling load by 8.7%. However it can accurately predict the total energy load (1.7% smaller). This is mainly because the UHI effect reduces the heating load in winter and increases the cooling load in summer. In this study the difference between the heating and cooling loads is small. It should be noted that, in the simulation with the EPW file, the heating load is a bit larger than the cooling load, contrary to the reference simulation. At the height of 3 m, the orientation slightly affects the heating and cooling load, with a maximal variation of only 0.3% and 0.7%, respectively. The south orientation has a slightly more accurate simulation result than the other orientations. For the prediction of the total energy load, the four orientations all show good accuracy. In general, the effect of orientation is not important in this case study, especially if the uncertainty is considered. However, the effect might be larger in some other cases. For example, the geometry and layout of the block and vegetation might influence the air temperature distribution [45].
According to Figure 19, the air temperature drops along the height, yielding different energy loads. The building energy simulation results of different heights for north are illustrated in Figure 19. It can be inferred that compared to the reference simulation, the difference in heating load increases from −2.1% to +2.9% and the difference in cooling load decreases from +2.2% to −2.2% with height. The height has a minor influence on the total load, with a maximal difference of 0.3%. Compared to EPW, the differences of heating load and cooling load can reach, respectively, −7.5% and +12.1% for N#1. Many studies only consider the UHI effect observed near the ground (e.g., N#1), neglecting its variation along height. This brings a larger difference than the reference simulation considering the variation along the height. The smallest differences are from the largest height N#6, with differences of −2.8% and +7.2%. It can be indicated that the UHI’s effects on the low-rise buildings is larger than the high-rise buildings. In this study, N#4 is the best representative meteorological file which can obtain the closest result compared to the reference simulation for both heating load (+1.0%) and cooling load (−0.3%).
It should be noted that, in our case study, the heating and cooling loads are almost balanced, resulting in a minor difference in the total energy load due to the microclimate. However, its effect could be stronger in other climate zones where the difference between the heating and cooling loads is large.

4.5. Discussion

Instead of simulating one representative day in each season in ENVI-met, more precise UHIIs could be obtained, such as by simulating the whole representative week in each season. However, this will largely increase the simulation time, which is not feasible in the design phase. We investigated this and found that the difference of the average UHII during the simulated 24 h between these two methods is acceptable (less than 10% on average). Therefore, simulating one representative day in each season is a compromise between the simulation time and accuracy. The method of generating the hourly UHII is based on the linear interpolation between four representative days in each season, which might not precisely evaluate the UHII for every hour. Although this is a good attempt to account for the local UHI effect on the building energy performance, a more accurate method generating the hourly UHII would be beneficial. Regardless, measurements of the local climate parameters could be helpful to validate the simulation results, especially if the local measurements could be collected in different heights and orientations for a high-rise building in a dense district. The energy performance of other uses of the building can also be investigated, such as the office buildings only operating in the daytime.
Although some studies—e.g., Chan [46]—reported a similar UHII measurement trend as Figure 12, in urban areas, a larger UHI effect is usually observed during the night period compared to the day time, which is contradictory to Figure 12. A longer buffering time of 3 days was used to investigate the possibility of improving the results. However the results still showed a limited heat island effect at night, which may be due to numerical approximation of ENVI-met. It would be useful to perform calculations again using a more powerful computer allowing for more precise simulation options to be chosen.
This paper focuses on the influence of air temperature. Other site-specific climate parameters such as relative humidity, solar radiation, longwave radiation and wind affecting the building energy loads were not considered in this study, which could be an interesting perspective in future research.
In this case study, the simulation using the EPW file predicts that the heating load is a bit larger than the cooling load, which is contrary to the reference simulation considering the UHI effect. A more precise evaluation of the load balance could be helpful for a more appropriate design of a reversible ground source heat pump. Therefore, considering the UHI effect in the building simulation could be beneficial for this.
This study only evaluates the effects of UHI on the energy consumption of the building. However there are other environmental impacts such as CO2 emissions, human health and biodiversity. Moreover, the environmental impacts of electricity are different in winter and summer, because different electricity production technologies are used for different seasons [47]. Although the total energy consumption is almost identical, the variations in the heating and cooling loads might influence the environmental impacts. This is another interesting topic to be investigated.

5. Conclusions

China is under a state of rapid urbanisation. During this process, the urban environment is altered and shows different climate characteristics compared to rural areas. The simulation results of a building’s energy consumption are highly dependent on the accuracy of the weather file comprising 8760 h of various climatic parameters. In present DBES tools, the most used weather data usually come from meteorological stations located in peripheral zones, which cannot reflect site-specific microclimate conditions such as the UHI effect. This might lead to simulation errors.
This study contributes to better accounting for the UHI effect in building energy simulation compared to using regional weather data. A site-specific weather file generation method was proposed to generate new local weather files accounting for hourly UHI effects by using the microclimate simulation tool ENVI-met. This method selects four representative days which are simulated in ENVI-met to obtain the hourly UHII. Afterwards the corresponding hourly UHII of other days in one year are evaluated by linear interpolation. This method could avoid a long simulation time which is a big challenge for building energy performance optimisation. The method of coupling ENVI-met with the DBES tool COMFIE was introduced as well. This method combines the thermal zone definition in COMFIE and the height resolution in ENVI-met, providing more precise weather data for each zone in DBES. By applying this method, instead of the same weather file for all the building zones, air temperature variations along height and orientation are considered, yielding relatively more accurate simulation results, especially for high-rise buildings.
The methods were applied to a case study with a height of 102 m in Wuhan, China. A district area of 660 m × 660 m was modelled around the studied building. The microclimate simulation was performed for four representative days by ENVI-met. The hourly UHII was obtained by applying the proposed method and a set of site-specific weather files considering the UHI effect were generated for four orientations and six heights. The yearly average UHII at the height of 3 m was estimated to be 0.55 °C. The simulation using the original EPW file showed a heating load 5.8% larger, a cooling load 8.7% smaller and a total energy load 1.7% smaller compared to the reference simulation. When only the weather file at the height of 3 m near the north facade was used, neglecting the variation of UHII along the height, the heating load decreased by 7.5% and the cooling load increased by 12.1% compared to the EPW file. The UHI’s effects on the low-rise buildings are larger than on the high-rise buildings. The methods proposed in this paper can be used for a more precise application of urban building energy simulation accounting for the UHI effect. The linear interpolation between two representative days to generate hourly UHII is a simplifying assumption, which should be improved in the case that a more precise UHII is expected. Including more climate features in these methods is another perspective.

Author Contributions

Conceptualization, L.P. and B.P.; methodology, L.P., P.S. and B.P.; software, L.P.; investigation, L.P.; validation, L.P., P.S. and B.P.; writing—original draft, L.P.; writing—review and editing, L.P., P.S. and B.P.; project administration, P.S. and B.P.; supervision, P.S. and B.P.; funding acquisition, B.P. All authors have read and agreed to the published version of the manuscript.

Funding

This research was funded by China Scholarship Council (CSC) grant number 201708420156 and the Chair ParisTech VINCI Eco-design of buildings and infrastructure.

Institutional Review Board Statement

Not applicable.

Data Availability Statement

The authors confirm that the data supporting the findings of this study are available within the article.

Acknowledgments

The authors would like to thank the financial support by China Scholarship Council (CSC) and the Chair ParisTech VINCI Eco-design of buildings and infrastructure.

Conflicts of Interest

The authors declare no conflict of interest.

Abbreviations

List of abbreviations
3DThree-dimensional
achair change per hour
DBESDynamic building energy simulation
EEast
EPWEnergyPlus Weather
HSJGHaishan Jingu
MAEMean absolute error
NNorth
RMSERoot mean square error
SSouth
TMMTypical meteorological months
TMYTypical meteorological year
UCIUrban cool island
UCIIUrban cool island intensity
UHIUrban heat island
UHIIUrban heat island intensity
WWest
List of symbols
INumber of cells on x-axis in ENVI-met model
iHour number in a day
JNumber of cells on y-axis in ENVI-met model
jDay number in a representative week
KNumber of cells on z-axis in ENVI-met model
kDay number in a year
nNumber of vertical cell
NhNumber of different heights
PAtmosphere pressure, Pa
P0Reference pressure, Pa
sScaling factor
TTemperature, °C or K
UHIdhUrban heat island degree-hours, °C hours
Superscripts and subscripts
absAbsolute
airAir
avAverage
ENVImetENVI-met results
EPWEPW file
maxMaximal
potPotential temperature
re11st representative day
re22nd representative day
List of Greek letters
ΔxResolution of cell on x-axis in ENVI-met model, m
ΔyThe resolution of cell on y-axis in ENVI-met model, m
ΔzThe resolution of cell on z-axis in ENVI-met model, m

References

  1. Sun, Y.; Haghighat, F.; Fung, B.C.M. A Review of The-State-of-the-Art in Data-Driven Approaches for Building Energy Prediction. Energy Build. 2020, 221, 110022. [Google Scholar] [CrossRef]
  2. Tsoka, S.; Tolika, K.; Theodosiou, T.; Tsikaloudaki, K.; Bikas, D. A Method to Account for the Urban Microclimate on the Creation of ‘Typical Weather Year’ Datasets for Building Energy Simulation, Using Stochastically Generated Data. Energy Build. 2018, 165, 270–283. [Google Scholar] [CrossRef]
  3. Hall, I.J.; Prairie, R.R.; Anderson, H.E.; Boes, E.C. Generation of a Typical Meteorological Year; Sandia Labs.: Albuquerque, NM, USA, 1978. [Google Scholar]
  4. Wei, Y.; Huang, C.; Li, J.; Xie, L. An Evaluation Model for Urban Carrying Capacity: A Case Study of China’s Mega-Cities. Habitat Int. 2016, 53, 87–96. [Google Scholar] [CrossRef]
  5. Maheshwari, B.; Pinto, U.; Akbar, S.; Fahey, P. Is Urbanisation Also the Culprit of Climate Change?—Evidence from Australian Cities. Urban Clim. 2020, 31, 100581. [Google Scholar] [CrossRef]
  6. Toparlar, Y.; Blocken, B.; Maiheu, B.; van Heijst, G.J.F. Impact of Urban Microclimate on Summertime Building Cooling Demand: A Parametric Analysis for Antwerp, Belgium. Appl. Energy 2018, 228, 852–872. [Google Scholar] [CrossRef]
  7. Li, C.; Zhou, J.; Cao, Y.; Zhong, J.; Liu, Y.; Kang, C.; Tan, Y. Interaction between Urban Microclimate and Electric Air-Conditioning Energy Consumption during High Temperature Season. Appl. Energy 2014, 117, 149–156. [Google Scholar] [CrossRef]
  8. Oke, T.R. The Energetic Basis of the Urban Heat Island (Symons Memorial Lecture, 20 May 1980). Q. J. R. Meteorol. Soc. 1982, 108, 1–24. [Google Scholar]
  9. Imhoff, M.L.; Zhang, P.; Wolfe, R.E.; Bounoua, L. Remote Sensing of the Urban Heat Island Effect across Biomes in the Continental USA. Remote Sens. Environ. 2010, 114, 504–513. [Google Scholar] [CrossRef] [Green Version]
  10. Santamouris, M. Analyzing the Heat Island Magnitude and Characteristics in One Hundred Asian and Australian Cities and Regions. Sci. Total Environ. 2015, 512–513, 582–598. [Google Scholar] [CrossRef]
  11. Zhou, W.; Wang, J.; Cadenasso, M.L. Effects of the Spatial Configuration of Trees on Urban Heat Mitigation: A Comparative Study. Remote Sens. Environ. 2017, 195, 1–12. [Google Scholar] [CrossRef]
  12. Li, X.; Zhou, Y.; Asrar, G.R.; Imhoff, M.; Li, X. The Surface Urban Heat Island Response to Urban Expansion: A Panel Analysis for the Conterminous United States. Sci. Total Environ. 2017, 605–606, 426–435. [Google Scholar] [CrossRef] [PubMed]
  13. Li, H.; Zhou, Y.; Li, X.; Meng, L.; Wang, X.; Wu, S.; Sodoudi, S. A New Method to Quantify Surface Urban Heat Island Intensity. Sci. Total Environ. 2018, 624, 262–272. [Google Scholar] [CrossRef] [PubMed]
  14. Yang, X.; Peng, L.L.H.; Jiang, Z.; Chen, Y.; Yao, L.; He, Y.; Xu, T. Impact of Urban Heat Island on Energy Demand in Buildings: Local Climate Zones in Nanjing. Appl. Energy 2020, 260, 114279. [Google Scholar] [CrossRef]
  15. Tejedor, B.; Lucchi, E.; Nardi, I. Application of Qualitative and Quantitative Infrared Thermography at Urban Level: Potential and Limitations. In New Technologies in Building and Construction: Towards Sustainable Development; Bienvenido-Huertas, D., Moyano-Campos, J., Eds.; Lecture Notes in Civil Engineering; Springer Nature: Singapore, 2022; pp. 3–19. ISBN 978-981-19189-4-0. [Google Scholar]
  16. Martin, M.; Chong, A.; Biljecki, F.; Miller, C. Infrared Thermography in the Built Environment: A Multi-Scale Review. Renew. Sustain. Energy Rev. 2022, 165, 112540. [Google Scholar] [CrossRef]
  17. Lagüela, S.; Díaz−Vilariño, L.; Roca, D.; Lorenzo, H. Aerial Thermography from Low-Cost UAV for the Generation of Thermographic Digital Terrain Models. Opto-Electron. Rev. 2015, 23, 78–84. [Google Scholar] [CrossRef]
  18. Fabbri, K.; Costanzo, V. Drone-Assisted Infrared Thermography for Calibration of Outdoor Microclimate Simulation Models. Sustain. Cities Soc. 2020, 52, 101855. [Google Scholar] [CrossRef]
  19. Cho, Y.-I.; Yoon, D.; Shin, J.; Lee, M.-J. Comparative analysis of the effects of heat island reduction techniques in urban heatwave areas using drones. Korean J. Remote Sens. 2021, 37, 1985–1999. [Google Scholar] [CrossRef]
  20. Li, X.; Zhou, Y.; Yu, S.; Jia, G.; Li, H.; Li, W. Urban Heat Island Impacts on Building Energy Consumption: A Review of Approaches and Findings. Energy 2019, 174, 407–419. [Google Scholar] [CrossRef]
  21. Sun, Y.; Augenbroe, G. Urban Heat Island Effect on Energy Application Studies of Office Buildings. Energy Build. 2014, 77, 171–179. [Google Scholar] [CrossRef]
  22. Skelhorn, C.P.; Levermore, G.; Lindley, S.J. Impacts on Cooling Energy Consumption Due to the UHI and Vegetation Changes in Manchester, UK. Energy Build. 2016, 122, 150–159. [Google Scholar] [CrossRef] [Green Version]
  23. Lowe, S.A. An Energy and Mortality Impact Assessment of the Urban Heat Island in the US. Environ. Impact Assess. Rev. 2016, 56, 139–144. [Google Scholar] [CrossRef]
  24. Bruse, M.; Fleer, H. Simulating Surface–Plant–Air Interactions inside Urban Environments with a Three Dimensional Numerical Model. Environ. Model. Softw. 1998, 13, 373–384. [Google Scholar] [CrossRef]
  25. Huttner, S. Further Development and Application Ofthe 3D Microclimate Simulation ENVI-Met. Ph.D. Thesis, Johannes Gutenberg University Mainz, Mainz, Germany, 2012. [Google Scholar]
  26. López-Cabeza, V.P.; Galán-Marín, C.; Rivera-Gómez, C.; Roa-Fernández, J. Courtyard Microclimate ENVI-Met Outputs Deviation from the Experimental Data. Build. Environ. 2018, 144, 129–141. [Google Scholar] [CrossRef]
  27. Ayyad, Y.; Sharples, S. Envi-MET Validation and Sensitivity Analysis Using Field Measurements in a Hot Arid Climate. In Proceedings of the IOP Conference Series: Earth and Environmental Science, Cardiff, Wales, 24–25 September 2019; Volume 329, p. 012040. [Google Scholar] [CrossRef] [Green Version]
  28. Elwy, I.; Ibrahim, Y.; Fahmy, M.; Mahdy, M. Outdoor Microclimatic Validation for Hybrid Simulation Workflow in Hot Arid Climates against ENVI-Met and Field Measurements. Energy Procedia 2018, 153, 29–34. [Google Scholar] [CrossRef]
  29. Sharmin, T.; Steemers, K. Understanding ENVI-Met (V4) Model Behaviour in Relation to Environmental Variables. In Proceedings of the PLEA 2017 Edinburgh: Design to Thrive, Edinburgh, UK, 2 July 2017; pp. 2156–2164. [Google Scholar]
  30. Yang, X.; Zhao, L.; Bruse, M.; Meng, Q. Evaluation of a Microclimate Model for Predicting the Thermal Behavior of Different Ground Surfaces. Build. Environ. 2013, 60, 93–104. [Google Scholar] [CrossRef]
  31. Peuportier, B.; Blanc-Sommereux, I. Simulation Tool with Its Expert Interface for the Thermal Design of Multizone Buildings. Int. J. Sol. Energy 1990, 8, 109–120. [Google Scholar] [CrossRef]
  32. Peuportier, B. COMFIE, Logiciel Pour L’architecture Bioclimatique, Quelques Applications Pour Les Vérandas; Journée Technique GENEC (CEA): Marseille, France, 1993. [Google Scholar]
  33. Peuportier, B. Bancs D’essais de Logiciels de Simulation Thermique. In Proceedings of the Journée Thématique IBPSA France—SFT 2005, Outil de Simulation Thermo-Aéraulique du Bâtiment, La Rochelle, France, 31 March 2005. [Google Scholar]
  34. Brun, A.; Spitz, C.; Wurtz, E.; Mora, L. Behavioural Comparison of Some Predictive Tools Used in a Low-Energy Building. In Proceedings of the Eleventh International IBPSA Conference, Glasgow, Scotland, 27–30 July 2009. [Google Scholar]
  35. Recht, T.; Munaretto, F.; Schalbart, P.; Peuportier, B. Analyse de la Fiabilité de COMFIE par Comparaison à Des Mesures. Application à un Bâtiment Passif. In Proceedings of the Conférence IBPSA France-Arras-2014, Arras, France, 20 May 2014; p. 8. [Google Scholar]
  36. Spitz, C. Analyse de la Fiabilite Des Outils de Simulation et Des Incertitudes de Métrologie Appliquée à L’efficacité Energétique Des Bâtiments. Ph.D. Thesis, Université de Grenoble, Grenoble, France, 2012. [Google Scholar]
  37. Pei, L. The Study on Eco-Design of High-Rise Residential Buildings in Wuhan Based on Energy Simulation and Life Cycle Assessment. Master’s Thesis, Huazhong University of Science & Technology, Wuhan, China, 2015. [Google Scholar]
  38. EnergyPlus. Available online: https://energyplus.net/weather-location/asia_wmo_region_2/CHN/CHN_Hubei.Wuhan.574940_SWERA (accessed on 21 February 2023).
  39. Yang, X.; Yao, L.; Peng, L.L.H.; Jiang, Z.; Jin, T.; Zhao, L. Evaluation of a Diagnostic Equation for the Daily Maximum Urban Heat Island Intensity and Its Application to Building Energy Simulations. Energy Build. 2019, 193, 160–173. [Google Scholar] [CrossRef]
  40. Lauzet, N.; Rodler, A.; Musy, M.; Azam, M.-H.; Guernouti, S.; Mauree, D.; Colinart, T. How Building Energy Models Take the Local Climate into Account in an Urban Context—A Review. Renew. Sustain. Energy Rev. 2019, 116, 109390. [Google Scholar] [CrossRef]
  41. Thiers, S. Bilans Energétiques et Environnementaux de Bâtiments à Energie Positive. Ph.D. Thesis, École Nationale Supérieure des Mines de Paris, Paris, France, 2008. [Google Scholar]
  42. Wu, N.; Shi, P.; Zhu, G.; Pan, X. Changes of soil relative moisture content and influencing factor in the yangtze basin during 1992–2012. Resour. Environ. Yangtze Basin 2017, 26, 1001–1010. [Google Scholar] [CrossRef]
  43. Ministry of Housing and Urban-Rural Development. Design Standard for Energy Efficiency of Residential Buildings in Hot Summer and Cold Winter Zone; China Architecture & Building Press: Beijing, China, 2010.
  44. Yang, X.; Yao, L.; Jin, T.; Peng, L.L.H.; Jiang, Z.; Hu, Z.; Ye, Y. Assessing the Thermal Behavior of Different Local Climate Zones in the Nanjing Metropolis, China. Build. Environ. 2018, 137, 171–184. [Google Scholar] [CrossRef]
  45. Huang, K.-T.; Li, Y.-J. Impact of Street Canyon Typology on Building’s Peak Cooling Energy Demand: A Parametric Analysis Using Orthogonal Experiment. Energy Build. 2017, 154, 448–464. [Google Scholar] [CrossRef]
  46. Chan, A.L.S. Developing a Modified Typical Meteorological Year Weather File for Hong Kong Taking into Account the Urban Heat Island Effect. Build. Environ. 2011, 46, 2434–2441. [Google Scholar] [CrossRef]
  47. Peters, J.F.; Iribarren, D.; Juez Martel, P.; Burguillo, M. Hourly Marginal Electricity Mixes and Their Relevance for Assessing the Environmental Performance of Installations with Variable Load or Power. Sci. Total Environ. 2022, 843, 156963. [Google Scholar] [CrossRef] [PubMed]
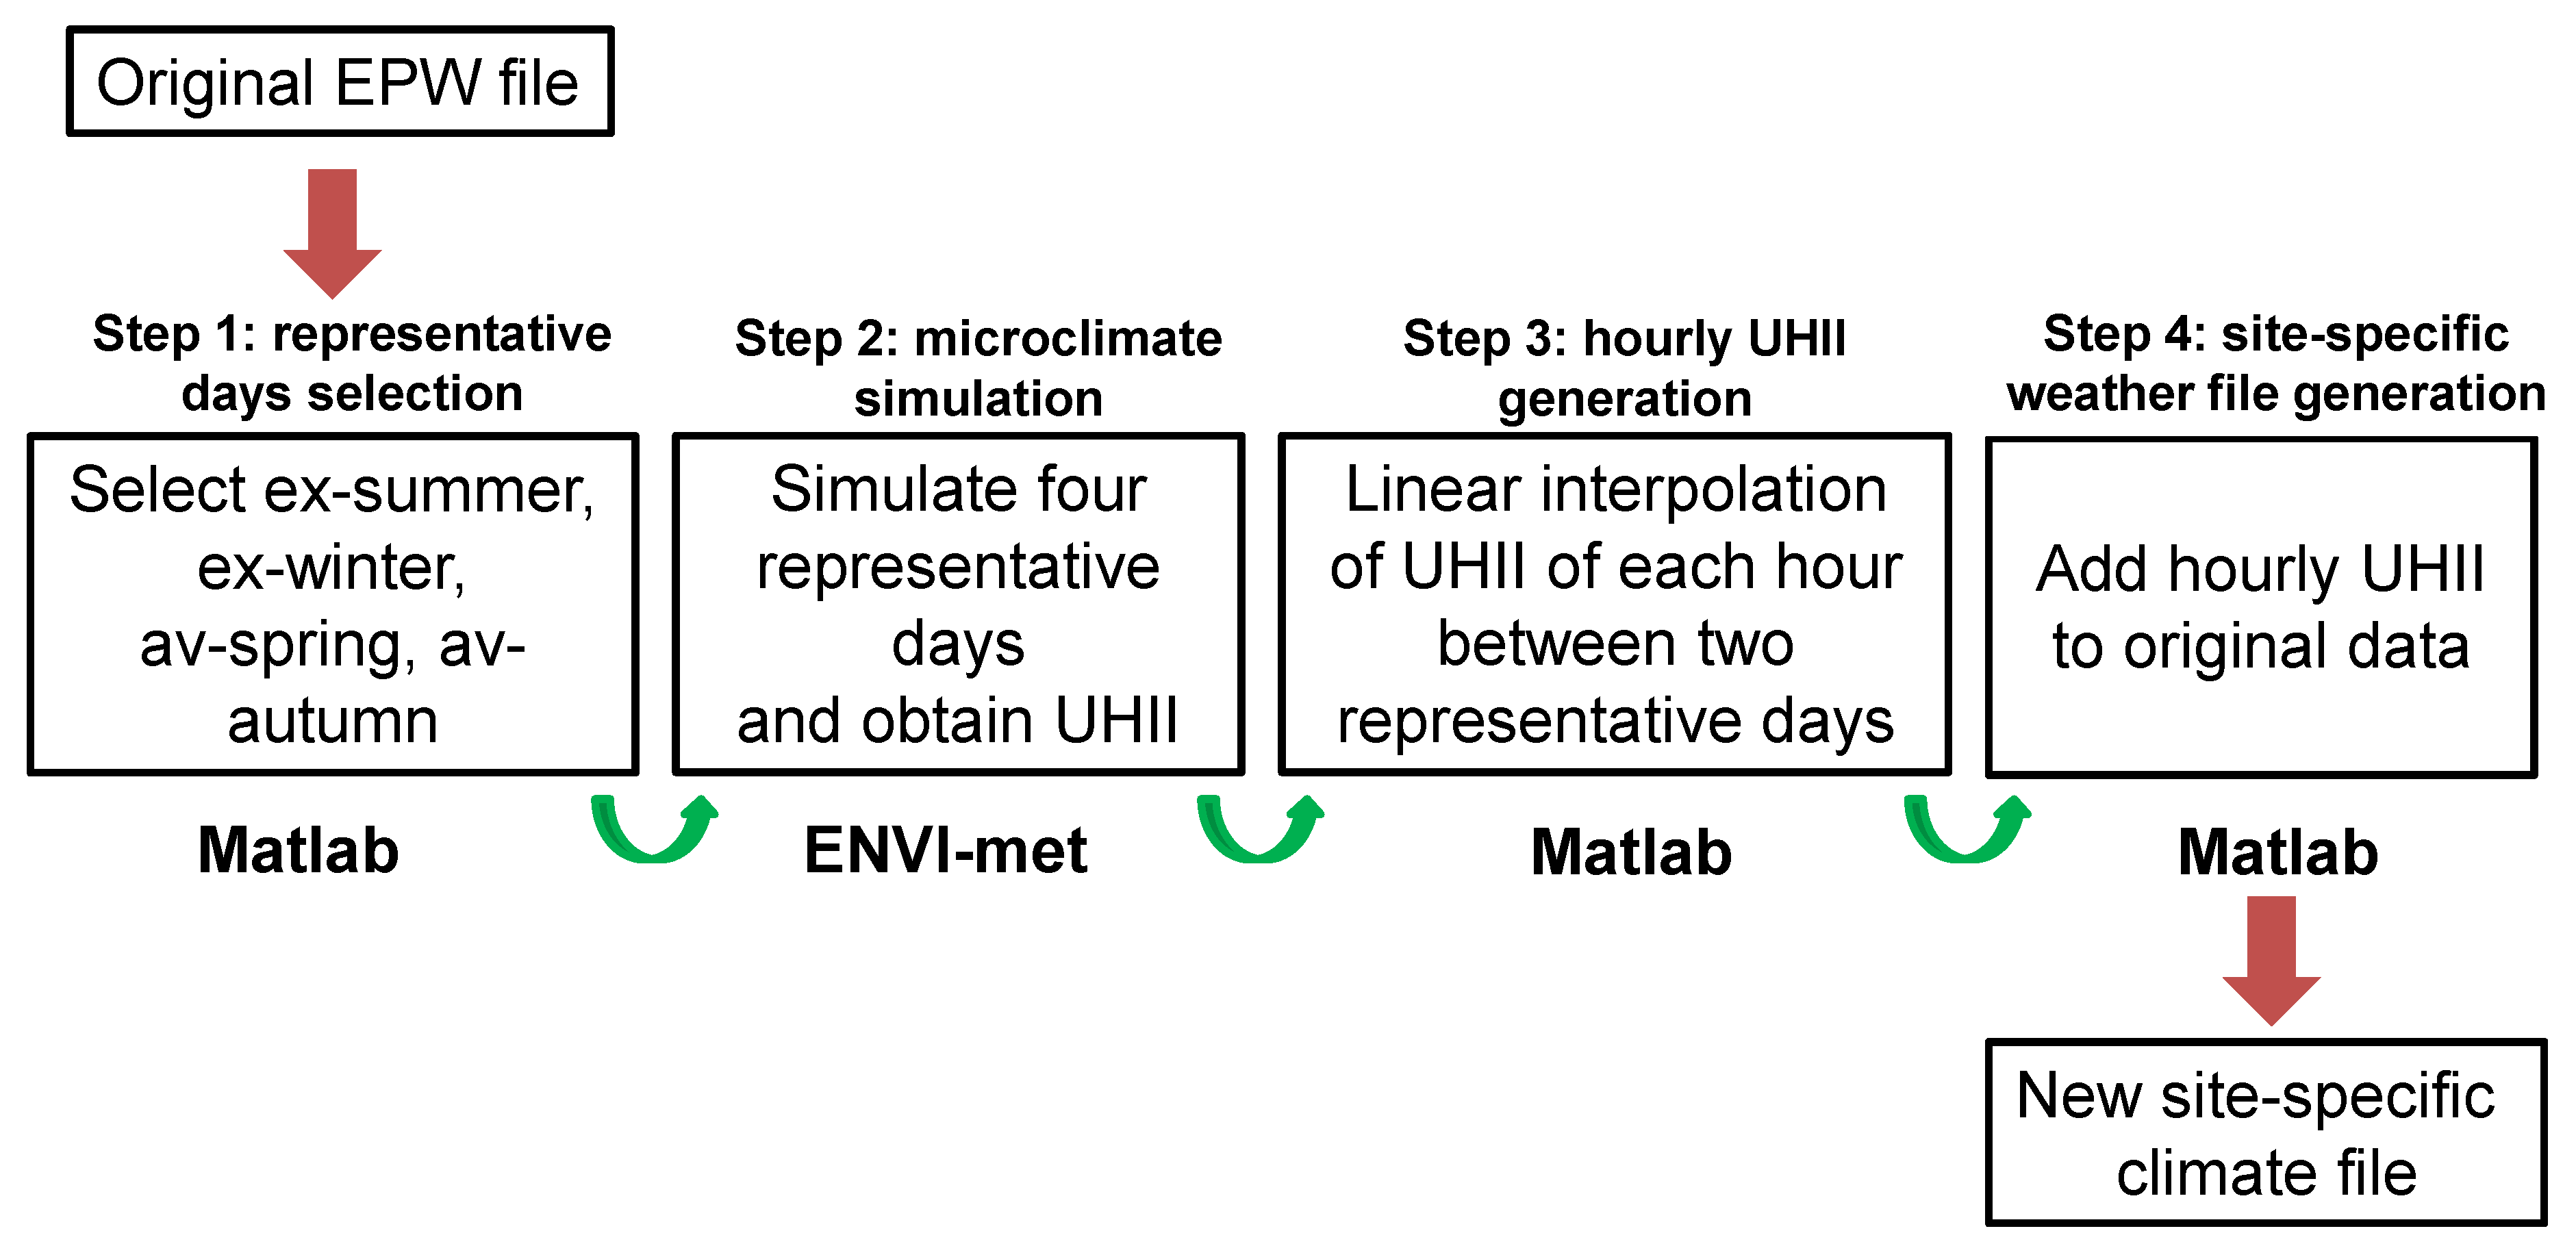
Figure 1. Algorithm of the proposed method to generate the site-specific weather file.
Energies 16 03032 g001
Figure 2. Cell definition in the vertical direction in ENVI-met.
Energies 16 03032 g002
Figure 3. Method of coupling microclimate tool with the DBES tool.
Energies 16 03032 g003
Figure 4. (a) Simulated area in ENVI-met and (b) HSJG block.
Energies 16 03032 g004
Figure 5. The 3D model of the simulated area and four receptors in ENVI-met.
Energies 16 03032 g005
Figure 6. The 15th floor plan of the case study.
Energies 16 03032 g006
Figure 7. South view of HSJG and its zones in COMFIE.
Energies 16 03032 g007
Figure 8. Potential temperature map of the simulated area for av-spring at the height of 3 m.
Energies 16 03032 g008
Figure 9. Potential temperature map of the simulated area for ex-summer at the height of 3 m.
Energies 16 03032 g009
Figure 10. Potential temperature map of the simulated area for av-autumn at the height of 3 m.
Energies 16 03032 g010
Figure 11. Potential temperature map of the simulated area for ex-winter at the height of 3 m.
Energies 16 03032 g011
Figure 12. ENVI-met simulation results for the four representative days at the height of 3 m of the north receptor.
Energies 16 03032 g012
Figure 13. Air temperature evolution along height for four representative days of receptor N.
Energies 16 03032 g013
Figure 14. Air temperature of the four orientations at the height of 3 m for the four representative days.
Energies 16 03032 g014
Figure 15. Air temperature of EPW and N#1.
Energies 16 03032 g015
Figure 16. UHI degree-hours of four orientations at the height of 3 m and 103 m for four seasons.
Energies 16 03032 g016
Figure 17. Ratio of UHI degree-hours to degree hours of original EPW.
Energies 16 03032 g017
Figure 18. Energy loads for different orientations at the height of 3 m.
Energies 16 03032 g018
Figure 19. Annual loads of different heights for north orientation.
Energies 16 03032 g019
Table 1. Representative days selection of each season.
SeasonRepresentative Week (Directly from EnergyPlus Website)Representative DayAbbreviationRMSE (°C)MAE (°C)
Summer
Extreme hot
5–11 August9 AugustEx-summer0.820.76
Winter
Extreme cold
1–7 January4 JanuaryEx-winter1.110.90
Spring
Average temperature
27 May–2 June2 June (date is in June, but represents spring)Av-spring1.481.19
Autumn
Average temperature
26 November–2 December30 NovemberAv-autumn1.251.02
Table 2. Composition and depth in the ground profiles in ENVI-met.
SidewalkBuilt AreaGreen SpaceAsphalt Concrete Road
Brick: 0~3 cmConcrete: 0~20 cmSandy loam: 0~40 cmAsphalt concrete: 0~10 cm
Concrete: 4~20 cmSand: 21~ 30 cmLoam: 41~450 cmSand: 11~40 cm
Sand: 21~30 cmLoam: 31~450 cm Loam: 41~450 cm
Loam: 31~450 cm
Table 3. Soil temperature and relative soil humidity of each soil layer in ENVI-met.
Av-SpringEx-SummerAv-AutumnEx-Winter
Upper layer (0–20 cm)26 °C/77%33.51 °C/85%12.33 °C/84%6.16 °C/80.5%
Middle layer (20–50 cm)24.66 °C/80.5%32.57 °C/81%13.66 °C/83%7.53 °C/83%
Deep layer (50–200 cm)21.07 °C/82%29.30 °C/79%17.20 °C/81%11.65 °C/84%
Bedrock layer (below 200 cm)19 °C/82%19 °C/79%19 °C/81%19 °C/84%
Table 4. Wall configuration of the buildings in ENVI-met.
External WallRoof
Ceramic tile 1 cmCeramic tile 1 cm
Insulation mortar 4 cmExtruded Polystyrene Board (XPS) 4 cm
Aerated concrete block 20 cmConcrete (C10) 20 cm
Table 5. The 24 weather files for building energy simulation based on position (with the corresponding cells in ENVI-met).
Building LevelLevel HeightWeather File Abbreviation of Four Orientations at Each HeightHeight of the Weather File by Averaging the Heights of Vertical Cells in ENVI-met
13 mN#1, W#1, S#1, E#13 m (cell 1)
2–66–18 mN#2, W#2, S#2, E#2(9 m (cell 2)+ 15 m (cell 3))/2 = 12 m
7–1421–42 mN#3, W#3, S#3, E#3(21 m (cell 4) + 27 m (cell 5) + 33.75 m (cell 6) + 42.19 m (cell 7))/4 = 31 m
15–2545–75 mN#4, W#4, S#4, E#4(52.73 m (cell 8) + 65.92 m (cell 9))/2 = 59.3 m
26–3378–99 mN#5, W#5, S#5, E#582.4 m (cell 10)
34102 mN#6, W#6, S#6, E#6103 m (cell 11)
Table 6. Meteorological files to calculate the energy load of each zone.
Zone NumberZone NameWeather File
1floor 1(N#1 + S#1 + W#1 + E#1)/4
2aisle-
3floor 2–6 north(N#2 + S#2 + W#2 + E#2)/4
4floor 2–6 southS#2
5floor 7–14 north(N#3 + S#3 + W#3 + E#3)/4
6floor 7–14 southS#3
7floor 15 C—living room (15)S#4
8floor 15 C—bedroom (15)S#4
9floor 15 C—other rooms (15)S#4
10floor 15 BS#4
11floor 15 north(N#4 + S#4 + W#4 + E#4)/4
12floor 16–25 north(N#4 + S#4 + W#4 + E#4)/4
13floor 16–25 southS#4
14floor 26–33 north(N#5 + S#5 + W#5 + E#5)/4
15floor 26–33 southS#5
16floor 34 north(N#6 + S#6 + W#6 + E#6)/4
17floor 34 southS#6
Table 7. UHIImax and UHIIav at the height of 3 m of the north receptor.
Representative DayUHIImax (°C)UHIIav (°C)
Av-spring1.350.58
Ex-summer1.610.78
Av-autumn0.580.34
Ex-winter0.670.47
Disclaimer/Publisher’s Note: The statements, opinions and data contained in all publications are solely those of the individual author(s) and contributor(s) and not of MDPI and/or the editor(s). MDPI and/or the editor(s) disclaim responsibility for any injury to people or property resulting from any ideas, methods, instructions or products referred to in the content.