Article

Interpreting the Dynamic Nexus between Green Energy, Employment, Fossil Fuel Energy, and Human Development Index: A Panel Data Investigation

1
Agro-Food Economics and Development (CREDA-UPC-IRTA), Parc Mediterrani de la Tecnologia, Edifici ESAB, 08860 Castelldefels, Spain
2
Department of Electrical Engineering, University of Engineering and Technology, Taxila 47050, Pakistan
3
Department of Civil and Environmental Engineering, Brunel University London, Uxbridge UB8 3PH, UK
4
School of Economics and Management, North China Electric Power University, Beijing 102206, China
*
Authors to whom correspondence should be addressed.
Energies 2023, 16(7), 3132; https://doi.org/10.3390/en16073132
Submission received: 25 February 2023 / Revised: 21 March 2023 / Accepted: 27 March 2023 / Published: 30 March 2023
(This article belongs to the Section C: Energy Economics and Policy)

Abstract

:
This study examines the dynamic connection between green energy, employment, fossil fuel energy, and human development index including additional variables such as education, life expectancy, and poverty in panel data of 30 developing countries from 1990–2017. Previous studies analyzed the total energy consumption on the human development index, whereas the differential effect of green and fossil fuel energy with employment and human development index has not been examined. The empirical exercise is based on the panel co-integration test, panel fully modified ordinary least squares, dynamic ordinary least squares, and vector error correction estimation approaches. The results reveal that all variables are co-integrated. The results of regression analysis indicate that green energy, education, life expectancy, and employment increase the human development index, but fossil fuel energy and poverty decrease the human development index by −0.016 and 0.023%. In addition, the vector error correction model designates that there is bidirectional causality between green energy consumption and the human development index. Therefore, for developing countries, the development and utilization of green energy sources (wind, solar, geothermal, etc.) are needed. Moreover, these countries should rely less on fossil fuel energy because it causes a decrease in the HDI.

1. Introduction

Energy has made significant contributions all over the world [1,2]. However, energy is the fundamental building block for all sectors of development and an essential source for production activities [3,4,5]. The United Nations [6] launched eight Millennium Development Goals (MDGs) in 2000 to be reached by the target year of 2015, such as eliminating tremendous poverty and hunger; accessing primary education for all; encouraging equality between men and women and women’s empowerment; lowering teenage fertility rates; developing maternity protection; skirmishing HIV/AIDS, paludism, and other infections; ensuring a better quality of the environment; and developing international collaboration for economic progress, but specific goals related to energy do not exist in this report. Energy is imperative to all aspects of human life as it augments productivity by expediting social and economic development [6,7,8].
Energy can be classified into types of energy sources: non-renewable energy sources (coal, oil, and gas) and renewable energy sources (solar, wind, hydropower, and geothermal). Traditional energy sources are the most prevalent energy in the world but they cannot be replenished, causing climate change and global warming. The burning of fossil fuels (coal, oil, and gas) produces a significant amount of carbon dioxide (CO2) into the atmosphere, influencing people’s health and well-being. The demand for non-renewable energy sources is escalating due to population growth and economic activities.
However, due to the issues associated with the usage of traditional energy, one form of energy, known as green energy, is receiving more and more attention from investigators and policymakers. The extensive use of green energy sources like solar, wind, and hydropower significantly contributes to the expansion of sustainable economic growth [9,10]. On the one hand, green energy sources may not only solve energy security issues but also significantly lessen the terrible environmental issues that are triggered by fossil fuel energy, as well as the fact that they can also help in achieving sustainable development goals (SDGs). In 2015, the United Nations developed 17 SDGs to eliminate poverty, ensure energy security, and protect the environment by the 2030 Agenda [11]. Previous research has primarily concentrated on the effects of using renewable energy on carbon emissions and economic growth, with just a small number of studies contemplating the effects of using aggregate energy and renewable energy consumption on the human development index with inconsistent results due to different use of models, countries selection, and econometric methods. Some studies, for instance, [7,8,12] reveal that energy increases the human development index (HDI). Whereas other studies [13] in Pakistan [14] in Malaysia argue that there is an insignificant linkage between the two variables. However, it is still less clear whether the utilization of energy affects HDI.
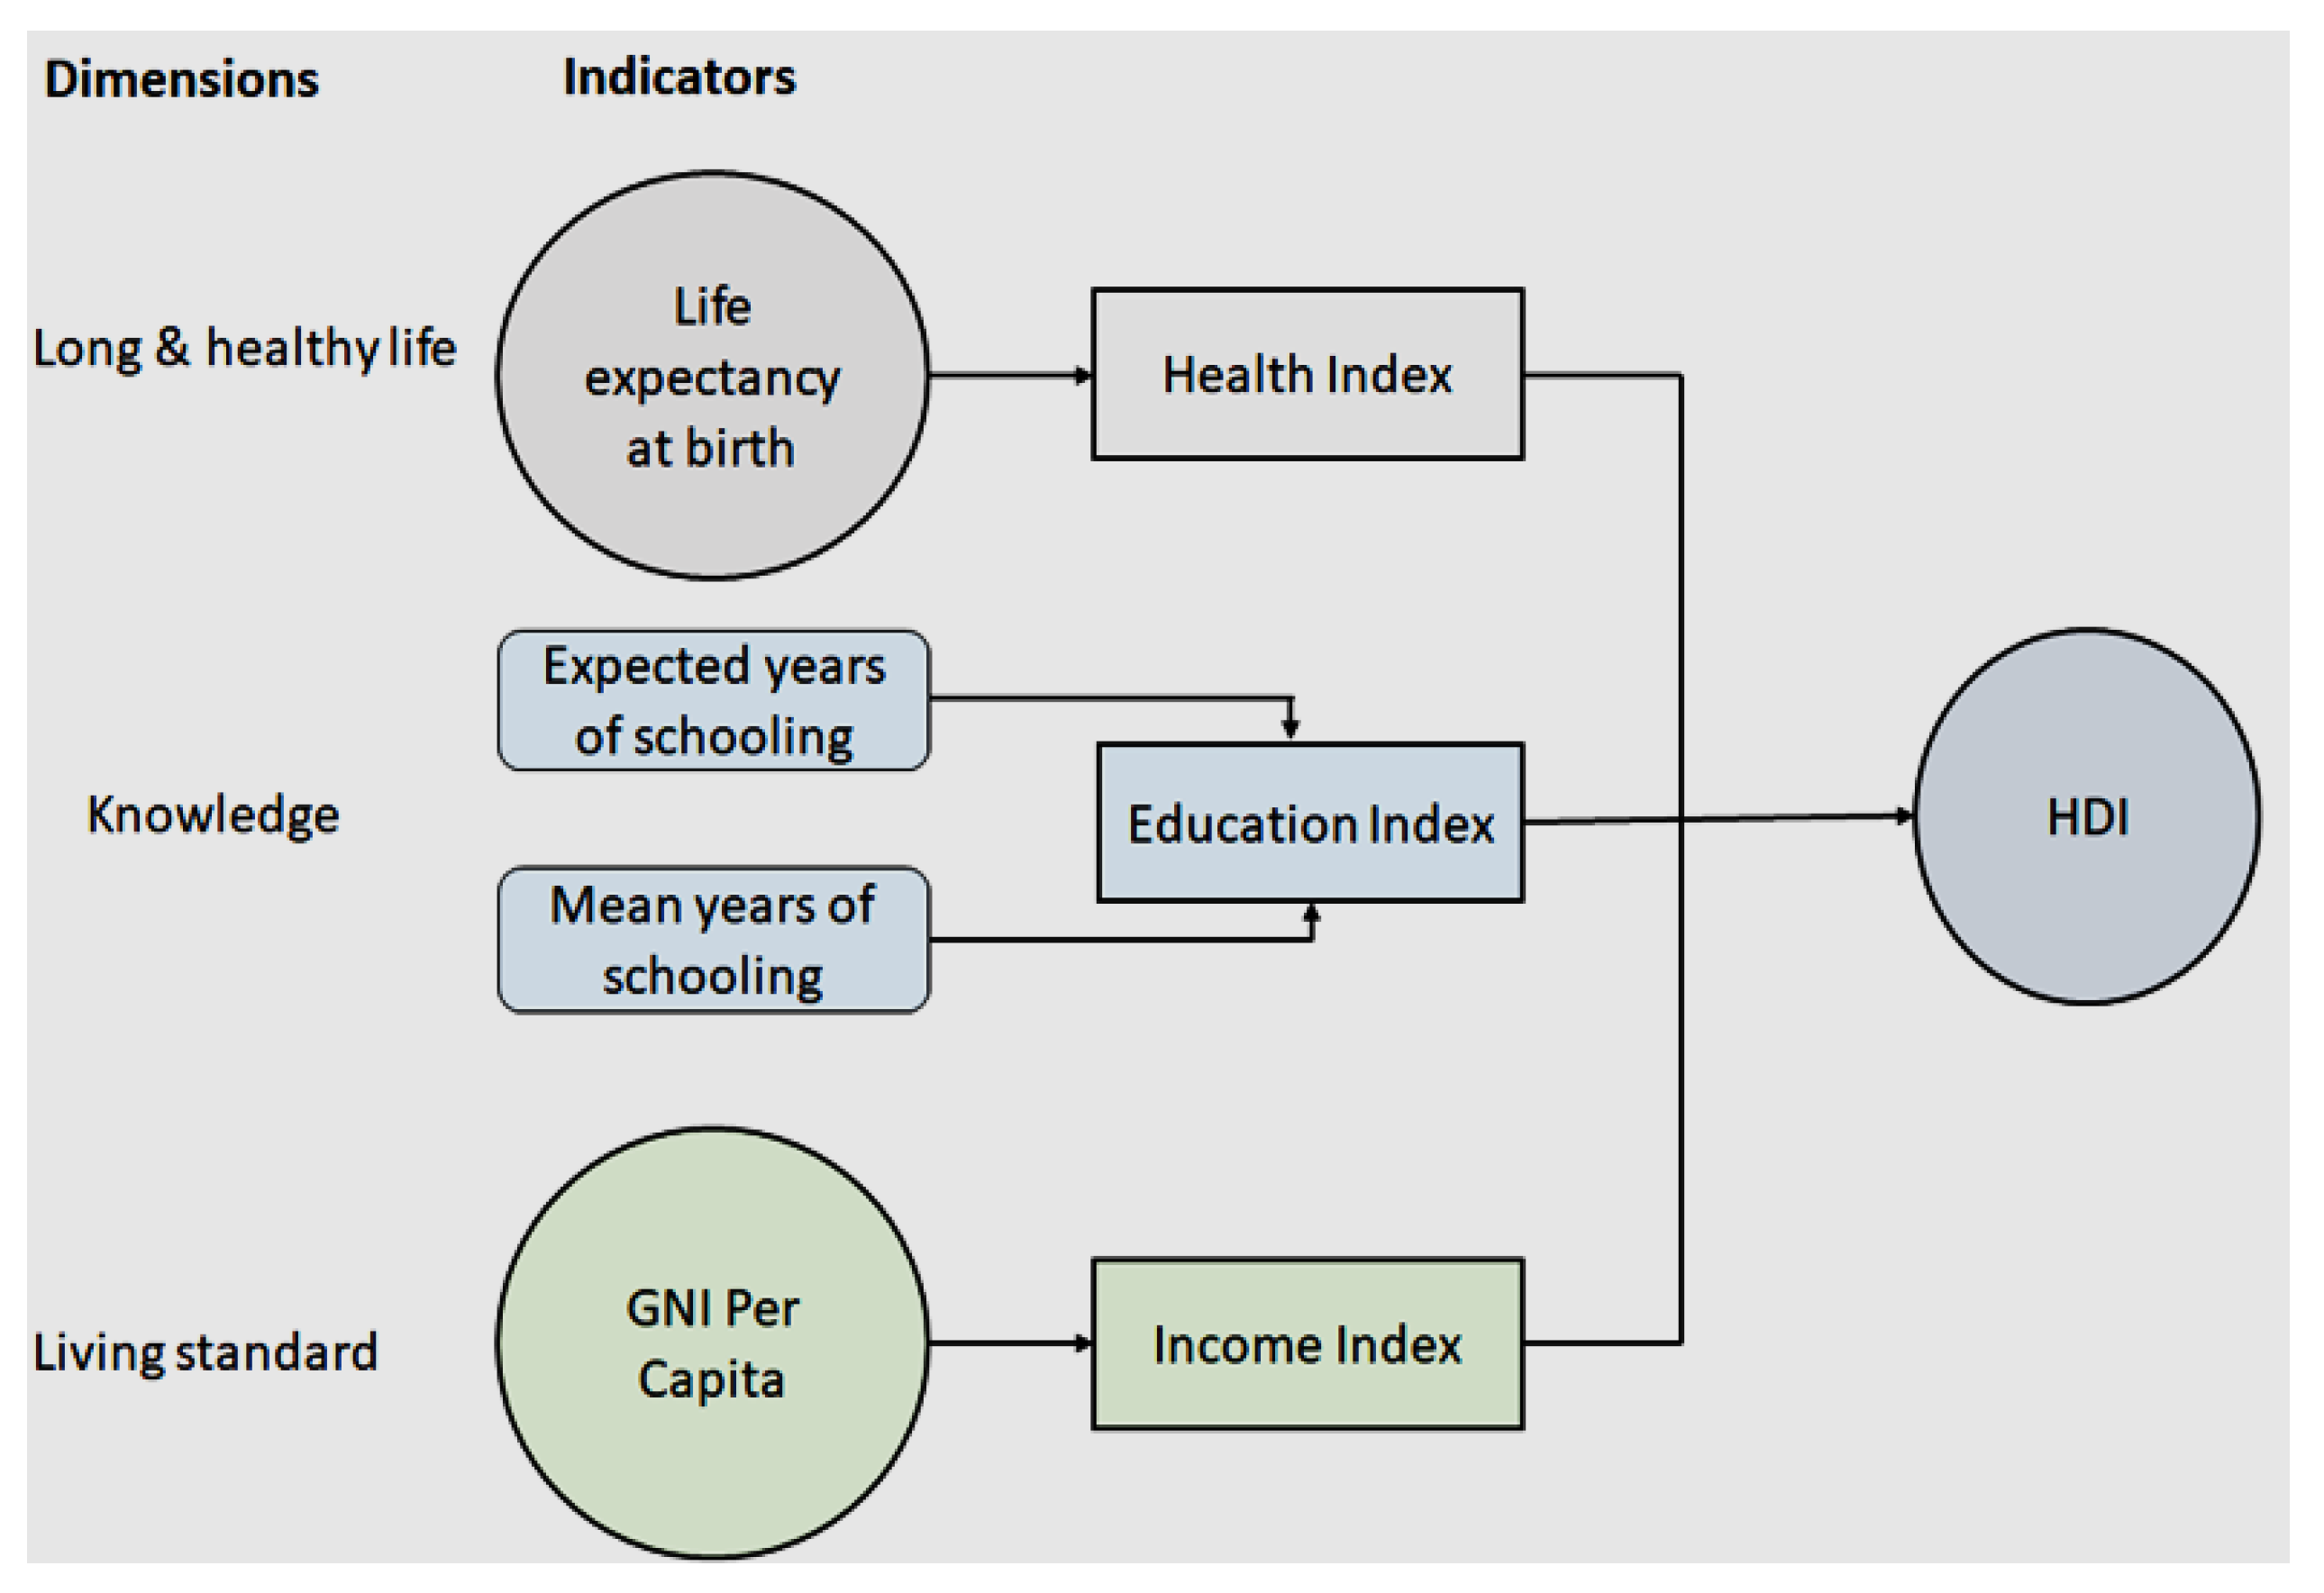
The human development index is a process that increases the ability of the masses to live much longer, flourishing lives; expand their knowledge; and retrieve facilities required for decent living conditions [15]. The United Nations Development Program [16] launched an HDI annual report in 1990, covering three dimensions: life expectancy, education, and per capita revenue to accelerate national socio-economic growth, and later it established a modern approach in 2010 [17]. A long and healthy life under the HDI is calculated by the life anticipation that is considered at the birth time. Education is assessed by the average number of years in school and the anticipated years of education [18]. In the era of globalization, education is possibly the most important part of human development because it allows people to flourish economically, as well as broaden their grasp of communal cultural and social activities. These three dimensions are divided into four indicators based on their level of human development index level, as shown in Figure 1.
Most countries usually depend on fossil fuel energy to meet the energy demand and spend less on current technologies, consequently having lower HDI [19,20]. HDI is the fundamental goal of economic development and it has considerable significance in social planning because each particular society desires a flourishing life [6,21]. Thus, HDI is significant in energy consumption, economic and social development, etc.; hence, it is probable to find opportunities to practice the synergistic development of energy and society to satisfy basic human needs [22,23].
Moreover, more than 736 million people in the modern world still live in absolute poverty (earning less than $1.90 per day), and 400 million of them lack access to even the most basic healthcare [15]. As the World Bank (WB) reported, poverty is a pronounced deprivation of human well-being. Insufficient refuge, water scarcity, rising inflation, illiteracy, inequality, and improper management of solid waste disposable are identified as having a low level of HDI [24]. All over the world, especially in developing economies, poverty is a hindrance to the human development index due to a lack of infrastructure development, corruption, disputes, awful administration, and the worst health services that cannot foster a healthy population devoted to striving for progression and development. However, poverty elimination is one of the fundamental objectives of human development policies for sustainable development. This paper also selects the employment indicator, which is imperative for the nation’s development. Employment increases social and economic development as well as also improving the human development index, but previous work ignores this issue. However, this study aims to explore the nexus between energy-HDI-employment in developing countries from 1990–2017.
Why did we select 30 developing countries as our case study? These countries are blessed with natural resources as well as at the forefront of investment in innovations, but they are facing several challenges such as energy insecurity, environmental degradation, fluctuations in economic growth, and HDI. Since 1990, Vietnam, Pakistan, Morocco, Philippines, India, Bangladesh, and China were at the lowest HDI rank. According to the human development index report, the situation of the human development process in Morocco, Iran, and India increasing their HDI gradually, but Pakistan is ranked 154 among these countries having 0.55 HDI.
Given this background, the current study is expected to make plentiful contributions to recent literature and policymaking in the selected countries in numerous directions. The main contribution of this study is added to the current literature threefold. (i) For the first time, this study explores the nexus among green energy, fossil fuel energy, employment, and human development in 30 developing countries with up-to-date statistics from 1990–2017, the role of employment on HDI has not been fully explored in the previous literature. Moreover, this study has added additional factors such as poverty, life expectancy, and education, as the author measures the different components of HDI. (ii) Unlike the previous work, this study analyzes the differential effects of green energy and fossil fuel energy on HDI to find out to the extent which type of energy (green or fossil fuel) is important for HDI. (iii) This study employs dynamic ordinary least squares (DOLS) and fully modified ordinary least squares FMOLS regression methods for the analysis. These approaches address core panel data problems, for instance, reducing multicollinearity, endogeneity bias, and serial correlation problems and trying to capture the dynamic association between the variables by using a minimum constraint set. In addition, this study also uses the panel causality vector error correction model (VECM) to infer causality direction and present some basic policy recommendations based on the findings.
The remainder of the paper is organized as follows: Section 2 explains the literature review; Section 3 presents the data and methodology, including data description and variables, theoretical framework, and model specifications; Section 4 reports the empirical outcomes and discussions; and Section 5 explicates the study’s conclusion with policy implications.

2. Literature Review

In this section, several studies examined the relationship between aggregate energy consumption and the human development index including [25] the Monetary Community of Central Africa, Sub-Saharan Africa [26]. The results of these studies disclose that energy consumption significantly increases HDI, whereas others found an insignificant association between them. For example, [27] in South Asian economies, argued that energy use and HDI are strongly interrelated and the availability of enough energy resources ensures mounting human development. Ref. [8] explored the association between energy use and HDI in 120 nations and the empirical outcome indicates that energy consumption decreases the HDI in developed nations. Further, other studies found a negative relationship between energy consumption and HDI because of less utilization of modern energy services [7,28,29].
Few studies investigated the nexus between differential effects of (renewable and non-renewable energy consumption) on HDI individually. For example, [13] investigated the relationship between non-renewable energy, HDI, and human capital. The empirical results show that traditional energy decreases human capital in the case of Pakistan. On the other hand, some studies [21,30] found that renewable power usage has an insignificant influence on the HDI in income-group countries. Table 1 summarizes the association between renewable and non-renewable with the human development index. The results from these studies are mixed due to different econometric models, different time-periods, and the country’s selection.
We include the poverty indicator in the study because this is an issue of particular concern in its moral and ethical context, which is a hideous and intolerable issue in the world. Human development is the basic aspect of any country’s social and economic development. However, poverty reduction, the creation of jobs, the provision of social services, access to energy services, etc., are crucial factors for sustainable development [35].
In addition, education or awareness is a key factor in increasing the human development index of a country. Some of the categories used to classify the possible effects of improved energy services on reducing poverty are well-being, health, education, economic opportunities for the poor, and trickle-down effects of higher productivity [36]. The individual’s level of education is related to an increase in their liberalization values in higher HDI nations, whereas, it is limited in lower HDI regions [37]. The redeployment of agricultural land is claimed to reduce poverty and income inequality, resulting in an increase in HDI for the study of Pakistan [38]. Poverty contributes to environmental degradation in Pakistan because people are responsible for the spoiling that has happened. However, this is often a consequence of fundamental social and economic issues [39]. One-fourth of the world’s population lives below the poverty line, especially in developing countries where many people struggle to acquire essentials like food, clean water, and shelter because they live below the poverty line [40]. The potential effect of education encourages economic growth as it, directly and indirectly, increased social equality and cohesion in 87-income countries [41].
Over past decades, life expectancy was significantly increased in most countries due to food security and better control of infectious diseases via vaccines [42], but due to the coronavirus (COVID-19), the pandemic has affected not only health systems but also impacted on energy and the economy, which distressed the world. Due to the COVID-19 pandemic, the energy demand deteriorated to almost zero in different sectors such as the industry and transportation sector. In April 2020, more than in 51 countries the electricity demand decreased by 7.6% [43]. Conversely, the electricity demand in the household sector increased because of people stay-at-home. According to [44], COVID-19 has significantly dislocated the healthcare services delivery and it faces difficulties in the organization of medical supplies and their utilization, especially in resources scarce countries. This worse crisis has an impact on all HDI indices such as health, education, economy, employment, and environment directly or indirectly.
Employment is an important indicator of the HDI to increase income and brings economic prosperity [45,46] and examines the drivers of human development in the European Union from 2010 to 2017. The result discloses that employment has an inverse effect on HDI. On the contrary, [47] analyzed the effect of economic growth, investment, and employment on HDI in Indonesia from 2006 to 2013 and found a positive relationship between employment and HDI.
To summarize the literature, it is obvious that past studies concentrated on the role of total energy in HDI, ignoring the differentiation effects of renewable and non-renewable energy on HDI simultaneously. However, there is a need for an assessment of disaggregated energy on human development, as ignoring one of the sources may produce flawed findings. Moreover, compared with previous work, this paper is the first attempt to consider the role of employment on the human development index in developing economies. Therefore, this research will cover this gap and present reliable and explicit policy implications for the human development index.

3. Data Source, Model Specification, and Estimation Strategy

3.1. Theoretical Framework

Before going to the econometric analysis, this section discusses the theoretical framework of all selected variables. Energy is the main driver of human development, as it enhances productivity through hastening social advancements. Without assuring and gaining access to clean, dependable, and inexpensive energy, it would not be possible to realize social and economic sustainable development [48]. Fossil fuel energy sources (oil, natural, and coal) are the largest contributors to economic development, but they generate a huge amount of carbon dioxide emissions. Therefore, the energy transition from conventional to non-conventional energy sources has attracted much attention.
Green energy plays an important role in economic development [49,50,51,52] as illustrated in Figure 2. This indicates that an increase in green energy can cause a higher level of HDI, whereas fossil fuel energy utilization could decrease HDI. Education is one of the aspects of the HDI and is recognized as a vital contributor to human development in the long term [53]. An increase in the knowledge and skills of workers may increase work productivity, which improves the human development index. Moreover, a poor education system can cause unemployment and poverty, which may decrease HDI.
Health is considered an important indicator for HDI because good health (as a proxy of life expectancy) plays a substantial role in human development. Life expectancy has a strong relation with future income and labor productivity. An increase in income and worker productivity has a positive effect on HDI, as well as having more investments in financial resources in health, contributing to long-term levels of HDI, and reducing poverty. Moreover, good health also improves children’s cognitive potential and rates of absenteeism; moreover, they learn better which may lead to improving HDI.

3.2. Data Description and Variables

This study aims to investigate the relationship between the human development index, renewable energy, non-renewable energy, poverty, education, life expectancy, and labor participation in 30 countries from 1990 to 2017. The list of these economies is given in Table 2. The data from all variables were obtained from British Petroleum [54], World Bank Development Indicators (WDI) [55], and United Nations Development Program (UNDP) [16]. According to previous studies [6,8,12], the HDI has gained widespread acceptance and it is a composite index of health, education, and income.
Green energy sources (solar, wind, thermal, etc.) and fossil fuel power sources (coal, oil, and gas) are estimated at a million tons of oil equivalent (MTOE) obtained from British Petroleum [54]). The education index is calculated by years of schooling expected and years of schooling means collected [18]. Life expectancy is calculated in the number of years, whereas the poverty headcount ratio of $5.50 a day, according to World Bank, is the percentage of the resident population of less than $5.50 that has been used to estimate the poverty in selected countries. Employment is measured in people (the working-age population). All variables of this study are transformed into natural logarithms. Table 3 illustrates the explanation of all variables.

3.3. Model Specifications

The current study constructs an econometric model to investigate the long run as well as causation correlation between energy use and human development index within a multivariate context as in the equation
H D I = G E ,   F F ,   E D U , L E ,   P O V ,   E M                    
Equation (1) is re-written in panel data form and adds error term as follows:
H D I i t = α 0 + α 1 G E i t + α 2 F F i t + α 3 E D U i t + α 4 L E i t + α 5 P O V i t + α 6 E M i t + ε i t
The above Equation (2) can be transformed into log form as presented below:
L H D I i t = α 0 + α 1 L G E i t + α 2 L F F i t + α 3 L E D U i t + α 4 L L E i t + α 5 L P O V i t + α 6 L E M + ε i t
Here, in Equation (3), LHDI indicates the logarithm of the human development index, LGE is the logarithm of green energy consumption, LFF represents the logarithm of fossil fuel energy, LEDU indicates the logarithm of the education index, LLE is the logarithm of life expectancy, LPOV represents the logarithm of poverty and LEM is the logarithm of employment. The impact of renewable energy on LHDI is projected to be favorable and considerable (α1 > 0). The anticipated sign of non-renewable energy consumption is adverse, and it would deteriorate human development indicators (α2 < 0). Moreover, the projected sign for the impact of education on LHDI is positive (α3 > 0), which suggests that education enhances human development indicators and the expected sign of life expectancy on human development is positive and significant (α4 > 0). Poverty also has a detrimental effect on HDI (α5 < 0). The expected sign of labor participation is positive, meaning that this indicator will enhance the human development process (α6 > 0). ε t is an error term. α0 & α6, all are parameters estimated in the model.

3.4. Estimation Strategy

3.4.1. Panel Unit Root Test and CO-Integration Test

Before conducting the analysis, the first step is to analyze the descriptive statistics. Next, the panel unit root trial can be employed to inspect the degree of integration between the common variables of human development, green energy and fossil fuel energy consumption, education, life expectancy, poverty, and employment. The panel unit root trial is the most widely employed econometrics technique because it is more influential than individual time sequences unit root trial and its asymptotic distribution is standard normal.
Three-panel unit root tests augmented Dickey–Fuller (ADF) [56], Im, Pesaran and Shin (IPS) [57], and Levin, Lin and Chu (LLC) [58] are applied in this study. Then, we use two kinds of co-integration methods, including Pedroni [59,60] and Kao [61], to verify the co-integration relationship among indicators. These co-integration techniques embrace two stages of the residual-based approach [62]. Figure 3 explains the methodological framework of this studied variable.

3.4.2. Long-Run Estimation Technique

Panel co-integration tests are simply able to specify the co-integrated variables. Panel fully modified ordinary least squares (FMOLS) dynamic ordinary least squares (DOLS) will be used to acquire efficient estimates of long-term liaison in the situation of heteroscedasticity and serial relationships. These methods are moderately effective in eradicating endogeneity problems in the regressor and resolving serial correlation issues in error terms [63,64]. Moreover, panel FMOLS is a non-parametric technique that solves the problem of endogeneity and autocorrelation, whereas the DOLS long-run estimator is a parametric method that removes the difficulties and uses leads and lags of the independent series in an OLS co-integration regression. However, more accurately, this study uses the weighted FMOLS approach for heterogeneous co-integrated panels and the weighted DOLS estimator, which permits heterogeneity in long-run variances.
The FMOLS estimator can be explained as follows:
    * β ^ F M O L S   = N 1 i = 1 N t = 1 T γ i t γ ι ¯ 2 1 ( t = 1 T γ i t γ ι ¯   C i t T θ ι ^  
      * β ^   D O L S = N 1 i = 1 N ρ i t ρ ι t ` 1 ( t = 1 T ρ i t C ι t ¯
Here, in Equations (4) and (5), * β ^ are the conventional FMOLS and DOLS estimator, γ represents the independent variables, C is the dependent variable, and ρ   indicates the vector of the regressors.

3.4.3. VECM Causality Test

When a long-run relationship exists, the next step is to examine the causal relationship between studied variables. To this extent, we employ the vector error correction model (VECM) technique to investigate the connection of causation between variables. The VECM causality technique permits us to explore long-run and short-run causal relations between variables; the statistical significance of the F-statistics value connected with right side variables is used to investigate the short-term causal association, while the meaning of corresponding error correction term ECT (−1) is used to assess the long-term causal link using t-test values. The following is an example of the estimated VECM equations:
Δ L H D I i t =   φ 1 j + k = 1 m θ 11 i k Δ L H D I i t k + k = 1 m θ 12 i k Δ L G E i t k + k = 1 m θ 13 i k Δ L F F i t k + k = 1 m θ 14 i k Δ L E D U i t k + k = 1 m θ 15 i k Δ L L E i t k + k = 1 m θ 16 i k Δ L P O V i t k + k = 1 m θ 17 i k Δ L E M i t k + λ 1 i E C T i t 1 + ε 1 i t
Δ L G E i t = φ 2 j + k = 1 m θ 21 i k Δ L H D I i t k + k = 1 m θ 22 i k Δ L G E i t k + k = 1 m θ 23 i k Δ L F F i t k + k = 1 m θ 24 i k Δ L E D U i t k + k = 1 m θ 25 i k Δ L L E i t k + k = 1 m θ 26 i k Δ L P O V i t k + k = 1 m θ 26 i k Δ L E M i t k λ 2 + E C T i t 1 + ε 2 i t
Δ L F F i t = φ 3 j + k = 1 m θ 31 i k Δ L H D I i t k + k = 1 m θ 32 i k Δ L G E i t k + k = 1 m θ 33 i k Δ L F F i t k + k = 1 m θ 34 i k Δ L E D U i t k + k = 1 m θ 35 i k Δ L L E i t k + k = 1 m θ 36 i k Δ L P O V i t k + k = 1 m θ 36 i k Δ L E M + λ 3 E C T i t 1 + ε 3 i t
Δ L E D U i t = φ 4 j + k = 1 m θ 41 i k Δ L H D I i t k + k = 1 m θ 42 i k Δ L G E i t k + k = 1 m θ 43 i k Δ L F F i t k + k = 1 m θ 44 i k Δ L E D U i t k + k = 1 m θ 45 i k Δ L L E i t k + k = 1 m θ 46 i k Δ L P O V i t k + k = 1 m θ 46 i k Δ L E M i t k λ 4 E C T i t 1 + ε 4 i t
Δ L L E i t = φ 5 j + k = 1 m θ 51 i k Δ L H D I i t k + k = 1 m θ 52 i k Δ L G E i t k + k = 1 m θ 53 i k Δ L F F i t k + k = 1 m θ 54 i k Δ L E D U i t k + k = 1 m θ 55 i k Δ L E i t k + k = 1 m θ 56 i k Δ L P O V i t k + k = 1 m θ 56 i k Δ L E M i t k + λ 5 E C T i t 1 + ε 5 i t
Δ L P O V i t = φ 6 j + k = 1 m θ 61 i k Δ L H D I i t k + k = 1 m θ 62 i k Δ L G E i t k + k = 1 m θ 63 i k Δ L F F i t k + k = 1 m θ 64 i k Δ L E D U i t k + k = 1 m θ 65 i k Δ L L E i t k + k = 1 m θ 66 i k Δ L P O V i t k + k = 1 m θ 66 i k Δ L E M i t k + λ 6 E C T i t 1 + ε 6 i t
Δ L E M i t = φ 7 + k = 1 m θ 61 i k Δ L H D I i t k + k = 1 m θ 62 i k Δ L G E i t k + k = 1 m θ 63 i k Δ L F F i t k + k = 1 m θ 64 i k Δ L E D U i t k + k = 1 m θ 65 i k Δ L L E i t k + k = 1 m θ 66 i k Δ L P O V i t k + k = 1 m θ 66 i k Δ L E M i t k + λ 7 E C T i t 1 + ε 7 i t
where LHDI indicates the logarithm of the human development index, LGE is the logarithm of green energy consumption, LFF represents the logarithm of fossil fuel energy, LEDU indicates the logarithm of the education index, LLE is the logarithm of life expectancy, LPOV represents the logarithm of poverty, and LEM is the logarithm of employment. i demonstrates cross-sections (i…30 states), t depicts the time-period (1990–2017), ∆ is the difference operator; m is the optimal lag length, ε is an error term, which is supposed to be unrelated with zero means, φ   indicates the intercept, whereas, θ is the slope coefficient of estimated parameters of the long run, λ represents the estimated coefficient of the speed of adjustment from the short run to long run, the magnitude of one lag period ECTt−1 designates error correction term resultant hoe to fast the disequilibrium react in response variables robustness to return to equilibrium.

4. Empirical Results and Discussion

4.1. Results

The full summary statistics of the variables are computed as given in Table 4 with mean, variation standard deviation, and boundaries minimum and maximum. Our study analyzed three different unit root methods to investigate the variable’s level of stationarity. To identify the order of integration, the findings of ADF [65]; IPS [57]; and LLC [58] approaches on the integration properties of HDI, green energy, fossil fuel energy, education index, poverty reduction, and employment are illustrated in Table 5. The results represent that all the series are non-stationary at their levels, whereas, all the variables are found to be stationary at first differences. In conclusion, the results imply that all factors are integrated in order, I (1), which endorses the probability of the existence of a long-run connection between factors.
The next stage is to verify whether the factors have a co-integration correlation between variables. Pedroni [59] and Kao [61] panel cointegration tests are used to determine the level of co-integration between variables.
In the heterogeneous panel Pedroni [59] test as seen in Table 6, the results reveal out of eleven test statistics seven statistics, five-panel statistics, and two group statistics were significant. The Pedroni co-integration test significantly rejects the null hypothesis at a 5% significance level; therefore, the outcomes show evidence of co-integration between factors. Moreover, in the Kao cointegration test, the outcomes indicate that we can strongly reject the null hypothesis of no co-integration and that variables have a long-term relationship.
The findings of FMOLS and DOLS are summarized in Table 7. The outcomes reveal that fossil fuel energy consumption has an adverse influence on the human development index. Where a 1% increase in fossil fuel energy consumption will decrease HDI by −0.016%; however, the relationship is weak. While green energy influenced the human development index positively and significantly at the significance level of 1%, which indicates that a 1% increase in green energy consumption increases HDI by 0.027%. The findings are inconsistent with the studies of [21,66], which found that green energy is inelastic to explain the HDI determinants but is relevant to the studies of [32,33].
The education results indicate that a 1% increase in education increases HDI by 0.294%. The coefficient of education is significant at a 1% significant level. The significant effect of education on HDI in this study shows that in higher HDI nations, and especially in lower HDI countries, an individual’s level of education is more significantly correlated with having a liberalized attitude The coefficient of life expectancy is significant at a 1% significance level, which indicates that a 1% increase in life expectancy increases HDI by 1.279%. The results are in the following studies [19,37]. The findings also indicate that poverty has a pessimistic effect on the human development index, which means that nations with high levels of poverty also have low levels of the human development index, resulting in lower mean values of development indicators. The findings confirm the study [24] that reveals poverty decreases HDI. Many nations around the world are particularly concerned about the issue of poverty. However, where discrepancies in amplification factors are extreme, average values may not effectively speculate low status, requiring a focus on the poverty level [67,68]. The outcomes indicate that a 1% increase in employment improves HDI by 0.097%, which means growth in labor productivity increases the HDI.
Regarding the DOLS model, the results of the green energy show that a 1% increase in green energy increases HDI; however, the relationship is insignificant. Furthermore, fossil fuel energy consumption also has the same finding as green energy consumption, where the relationship between fossil fuel energy consumption and HDI is not significant. Education is positively significant at a 1% significance level, where a 1% increase in education increases HDI by 0.269%. The coefficient of life expectancy is positive and significant at a 1% significance level, where a 1% increase in life expectancy increases HDI by 1.062%. Poverty has a negative influence on HDI; the outcomes indicate that poverty decreases HDI. The coefficient of social equality is positive, but it is insignificant. In conclusion, the estimated regressions revealed that the FMOLS structure gains the best outcomes in terms of better HDI than the DOLS structure.
To interpret causality directions, VECM Granger causality is used in this paper. The findings and direction of causality are stated in Table 8 and Figure 4. In the short-run results, one-way causality flows from HDI to renewable energy consumption, education, and social equality to renewable energy consumption. The findings also contribute evidence that life expectancy Granger causes non-renewable energy consumption and education, whereas renewable energy causes life expectancy. Moreover, HDI Granger causes poverty and a one-sided relationship between employment to poverty.
In the long run, the coefficient of error correction term (ECT) is substantial in HDI equations, green energy consumption, education, and employment. The error correction term has considerable values, so any short-term divergence will result in a reverse to the long-run connection. However, ECT coefficients are irrelevant in equations of fossil fuel energy consumption, poverty, and life expectancy.
Further, the long-run results suggest that a unidirectional causal correlation is flowing from green energy, fossil fuel energy, education, life expectancy, poverty, and social quality to HDI. In addition, HDI, non-renewable energy, education, life expectancy, poverty, and social quality all have a one-way causal relationship with renewable energy consumption. There is also one-way causation flowing from HDI, green energy consumption, fossil fuel energy, life expectancy, poverty, and social quality to education. The long-run results further suggest a unidirectional causality flowing from HDI, renewable energy consumption, fossil fuel energy, life expectancy, education, and poverty to employment. HDI and green energy consumption have long-run bidirectional causality, which implies that any alteration in green energy will induce a change in HDI and vice versa.

4.2. Discussion

The findings of the empirical analysis of the disaggregated energy consumption (green and fossil fuel), employment, HDI, education, life expectancy, and poverty in developing countries shed significant light on potential policy approaches that can help in improving the HDI for sustainable development.
The outcomes signify that green energy improves the human development index, whereas, fossil fuel energy decreases the HDI in developing countries. The findings portray that these economies still rely on traditional energy sources (oil, coal, and gas) to meet the energy demand. Economic growth, especially in developing countries, is largely based on the utilization of conventional energy sources [69,70]. However, replacing traditional energy with alternative energy sources could bring social and economic development to developing countries. Given the strong nexus between green energy and HDI, green energy is the imperative solution for energy security and climate change reduction. Green energy is essential to meet the energy needs for transportation, industrial use, electricity production, and domestic cooking. Additionally, the green energy sector promotes the creation of job opportunities and increases income levels.
Our finding shows that other indicators such as education, life expectancy, and employment significantly improve the HDI in developing countries. Education is a key factor in determining the higher HDI in any nation [71]. Therefore, the government of developing countries should educate the people and support the human capital through the acquiescence of skills and knowledge. Though, good health and education foster the abilities of the workers which increases labor productivity. Employment is an important factor that affects people’s well-being as well as providing financial security and reducing poverty.
According to the World Bank report [72], globally, more than 97 million people fell into extreme poverty due to COVID-19, pandemic. Before this pandemic disease, economic development was very slow in many countries. Our empirical results show that poverty decreases the level of the human development index in developing countries. However, to increase the level of the human development index, poverty can be overcome through economic and social developmental opportunities, investments in innovations, job opportunities, implementation of green energy sources, and a good political situation.

5. Conclusions and Policy Recommendations

5.1. Conclusions

This study intends to analyze the connection between disaggregated energy consumption (green and fossil fuel), employment, and HDI integrating education, life expectancy, and poverty in 30 developing countries from 1990 to 2017. The FMOLS and DOLS co-integration regression models are used in this work to demonstrate the long-term relationship consistency. To determine casual correlation amid underlying variables of inquiry, we utilize the VECM Granger casualty technique. The empirical results express interesting and novel findings of this study. The results obtained from regression analysis showed that renewable energy, education, employment, and life expectancy improve HDI, whereas non-renewable energy and poverty decrease the HDI for the selected 30 countries. The VECM Granger causality findings denote bidirectional causality between renewable power uses and the human development index.

5.2. Policy Recommendations

The findings of this study suggest some policy implications for developing countries. First, our findings reveal that green energy increases human development. Therefore, governments in developing countries should develop policies to implement green energy sources such as wind, solar, geothermal, etc. The government of these countries needs to invest more in green energy sources for sustainable development. Effective green energy use is beneficial to enhancing impoverished masses’ living standards, consequently improving human development levels. However, green energy sources are imperative in attaining an efficient and reliable human development index, particularly in developing countries because of their enormous, well-developed, and abundant resources relative to other energy sources. Therefore, governments in developing countries should plan to design green energy projects for more energy production. In addition, they should revise tax policy and make it beneficial for overseas and local investors to use green energy sources.
Second, conventional energy sources, i.e., coal, oil, and gas are not sustainable and are only hazardous to health but also adversely impact energy poverty, consequently leading to a low level of human development in developing countries. However, these countries should rely less on fossil fuel energy sources because they cause several issues such as depleting nature, inequality in education, lack of income, and environmental degradation.
Third, based on the results, life expectancy, and education improve the HDI in developing countries. Therefore, there is a need to invest more expenditures on health and education programs to improve HDI. A high level of education, a significant share of educated people, and people with higher knowledge can increase productivity, consequently improving the HDI level. Finally, the empirical results disclose that employment improves the HDI, whereas, poverty decreases the HDI in developing countries. Employment means the large number of people working is imperative for the nation’s economy. As the number of working people increases, it produces more output which would positively affect HDI. Although, a large number of working people’s productivity (employment) reduces poverty. Moreover, poverty is not simply the absence of income to guard against the exigency of life, it produces a picture of aimlessness, insecurity, and discouragement to the extreme in the mind of the poor.
The situation in each country is different according to the development level of the countries; hence, the allocation of green energy sources among countries may vary depending on the countries’ geographical locations. Developed and developing countries (American, European, Asian, and African) are facing several challenges which need to be controlled such as inflation, energy insecurity, low levels of HDI, and environmental deterioration. However, some policy implications that can improve the development of these countries and reduce the poverty such as launching programs to increase the awareness of the utilization of renewable energy, apportioning resources for health and education programs that improve the HDI, and creating more job opportunities to improve the level of HDI.
Like other works, this study has some important limitations. This present study explores the nexus between green energy, fossil fuel energy, poverty, education and employment, and HDI for the case of 30 developing economies. This opens the door for future research including both time series and panel data for other economies that have higher or lower human development indexes. In addition, future research work can focus on other important factors such as institutional quality, corruption, ecological footprint, and political instability. Moreover, the alternative econometric technique can be applied to other countries to expand the literature.

Author Contributions

A.A.: conceptualization, methodology, software, data curation, writing original draft, visualization, validation, and writing—reviewing and editing. M.R.: conceptualization, methodology, software, writing original draft, and writing—reviewing and editing. M.S.: conceptualization, methodology, resource, and writing—reviewing and editing. J.Y.: conceptualization and supervision. All authors have read and agreed to the published version of the manuscript.

Funding

This research received no external funding.

Data Availability Statement

The data on study variables can download from Worl Bank Dtatabase https://databank.worldbank.org/source/world-development-indicatores (accessed on 26 March 2023).

Conflicts of Interest

The authors declare no conflict of interest.

References

  1. Azam, A.; Rafiq, M.; Shafique, M.; Yuan, J. Renewable electricity generation and economic growth nexus in developing countries: An ARDL approach. Econ. Res.-Ekon. Istraz. 2020, 34, 2423–2446. [Google Scholar] [CrossRef]
  2. Azam, A.; Ateeq, M.; Shafique, M.; Rafiq, M.; Yuan, J. Primary energy consumption-growth nexus: The role of natural resources, quality of government, and fixed capital formation. Energy 2022, 263, 125570. [Google Scholar] [CrossRef]
  3. Azam, A.; Rafiq, M.; Shafique, M.; Ateeq, M.; Yuan, J. Investigating the impact of renewable electricity consumption on sustainable economic development: A panel ARDL approach. Int. J. Green Energy 2021, 18, 1185–1192. [Google Scholar] [CrossRef]
  4. Chen, J.; Xu, C.; Shahbaz, M.; Song, M. Interaction determinants and projections of China’s energy consumption: 1997–2030. Appl. Energy 2021, 283, 116345. [Google Scholar] [CrossRef]
  5. Cai, Y.; Sam, C.Y.; Chang, T. Nexus between clean energy consumption, economic growth and CO2 emissions. J. Clean Prod. 2018, 182, 1001–1011. [Google Scholar] [CrossRef]
  6. Pirlogea, C. The human development relies on energy. Panel data evidence. Procedia Econ. Financ. 2012, 3, 496–501. [Google Scholar] [CrossRef]
  7. Dias, R.A.; Mattos, C.R.; Balestieri, J.A.P. The limits of human development and the use of energy and natural resources. Energy Policy 2006, 34, 1026–1031. [Google Scholar] [CrossRef]
  8. Martinez, D.M.; Ebenhack, B.W. Understanding the role of energy consumption in human development through the use of saturation phenomena. Energy Policy 2008, 36, 1430–1435. [Google Scholar] [CrossRef]
  9. Ciupăgeanu, D.A.; Lăzăroiu, G.; Barelli, L. Wind energy integration: Variability analysis and power system impact assessment. Energy 2019, 185, 1183–1196. [Google Scholar] [CrossRef]
  10. Universitatea Politehnică Bucureṣti. IEEE Power & Energy Society, and Institute of Electrical and Electronics Engineers. In Proceedings of the 2019 IEEE PES Innovative Smart Grid Technologies Europe (ISGT-Europe), Bucharest, Romania, 29 September–2 October 2019. [Google Scholar]
  11. Azam, A.; Rafiq, M.; Shafique, M.; Zhang, H.; Ateeq, M.; Yuan, J. Analyzing the relationship between economic growth and electricity consumption from renewable and non-renewable sources: Fresh evidence from newly industrialized countries. Sustain. Energy Technol. Assess. 2021, 44, 100991. [Google Scholar] [CrossRef]
  12. Barak, D. The Impact of Income Inequality, Renewable Energy Consumption, Non-Renewable Energy Consumption and Per Capita Income on Poverty: Evidence from BRICS Economies. Ekonomika 2022, 101, 62–83. [Google Scholar] [CrossRef]
  13. Asghar, M.M.; Wang, Z.; Wang, B.; Zaidi, S.A.H. Nonrenewable energy—Environmental and health effects on human capital: Empirical evidence from Pakistan. Environ. Sci. Pollut. Res. 2020, 27, 2630–2646. [Google Scholar] [CrossRef] [PubMed]
  14. Ang, J.B. Economic development, pollutant emissions and energy consumption in Malaysia. J. Policy Model 2008, 30, 271–278. [Google Scholar] [CrossRef]
  15. UNDP. UNDP: Human Development Report 1990. Human Development; UNDP: New York, NY, USA, 1990. [Google Scholar]
  16. UNDP. Human Development Indices and Indicators: 2018 Statistical Update—Bangladesh Online; UNDP: New York, NY, USA, 2020. [Google Scholar]
  17. Hou, J.; Walsh, P.P.; Zhang, J. The dynamics of Human Development Index. Soc. Sci. J. 2015, 52, 331–347. [Google Scholar] [CrossRef]
  18. UNDP. Human Development Report 2016: Human Development for Everyone; United Nations Development Programme: New York, NY, USA, 2016. [Google Scholar]
  19. Yumashev, A.; Ślusarczyk, B.; Kondrashev, S.; Mikhaylov, A. Global indicators of sustainable development: Evaluation of the influence of the human development index on consumption and quality of energy. Energies 2020, 13, 2768. [Google Scholar] [CrossRef]
  20. Akizu-Gardoki, O.; Bueno, G.; Wiedmann, T.; Lopez-Guede, J.M.; Arto, I.; Hernandez, P.; Moran, D. Decoupling between human development and energy consumption within footprint accounts. J. Clean. Prod. 2018, 202, 1145–1157. [Google Scholar] [CrossRef]
  21. Ouedraogo, N.S. Energy consumption and human development: Evidence from a panel cointegration and error correction model. Energy 2013, 63, 28–41. [Google Scholar] [CrossRef]
  22. Wu, Q.; Clulow, V.; Maslyuk, S. Energy consumption inequality and human development. In Proceedings of the 2010 International Conference on Management Science & Engineering 17th Annual Conference Proceedings, Melbourne, Australia, 24–26 November 2010; pp. 1398–1409. [Google Scholar]
  23. Van Tran, N.; Van Tran, Q.; Do, L.T.T.; Dinh, L.H.; Do, H.T.T. Trade off between environment, energy consumption and human development: Do levels of economic development matter? Energy 2019, 173, 483–493. [Google Scholar] [CrossRef]
  24. Amaluddin, A.; Payapo, R.W.; Laitupa, A.A.; Serang, M.R. A Modified Human Development Index and Poverty in the Villages of West Seram Regency, Maluku Province, Indonesia. Int. J. Econ. Financ. Issues 2018, 8, 325. [Google Scholar]
  25. Lekana, H.C.; Ikiemi, C.B.S. Effect of energy consumption on human development in the countries of the Economic and Monetary Community of Central Africa (EMCCA). Theor. Econ. Lett. 2021, 11, 404–421. [Google Scholar] [CrossRef]
  26. Sarkodie, S.A.; Adams, S. Electricity access, human development index, governance and income inequality in Sub-Saharan Africa. Energy Rep. 2020, 6, 455–466. [Google Scholar] [CrossRef]
  27. Salam, R.A.; Amber, K.P.; Ratyal, N.I.; Alam, M.; Akram, N.; Muñoz, C.Q.G.; Márquez, F.P.G. An Overview on Energy and Development of Energy Integration in Major South Asian Countries: The Building Sector. Energies 2020, 13, 5776. [Google Scholar] [CrossRef]
  28. Wu, Q.; Maslyuk, S.; Clulow, V. Energy Consumption Inequality and Human Development in HDI countries. In Energy Efficiency—A Bridge to Low Carbon Economy; InTech: London, UK, 2012. [Google Scholar] [CrossRef] [Green Version]
  29. Kanagawa, M.; Nakata, T. Assessment of access to electricity and the socio-economic impacts in rural areas of developing countries. Energy Policy 2008, 36, 2016–2029. [Google Scholar] [CrossRef]
  30. Wang, Z.; Bui, Q.; Zhang, B.; Nawarathna, C.L.K.; Mombeuil, C. The nexus between renewable energy consumption and human development in BRICS countries: The moderating role of public debt. Renew Energy 2021, 165, 381–390. [Google Scholar] [CrossRef]
  31. Niu, S.; Jia, Y.; Wang, W.; He, R.; Hu, L.; Liu, Y. Electricity consumption and human development level: A comparative analysis based on panel data for 50 countries. Int. J. Electr. Power Energy Syst. 2013, 53, 338–347. [Google Scholar] [CrossRef]
  32. Sasmaz, M.U.; Sakar, E.; Yayla, Y.E.; Akkucuk, U. The relationship between renewable energy and human development in OECD countries: A panel data analysis. Sustainability 2020, 12, 7450. [Google Scholar] [CrossRef]
  33. Abid, N.; Wu, J.; Ahmad, F.; Draz, M.U.; Chandio, A.A.; Xu, H. Incorporating environmental pollution and human development in the energy-growth nexus: A novel long run investigation for Pakistan. Int. J. Environ. Res. Public Health 2020, 17, 5154. [Google Scholar] [CrossRef] [PubMed]
  34. Danish; Zhang, B.; Wang, B.; Wang, Z. Role of renewable energy and non-renewable energy consumption on EKC: Evidence from Pakistan. J. Clean. Prod. 2017, 156, 855–864. [Google Scholar] [CrossRef]
  35. Ruseva, M.; Genova, D.; Jekova, V. Impact of poverty on the human development index in Bulgaria (for example of South Central region). Trakia J. Sci. 2015, 13 (Suppl. S1), 115–120. [Google Scholar] [CrossRef]
  36. Zahid, T.; Arshed, N.; Munir, M.; Hameed, K. Role of energy consumption preferences on human development: A study of SAARC region. Econ. Change Restruct. 2020, 54, 121–144. [Google Scholar] [CrossRef]
  37. Van Hiel, A.; Van Assche, J.; De Cremer, D.; Onraet, E.; Bostyn, D.; Haesevoets, T.; Roets, A. Can education change the world? Education amplifies differences in liberalization values and innovation between developed and developing countries. PLoS ONE 2018, 13, e0199560. [Google Scholar] [CrossRef]
  38. Qasim, M.; Pervaiz, Z.; Chaudhary, A.R. Do Poverty and Income Inequality Mediate the Association Between Agricultural Land Inequality and Human Development? Soc. Indic Res. 2020, 151, 115–134. [Google Scholar] [CrossRef]
  39. Hassan, S.A.; Zaman, K.; Gul, S. The Relationship between Growth-Inequality-Poverty Triangle and Environmental Degradation: Unveiling the Reality. Arab. Econ. Bus. J. 2015, 10, 57–71. [Google Scholar] [CrossRef] [Green Version]
  40. Mahmood, H.; Tanveer, M.; Furqan, M. Rule of Law, Corruption Control, Governance, and Economic Growth in Managing Renewable and Nonrenewable Energy Consumption in South Asia. Int. J. Environ Res. Public Health 2021, 18, 10637. [Google Scholar] [CrossRef]
  41. Gylfason, T. Education, Social Equality and Economic Growth: A View of the Landscape. CESifo Econ. Stud. 2003, 49, 557–579. [Google Scholar] [CrossRef]
  42. Wang, A.; Arah, O.A. The impact of human development on individual health: A causal mediation analysis examining pathways through education and body mass index. PeerJ 2017, 5, e3053. [Google Scholar] [CrossRef] [PubMed] [Green Version]
  43. Olubusoye, O.E.; Akintande, O.J.; Yaya, O.S.; Ogbonna, A.E.; Adenikinju, A.F. Energy pricing during the COVID-19 pandemic: Predictive information-based uncertainty indexes with machine learning algorithm. Intell. Syst. Appl. 2021, 12, 200050. [Google Scholar] [CrossRef]
  44. Haileamlak, A. The impact of COVID-19 on health and health systems. Ethiop. J. Health Sci. 2021, 31, 1073–1074. [Google Scholar] [CrossRef] [PubMed]
  45. Mihci, H.; Taner, M.T.; Sezen, B. Employment-adjusted human development index. South East Eur. J. Econ. Bus. 2012, 7, 115–137. [Google Scholar] [CrossRef]
  46. Tudorache, M.-D. Tudorache, Maria-Daniela Examining the Drivers of Human Development in European Union Examining the Drivers of Human Development in European Union. Available online: http://hdl.handle.net/10419/222443 (accessed on 26 March 2023).
  47. Feriyanto, N. The effect of employment, economic growth, and investment on HDI: In provinces in Indonesia. J. Econ. Bus. Account. Ventur. 2016, 19. [Google Scholar] [CrossRef]
  48. Dasqupta, P.; Weale, M. On measuring the quality of life. World Dev. 1992, 20, 119–131. [Google Scholar] [CrossRef]
  49. Inglesi-Lotz, R. The impact of renewable energy consumption to economic growth: A panel data application. Energy Econ. 2016, 53, 58–63. [Google Scholar] [CrossRef] [Green Version]
  50. Ali, S.; Anwar, S.; Nasreen, S. Renewable and Non-Renewable Energy and its Impact on Environmental Quality in South Asian Countries. Forman J. Econ. Stud. 2017, 13. [Google Scholar] [CrossRef]
  51. Azam, A.; Rafiq, M.; Shafique, M.; Zhang, H.; Yuan, J. Analyzing the Effect of Natural Gas, Nuclear Energy and Renewable Energy on GDP and Carbon Emissions: A multi-variate Panel Data analysis. Energy 2020, 219, 119592. [Google Scholar] [CrossRef]
  52. Azam, A.; Rafiq, M.; Shafique, M.; Yuan, J. An empirical analysis of the non-linear effects of natural gas, nuclear energy, renewable energy and ICT-Trade in leading CO2 emitter countries: Policy towards CO2 mitigation and economic sustainability. J. Environ. Manag. 2021, 286, 112232. [Google Scholar] [CrossRef]
  53. Fang, Z.; Chang, Y. Energy, human capital and economic growth in Asia Pacific countries—Evidence from a panel cointegration and causality analysis. Energy Econ. 2016, 56, 177–184. [Google Scholar] [CrossRef]
  54. British Petroleum. BP Statistical Review of World Energy Report; BP: London, UK, 2019. [Google Scholar]
  55. WDI. World Development Indicators|DataBank; The World Bank: Washington, DC, USA, 2019. [Google Scholar]
  56. Maddala, G.S.; Wu, S. A Comparative Study of Unit Root Tests with Panel Data and a New Simple Test. Oxf. Bull. Econ. Stat. 1999, 61, 631–652. [Google Scholar] [CrossRef]
  57. Im, K.S.; Pesaran, M.H.; Shin, Y. Testing for unit roots in heterogeneous panels. J. Econom. 2003, 115, 53–74. [Google Scholar] [CrossRef]
  58. Levin, A.; Lin, C.F.; Chu, C.S.J. Unit root tests in panel data: Asymptotic and finite-sample properties. J. Econom. 2002, 108, 1–24. [Google Scholar] [CrossRef]
  59. Pedroni, P. Panel cointegration: Asymptotic and finite sample properties of pooled time series tests with an application to the PPP hypothesis. Econ. Theory 2004, 20, 597–625. [Google Scholar] [CrossRef] [Green Version]
  60. Pedroni, P. Critical Values for Cointegration Tests in Heterogeneous Panels with Multiple Regressors. Oxf. Bull. Econ. Stat. 1999, 61, 653–670. [Google Scholar] [CrossRef]
  61. Kao, C. Spurious regression and residual-based tests for cointegration in panel data. J. Econ. 1999, 90, 1–44. [Google Scholar] [CrossRef]
  62. Engle, R.F.; Granger, C.W.J. Co-integration and error correction: Representation, estimation, and testing. Econometrica 1987, 55, 251–276. [Google Scholar] [CrossRef]
  63. Bhattacharya, M.; Paramati, S.R.; Ozturk, I.; Bhattacharya, S. The effect of renewable energy consumption on economic growth: Evidence from top 38 countries. Appl Energy 2016, 162, 733–741. [Google Scholar] [CrossRef]
  64. Dogan, E.; Seker, F. Determinants of CO2 emissions in the European Union: The role of renewable and non-renewable energy. Renew Energy 2016, 94, 429–439. [Google Scholar] [CrossRef]
  65. Dickey, D.A.; Fuller, W.A. Distribution of the estimators for autoregressive time series with a unit root. J. Am. Stat. Assoc. 1979, 74, 427. [Google Scholar]
  66. Wang, Z.; Danish; Zhang, B.; Wang, B. Renewable energy consumption, economic growth and human development index in Pakistan: Evidence form simultaneous equation model. J. Clean. Prod. 2018, 184, 1081–1090. [Google Scholar] [CrossRef]
  67. Shafique, M.; Azam, A.; Rafiq, M.; Luo, X. Life cycle assessment of electric vehicles and internal combustion engine vehicles: A case study of Hong Kong. Res. Transp. Econ. 2021, 91, 101112. [Google Scholar] [CrossRef]
  68. Shafique, M.; Azam, A.; Rafiq, M.; Luo, X. Evaluating the relationship between freight transport, economic prosperity, urbanization, and CO2 emissions: Evidence from Hong Kong, Singapore, and South Korea. Sustainability 2020, 12, 10664. [Google Scholar] [CrossRef]
  69. Shafique, M.; Luo, X. Environmental life cycle assessment of battery electric vehicles from the current and future energy mix perspective. J. Environ. Manag. 2021, 303, 114050. [Google Scholar] [CrossRef] [PubMed]
  70. Shafique, M.; Azam, A.; Rafiq, M.; Luo, X. Investigating the nexus among transport, economic growth and environmental degradation: Evidence from panel ARDL approach. Transp. Policy 2021, 109, 61–71. [Google Scholar] [CrossRef]
  71. Azam, A.; Rafiq, M.; Shafique, M.; Yuan, J. Mitigating carbon emissions in China: The role of Clean Energy, technological innovation and political-institutional quality. Front. Environ. Sci. 2022, 10, 182. [Google Scholar] [CrossRef]
  72. Ayoo, C. Poverty Reduction Strategies in Developing Countries. In Rural Development-Education, Sustainability, Multifunctionality; InTechOpen: London, UK, 2022. [Google Scholar]
Figure 1. Dimensions of Human Development Index.
Energies 16 03132 g001
Figure 2. The theoretical model of the study. Source: Author’s representation.
Energies 16 03132 g002
Figure 3. Flowchart of the research methodology.
Energies 16 03132 g003
Figure 4. The causality relationship of the studied variables.
Energies 16 03132 g004
Table 1. Literature summarized on energy consumption–development nexus.
ReferenceStudy AreaDurationMethodologyResults
[6]European1997–2008Regression AnalysisGrowth Hypothesis
[19]OECD2006–20173SLSGrowth Hypothesis
[21]15 Developing Countries1988–2008Panel Co-Integration, Error Correction TermConservation Hypothesis
[31]50 Income Countries1990–2009Panel Co-Integration, Causality TestFeedback Hypothesis
[32]28 OECD1990–2017Panel Co-Integration, Causality TestFeedback Hypothesis
[33]Pakistan1990–2017Regression and Causality AnalysisNeutrality Hypothesis
[34]Pakistan1970–2012ARDL, VECM CausalityFeedback Hypothesis
Note: OECD, Organization for Economic Co-operation and Development; 2SLS, Two-Stage least squares, 3SLS, three-stage least squares.
Table 2. Region-wise distribution of developing countries.
ContinentsNumberName of Countries
Europe and Central Asia9Azerbaijan (AZE), Belarus (BLR), Kazakhstan (KAZ), Russia (RUS), Ukraine (UKR), Greece (GRC), Poland (POL), Romania (ROU), Turkey (TUR)
South Asia3Bangladesh (BGD), Sri Lanka (LKA), Pakistan (PAK)
Eat Asia and Pacific6China (CHN), Indonesia (IND), India (IND), Malaysia (MYS), Philippines (PHL), Vietnam (VNM)
The Middle East and North Africa5Algeria (DZA), Egypt (EGY), Morocco (MAR), Iran (IRN), Iraq (IRQ)
Sub-Saharan Africa1South Africa (ZAF)
Latin America and Caribbean6Argentina (ARG), Brazil (BRA), Chile (CHL), Colombia (COL), Ecuador (EUC), Peru (PER)
Table 3. Data and variables description.
VariablesMeasurementData Source
HDIHuman Development Index (Index)UNDP
GEGreen Energy Consumption (Mtoe)BP Statistical Review
FFFossil Fuel Energy (Mtoe)BP Statistical Review
EDUEducation (Index)UNDP
LELife Expectancy (In Years)WDI
POVPoverty Headcount RatioWDI
EMEmployment (% of the Population)WDI
Table 4. Descriptive statistics of the variables.
VariableHDIGEFFEDULEPOVEM
Mean−0.3892071.8242321.262483−0.5521654.2503712.9596863.982426
Median−0.3841931.9953781.4175660.4796504.2545913.3357704.056989
Maxi4.3174889.8515104.1743830.1427164.3992254.5890414.597743
Mini−0.931404−5.521461−4.033954−1.5847423.978634−3.3025852.418589
Std.Dev0.3160752.2865711.4884300.2763540.0700391.3271800.392338
Table 5. Panel unit root test results.
MethodVariablesLevelFirst Difference
ADFLHDI74.279240.639 a
LGE54.345345.829 a
LFF69.805387.212 a
LEDU48.794171.181 a
LLE73.991303.606 a
LPOV71.723389.836 a
LEM52.292217.003
IPSLHDI0.1670−10.300 a
LGE2.263−15.771 a
LFF0.112−17.609 a
LEDU0.876−6.968 a
LLE1.633−4.749 a
LPOV1.115−18.105 a
LEM1.860−9.685 a
LLCLHDI−0.268−7.832 a
LGE2.843−12.805 a
LFF0.276−16.592 a
LEDU3.527−3.381 a
LLE1.610−4.052 a
LPOV0.673−7.1260 a
LLC−0.150−3.288 a
Note: a implies a significance level at 1%, respectively. HDI, GE, FF, EDU, LE, POV, EM represents the human development index, renewable energy consumption, non-renewable energy consumption, education, poverty, and social equality.
Table 6. Panel co-integration test outcomes.
Pedroni Residual Co-Integration Test
Alternative Hypothesis: Common AR Coefficients (Within-Dimension)
Panel v-Statistic−2.691
Panel rho-Statistic−1.420 c
Panel PP-Statistic−17.049 a
Panel ADF-Statistic−15.765 a
Panel v-Statistic (Weighted Statistic)−3.062
Panel rho-Statistic(Weighted Statistic)2.203
Panel PP-Statistic (Weighted Statistic)−4.894 a
Panel ADF-Statistic (Weighted Statistic)−4.903 a
Alternative Hypothesis: Individual AR Coefficients (Between-Dimension)
Group rho-Statistic4.162
Group PP-Statistic−4.914 a
Group ADF-Statistic−3.945 a
Kao Residual Co-Integration Test
Augmented Dickey-Fuller−1.807 b
Note: Newey–West automatic bandwidth selection and Bartlett Kernel. a, b, c specifies 1%, 5%, 10% significance level respectively.
Table 7. Long-run analysis.
Dependent Variable: HDI
FMOLSDOLS
Independent VariablesCoefficientp-ValueCoefficientp-Value
LGE0.027 a0.0000.0030.385
LFF−0.016 c0.0660.0050.330
LEDU0.294 a0.0000.269 a0.000
LLE1.279 a0.0001.062 a0.000
LPOV−0.023 a0.000−0.0020.696
LEM0.097 a0.0000.0590.226
Notes: a, c specifies 1%, 10% significance level respectively.
Table 8. Panel Granger causality results.
Dependent VariableSources of Causation (Independent Variables)
Short-Run
ΔLHDI ΔLGE ΔLFF ΔLEDU ΔLLE ΔLPOV ΔLEMP
ECT
ΔLHDI-−0.018−0.0080.019−0.242−0.0140.276−1.082 a
ΔLGE0.743 c−0.2291.919 c12.3400.11412.533 a−1.140 b
ΔFF0.035−3.6490.0030.706 a−0.0030.003−0.008
ΔLEDU−0.0140.0183−0.004-−5.630 b−0.009−0.628−0.395 a
ΔLLE0.0000.000 b0.0000.000-−0.0000.0030.000
ΔLPOV−0.084 b0.0410.0120.8714.8002.280 a−0.265
ΔLEMP0.0003 b0.002−0.0000.028−0.1950.000−3.326 a
Notes: a, b, c denotes 1%, 5%, 10% significance level respectively.
Disclaimer/Publisher’s Note: The statements, opinions and data contained in all publications are solely those of the individual author(s) and contributor(s) and not of MDPI and/or the editor(s). MDPI and/or the editor(s) disclaim responsibility for any injury to people or property resulting from any ideas, methods, instructions or products referred to in the content.

