Article

Grid Interconnection Modeling of Inverter Based Resources (IBR) Plant for Transient Analysis

Department of Electrical and Computer Engineering, The University of Alabama, Tuscaloosa, AL 35401, USA
*
Authors to whom correspondence should be addressed.
Energies 2023, 16(7), 3211; https://doi.org/10.3390/en16073211
Submission received: 13 March 2023 / Revised: 28 March 2023 / Accepted: 31 March 2023 / Published: 2 April 2023

Abstract

:
The increase in penetration levels of inverter-based resources (IBRs) is changing the dynamic performance of power grids of different parts of the world. IBRs are now being more and more integrated into the grid at a single connection point as an IBR plant. Due to the complex nature and dynamicity of each inverter model, it is not realistic to build and analyze full complex models of each inverter in the IBR plant. Moreover, simulating a large plant including detailed models of all the IBRs would require high computing resources as well as a long simulation time. This has been the main issue addressed in the new IEEE Std 2800-2022. This paper proposes a novel approach to model an IBR plant, which can capture the transient nature at the plant level, detailed IBR control at the inverter level, interactions of multiple IBR groups in a plant structure, and a collector system connecting the IBRs to the grid. The IBRs in the plant use a voltage source inverter topology combined with a grid-connected filter. The control structure of the IBR includes a cascaded loop control where an inner current control and outer power control are designed in the dq-reference frame, and a closed-loop phase-locked loop is used for the grid synchronization. The mathematical study is conducted first to develop aggregated plant models considering different operating scenarios of active IBRs in an IBR plant. Then, an electromagnetic transient simulation (EMT) model of the plant is developed to investigate the plant’s dynamic performance under different operating scenarios. The performance of the aggregated plant model is compared with that of a detailed plant model to prove the effectiveness of the proposed strategy. The results show that the aggregated EMT simulation model provides almost the same result as the detailed model from the plant perspective while the running time/computation burden is much lower.

1. Introduction

Renewable energy resources (RESs), such as wind turbines and solar photovoltaic (PV) modules, are typically connected to the grid using inverters, and are therefore named inverter-based resources (IBRs) [1]. With the fast growth of renewable energy, solar and wind in plant structures are emerging rapidly worldwide, which presents an urgent need for an accurate IBR plant model that can be used to investigate the integration of IBR plants with the grid and which drives a new IEEE Std 2800-2022 published on 22 April 2022 [2]. An IBR plant consists of a huge number of IBR units connected together via a collector system at a single location [3], and, after that, the aggregated power is transported through a transmission line and sent to the grid. An IBR operation is different and complicated compared to that of a synchronous generator as it has more complicated dynamics. When hundreds of IBRs are tied together and operate as a plant, the transient complexity increases enormously, and its impact on the grid can vary based on different IBR configurations in the plant [4].
In order to analyze the impact of an IBR plant on the bulk power system (BPS), it is important to develop a transient simulation model that is computationally affordable and can accurately portray the control of the IBRs at the inverter level, as well as the interconnection dynamics of the plant with the grid. Most developments of the IBR plant model available in the literature are related to wind power plants (WPP) [5,6,7]. In [8], an equivalent impedance model of a WPP collector system is proposed for power system planning studies, where the wind turbines are set up in series and parallel arrangements. However, detailed transient modeling of IBRs within the plant is absent in [8], and no EMT simulation is performed. Another WPP equivalent model is proposed in [9], which reduces the plant model containing a fixed number of 168 wind turbines into an equivalent model with one or two machines connected to the grid via one or two lines representing the equivalent collector system. In [10], the impact of transient output characteristics of a WPP equivalent model is analyzed and compared with an actual WPP, in which it is found that the model does not provide an accurate response when the output power is larger than the grid short circuit capacity. A PV plant equivalent model is proposed in [11], which uses a model with an aggregated PV array, dc/dc converter, dc/ac inverter, grid-connected filter, and converter controllers. A closed-loop parameter identification approach is proposed in [11] to tune the parameters of the aggregated PV plant and controller models to minimize the error between the measured and model output powers of the plant. Another equivalent model of a PV power plant is presented in [12], which represents 100 PV inverters. The focus of the model is only to mimic the dynamics of the active and reactive power of the actual plant at the POI (point of interconnection). In [13,14], model reduction approaches of multiple IBRs are proposed, with the primary focus on developing an aggregate droop control equivalence for a group of droop-controlled inverters. In [15], a coherency equivalence method is proposed to develop an aggregate model for a group of modular multilevel converters (MCCs) used in large-scale renewable energy systems, with focus mainly on developing an aggregate equivalent model for the power circuit portions of the MMCs. Purba et.al., proposed a reduced-order IBR plant model in [16,17], in which the collector system impact is not considered and IBRs are assumed to be connected in parallel and then tied to the grid. A scaling factor is used in [16] to determine the aggregated plant model parameters, including aggregated grid-connected filter and controller parameters of the plant. In all aggregate plant models developed above, the characteristics at the individual IBR level, including its controller, are unable to simulate and evaluate and the EMT impacts for grid integration of the IBR plant. They are unable to be correctly captured because the differences and variations of collector systems and transmission lines are not properly and fully addressed. A comparison of properties of the existing models and the proposed model is provided in Table 1.
This article develops an aggregated IBR plant model that can simulate the dynamic performance at the IBR level as well as the grid interconnection level of the plant, and is fundamentally different from the aggregated plant models developed previously by others. The significant and original contributions of this article comprise: (1) a detailed mathematical proving process to prove the theoretical foundation of the proposed aggregated IBR plant model development under different IBR plant configurations, (2) a novel aggregated IBR plant model that can simulate transient performance at the IBR level, evaluate the detailed and complete design of the IBR controller and grid-connected filter, and investigate the interactions of IBR groups in a plant structure, (3) a strategy that carefully addresses the collector system impact in diverse parallel and series connection scenarios, (4) an aggregate model that can be used to evaluate the transient performance for the grid interconnection of the plant based on the designed IBR system and controller parameters of individual IBRs, instead of scaled and modified parameters used in the aggregate model, and (5) a process to evaluate the effectiveness of the proposed aggregate IBR plant model through a comparison study with the detailed IBR plant model in a recursive way. Details of the article are presented in the following sections.

2. Inverter-Based Resources Plant Grid Interconnection and Control

2.1. IBR Plant

The IBR family typically includes solar PV generators, wind turbine (WT) generators such as doubly fed induction generators (Type-3), permanent magnet synchronous generators (Type-4), and energy storage systems [26]. Except for the Type-3 WT (not the focus of this paper), IBRs are connected to the BPS through a full-size dc/ac converter system (Figure 1a), which includes four main components: (i) a converter at the source-side, (ii) a capacitor at the dc-link, (iii) a converter at the grid-side, and (iv) a grid connected filter [27,28,29]. The converter at the source-side controls the energy supply of solar or wind, or performs energy management of the energy storage system, and is an ac/dc type for a Type-4 WT and a dc/dc type for a solar PV and energy storage system. The grid-side converter regulates reactive power flow at the point of common coupling (PCC) and maintains a fixed dc-link voltage and is always a dc/ac type.
An IBR plant usually consists of a collection of closely located IBRs that are electrically linked together to generate electricity. With the declining cost of solar panels and wind turbines, the number of IBR plants are increasing quickly. Utility-scale wind power plants (WPPs) and solar power plants (SPPs) have been built with hundred or thousand MW scale worldwide. Figure 1b shows a generalized connection diagram of a grid connected onshore WPP, where k represents the parallel feeder index, and i represents the index of a series path in each parallel feeder. Typically, the output end voltage of each WT generator is 690 V, and all the WTs within a WPP are connected to a medium-voltage (MV) substation (e.g., 34.5k V/120 kV) via a collector system. The connection point is popularly known as the POM (point of measurement). The POM is then connected to the bulk power system (BPS) via a transmission line, which can be up to several hundred miles long. This connection point is called the POI (point of interconnection).
Similarly, a utility-scale SPP is built with hundreds to thousands of PV panel strings. A string-inverter connects each string with the collector system. The collector system is connected to the POM via a step-up transformer. Finally, a transmission line connects the SPP with the POI via an interconnection transformer.

2.2. Control of an IBR Plant

An IBR operating in an IBR plant can be assumed to have a constant dc-link voltage with a controller for the grid-side inverter, which consists of a back-to-back inner current control loop and an outer power (active/reactive) or bus voltage control loop. The control loops are usually designed in the d-q reference frame. The power control reference signals (P*PCC and Q*PCC) are generated in accordance with the grid requirements (either at the POM or POI) and sent to the outer control loop. The outer control loop produces d- and q-axis current reference signals and sends them to the inner control loop. The inner control loop produces d-q controlled output voltages, denoted as v*d_inv and v*q_inv. The controlled voltages are injected to the power grid. The relation between the inverter end voltage (vdq_inv) and the controller output voltage (v*dq_inv) can be written as follows [30]:
v d q _ i n v = k P W M v d q _ i n v *
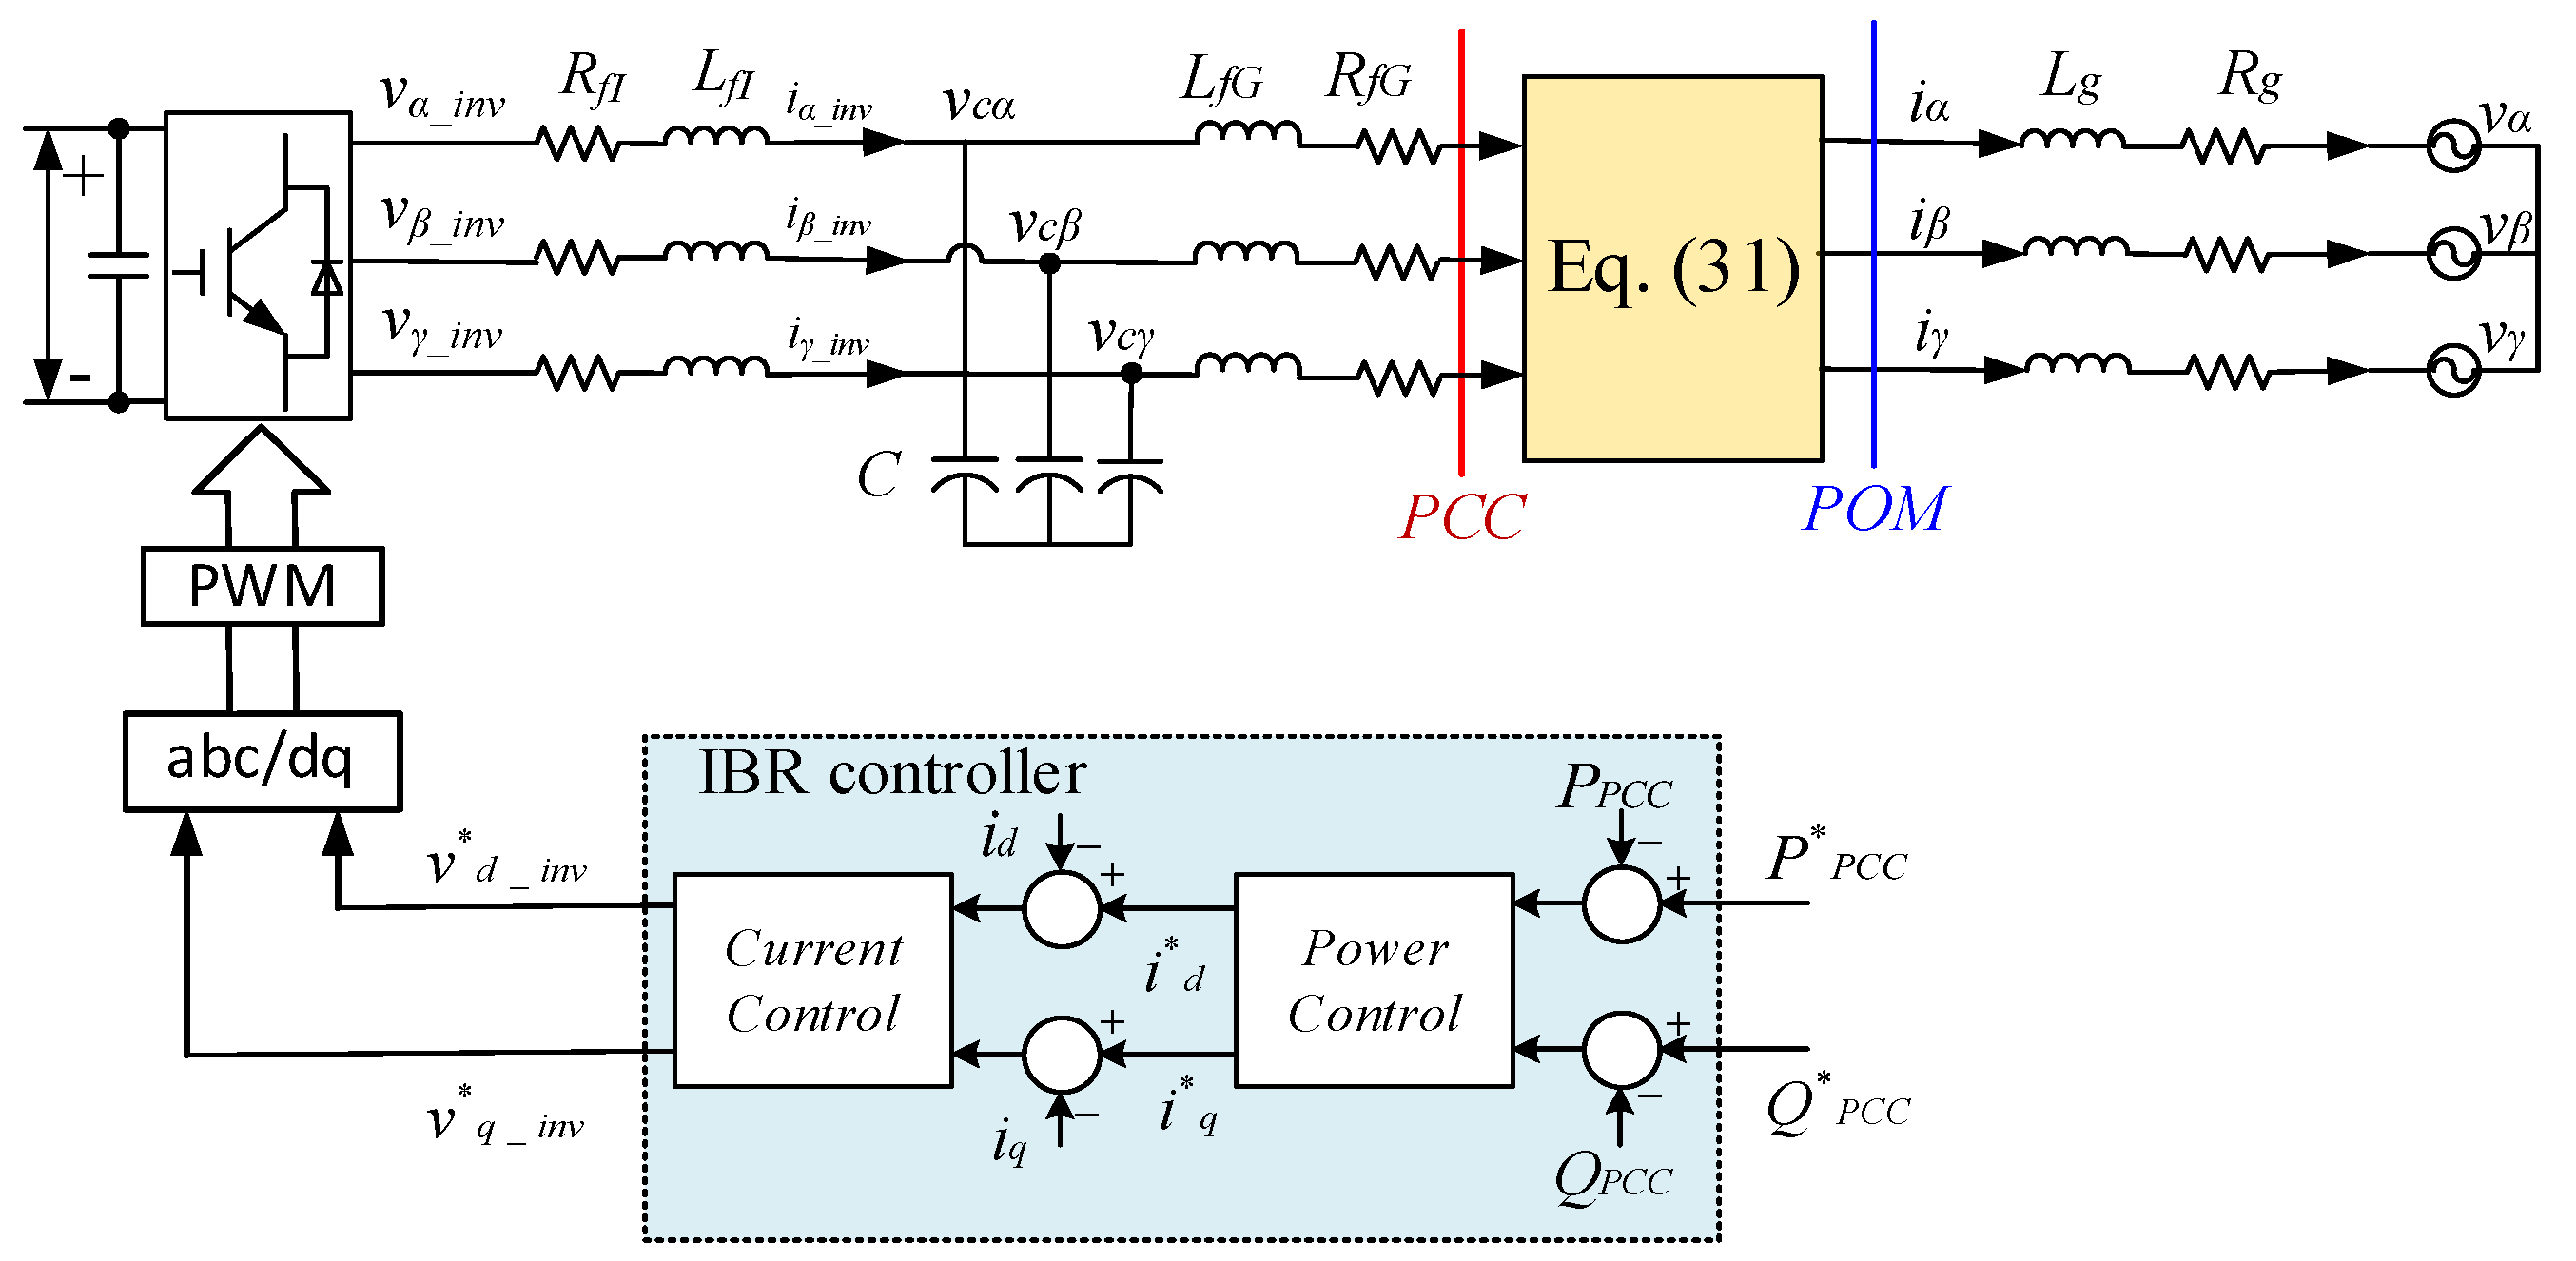
where kPWM is the multiplication constant between inverter end voltage and the controller output voltage caused by the PWM (pulse width modulation) process [30]. Figure 2 illustrates the overall plant control structure, as well as its interaction with individual IBR level controller.

3. Approximate EMT Circuit Models of IBR Plant Connected to the Grid

An IBR is usually interfaced to the collector system through a passive filter. The filter could be L, LC, or LCL type. Figure 3 shows the circuit diagram of an IBR connected to the grid via an LCL-filter. In the figure, RfI and LfI represent the inverter-side filter resistance and inductance, RfG and LfG denote the grid-side filter resistance and inductance, C stands for the filter capacitance, and Rg and Lg represent the equivalent grid resistance and inductance from the PCC. In Figure 3, vα,β,γ_inv, vα,β,γ_PCC, iα,β,γ_inv, iα,β,γ, vc_α,β,γ, and vα,β,γ represent the inverter terminal voltage, PCC voltage, current through the RfI and LfI, current injected to the grid, LCL filter capacitor voltage, and grid voltage, respectively.
The equation of voltage balance across the inductor of the inverter-side can be written as,
v α , β , γ _ i n v = R f I i α , β , γ _ i n v + L f I d d t i α , β , γ _ i n v + v C _ α , β , γ
The current equation of the LCL capacitor is,
i α , β , γ _ i n v = i α , β , γ + C d d t v C _ α , β , γ
The equation of voltage balance across the inductor of the grid-side can be written as,
v C _ α , β , γ = R f G i α , β , γ + L f G d d t i α , β , γ + v α , β , γ _ P C C
The equation of voltage balance across the impedance of the grid can be written as
v α , β , γ _ P C C = R g i α , β , γ + L g d d t i α , β , γ + v α , β , γ
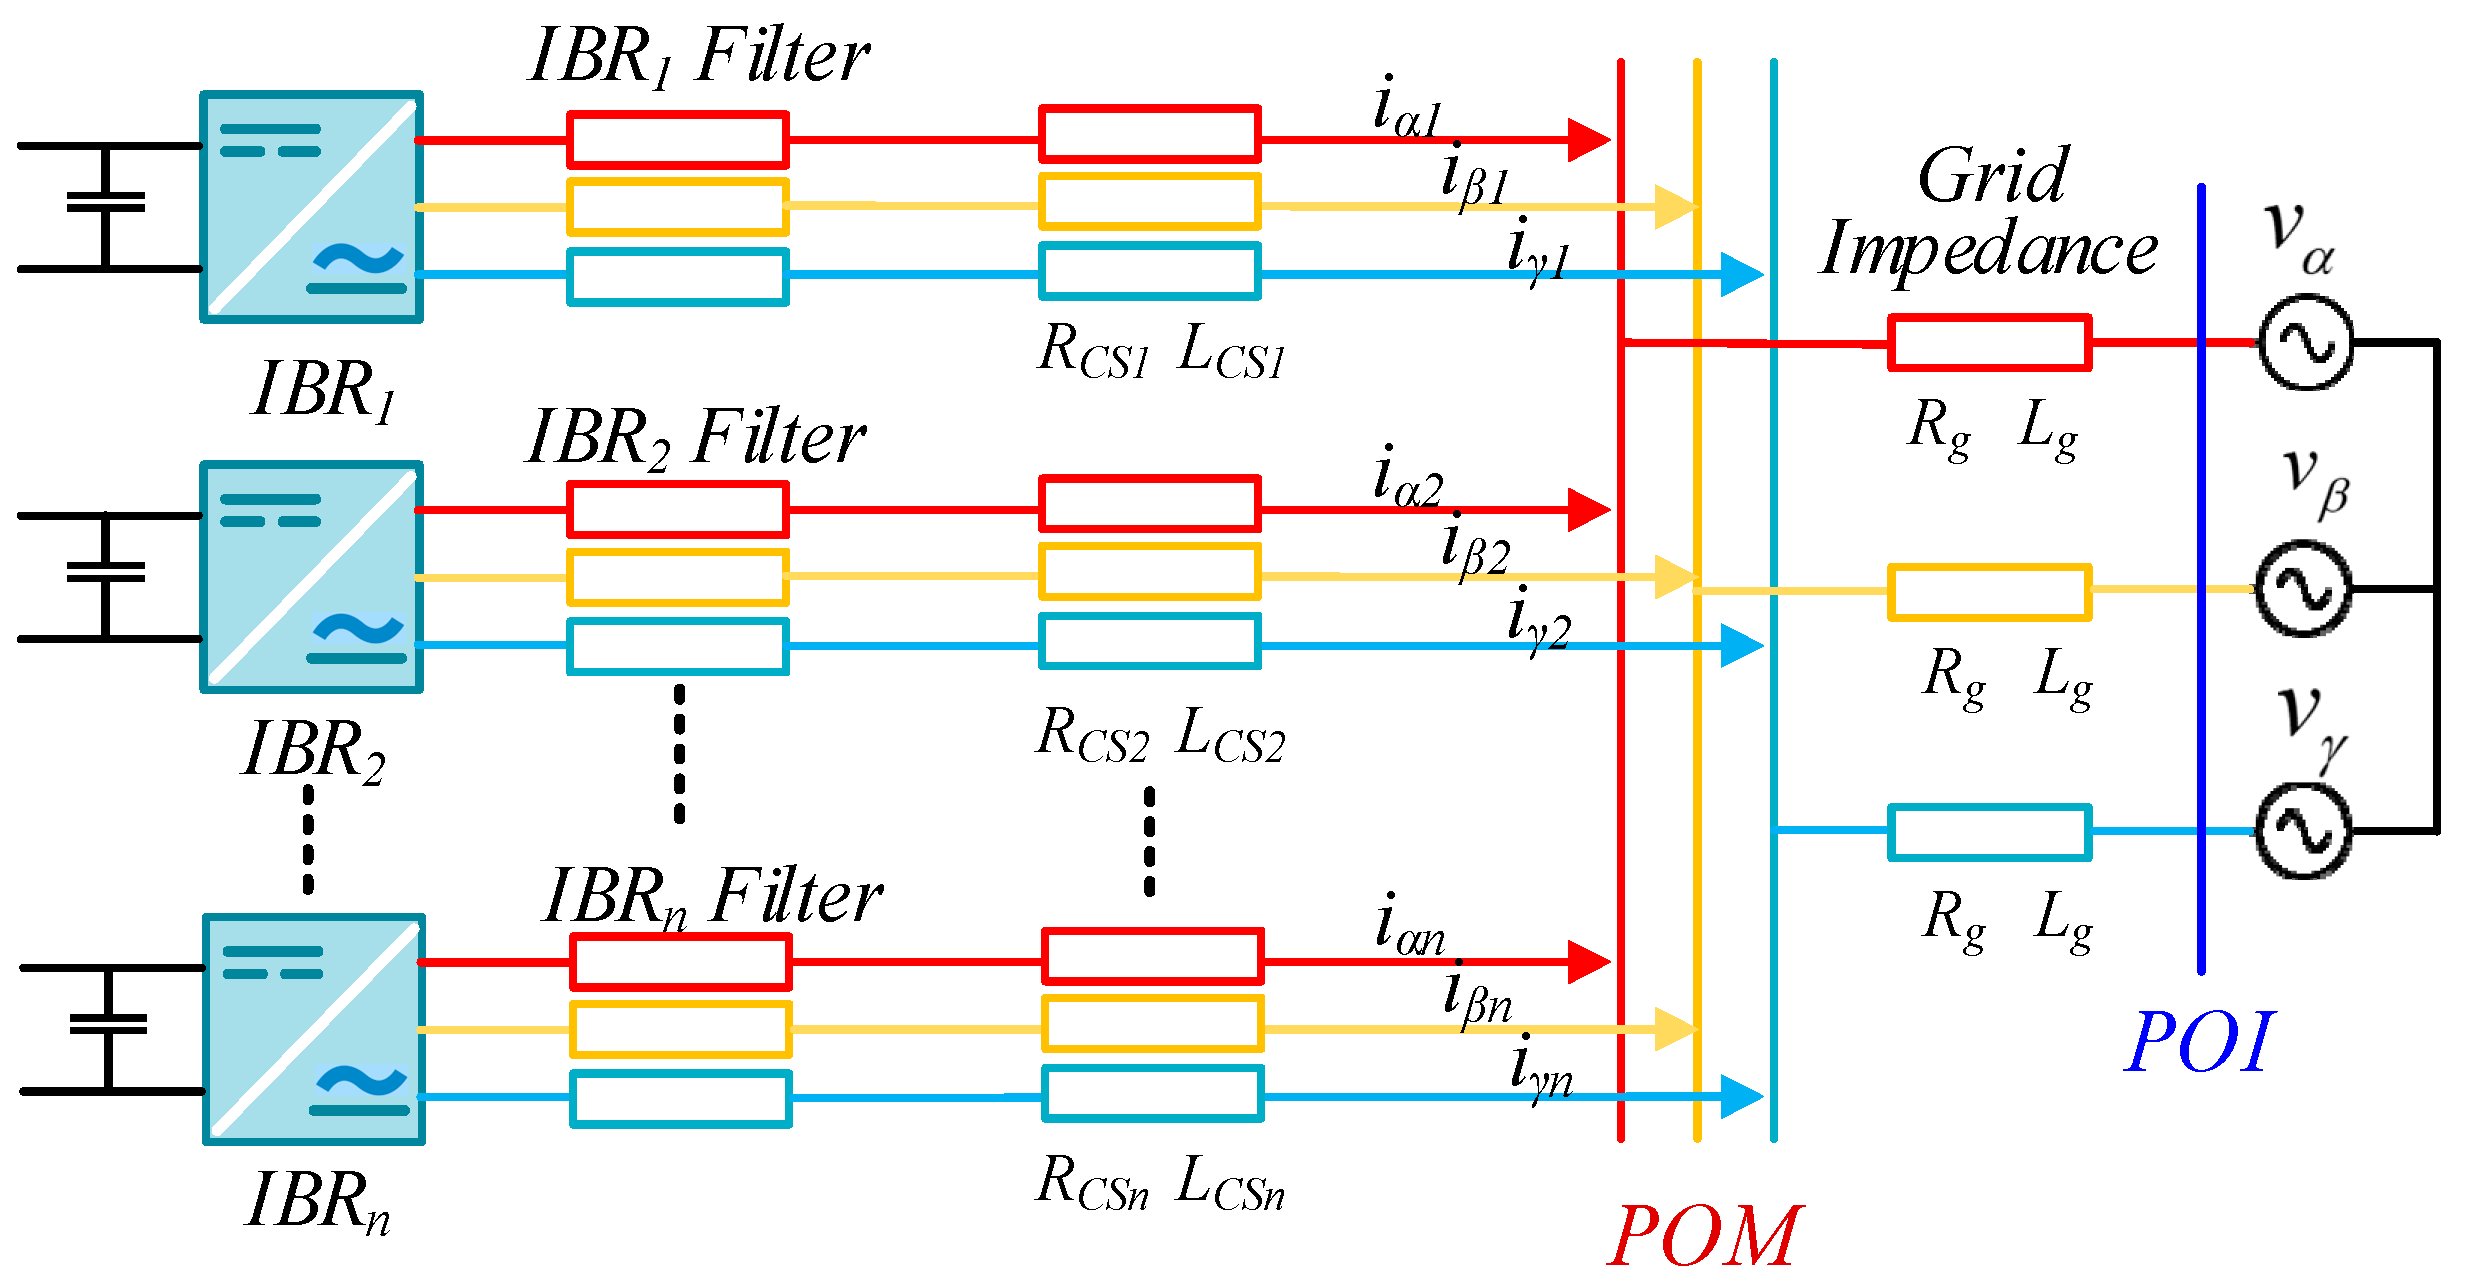
Figure 4 shows the equivalent circuit of an IBR plant. In the figure, IBRs are coupled to the power grid through a collector system. RCSi, and LCSi correspond to the collector system resistance and inductance. To analyze the plant structure and keep the collector system into consideration, four cases are developed in this paper, which are described as follows:
  • The collector system impedance is neglected and all IBRs in the IBR plant have the same filter parameter.
    • All IBRs in the IBR plant have the same output terminal voltage.
    • All IBRs in the IBR plant have different output terminal voltages.
  • The collector system impedance is considered, and all IBRs in the IBR plant have distinct filter characteristics.
    • Each IBR in the IBR plant is coupled to the POM in parallel through different collector impedances; therefore, they output different terminal voltage.
    • Each IBR in the IBR plant is connected in a series and parallel combination to the POM through a collector system (depicted in Figure 1b), and they output different terminal voltage.

3.1. A Grid-Connected IBR Plant Including IBRs, IBR Filters, Collector Impedances, and Grid Impedance

To identify IBRs in the IBR plant, superscript k is used, where k = 1, 2,..., n. n defines the total number of online IBRs in the IBR plant.
Theorem 1. 
If all IBRs online in the IBR plant have identical filter characteristics and terminal voltage, then each IBR is assumed to be linked to the BPS via a changeable grid impedance, which is equal to the grid impedance (when one IBR is connected) multiplied by the total number of online IBRs (n) in the IBR plant.
Proof. 
In this case, the collector system impedance is ignored, therefore, the PCC voltage of each IBR would be the POM voltage (according to Figure 4). As each IBR outputs the same voltage and has identical filter parameters, each IBR will have a similar voltage and current, as shown in Equations (2)–(4), and will deliver the same current to the grid. Then, under this case, we have
i α , β , γ 1 = i α , β , γ 2 = = i α , β , γ n = i α , β , γ
As a result, the equation of voltage balance across the impedance of the grid is
v α , β , γ _ P C C = R g k = 1 N i α , β , γ k + L g d d t k = 1 N i α , β , γ k + v α , β , γ
v α , β , γ _ P C C = N R g i α , β , γ + N L g d d t i α , β , γ + v α , β , γ
The equivalent circuit of an IBR plant, looking from an IBR point of view, is developed from Equation (7) and shown in Figure 5. In the figure, the IBR is coupled to the BPS through a virtually changeable transmission line impedance. The impedance of the transmission line can be calculated by multiplying the grid impedance by the number of online IBRs in the IBR plant. □
Lemma 1. 
If all IBRs in an IBR plant have identical filter characteristics and terminal voltage, then, from the grid point of view, the IBR plant will be assumed to be interfaced to the BPS through a virtually changeable filter impedance, which can be calculated by dividing the individual IBR filter impedance by the total number of online IBRs in the IBR plant.
Proof 
. Define the current flowing through the transmission line of the grid as iα,β,γ_g. Then, (7) can be rewritten as,
v α , β , γ _ P C C = R g i α , β , γ _ g + L g d d t i α , β , γ _ g + v α , β , γ
Similarly (2)–(4), (6)can be rewritten by using iα,β,γ_g as
v α , β , γ _ i n v = R f I N N i α , β , γ _ i n v + L f I N d d t N i α , β , γ _ i n v + v C _ α , β , γ
N i α , β , γ _ i n v = i α , β , γ _ g + N C d d t v C _ α , β , γ
v C _ α , β , γ = R f G N i α , β , γ _ g + L f G N d d t i α , β , γ _ g + v α , β , γ _ P C C
An IBR plant (consists of n IBRs) equivalent circuit, looking from the grid point of view, is developed from 8 to 11 and shown in Figure 6. The figure shows that the IBR plant is tied to the BPS through a virtually changeable filter impedance. The filter impedance is determined by the parallel combination of filter impedances of all IBRs online in the IBR plant. The equivalent circuit outputs the same voltage as that of individual IBR and injects the sum of currents of IBRs online in the plant. □

3.2. Case 2: IBRs with Identical Filter Parameters but Different Terminal Voltages

Assume all IBRs have different output terminal voltages. As the collector system impedance is neglected, PCC voltages of all IBRs are the same and equivalent to the POM voltage.
Theorem 2 
. If all IBRs online in an IBR plant have identical filter parameters but output distinct terminal voltages, then, looking from the grid side, the IBR plant is assumed to be coupled to the BPS by a virtual changeable filter impedance, which can be calculated by dividing the individual IBR filter impedance by the total number of online IBRs in the IBR plant. The IBR plant outputs the average terminal voltage of all IBRs online in that plant.
Proof. 
As all IBRs have identical filter parameters but output distinct terminal voltages, Equations (2)–(5) can be rewritten as follows:
v α , β , γ i n v k = R f I i α , β , γ i n v k + L f I d d t i α , β , γ i n v k + v C α , β , γ k
i α , β , γ i n v k = i α , β , γ k + C d d t v C α , β , γ k
v C α , β , γ k = R f G i α , β , γ k + L f G d d t i α , β , γ k + v α , β , γ P C C
v α , β , γ P C C = R g k = 1 n i α , β , γ k + L g d d t k = 1 n i α , β , γ k + v α , β , γ
For all IBRs, we obtain,
k = 1 N v α , β , γ i n v k = R f I k = 1 N i α , β , γ i n v k + L f I d d t k = 1 N i α , β , γ i n v k + k = 1 N v C α , β , γ k
k = 1 N i α , β , γ i n v k = k = 1 N i α , β , γ k + C d d t k = 1 N v C α , β , γ k
k = 1 N v C α , β , γ k = R f G k = 1 N i α , β , γ k + L f G d d t k = 1 N i α , β , γ k + N v α , β , γ P C C
Rewrite (15)–(18) as
k = 1 N v α , β , γ i n v k / N = R f I N k = 1 N i α , β , γ i n v k + L f I N d d t k = 1 N i α , β , γ i n v k + k = 1 N v C α , β , γ k / N
k = 1 N i α , β , γ i n v k = k = 1 N i α , β , γ k + N C d d t k = 1 N v C α , β , γ k / N
1 N k = 1 N v C α , β , γ k = R f G N i α , β , γ _ g + L f G N d d t i α , β , γ _ g + v α , β , γ P C C
v α , β , γ P C C = R g i α , β , γ _ g + L g d d t i α , β , γ _ g + v α , β , γ
Therefore, an IBR plant equivalent circuit (consist of n IBRs) can be drawn by Equations (19)–(22) and shown in Figure 6. In the figure, an IBR plant is coupled to the grid via a virtually changeable filter impedance, which is equivalent to the parallel combination of filter impedances of all IBRs online in the IBR plant. The equivalent circuit outputs the average terminal voltages and injects the sum of currents of all IBRs online in the IBR plant. □
Lemma 2. 
If all IBRs online in an IBR plant have identical filter characteristics but distinct terminal voltages, then, from the individual IBR point of view, the IBR plant can be assumed to be coupled to the BPS through a virtually changeable grid impedance, which is equivalent to the product of grid impedance and the number of IBRs online in the IBR plant. The IBR plant provides the average terminal voltage of all IBRs in that plant.
Proof. 
By rewriting (15)–(18) as:
k = 1 N v α , β , γ i n v k / N = R f I k = 1 N i α , β , γ i n v k / N + L f I d d t k = 1 N i α , β , γ i n v k / N + k = 1 N v C α , β , γ k / N
k = 1 N i α , β , γ i n v k / N = k = 1 n i α , β , γ k / N + C d d t k = 1 N v C α , β , γ k / N
k = 1 N v C α , β , γ k N = R f G k = 1 n i α , β , γ k N + L f G d d t k = 1 n i α , β , γ k N + v α , β , γ P C C
v α , β , γ P C C = N R g k = 1 n i α , β , γ k N + N L g d d t k = 1 n i α , β , γ k N + v α , β , γ
An IBR plant equivalent circuit can be drawn from Equations (23)–(26) and looks the same as in Figure 5. In the figure, an IBR plant can be assumed to be coupled to the BPS through a changeable transmission line impedance, which is equivalent to the product of grid impedance and the number of online IBRs in the IBR plant. The equivalent circuit outputs the average terminal voltages and injects the sum of currents of all IBRs online in the IBR plant. □

3.3. Case 3: IBRs with Different Filter Parameters and Different Terminal Voltages—Each IBR Is Coupled in Parallel to the POM through a Different Collector Impedance

To develop an EMT model for an IBR plant, either the time domain (used in Cases 1 and 2) or the Laplace transform technique could be considered. Both methods provide very complicative state-space system equations and IBR plant models, which are not easy to simulate or evaluate. Instead of developing a detailed EMT model, an approximate EMT model of an IBR plant is proposed in this section based on Lemma 2 (developed for Case 2) as follows:
(1)
An average IBR represents an IBR plant consist of n IBRs, which outputs the average terminal voltage of all IBRs in the IBR plant as follows:
v i n v _ a v g = k = 1 N v i n v k / N
(2)
The filter characteristics of the average IBR are given by averaging the values of filter parameters of all the IBRs in the IBR plant as follows:
R f I _ a v g = k = 1 N R f I k / N ,   L f I _ a v g = k = 1 N L f I k / N ,   C a v g = k = 1 N C k / N R f G _ a v g = k = 1 N R f G k / N ,   L f G _ a v g = k = 1 N L f G k / N
(3)
The collector system parameters( R C S _ a v g and L C S _ a v g ) of the average IBR are given by averaging the collector system parameters ( R C S k and L C S k ) connecting all the IBRs to the POM as follows
R C S _ a v g = k = 1 N R C S k / N ,   L C S _ a v g = k = 1 N L C S k / N
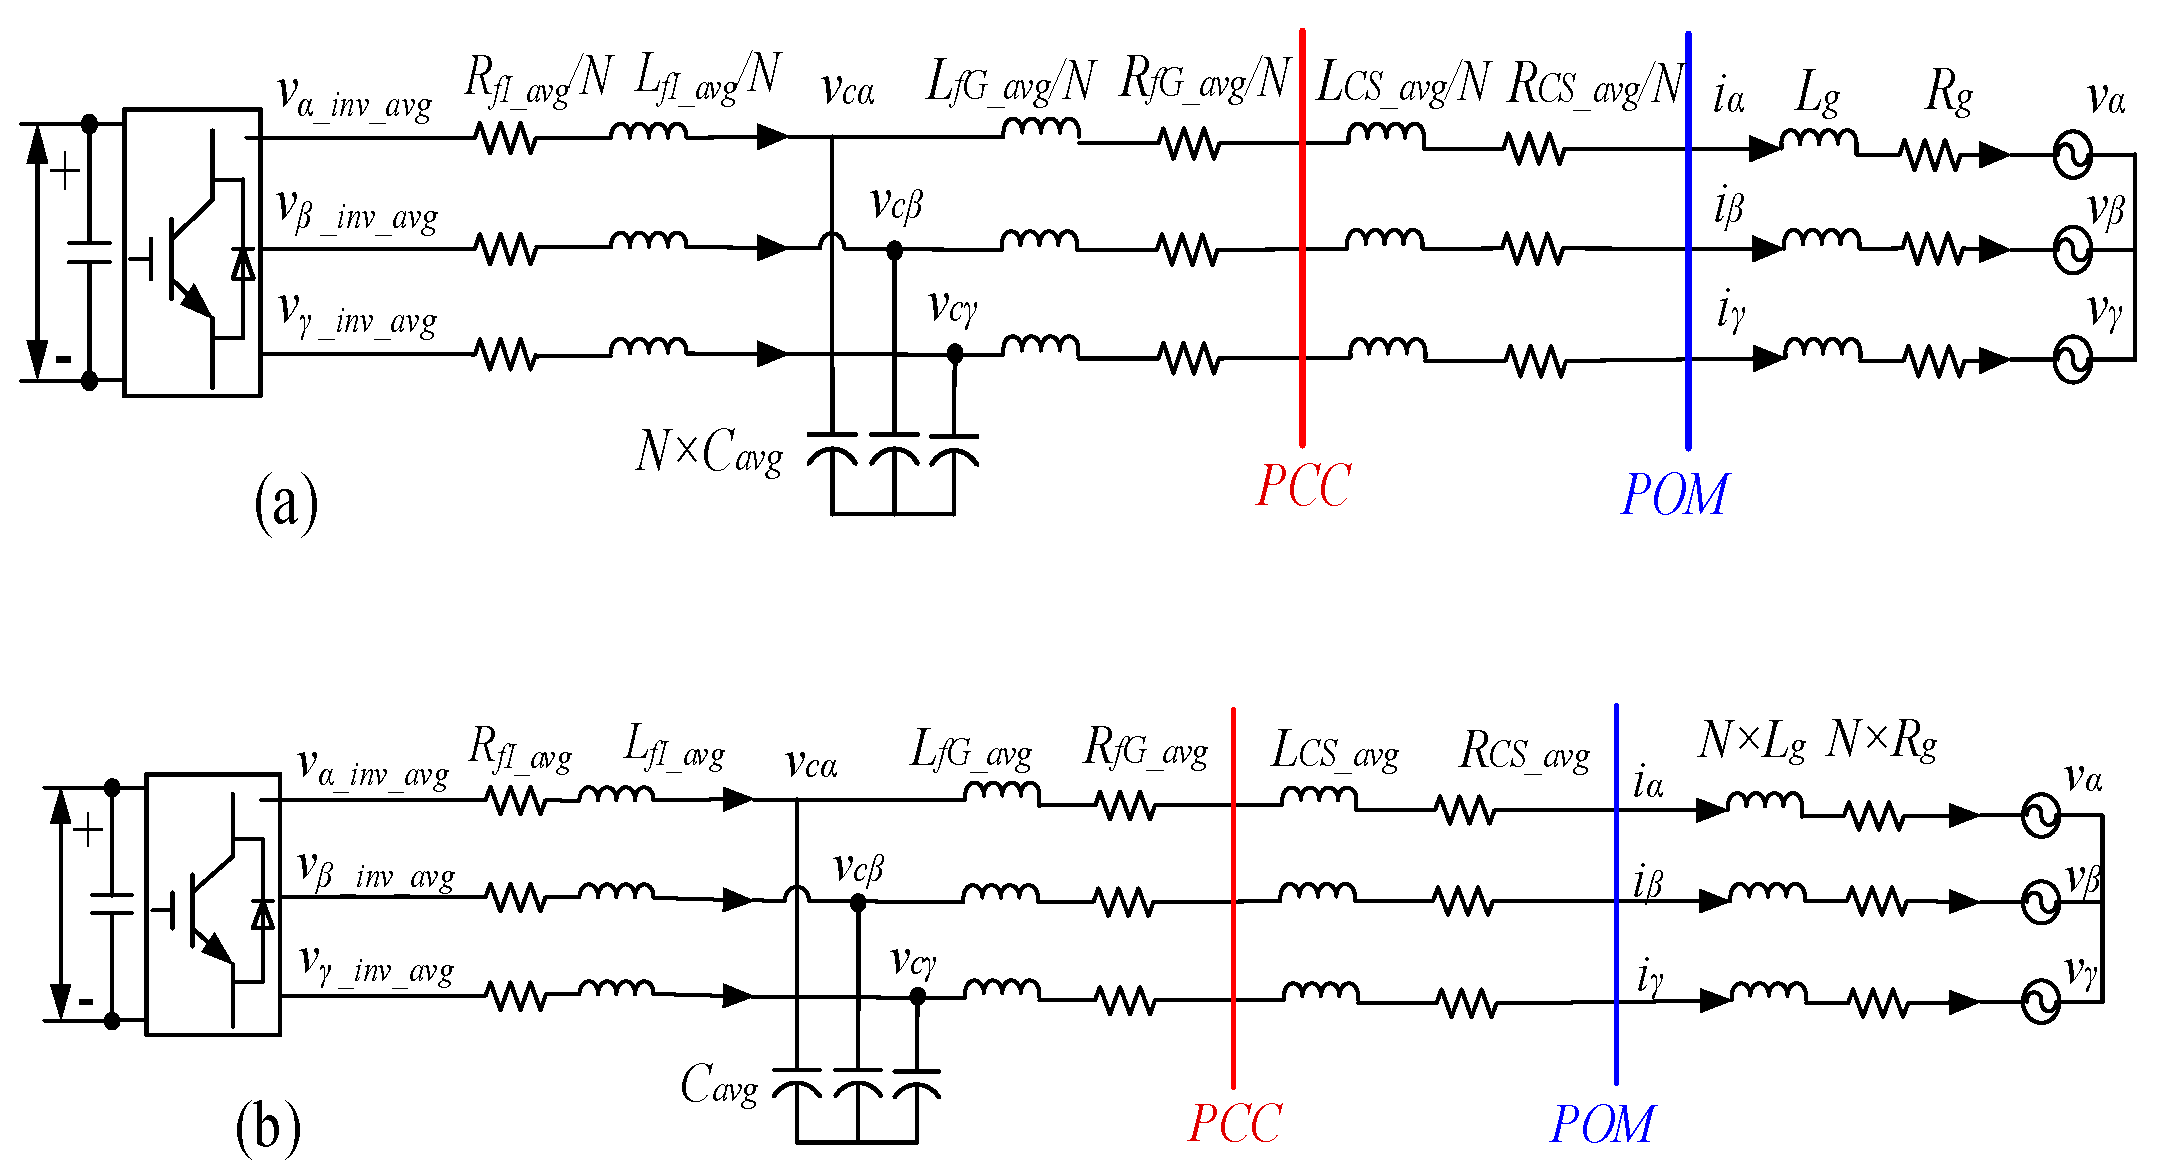
The approximate equivalent EMT circuits of an IBR plant are obtained from Equations (27)–(29) and Figure 6 and Figure 7, and they are shown in Figure 8a,b.

3.4. Case 4: IBRs with Different Filter Parameters and Different Terminal Voltages—Each IBR Is Coupled in a Combination of Series and Parallel to the POM through a Collector System (As Depicted in Figure 1b)

An approximate EMT IBR plant model is proposed in this section based on theorems and lemmas developed for Cases 1 to 3 as follows:
(1)
An average IBR represents all IBRs in an IBR plant. The average IBR outputs the average terminal voltages of all IBRs in the IBR plant as shown in (27).
(2)
The filter characteristics of the average IBR are given by averaging the values of filter parameters of all the IBRs in the IBR plant as shown in (28).
(3)
Similar to Figure 1b, assume an IBR plant has K parallel feeders, and each parallel feeder has Nk number of series paths. Equation (30a) provides the approximate and aggregated average impedance of collector system of each feeder. Therefore, the overall collector system (with K parallel feeders) parameters of an IBR plant are obtained from Equation (30b).
R k _ a v g = i = 1 N k i R k i ,   L k _ a v g = i = 1 N k 1 i L k i
R C S _ a v g = k = 1 K R k _ a v g / k = 1 K N k ,   L C S _ a v g = k = 1 K L k _ a v g / k = 1 K N k
where, Rki and Lki denote the resistance and inductance of the ith series path within the kth parallel feeder, and Rk_avg and Lk_avg stand for the approximate and aggregated average resistance and inductance of the kth parallel feeder.
(4)
By replacing the parameters developed in (27), (28), and (30) into Figure 7b, the equivalent and approximate EMT circuit model is obtained.

4. EMT Simulation Model of IBR Plant Grid Interconnection

According to the theoretical study presented in Section 3, the aggregated EMT simulation models of an IBR plant are developed in this section. The development of the aggregated EMT simulation models is presented as correspondence to Cases 1 to 4, from simple to complex/complete cases, as follows.

4.1. Approximated EMT Model of Case 1

The aggregated IBR plant model consists of a power circuit model and a controller model. The power circuit model is obtained from Figure 4, in which the POM voltage is applied directly to each individual IBR, while the current flowing into the grid at the POM is the individual IBR current multiplied by n, as shown in Figure 7. For this equivalent plant model, the original controller model of individual IBR can be applied directly without the need for an equivalent plant controller model as developed previously and reported in the literature [27,30,31]. The IBR controller includes an inner current loop controller and an outer power loop controller (Figure 2). For the conditions of Case 1, each IBR outputs the same voltage to the grid at the inverter terminal, which can also be translated to the power references to the controller, which are the same for all the IBRs. Thus, a complete aggregated IBR plant model, including the power circuit and controller, is obtained in Figure 8, where we have the voltage and current relations at the PCC of the IBR and the POM of the grid as follows
v P C C ( t ) = v P O M ( t ) , i P O M ( t ) = N i P C C ( t )

4.2. Approximated EMT Model of Case 2

The aggregated IBR plant model in this case also consists of a power circuit model and a controller model. In this case, each IBR within an IBR plant has identical filter characteristics. Thus, the power circuit model should be the same as that shown in Figure 8, except that the IBR is represented by an average IBR. According to Lemma 2, the average IBR in Case 2 is considered as being connected to the grid and as having the average of the output voltages and currents of all the IBRs connected online. This means that the power references of IBR controllers are different for all the IBRs. Therefore, the reference power to the average IBR at any time instant is the average of the power references of all the IBRs. In this way, a complete aggregated IBR plant can also be modeled using Figure 7, in which, the power reference of the average IBR at any time instant is the average of the power references of all the IBRs, i.e.,
P P C C * ( t ) = 1 N i = 1 N P P C C _ i * ( t ) , Q P C C * ( t ) = 1 N i = 1 N Q P C C _ i * ( t )
where, P P C C _ i * ( t ) and Q P C C _ i * ( t ) are the active and reactive power references of each individual IBR (i = 1, …, n).

4.3. Approximated EMT Model of Case 3

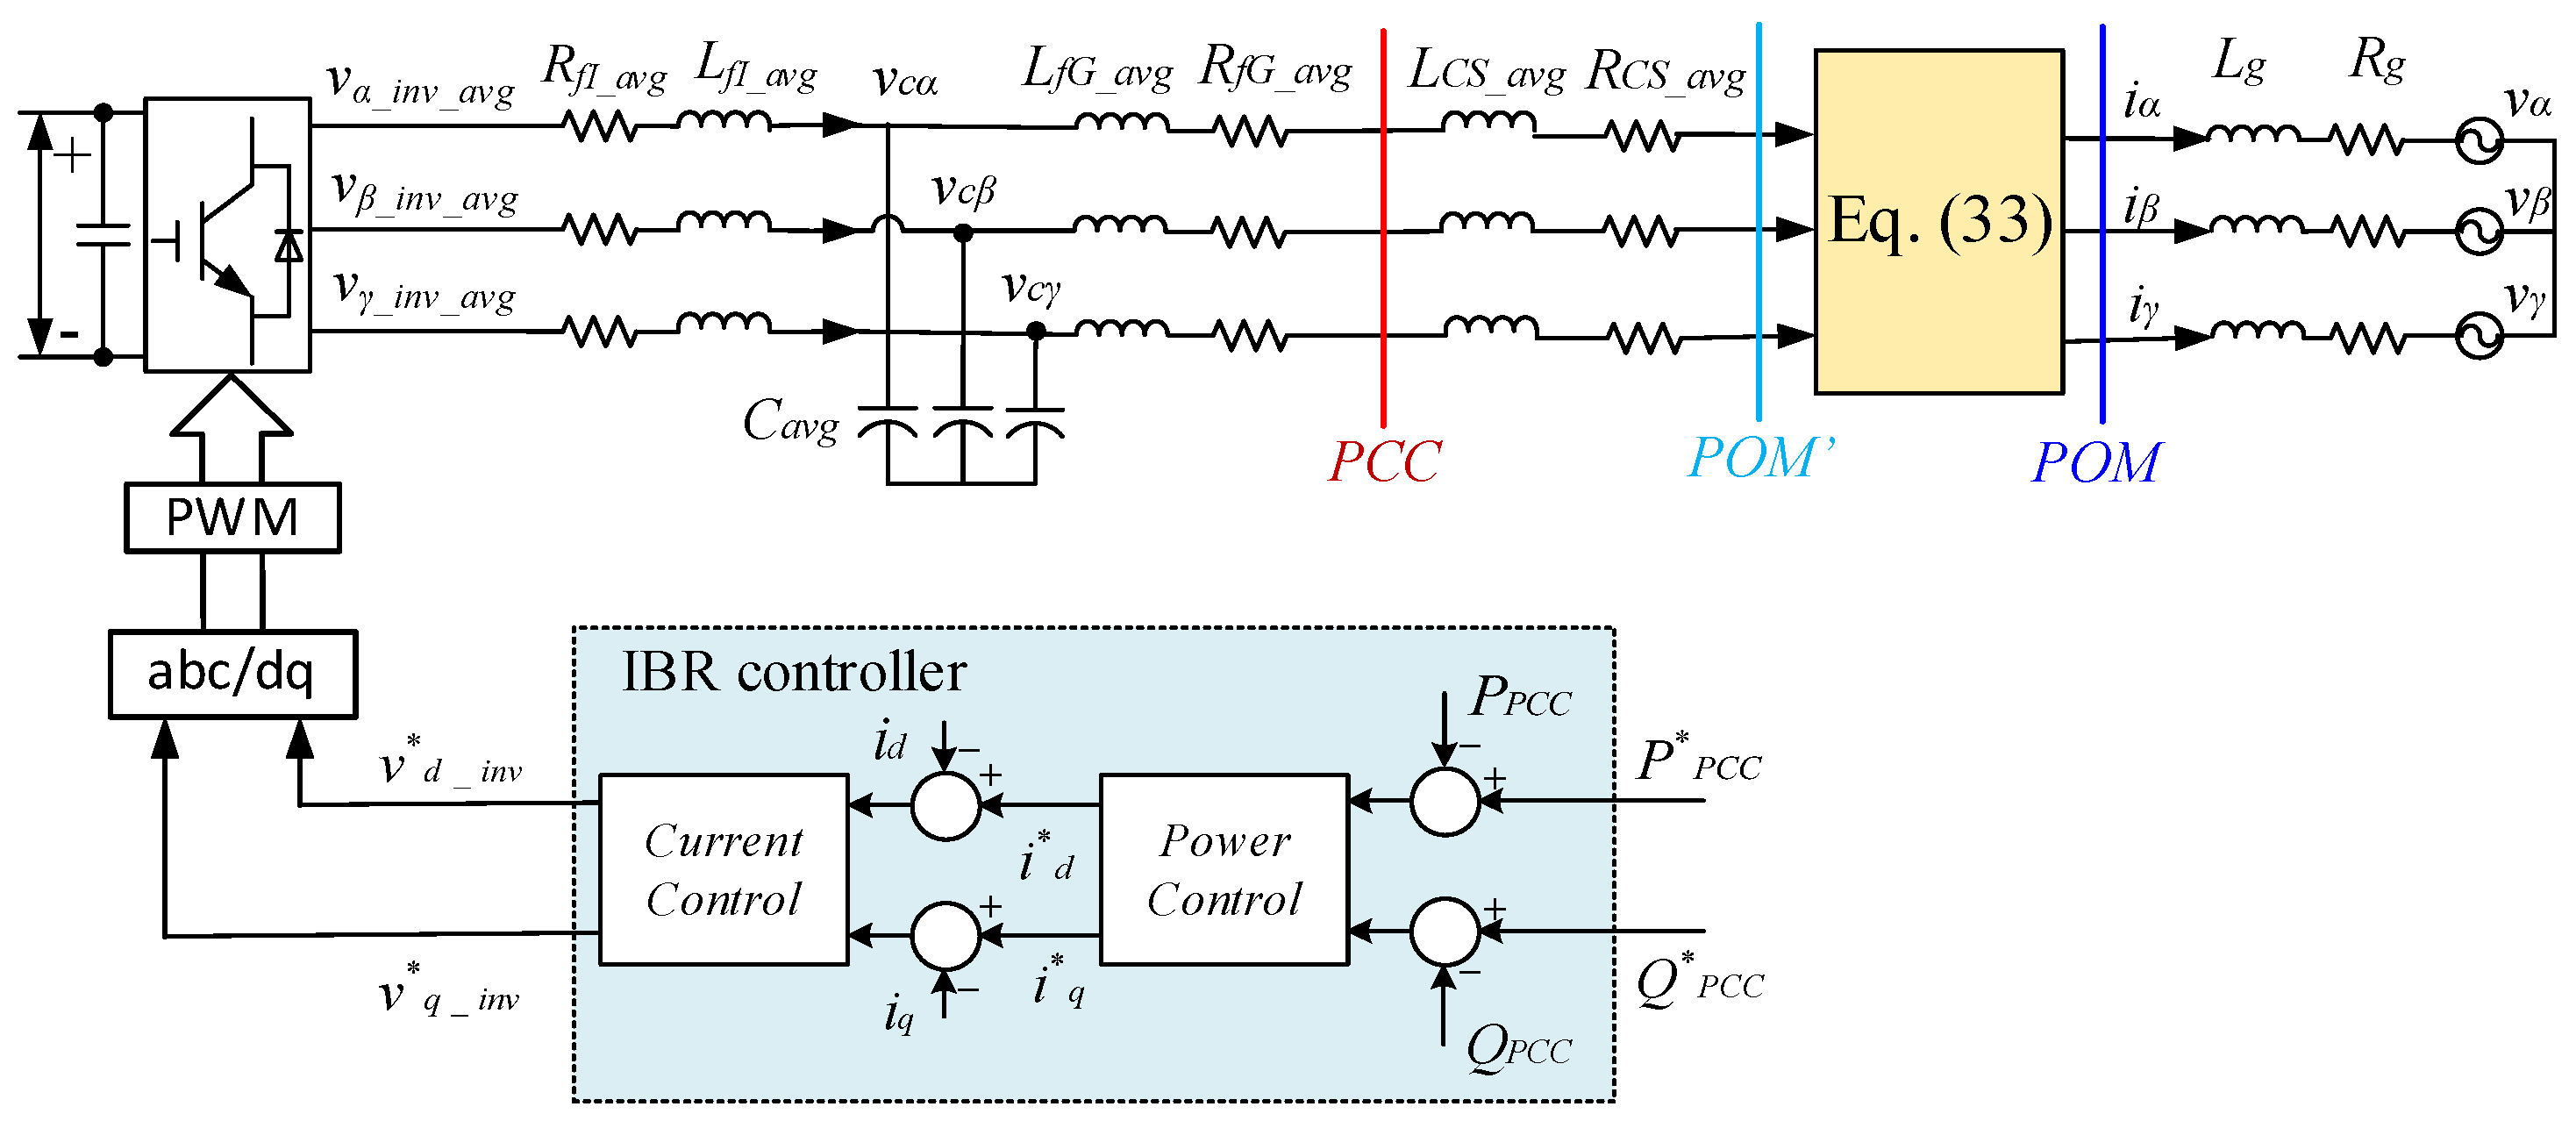
Case 3 is similar to Case 2. However, there are two major differences between the two cases. First, in Case 3, the parameters of the IBR grid-connected filters are different. Therefore, average values of all the grid-connected filters are used in the average IBR model. In addition, in Case 3, each IBR is connected to the POM through a different collector system impedance. In the aggregated model, this is represented as an average collector resistance R C S _ a v g and an average collector inductance L C S _ a v g that are calculated via (29). By considering these two factors, a complete aggregated IBR plant model is developed, as shown in Figure 9, in which the POM` represents the POM referred to the average IBR model side, and the current and voltage relation between the POM and POM’ is illustrated by
v P O M ' ( t ) = v P O M ( t ) , i P O M ( t ) = N i P O M ' ( t )
In the aggregated IBR plant model, the power reference of the average IBR at any time instant is the average of the power references of all the IBRs, as shown in (32).

4.4. Approximated EMT Model of Case 4

The aggregated IBR plant model of Case 4 is the same as the aggregated IBR plant model of Case 3, except that the average collector system resistance and inductance are calculated by using (30) instead of (29). Thus, Figure 9 can be used to represent the aggregated IBR plant model of Case 4, in which the average collector system resistance and inductance are calculated by using (30). The aggregated model of Case 4 can also be applied to Cases 1 to 3 by considering each as a special case of Case 4.

4.5. Detailed IBR Plant Model in a Recursive Way

A detailed IBR plant EMT model is important for the validation of the aggregated IBR plant model. However, a detailed model with hundreds of IBR units within an IBR plant is almost impossible to build and simulate. To overcome the challenge, a recursive way to build the detailed IBR plant model is developed. The recursive way first started with a detailed IBR plant model containing a certain number of IBR units (for example 10 units), that was then compared with an aggregated IBR plant model with the same filter and collector system configuration of the 10 IBR units. After the validation, the number of IBRs in the IBR plant was increased to 100 units that were divided into 10 groups, including a collector system connecting the 10 groups, with each group modeled by an aggregated IBR model containing 10 IBR units. In this way, a larger IBR plant system with thousands of IBRs can be achieved if needed. This proposed strategy can also be used to evaluate different transient interactions of IBR groups in a plant structure.

5. Approximated IBR Plant Grid Interconnection Model Simulation and Its Validation with Detailed Recursive Model

To evaluate the equivalent and aggregated IBR plant models developed in Section 4, an EMT simulation model of an IBR plant is built in MATLAB (Figure 10a). The aggregated IBR plant model consists of an average IBR model. The average IBR is coupled to a step-up transformer (690 V/25 kV) through an LCL filter. The LCL filter can be conveniently changed to either an L or LC filter. After the step-up transformer, the average IBR model is coupled to the POM through an equivalent aggregated collector system (Section 4), a 25 kV/120 kV step-up transformer, and then to the POI via a transmission line. At the POI, the grid voltage is 120 kV. The IBR unit is then connected to a renewable energy source (RES), such as a photovoltaic array or a wind turbine, on the left side, and a grid-connected inverter on the right side. According to an active power reference (P*), the RES controller controls the active power extracted from the RES and delivers it to the BPS. The grid-connected inverter controller maintains the IBR interconnection to the grid. The configuration parameter of the aggregated IBR plant model is given in Table 2.
Figure 10b shows the inverter controller configuration of the average IBR model, which has a current controller in the inner loop and a dc-link voltage controller and reactive power or PCC voltage controller in the outer loop. The controllers are designed according to the well-known standard vector control strategy [27,28]. The PI controller gains are determined based on the transfer functions and tuned by following the standard bode plot method [32]. In addition, a current limiting block is added in the inner current control loop to prevent overcurrent [29,33]. Similarly, a voltage limiting block is connected to limit the voltage produced by the inner-loop current controller according to [34]. This will ensure the IBR operation within the linear modulation boundary. A saturation block is added to the output of all PI controllers to limit the integral control part without crossing the maximum IBR rated current, IBR output voltage, and reactive power limits. Thus, Figure 10 shows the state-of-the-art IBR control technology used in the industry. The aggregated model is used to simulate the IBR plant transient performance for Cases 1 to 4, and it is validated via the comparison with the detailed recursive plant model as follows:

5.1. Approximated IBR Plant Model Evaluation of Case 1

For Case 1, the impedance of the collector system is not considered and the parameters for all the IBRs in the plant are the same. The total number of IBRs is 600. Regarding the LCL filter parameters of an IBR, the capacitance is 25 µF while the inductance is 0.2 mH, and the resistance of the filter inductor is 0.0015 Ω for both the inverter- and grid-side inductors. Moreover, the IBRs are synchronized and have same PCC voltage. Thus, the aggregated and detailed IBR plant models should generate the same results, according to the studies presented in Section 3 and Section 4. Figure 11 shows a comparison of the EMT simulation using the two models, in which the active power reference changes from 0 kW to 500 kW at 0.4 s, and the reactive power reference changes from 20 kVAR to 40 kVAR at 0.5 s. Table 3 gives a comparison of the current and voltage total harmonic distortions (THDs) by using the aggregated and detailed IBR plant models. Both show that the aggregated and detailed models generate the same results, validating the theoretical study given in Section 3 and Section 4.

5.2. Approximated IBR Plant Model Evaluation of Case 2

All IBRs within the IBR plant have the same LCL filter parameters in this case, but they are not synchronized and deliver different output voltages. Hence, the power reference of each IBR is different in the detailed model. The power reference of the average IBR in the aggregated model is the average of the power references of all the IBRs, according to (32). Figure 12 shows the active and reactive power at the POM of the IBR plant. The THD comparison by using the aggregated and detailed IBR plant models for Case 2 is given in Table 3. Unlike Case 1, the results obtained by using the aggregated and detailed models are not the same, which is consistent with the theoretical study shown Section 3. However, the difference between the aggregated and detailed models is very small, demonstrating the effectiveness of the proposed aggregated model.

5.3. Approximated IBR Plant Model Evaluation of Case 3

In this case, all the IBRs within the IBR plant have different LCL filter parameters, deliver different IBR output voltages, and are connected in parallel with different collector impedances to the POM. For the detail model, a perturbation of 20% on filter inductance and resistance is applied to obtain a random value of the filter parameters. A similar process is applied to the collector impedance. This represents the parallel connected IBRs having different collector lengths and having different filters. For the aggregated model, according to Section 4.3, the filter parameters of the average IBR are the average of all IBR filter parameters calculated using (28), and the collector resistance and inductance are the average of the collector resistance and inductance of all the IBRs calculated using (28). Again, the power reference of the average IBR in the aggregated model is the average of the power references of all the IBRs, according to (32). Figure 13 shows the EMT simulation results of the active and reactive powers at the POM obtained by using the detailed and aggregated models, and Table 3 gives the THD comparison. As expected, the difference between results obtained by using the aggregated and detailed models is higher for Case 3 than that for Case 2. However, the difference is still very small, demonstrating the effectiveness of the proposed aggregated model for Case 3.

5.4. Approximated IBR Plant Model Evaluation of Case 4

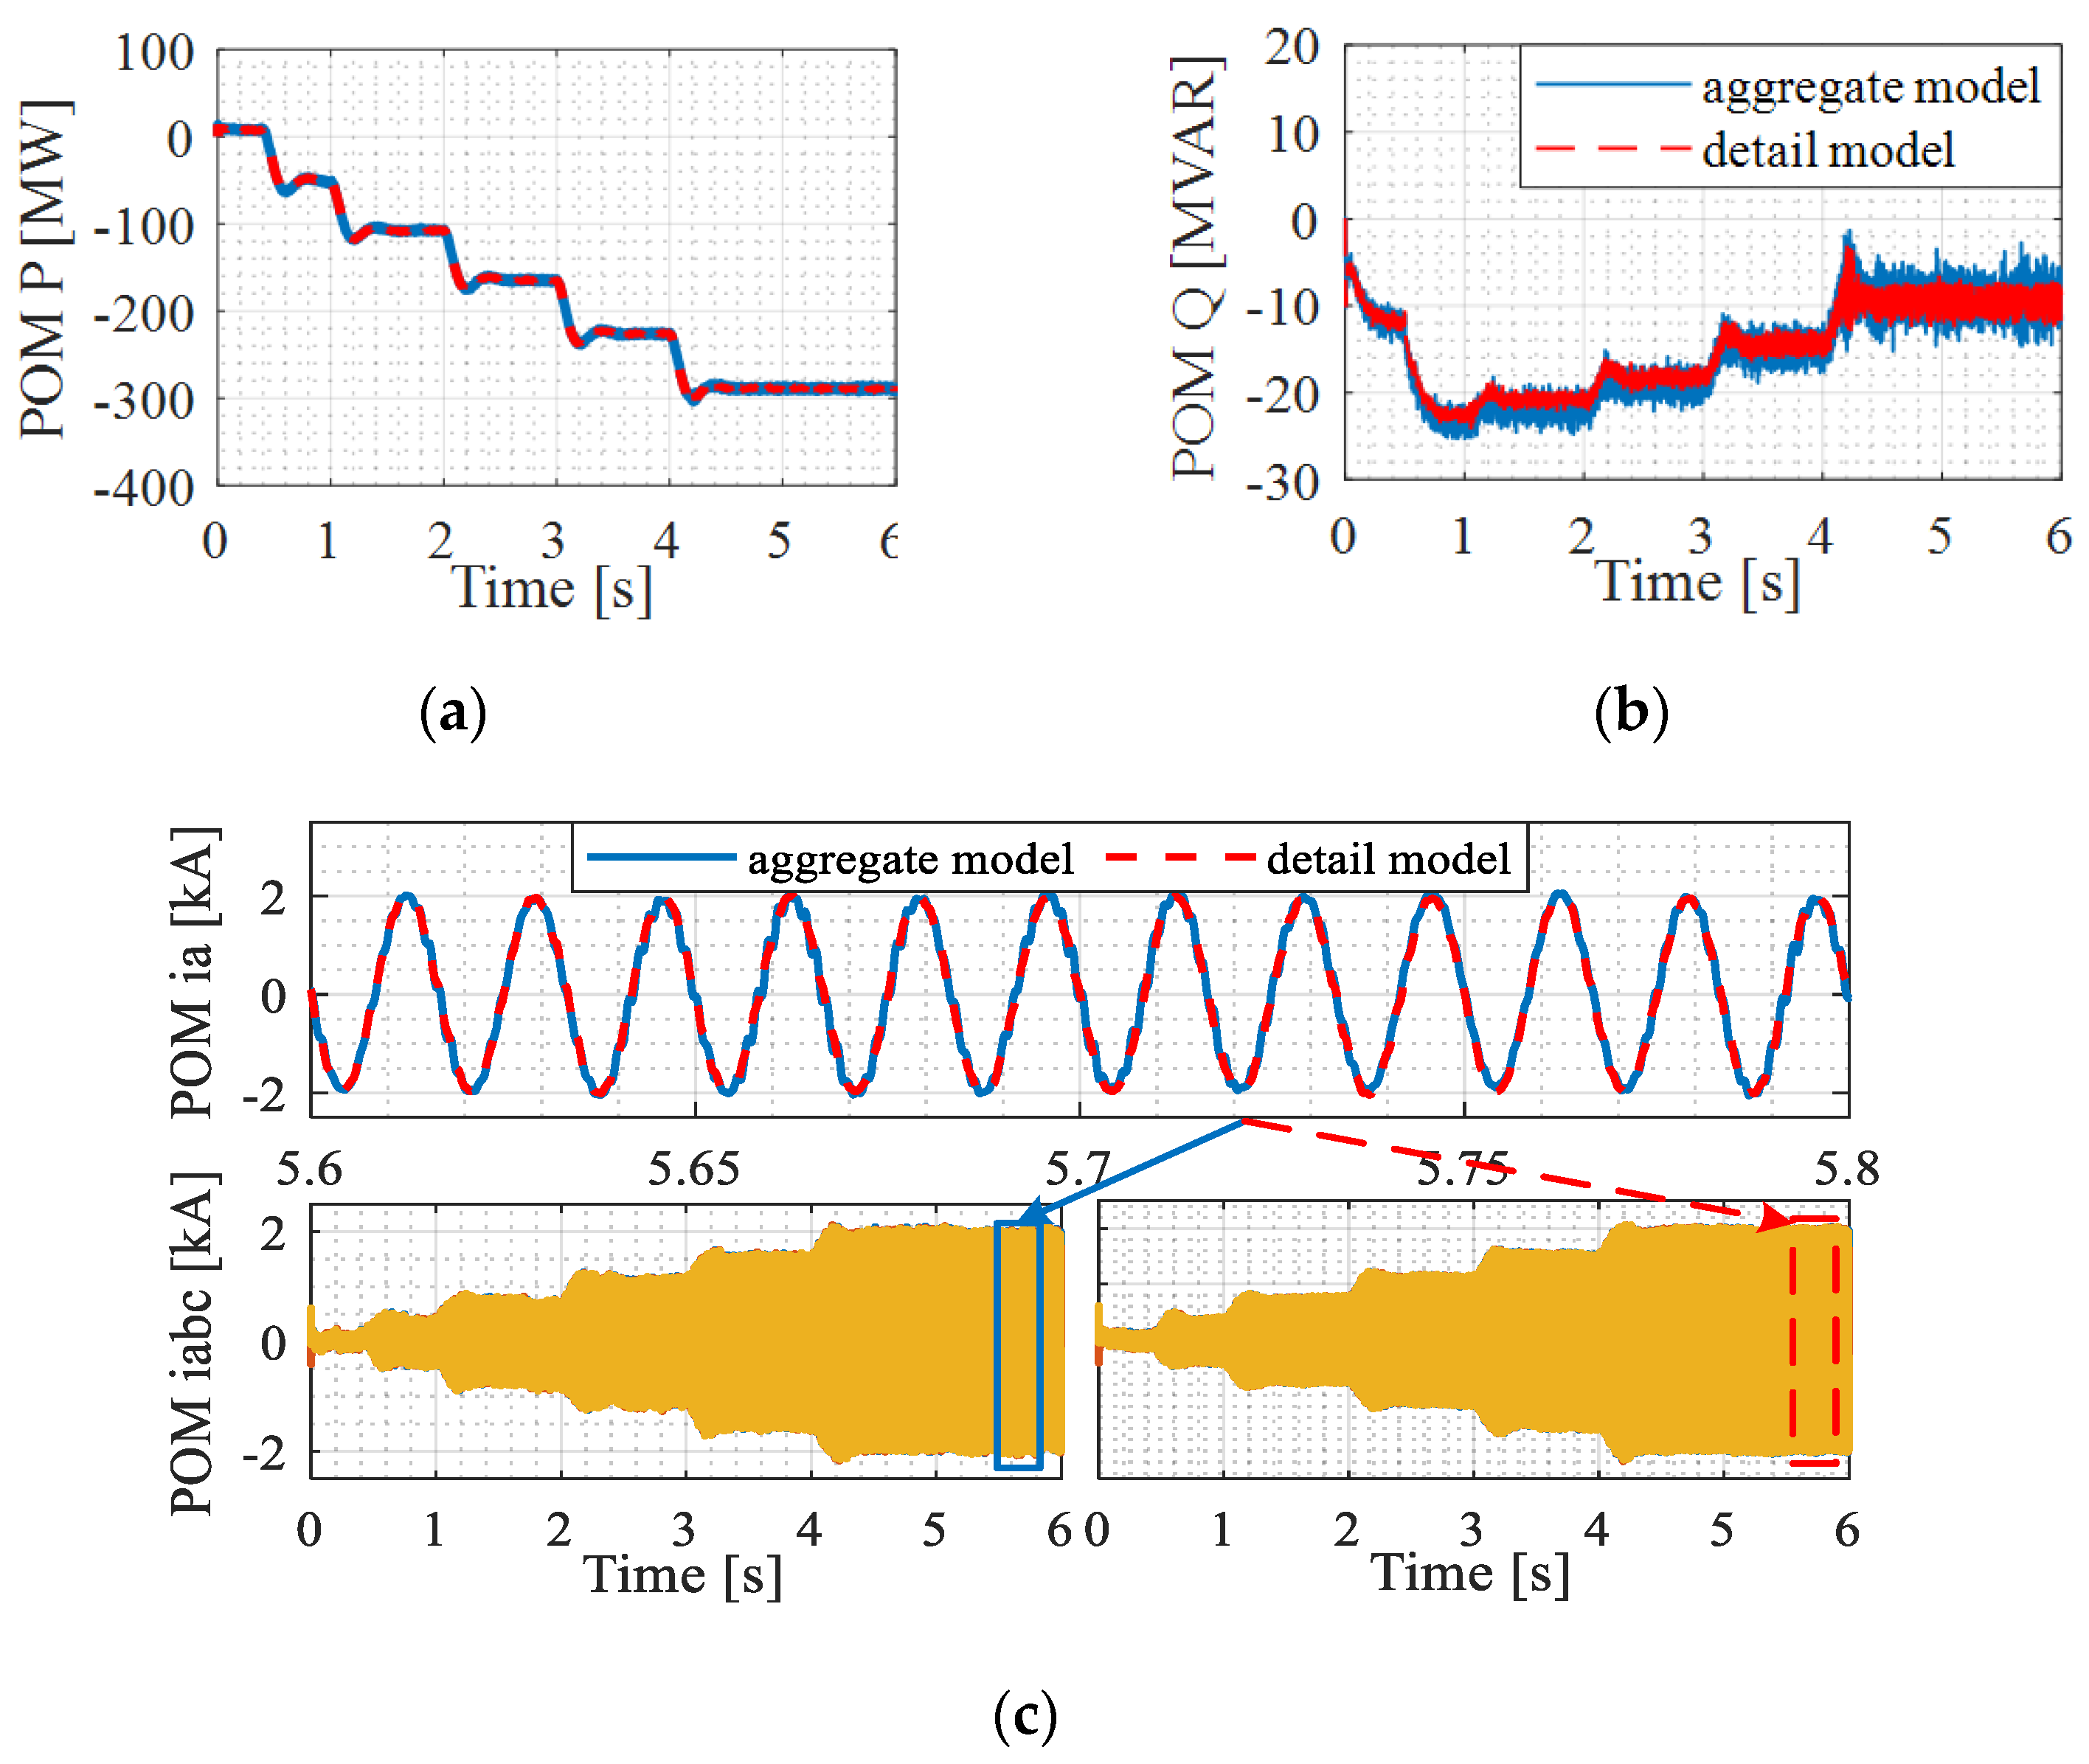
This case is like Case 3, except that the IBRs are connected to the POM in both parallel and series ways. Therefore, the approximate collector resistance and inductance of the aggregated model are obtained using (30) instead of (29). Figure 14 presents the EMT simulation results of the active and reactive powers at the POM obtained by using the detailed and aggregated models, and Table 3 gives the THD comparison. For this case, a comparison of the voltage and current waveforms using the detailed and aggregated models are also shown in Figure 14. As it can be seen, the difference between results obtained by using the aggregated and detailed models is still small, illustrating the effectiveness of the proposed aggregated model development for Case 4.

5.5. Performance Evaluation of the Approximate IBR Plant Model during Abnormal Operation Conditions

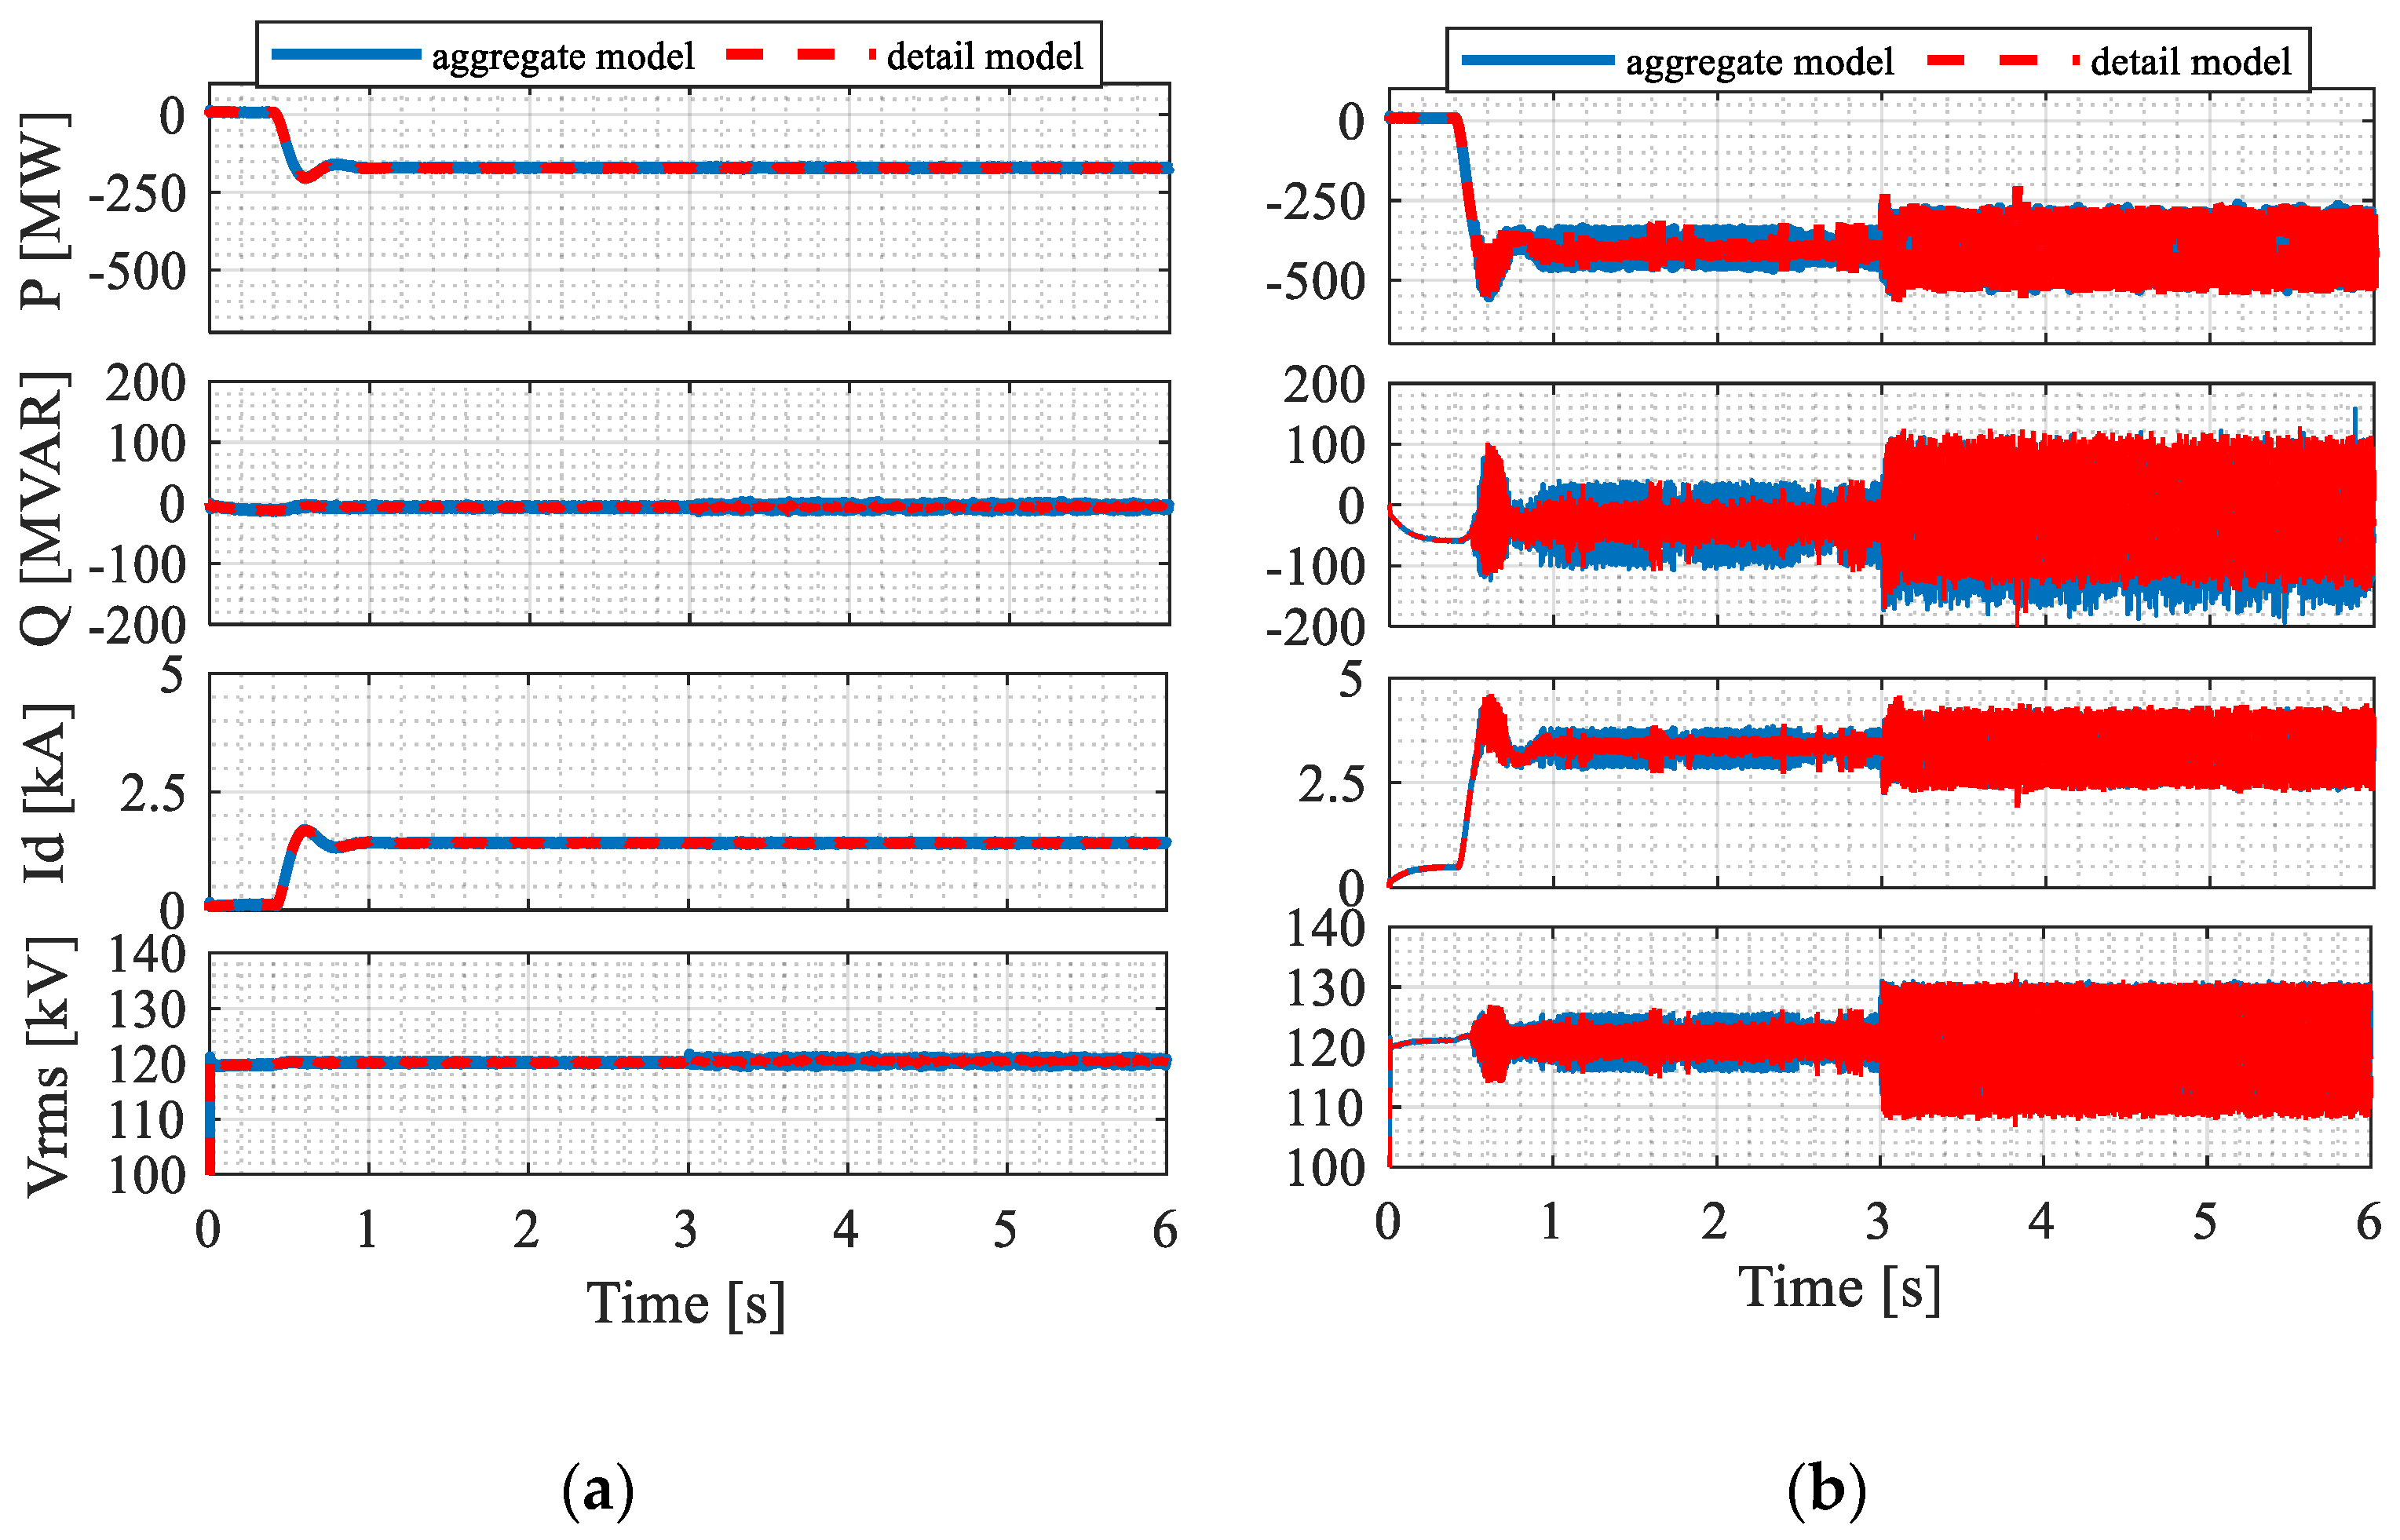
In this subsection, the performance of the proposed IBR plant during a fault event in the grid is analyzed. A real world event reported by Electric Reliability Council of Texas (ERCOT) in [35] is taken into account, where a type-4 WPP is connected to the grid, and a three phase to ground fault occurs, resulting abnormal operation in the WPP. To perform the analysis, the most comprehensive model, with the IBRs arranged in series and parallel combinations (explained in case 4), is considered. The IBR plant consists of 600 online IBRs connected via a 25k V collector system, and then interfaced to the grid via two 120 kV transmission lines. While operating normally, the short circuit ratio at the point of measurement (POM) is 3.5, which means the grid strength is in the medium range. A three phase to ground fault is introduced to one of the transmission lines, which means one of the transmission lines is disconnected from the grid. Due to the event, the impedance of the transmission line increases, and the short circuit ratio at POM decreases to 1.75 (weak grid). In this situation, the response of the IBR plant depends on the power supply scenario of the IBR plant. In Figure 15a, the response of the IBR plant at the POM is shown when the IBR plant's real and reactive power supply to the grid is low. The result is also compared with the detailed model to demonstrate the proposed model performance. In Figure 15b, the response with the higher real and reactive power supply is provided. In this case, an undamped oscillation can be noticed after the fault is introduced. This oscillation is denoted as sub-synchronous oscillation, and any further change in the plant, as well as in the grid, can lead to IBRs being tripped, resulting power loss of the IBR plant. A similar result, found in the detailed model simulation, is also shown in Figure 15b. These results are consistent with the results presented in the real case results of [35].

6. Conclusions

This paper presents an aggregated dynamic transient simulation model of an IBR plant. The aggregated model has incorporated different aspects of an IBR plant, as well as IBR configurations within the plant, such as collector system impacts, grid-connected filters of the IBR inverter, detailed control configurations at the inverter level, series/parallel orientation of IBRs within the plant, etc. The model development is supported by a detailed mathematical analysis and proving process. The developed IBR plant model can be used to simulate transient performance at the individual IBR level, evaluate the detailed and complete design of the IBR controller and grid-connected filter, and evaluate the transient interactions of multiple IBR groups in a plant structure. At the same time, the model can be used to evaluate the transient performance for the grid interconnection of the plant based on the IBR system and controller parameters of individual IBRs, instead of scaled and modified parameters that were normally needed to fit an aggregated plant model. The proposed model development has carefully addressed the collector system impact in diverse parallel and series connection scenarios. The model is verified through a comparison study with a detailed IBR plant model in a recursive way. The study and evaluation results show that the proposed IBR plant model is effective and accurate in investigating the interconnection of an IBR plant, with the grid as well as IBR controllers, at the inverter level in a plant configuration scenario.

Author Contributions

Conceptualization, H.S.D., S.L., methodology, H.S.D., S.L. software, H.S.D., S.L.; validation, H.S.D., S.L.; investigation, S.L.; data curation, S.L., S.R.; writing—original draft preparation, S.L., H.S.D., writing—review and editing, S.L., S.R., supervision, S.L. All authors have read and agreed to the published version of the manuscript.

Funding

This work is supported by National Science Foundation PFI-RP under grant number 2141067.

Data Availability Statement

Not applicable.

Acknowledgments

The authors would like to thank The University of Alabama for supporting us with lab and library facilities. In addition, the authors would like to express their appreciation to those colleagues who have contributed to the completion of this work.

Conflicts of Interest

The authors declare no conflict of interest.

Nomenclature

The following abbreviations are used in this manuscript:
BPSBulk Power System
DERDistributed Energy Resource
DGDistributed Generation
EMTElectromagnetic Transient
GCIGrid Connected Inverter
IBRInverter Based Resources
MCCModular Multilevel Converter
MVMedium Voltage
PCCPoint of Common Coupling
POIPoint of Interconnection
POMPoint of Measurement
PVPhotovoltaic
RESRenewable Energy Source
SPPSolar Power Plant
THDTotal Harmonic Distortion
WTWind Turbine
WPPWind Power Plant

References

  1. Lu, B.; Li, S.; Gao, Y.; Das, H.S. P-Q Capability Analysis of Inverter Based Resources with Typical Grid Connected Filters. In Proceedings of the 2020 IEEE Power & Energy Society General Meeting (PESGM), Montreal, QC, Canada, 2–6 August 2020; pp. 1–6. [Google Scholar] [CrossRef]
  2. IEEE 2800-2022; IEEE Standard for Interconnection and Interoperability of Inverter-Based Resources (IBRs) Interconnecting with Associated Transmission Electric Power Systems. IEEE: Manhattan, NY, USA, 22 April 2022.
  3. Xie, X.; Zhang, X.; Liu, H.; Liu, H.; Li, Y.; Zhang, C. Characteristic Analysis of Subsynchronous Resonance in Practical Wind Farms Connected to Series-Compensated Transmissions. IEEE Trans. Energy Convers. 2017, 32, 1117–1126. [Google Scholar] [CrossRef]
  4. Luhtala, R.; Messo, T.; Roinila, T.; Alenius, H.; De Jong, E.; Burstein, A.; Fabian, A. Identification of Three-Phase Grid Impedance in the Presence of Parallel Converters. Energies 2019, 12, 2674. [Google Scholar] [CrossRef] [Green Version]
  5. Gul, M.U.; Ahmed, A.; Warraich, A. A practical method for equivalencing of a large wind farm with multiple turbine representation. In Proceedings of the 2018 IEEE 7th International Conference on Power and Energy (PECon), Kuala Lumpur, Malaysia, 3–4 December 2018; pp. 156–161. [Google Scholar] [CrossRef]
  6. Kim, D.-E.; El-Sharkawi, M.A. Dynamic Equivalent Model of Wind Power Plant Using Parameter Identification. IEEE Trans. Energy Convers. 2015, 31, 37–45. [Google Scholar] [CrossRef]
  7. Kim, D.-E.; El-Sharkawi, M.A. Dynamic Equivalent Model of Wind Power Plant Using an Aggregation Technique. IEEE Trans. Energy Convers. 2015, 30, 1639–1649. [Google Scholar] [CrossRef]
  8. Muljadi, E.; Pasupulati, S.; Ellis, A.; Kosterov, D. Method of equivalencing for a large wind power plant with multiple turbine representation. In Proceedings of the 2008 IEEE Power and Energy Society General Meeting—Conversion and Delivery of Electrical Energy in the 21st Century, Pittsburgh, PA, USA, 20–24 July 2008. [Google Scholar]
  9. Elizondo, M.A.; Lu, S.; Zhou, N.; Samaan, N. Model reduction, validation, and calibration of wind power plants for dynamic studies. In Proceedings of the 2011 IEEE Power and Energy Society General Meeting, Detroit, MI, USA, 24–28 July 2011; pp. 1–8. [Google Scholar] [CrossRef]
  10. Yan, L.; Yongning, C.; Haiyan, T.; Xinshou, T.; Yuanzhu, C. Wind Farm Equivalent Model Based on Power Output Sensitivity of Wind Turbines. In Proceedings of the 2019 IEEE Sustainable Power and Energy Conference (iSPEC), Beijing, China, 21–23 November 2019; pp. 76–80. [Google Scholar] [CrossRef]
  11. Dozein, M.G.; Chaspierre, G.; Mancarella, P.; Panciatici, P.; Van Cutsem, T. Frequency Response from Solar PV: A Dynamic Equivalence Closed-Loop System Identification Approach. IEEE Syst. J. 2021, 16, 713–722. [Google Scholar] [CrossRef]
  12. Remon, D.; Cantarellas, A.M.; Rodriguez, P. Equivalent Model of Large-Scale Synchronous Photovoltaic Power Plants. IEEE Trans. Ind. Appl. 2016, 52, 5029–5040. [Google Scholar] [CrossRef]
  13. Hart, P.J.; Lasseter, R.H.; Jahns, T. Reduced-order harmonic modeling and analysis of droop-controlled distributed generation networks. In Proceedings of the 2016 IEEE 7th International Symposium on Power Electronics for Distributed Generation Systems (PEDG), Vancouver, BC, Canada, 27–30 June 2016. [Google Scholar]
  14. Hart, P.J.; Lasseter, R.H.; Jahns, T.M. Enforcing coherency in droop-controlled inverter networks through use of advanced voltage regulation and virtual impedance. In Proceedings of the 2017 IEEE Energy Conversion Congress and Exposition (ECCE), Cincinnati, OH, USA, 1–5 October 2017. [Google Scholar]
  15. Li, C.; Xu, J.; Zhao, C. A Coherency-Based Equivalence Method for MMC Inverters Using Virtual Synchronous Generator Control. IEEE Trans. Power Deliv. 2016, 31, 1369–1378. [Google Scholar] [CrossRef]
  16. Purba, V.; Dhople, S.V.; Jafarpour, S.; Bullo, F.; Johnson, B.B. Reduced-order structure-preserving model for parallel-connected three-phase grid-tied inverters. In Proceedings of the 2017 IEEE 18th Workshop on Control and Modeling for Power Electronics (COMPEL), Stanford, CA, USA, 9–12 July 2017; pp. 1–7. [Google Scholar] [CrossRef]
  17. Purba, V.; Johnson, B.B.; Rodriguez, M.; Jafarpour, S.; Bullo, F.; Dhople, S.V. Reduced-order Aggregate Model for Parallel-connected Single-phase Inverters. IEEE Trans. Energy Convers. 2018, 34, 824–837. [Google Scholar] [CrossRef]
  18. Gupta, A.P.; Mitra, A.; Mohapatra, A.; Singh, S.N. A Multi-Machine Equivalent Model of a Wind Farm Considering LVRT Characteristic and Wake Effect. IEEE Trans. Sustain. Energy 2022, 13, 1396–1407. [Google Scholar] [CrossRef]
  19. Liu, B.; Li, Z.; Wang, H.; Dong, X.; Su, W.; Li, G.; Chen, X.; Fernando, T.; Iu, H.H.C.; Lian, X.; et al. Impedance Modeling of DFIG Wind Farms with Various Rotor Speeds and Frequency Coupling. IEEE Trans. Circuits Syst. II Express Briefs 2020, 68, 406–410. [Google Scholar] [CrossRef]
  20. Wang, X.; Yu, H.; Lin, Y.; Zhang, Z.; Gong, X. Dynamic Equivalent Modeling for Wind Farms with DFIGs Using the Artificial Bee Colony With K-Means Algorithm. IEEE Access 2020, 8, 173723–173731. [Google Scholar] [CrossRef]
  21. Zhu, L.; Zhang, J.; Zhong, D.; Wang, B.; Wu, Z.; Xu, M.; Li, Q. A Study of Dynamic Equivalence Using the Similarity Degree of the Equivalent Power Angle in Doubly Fed Induction Generator Wind Farms. IEEE Access 2020, 8, 88584–88593. [Google Scholar] [CrossRef]
  22. Chao, P.; Li, W.; Liang, X.; Xu, S.; Shuai, Y. An Analytical Two-Machine Equivalent Method of DFIG-Based Wind Power Plants Considering Complete FRT Processes. IEEE Trans. Power Syst. 2021, 36, 3657–3667. [Google Scholar] [CrossRef]
  23. Liu, M.; Pan, W.; Zhang, Y.; Zhao, K.; Zhang, S.; Liu, T. A Dynamic Equivalent Model for DFIG-Based Wind Farms. IEEE Access 2019, 7, 74931–74940. [Google Scholar] [CrossRef]
  24. Wang, P.; Zhang, Z.; Huang, Q.; Wang, N.; Zhang, X.; Lee, W.-J. Improved Wind Farm Aggregated Modeling Method for Large-Scale Power System Stability Studies. IEEE Trans. Power Syst. 2018, 33, 6332–6342. [Google Scholar] [CrossRef]
  25. Jinxin, O.; Yanbo, D.; Di, Z.; Rui, Y.; Xi, Z.; Xiaofu, X. Dynamic equivalent model of doubly fed wind farm during electromagnetic transient process. IET Renew. Power Gener. 2016, 11, 100–106. [Google Scholar] [CrossRef]
  26. Adib, A.; Mirafzal, B.; Wang, X.; Blaabjerg, F. On Stability of Voltage Source Inverters in Weak Grids. IEEE Access 2018, 6, 4427–4439. [Google Scholar] [CrossRef]
  27. Li, S.; Fairbank, M.; Johnson, C.; Wunsch, D.C.; Alonso, E.; Proao, J.L. Artificial Neural Networks for Control of a Grid-Connected Rectifier/Inverter Under Disturbance, Dynamic and Power Converter Switching Conditions. IEEE Trans. Neural Networks Learn. Syst. 2013, 25, 738–750. [Google Scholar] [CrossRef] [PubMed] [Green Version]
  28. IEEE 1547-2018; IEEE Standard for Interconnection and Interoperability of Distributed Energy Resources with Associated Electric Power Systems Interfaces. IEEE: New York, NY, USA, 2018.
  29. Dai, C.; Baghzouz, Y. Impact of distributed generation on voltage regulation by LTC transformer. In Proceedings of the 2004 11th International Conference on Harmonics and Quality of Power (IEEE Cat. No. 04EX951), Lake Placid, NY, USA, 12–15 September 2004. [Google Scholar]
  30. Mohan, N. Advanced Electric Drives: Analysis, Control, and Modeling Using MATLAB/Simulink; John Wiley & Sons: Hoboken, NJ, USA, 2014. [Google Scholar]
  31. Li, S.; Haskew, T.A.; Xu, L. Conventional and novel control designs for direct driven PMSG wind turbines. Electr. Power Syst. Res. 2010, 80, 328–338. [Google Scholar] [CrossRef]
  32. Das, H.S.; Nurunnabi; Salem, M.; Li, S.; Rahman, M.M. Utilization of Electric Vehicle Grid Integration System for Power Grid Ancillary Services. Energies 2022, 15, 8623. [Google Scholar] [CrossRef]
  33. Uluski, B. Volt/var Control and Optimization Concepts and Issues; Electric Power Research Institute: Washington, DC, USA, 2011; p. 58. [Google Scholar]
  34. Dannehl, J.; Wessels, C.; Fuchs, F.W. Limitations of Voltage-Oriented PI Current Control of Grid-Connected PWM Rectifiers with LCL Filters. IEEE Trans. Ind. Electron. 2008, 56, 380–388. [Google Scholar] [CrossRef]
  35. Huang, S.-H.; Schmall, J.; Conto, J.; Adams, J.; Zhang, Y.; Carter, C. Voltage control challenges on weak grids with high penetration of wind generation: ERCOT experience. In Proceedings of the 2012 IEEE Power and Energy Society General Meeting, San Diego, CA, USA, 22–26 July 2012; pp. 1–7. [Google Scholar] [CrossRef]
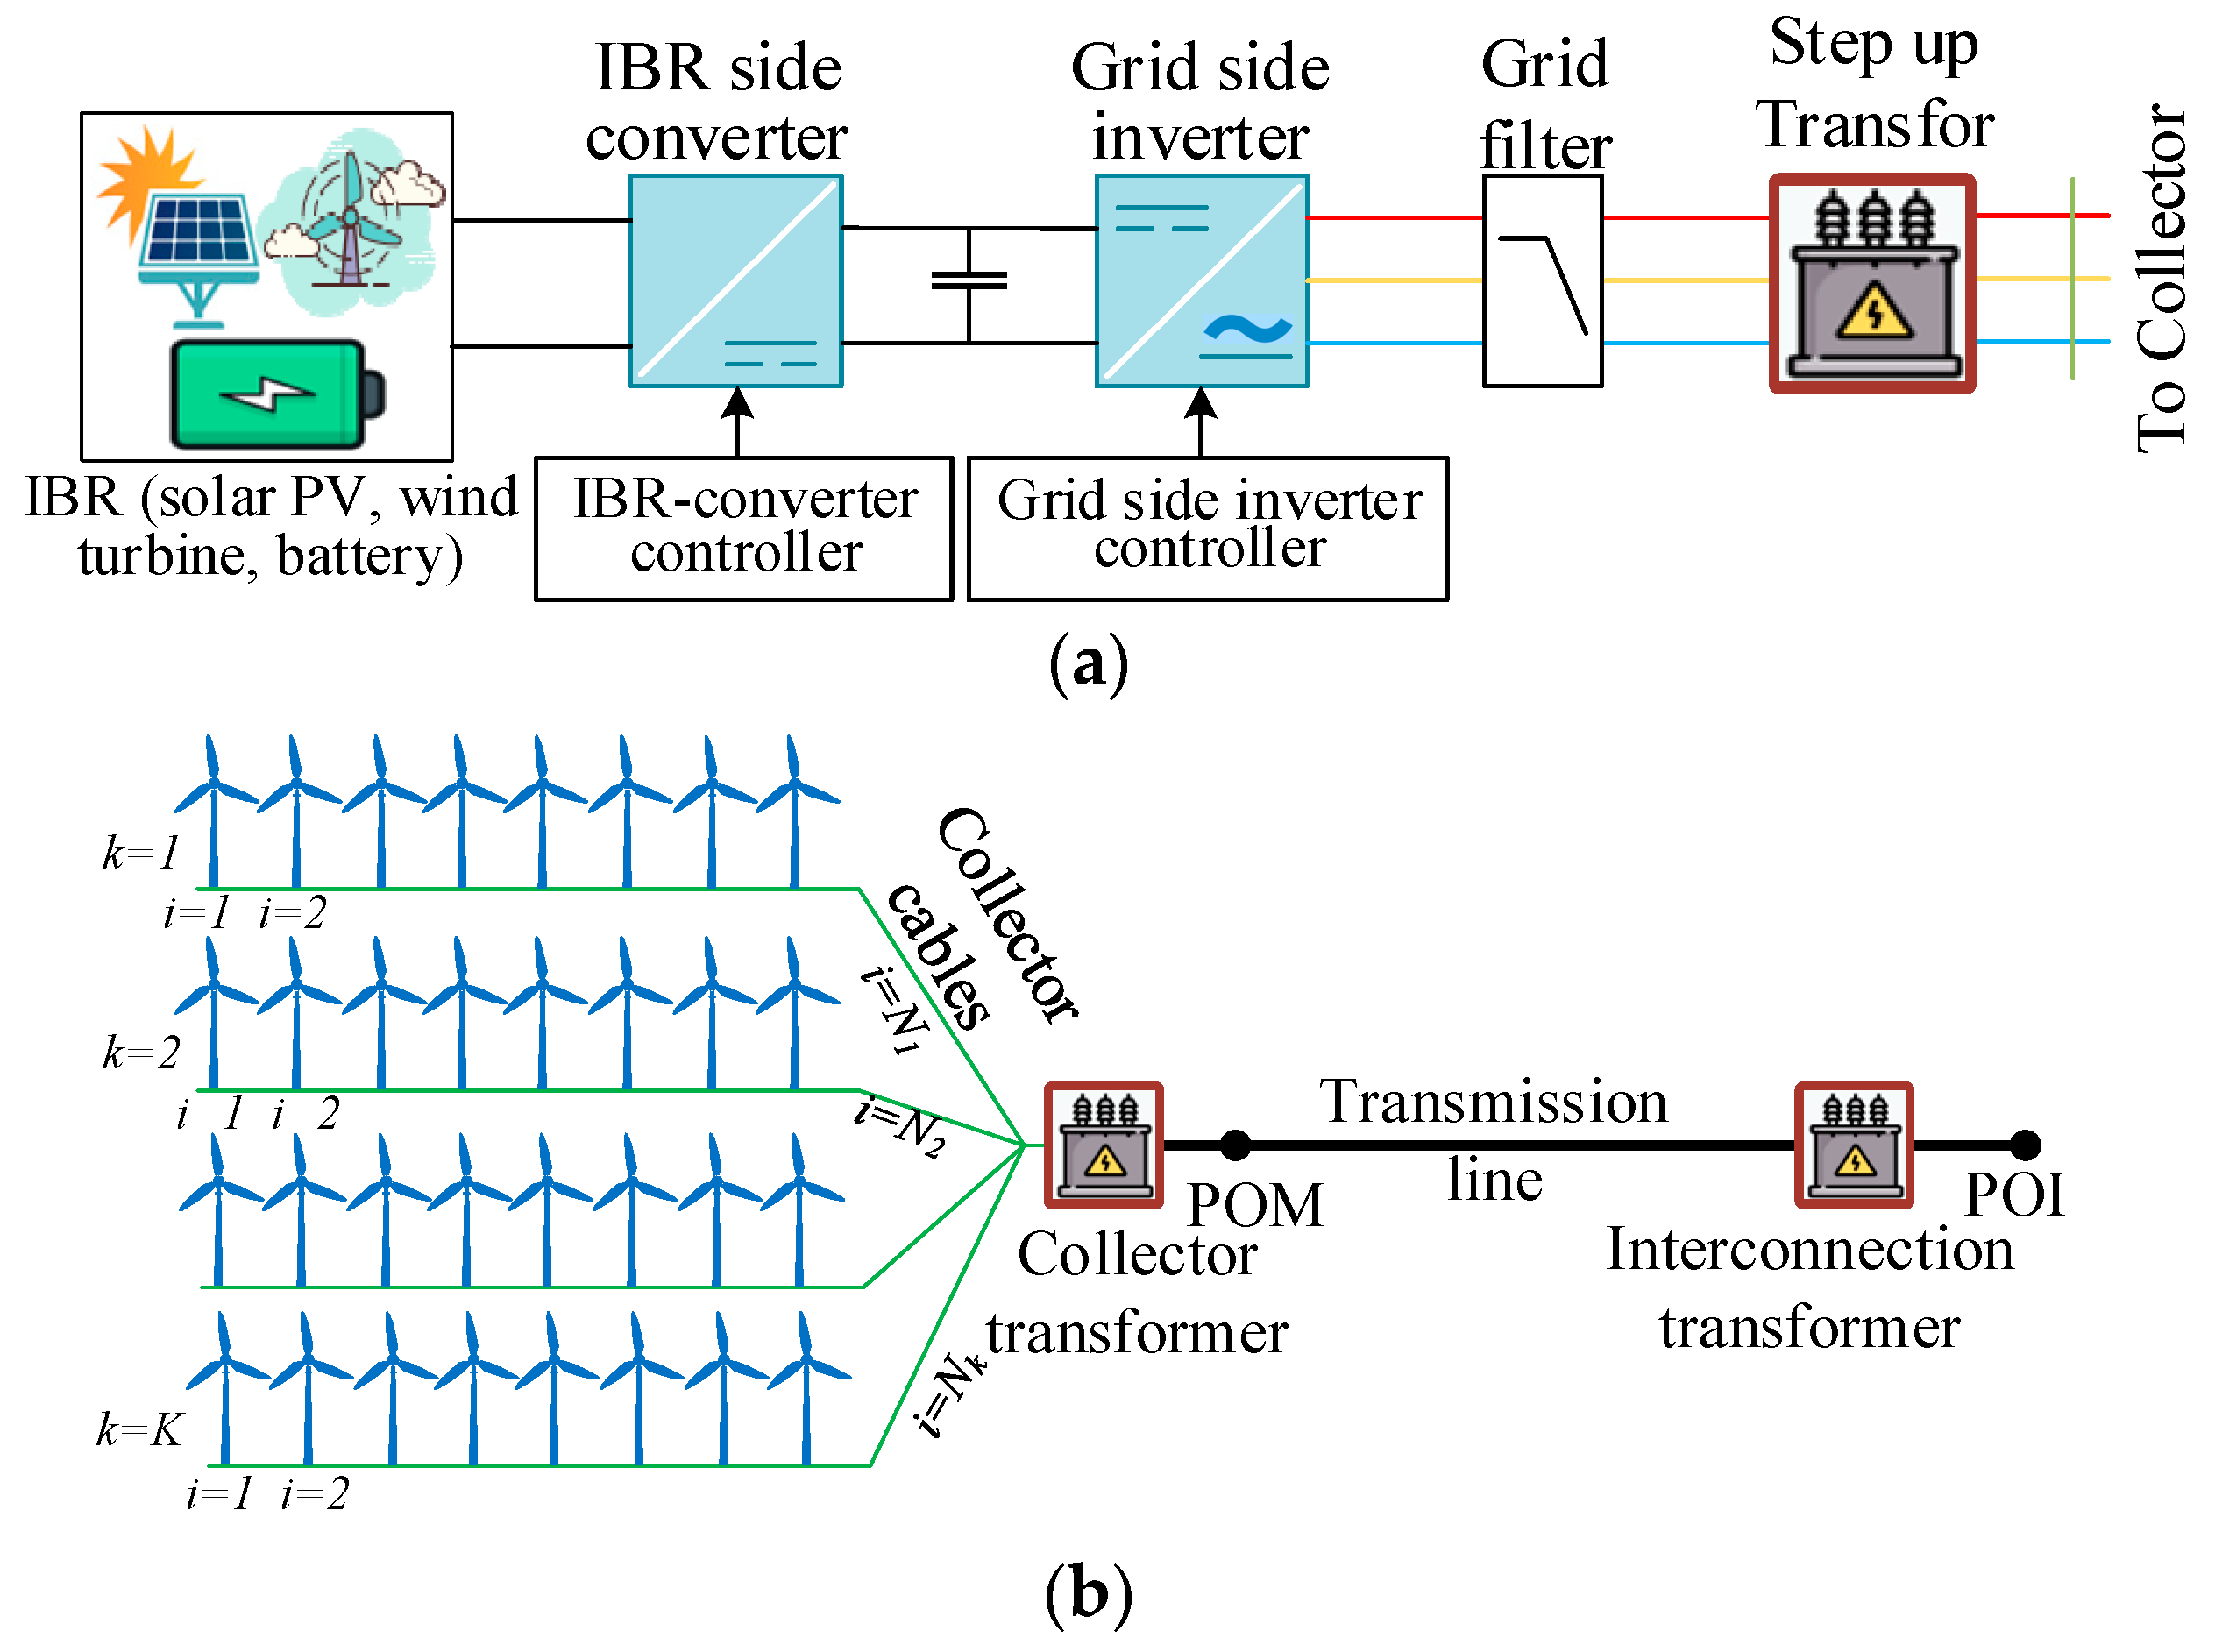
Figure 1. A generalized diagram of (a) a full-scale IBR system and (b) a grid connected WPP.
Energies 16 03211 g001
Figure 2. Plant level and IBR level controller structure of an inverter interfaced IBR plant.
Energies 16 03211 g002
Figure 3. Schematic diagram of an LCL-filter interfaced IBR unit.
Energies 16 03211 g003
Figure 4. A grid-connected IBR plant including IBRs, IBR filters, collector impedances, and grid impedance.
Energies 16 03211 g004
Figure 5. Equivalent circuit diagram of an IBR plant looking from the IBR side.
Energies 16 03211 g005
Figure 6. Equivalent circuit diagram of an IBR plant looking from the grid side.
Energies 16 03211 g006
Figure 7. Equivalent circuit diagram of an IBR plant: (a) looking from the IBR side, (b) looking from the average IBR viewpoint.
Energies 16 03211 g007
Figure 8. Aggregated IBR plant model for Case 1.
Energies 16 03211 g008
Figure 9. Aggregated IBR plant model for Case 3.
Energies 16 03211 g009
Figure 10. Configuration of the aggregated IBR plant model: (a) IBR plant structure, (b) IBR control structure.
Energies 16 03211 g010
Figure 11. Active and reactive power at the POM for Case 1 using aggregated and detailed models: (a) Active power, (b) Reactive Power.
Energies 16 03211 g011
Figure 12. Active and reactive power at the POM for Case 2 using aggregated and detailed models: (a) Active power, (b) Reactive Power.
Energies 16 03211 g012
Figure 13. Active and reactive power at the POM for Case 3 using aggregated and detailed models: (a) Active power, (b) Reactive Power.
Energies 16 03211 g013
Figure 14. Active and reactive power and current at the POM for Case 4 using aggregated and detailed models: (a) Active power, (b) Reactive Power, (c) Three-phase current plus a comparison of Phase a current.
Energies 16 03211 g014
Figure 15. IBR plant response in case of three phase to ground fault in transmission line (a) strong grid scenario, (b) weak grid scenario.
Energies 16 03211 g015
Table 1. Summary of IBR models presented in literature.
Refs.Source TypeConfiguration TypeNo. of Units Simulation MethodComments
[5]WTParallelVariableLoad flowWTs vary in capacity, operating conditions, and parameters.
[6]WTParallelVariablePhasor simulationApplicable to any type of induction generators.
[7]WTParallelVariablePhasor simulationThe accuracy increases with the number of WTs.
[8]WTSeries, ParallelVariableEMTDetailed transient modeling and EMT simulation is absent.
[9]WTNot Specified168Phasor simulationConsider diversity in wind speed, collector network impedance, and type of WTs.
[10]WTSeries12Phasor simulationProvide an inaccurate response when the output power is larger than the grid short circuit capacity.
[11]PVNot SpecifiedNot SpecifiedEMTApplicable for PV units of different locations and scales.
[12]PVSeries, Parallel100Phasor simulationFocus on the active and reactive power dynamics at the POI.
[13,14]DGSeries, Parallel50EMTFocus on developing an aggregate model for a group of droop-controlled inverters.
[15]RESsParallelVariableEMTFocus on developing an aggregate model for the power circuit of the converters.
[16,17]InvertersParallelVariablePhasor simulationCollector system impact is not considered.
[18]WTSeries, ParallelVariableComputational Develop an aggregate model focused on the LVRT characteristic and Wake effect.
[19]WTSeries, ParallelVariablePhasor simulationFocus on the difference in rotor speed of each WT and the frequency coupling effect.
[20,21]WTParallelVariableComputationalDoes not consider LVRT control, and reactive power capability limit.
[22]WTSeries, ParallelVariableEMTDoes not consider collector network transformation.
[23]WTSeries, ParallelVariableComputationalFocuses on clustering of WT in the plant. Does not focus on individual WT control.
[24]WTSeries, Parallel66ComputationalFocuses on clustering of WT in the plant. Does not focus on individual WT control.
[25]WTSeriesVariableEMTDoes not focus on WT control.
Proposed modelWT/PV/BatterySeries, Parallel, combined VariableEMTConsiders collector network transformation, low computational complexity, scalable for lower number to very high number of IBRs, ready for EMT simulation, can verify individual IBR parameter properties.
Table 2. System parameters of the IBR plant model.
ParameterValues
Renewable energy source voltage690 Vrms
DC bus voltage1500 V
PCC voltage before transformer690 Vrms
Source side filter inductance (L filter)0.4 mH
Source side filter resistance (L filter)3 mΩ
DC bus capacitance0.2 F
Grid side LCL filter inductance (Lf, Lg)0.28 mH
Grid side LCL filter resistance (Rf, Rg)3 mΩ
Grid side LCL filter capacitance (Cf)56 µF
Grid side LCL filter capacitor resistance (CRf)0.4 Ω
PCC transformer (690/25kV)1.5 MVA
Collector transformer (25kV/120kV)1500 MVA
Collector impedanceVaries with plant structure
Transmission line impedance144 mΩ, 3.8 mH (SCR = 4.4)
480 mΩ, 12.7 mH (SCR = 2.1)
Grid impedance at POI (X/R ratio)5.6
Table 3. THD comparison between aggregate and detail model at POM.
No of IBR = 600Voltage THD (%)Current THD (%)
Case 1Aggregated model1.932.94
Detailed model1.932.94
Case 2Aggregated model1.842.65
Detailed model1.732.61
Case 3Aggregated model2.373.83
Detailed model1.942.99
Case 4Aggregated model2.54.06
Detailed model2.073.21
Disclaimer/Publisher’s Note: The statements, opinions and data contained in all publications are solely those of the individual author(s) and contributor(s) and not of MDPI and/or the editor(s). MDPI and/or the editor(s) disclaim responsibility for any injury to people or property resulting from any ideas, methods, instructions or products referred to in the content.