Abstract
Gas turbine fuel burn for an aircraft engine can be obtained analytically using thermodynamic cycle analysis. For large-diameter ultra-high bypass ratio turbofans, the impact of nacelle drag and propulsion system integration must be accounted for in order to obtain realistic estimates of the installed specific fuel consumption. However, simplified models cannot fully represent the complexity of installation effects. In this paper, we present a method that combines thermodynamic cycle analysis with detailed Computational Fluid Dynamics (CFD) modelling of the installation aerodynamics to obtain the fuel consumption at a given mission point. The flow field and propulsive forces arising in a transport aircraft powered by an ultra-high bypass ratio turbofan at cruise are first examined to characterise the operating conditions and measure the sensitivity to variations of the incidence at transonic flight. The proposed methodology, in which dynamic balance of the vehicle is achieved at each integration point, is then applied along a cruise segment to calculate the cumulative fuel burn and the change in the specific fuel consumption.
1. Introduction
Increasing operational costs and regulatory constraints on environmental impact have been pushing aircraft performance, emissions, and pollution towards continuous improvement over the time. Current generation single-aisle transport aircraft in the 200PAX class are able to achieve a gain of around 20% in fuel efficiency per Available Seat Kilometre (ASK) relative to legacy early-2000s counterparts [1]. The next technological target in terms of aircraft propulsion is the implementation of Ultra-High Bypass Ratio (UHBPR) turbines in the 2025+ fleet, as major engine manufacturers are actively developing and testing this propulsor concept. As reviewed by Epstein [2], new design spaces are being opened to tackle ambitious twenty-first century commercial aviation sustainability targets, including smaller and more efficient cores, geared fan architectures, and large-BPR low pressure ratio fans. With these features, the presence of an upper limit on the effective improvements for ducted fans has been readily recognised owing to the counterbalancing effect of detrimental installation penalties in terms of excessive drag and weight of engine and airframe for overlarge fan diameters [3,4,5]. The optimal single-aisle transport aircraft, therefore, results from the contemporary improvement in propulsion technology and balance of airframe weight and efficiency, considering the entire flight envelope requirements.
In the last twenty years, a large number of parametric studies has been conducted regarding the impact of UHBPR turbofans on overall aircraft performance. Hughes [6] summarized the collaborative NASA work on UHBPR engines technology. Relevant research was conducted by Dagget [7] as well as by Guynn and Berton [8,9,10]. Dagget carried out an integration study of different high-BPR turbofans on a modified Boeing 777-200ER with composite wings, finding a potential reduction in Thrust Specific Fuel Consumption (TSFC) of up to 16%. This analysis considered several aspects of engine integration, including propulsor weight, nacelle drag and wing interference, ground clearance and engine placement, and engine-out performance. Guynn and Berton conducted a trade-off study with a direct-drive or geared fan applied to an advanced subsonic single-aisle transport aircraft of the B7373/A320 class for Entry Into Service in the 2015–2020 time frame. Using a series of NASA codes for engine thermodynamic modelling and aircraft sizing, they examined the impact of design objective on high-BPR engine layout and aircraft performance.
As highlighted above, apart from the specific gas turbine arrangement and cycle, the essential step to provide realistic aircraft performance in terms of fuel consumption is to incorporate installation effects at the design exploration level. These include the influence of the weight and drag of the propulsor as well as its airframe integration. Considering the aerodynamics, establishing the correlation between a given gas turbine layout and the propulsive forces is mandatory. The available thrust is diminished by the bulk component losses, which are modelled in the thermodynamic cycle analysis through coefficients such as inlet pressure recovery, bypass duct loss, or nozzle velocity and thrust coefficients. The drag is determined by the nacelle shape, which is driven by fan diameter and engine length. At the conceptual design level, given the absence of detailed geometric knowledge, this is typically estimated using semi-empirical models based on flat plate analogies or experimental data. For instance, Alexiou [11] expressed the nacelle drag as a factor decreasing net thrust proportional to flight velocity and specific thrust. Larsson [12] and Thoma [13] employed the ESDU 81024 code [14] and built on NACA 1-series axisymmetric cowl tests at no incidence. Bijewitz [15] derived a correlation between fan diameter and nacelle axial and radial dimensions, scaling the drag to the nacelle wetted area.
Having estimated the installed thrust and the corresponding installed TSFC, the block fuel can then be derived by integrating the mission profile. For large UHBPR turbofans, however, additional interference drag coming from engine/wing interaction is present and is typically not explicitly included. This is a relevant component, amounting to 10–15% of airframe drag, with the nacelle drag alone being around half that of the wings [16].
Aiming to provide a more accurate estimation of the real propulsive performance for a given aircraft model, in this paper we present a method that corroborates thermodynamic cycle analysis with high-fidelity Computational Fluid Dynamics (CFD) simulations to integrate the fuel consumption along a flight segment. The complexity of installation effects, in fact, prevents accurate decomposition into single contributions that can be modelled separately and superimposed at early design [17]. Moreover, even when they can be estimated globally, they impact the engine operation and the resulting turbomachinery status as a result of inlet distortion and nozzle suppression effects. Therefore, it is necessary to simulate both the propulsor and airframe in order to account for their coupling and accurately evaluate the installed performance.
Thus, this paper first reviews the aerodynamics of engine/airframe interference at cruise condition over a range of incidence close to the nominal one, illustrating the sensitivity of the flow field and the aerodynamic forces to the angle of attack. After that, the proposed method is applied to a cruise segment, where 0D thermodynamic data are matched to CFD simulations in order to obtain the fuel burn and installed TSFC. Before presenting the outcome of the study in Section 3, the following Section 2 illustrates the aircraft and engine model, the numerical methods, and the proposed algorithm.
2. Materials and Methods
2.1. Aircraft and Turbofan Model
The aircraft considered in the study is the NASA Common Research Model (CRM), a tube+wing transonic transport configuration designed for a cruise Mach number of M = 0.85 with a nominal lift coefficient = 0.50 and a reference chord Reynolds number of = 40 M [18]. This geometry has become a standard for computational model validation and experimental activities, being used as part of the AIAA Drag Prediction Workshop (DPW) 4 to 6, with a huge amount of data having been collected [19,20,21]. Within the framework of the IVANHOE project, the previous flight conditions were set as the Aerodynamic Design Point (ADP) for the synthesis of a podded UHBPR turbofan designed to meet thrust requirements at cruise and take-off while minimising the TSFC. The engine thermodynamic model was carried out using the commercial GasTurb software [22] considering a current technology level. The resulting engine layout featured a three-spool geared architecture with ADP values of BPR > 15, fan pressure ratio (FPR) < 1.4, and Overall Pressure Ratio (OPR) = 50.
The gas turbine was installed under the wing in a short and slim nacelle designed by incorporating indications reported in the open literature with sensitivity studies on the effect of the main geometric parameters on drag and thrust [23]. The geometry has been described in other papers by these authors regarding engine installation studies; its main features are reported here for clarity. The scarfed and drooped non axisymmetric nacelle had a nominal mass flow capture ratio around 0.7 and a cowl length to highlight diameter of 1.6. The underwing installation position has a major effect on the interference drag and the thrust losses [16]. The nacelle trailing edge was set to have a wing chord-normalised offset from the wing leading edge of −0.05 in the horizontal direction and −0.11 in the vertical direction (with the minus sign indicating upstream and down from the wing leading edge, respectively) to mimic a close-coupled installation. Overall, the whole airplane should be representative of a long-range transport vehicle with a UHBPR turbofan in the 2030 timeframe.
2.2. CFD Modelling
The previously described test case was simulated by solving steady-state Reynolds-Averaged Navier–Stokes (RANS) equations using a commercial finite volume solver (Ansys Fluent [24]) with second order discretisation and SST turbulence closure. The computational method was developed in the IVANHOE project using data from the DPW. Grid resolution for the Wing Body Nacelle Pylon (WBNP) configuration of the NASA CRM was first specified in accordance with workshop guidelines [25,26] and assessed for the current geometry with a powered-on nacelle. A detailed description of the numerical model validation is reported in [16,27]. Here, a summary of the mesh sensitivity analysis at the ADP is reported for completeness in Table 1. Five mesh levels with decreasing grid factor were generated using an unstructured topology with tetrahedral elements in the external flow region, quadrilateral dominant surface mesh, and a wall-normal grown boundary layer having a slightly decreasing wall starting from the coarsest level. Figure 1 reports three views of a sample mesh, illustrating the multiple refinements block built to better resolve the flow past the nacelle, especially in the jet and pre-entry region (Figure 1a), a closer detail of the area around the nacelle with the boundary layer mesh connected to the tetrahedral zone (Figure 1b), and the surface grid (Figure 1c).

Table 1.
Grid convergence analysis at ADP.
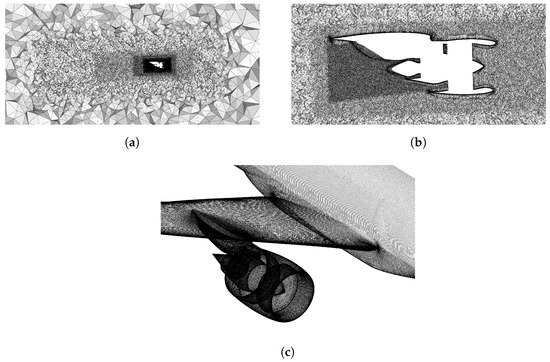
Figure 1.
Different views of a sample mesh. (a) Multiple refinement blocks to better resolve the flow around the powered-on nacelle. (b) Detail of the mesh around the nacelle with the wall-normal grown boundary layer. (c) Surface mesh on the model walls.
Refinement from that level was achieved by reducing the surface grid size and the expansion ratio according to the specified grid refinement ratio. The table shows a convergent behaviour of the drag coefficient at constant lift. The net force acting on the airplane, (Equation (7)), has a non-monotonic convergence due to a lower value for the fine mesh, although from the medium level onwards it shows stabilization with small amplitude variation. Thus, the medium mesh was employed in the following analyses to avoid the excessive computational cost of finer discretisations without penalising the accuracy.
The representation of powered-on conditions in the numerical simulations was obtained by specifying boundary conditions found from thermodynamic cycle analysis at the engine boundaries in the computational domain. The fan face was modelled as a pressure outlet, with the floating static pressure adjusted to match the inlet mass flow rate. The fan and core outlet sections were modelled as a pressure inlet condition, with the stagnation temperature and pressure specified. The balance of mass fluxes through these boundaries was enforced within the calculation procedure by matching the inlet mass flow to the nozzle discharged mass flow.
2.3. Thrust–Drag Bookkeeping
Propulsive forces acting on the vehicle were separated into thrust and drag contributions in order to analyse the propulsive effect, which is a typical approach [28]. The methodology is consistent with previously published papers by these authors. The definition of force components acting on different parts is provided in Figure 2. By summing the drag () and thrust () terms, different force metrics can be formed. The following quantities are considered, all expressed as the dot product of the force vector along a chosen direction parallel to the undisturbed velocity:
where is the gauge stream force. The Gross Propulsive Thrust (GPT) (Equation (1)) represents the gross thrust generated by the engine, accounting for the forces acting on the exhaust surfaces. The net thrust (Equation (2)) is obtained by summing the ram drag . The Net Propulsive Thrust (NPT) (Equation (3)) amounts to the net force acting on the nacelle delivered as propelling force to the vehicle, which is equivalent to diminished by the absolute nacelle drag (Equation (5)). The sum of the gauge stream forces on the engine boundaries is called the Intrinsic Net Thrust (INT) (Equation (4)), and derives from the specified thermodynamic status obtained from cycle analysis. The total drag (Equation (6)) is provided by the sum of the airframe drag on the wing and fuselage, with and . Finally, the Net Vehicle Thrust (NVT) (Equation (7)) is the net force acting on the vehicle along the direction parallel to the flight velocity, provided by the sum of total drag and net propulsive thrust. When positive, it indicates a drag excess that decreases the vehicle speed over time, with the converse being the case for a negative thrust excess, accelerating the aircraft.
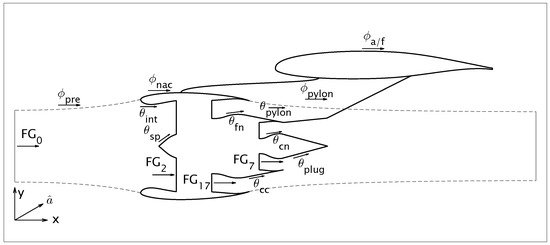
Figure 2.
Forces acting on the nacelle and airframe for thrust–drag bookkeeping.
2.4. Mission Point Evaluation
Having established the forces acting on the vehicle, the evaluation of a generic mission point using a CFD model is now discussed. The motion of an aircraft is described by the equation
where V is the flight velocity, is W the aircraft weight, g is the gravitational acceleration, T and D are the thrust and drag, respectively, and is the glide angle from the horizontal direction. Assuming a constant mass M over the time period , the equation reduces to
In steady-state CFD simulations, flight conditions are supposed to be constant, which would require a zero net force on the right-hand side for dynamic translational equilibrium to be achieved; otherwise, the calculation of the propulsive forces is biased by the presence of a thrust excess or defect, which in practice results in a deviation from the prescribed boundary conditions. In [29], a method of obtaining a dynamic equilibrium in a steady CFD simulation was presented, and was employed in [16] to compare the present reference nacelle with an optimised version. Here, the procedure is extended to the integration of the aircraft mission over the cruise segment for fuel consumption evaluation. This method, however, is generic, and can be applied to other mission legs as well. Here, it is reviewed and illustrated in the flowchart shown in Figure 3. As anticipated in the introduction, the rationale here is to couple a 0D thermodynamic cycle model used to design and represent the engine with high-fidelity force data from installed CFD simulations in order to obtain the real working conditions of the engine under a prescribed thrust level. In fact, the installed thrust, here meaning the net vehicle thrust from Section 2.3, depends on the sum of engine net thrust and airframe and nacelle drag from the complex interaction of the large podded propulsor and the wing flow. As such, a realistic estimation is only available with an installed CFD simulation. Having computed the net force acting on the vehicle, the proposed approach is to apply engine throttling to reach the resultant prescribed force value, which in the case of steady level flight (where ) and assuming constancy of mass over a time interval would be null ().
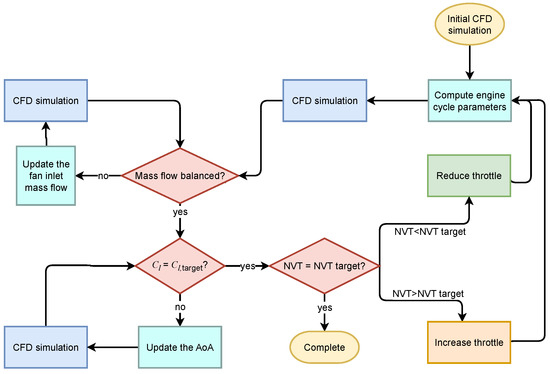
Figure 3.
Flowchart of the methodology applied to compute a given flight point with specified lift and net translational force by combining CFD and thermodynamic cycle analysis.
The flowchart shows the iterative procedure by which energy input through fuel mass flow, i.e., engine throttling, is changed in the thermodynamic model. Thus, the CFD boundary conditions are iterated according to the new thermodynamic state until dynamic equilibrium is reached. In this way, control of the mass flow conservation from the fan inlet to the nozzle exhaust is explicitly set. Note that the assumed duct losses in the thermodynamic cycle are consistent with CFD values. Moreover, the angle of attack is updated to match the target .
In this paper, the methodology was applied over four equal time segments starting from the ADP condition, where a constant speed was supposed to hold. Therefore, the aircraft lift was varied according to the fuel burnt in the flight segment, as follows:
where the fuel flow is provided by the thermodynamic cycle model; the total burnt fuel is the sum of the segment consumed fuel, .
3. Results
3.1. Flow Characterisation
The first part of the analysis was devoted to characterising the flow field at cruise over a range of incidence in order to understand the transonic aerodynamics resulting from engine/wing interference and the corresponding variation of lift, drag, and thrust forces.
The phenomenology of the interaction between a podded engine and the wing has been described qualitatively and quantitatively in several works based on experimental measurements or CFD analyses [17]. With reference to UHBPR turbofans, the main effect of engine/airframe coupling has been shown to occur in the wing lower side due to jet/surface interaction and flow channelling between the nacelle, pylon, and wing [30]. However, the effect of angle of attack variation at highly subsonic cruise speed is less well documented. This regime has been investigated primarily for wing buffeting with no nacelle or a throughflow nacelle [31,32]. Here, while not capturing any unsteady phenomena, we focus on the steady flow features, in particular those arising nearby the powered-on engine.
The variation of the wing pressure coefficient at different span sections with the angle of attack is illustrated in Figure 4. Case corresponds to a wing equal to the nominal cruise condition. On the suction surface, a normal shock wave is normally present at high subsonic cruise; it originates on the wing root and looses strength as the wing tip is approached. The effect of an increased angle of attack can be seen as a progressive shift in the wave location towards the trailing edge in the two sections surrounding the engine, along with an increase of the pressure jump, particularly in the outboard section. Farther from the nacelle, midway between it and the wing tip (see Figure 4c), the pressure remains flat past the leading edge peak. The effect of the incidence increase is an anticipation of the pressure recovery location, which happens more smoothly at .
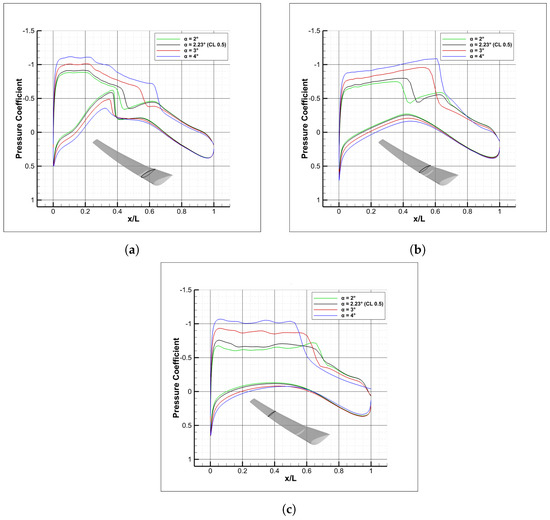
Figure 4.
Wing pressure coefficient distribution at different span locations: (a) engine inboard., (b) engine outboard, and (c) wing outboard.
On the lower side, the general behaviour is an enlarged pressure recovery; there is a noticeable difference in the inboard section close to the engine, where a strong shock can be appreciated in Figure 4a. This is the result of nacelle–wing interaction producing a flow discontinuity that detaches from the pylon. Increasing the incidence attenuates the phenomenon by decreasing the diffusion in the pressure side, up to a point where a mild shock wave will be triggered, and eventually no shock wave at all.
A better analysis of the shock pattern near the engine region can be carried out with the help of the numerical Schlieren technique, showing the magnitude of the density gradient in three planes normal to the wing span (straddling the symmetry plane of the nacelle), as reported in Figure 5. On the inboard side, the first row of the figure highlights the position of the shock waves on the wing suction surface as well as in the channel between the wing lower surface and the fan stream boundary. In this area, a strong normal shock that penetrates into the jet is formed. As the incidence is increased, it moves slightly upstream and loses strength; the change in the nacelle flow field with the incidence is less evident in the other planes. The wing shock wave in the upper wall is displaced downstream, as already observed, whereas on the nacelle cowl the discontinuity in the forebody flow remains almost unchanged.
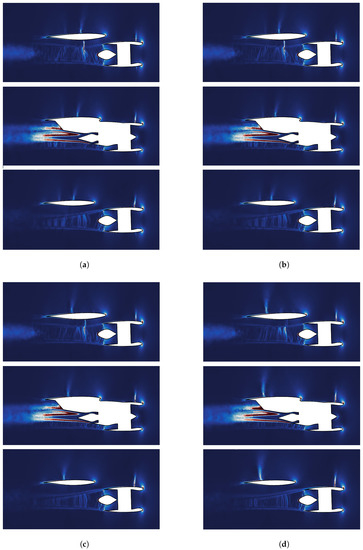
Figure 5.
Shock wave visualisation at different spanwise planes near the engine at increasing angle of attack by means of density gradient contours. From top to bottom: inboard, nacelle symmetry plane, outboard. (a) ; (b) ; (c) ; (d) .
The flow field past the nacelle cowl is analysed in Figure 6 in terms of the pressure coefficient distribution. On both sides, the strong suction peak is terminated by the already observed shock wave. However, on the inboard side the shock position and the minimum pressure do not change, whereas the post-shock flow exhibits a reducing decompression as the incidence grows. On the contrary, the outboard flow has an increasing suction peak and a stronger shock, around at and shifting downstream at larger incidences. Overall, the nacelle pressure distribution results are considerably less sensitive to the incidence change in the simulated regime as compared to the wing flow shown in Figure 4.
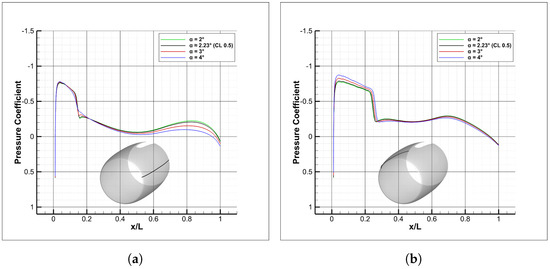
Figure 6.
Pressure coefficient distribution on inboard and outboard nacelle external cowl at increasing incidence: (a) inboard and (b) outboard.
The inboard side remains more critical because of the appearance of the shock wave under the wing, which impinges upon the pylon. This can be clearly appreciated in Figure 7, showing contours and its variation from the case, i.e., . It can be noted that the shock structure is quite articulated, with a branch detaching from the core cowl trailing edge and the foot well inside the bypass stream. The pressure distribution on the core cowl itself is discontinuous because of the shock/expansion sequence in the under-expanded choked fan nozzle, thereby impacting the pressure force exerted there.
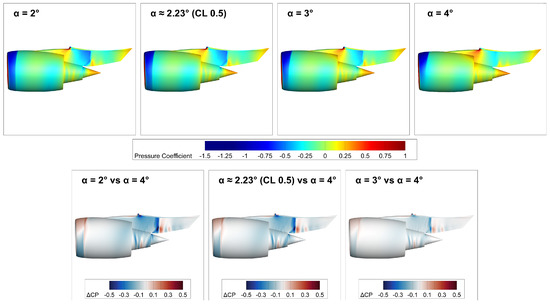
Figure 7.
Pressure coefficient distribution on the nacelle and pylon on the inboard side.
The relation between the angle of attack and the propulsive forces is summarised in Figure 8. The first chart in Figure 8a reports the gross thrust GPT, net thrust NPT, and net force acting on the whole vehicle NVT, all of which are normalised by a reference net thrust at the ADP. It is interesting to note how both the engine gross thrust and the net propulsive thrust delivered to the wing body increase with the incidence. This effect is caused by the installation, and is owing to the increased backpressure on the cowl exhaust and afterbody under the wing. The pressure growth on the nacelle, core cowl, and plug can be appreciated in Figure 6a and Figure 7. In the latter, is negative towards the trailing edge, indicating a lower pressure as the angle of attack decreases. Such behaviour must be contrasted with the drag trend reported in Figure 8b, indicating that while exhibits a similar tendency, the airframe and the total drag grow with as expected. In fact, NVT, being the net balance between the and NPT, changes from a slightly negative value (thrust excess) at to a positive one (drag excess).
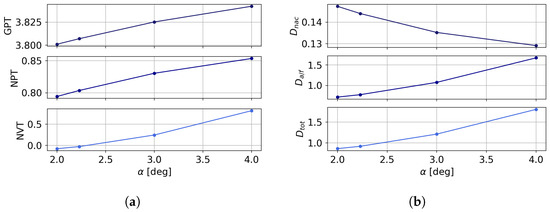
Figure 8.
Variation of thrust and drag forces with the angle of attack. All data are normalised by a reference net thrust. (a) Thrust; (b) drag.
3.2. Integration of the Mission Profile along the Cruise
The flow field analysed in the previous section presents several interaction phenomena that trigger a complex pattern of shock waves in the exhaust region, which is in addition to those normally found at transonic conditions past a suction peak on the leading edge. The shear stress and pressure distribution arising here have a direct impact on the propulsive forces, generating a penalty on the thrust delivered by the propulsor as well as in terms of the nacelle and airframe drag as a consequence of non-linear interference effects. Starting from this consideration, the procedure presented in Section 2.4 is applied here to integrate the mission profile along a cruise segment coincident with the ADP from the start of cruise condition. Because sub-iterations are needed at each step of the methodology in order to calculate the streamwise dynamic balance of the net vehicle force, to reduce the overall computational time we limited the integration to four Operating Points (OP) along the cruise equispaced by 60 min of flight.
The results of the flight segment analysis are summarised in Table 2. For each point, the table indicates the angle of attack corresponding to the target lift coefficient, drag coefficient variation , and several thrust definitions. Note that the thrust quantities have all been normalised by the net thrust value at point 1.
Table 2.
Summary of evaluated mission points along the cruise segment. Thrust quantities are normalised by at OP1.
The variation of the reported parameters can be better appreciated in Figure 9. Figure 9a illustrates the two contributions to the aircraft drag from the nacelle () and the airframe (). With the cruise speed kept constant, , is the ratio between the far upstream capture area and the highlighted area. Because the inlet mass flow is continuously decreased, the spillage drag grows because the pre-entry component is not completely balanced by the lip thrust generated by the leading edge suction. Moreover, as illustrated in Figure 8b, tends to slightly increase as lowers. Conversely, the airframe drag is reduced almost linearly with considering the small involved incidence change. The overall variation of the drag coefficient reaches −47.5 drag counts (1 dc = 0.0001).
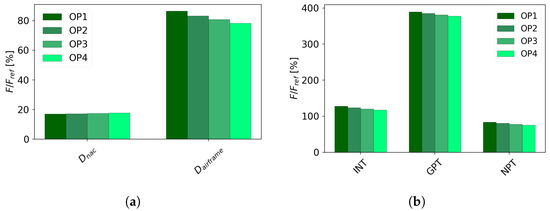
Figure 9.
Variation of propulsive forces along the integrated cruise segment. All data are normalised by the net force at OP1. (a) Drag; (b) thrust.
Looking instead at the thrust components, their trend is uniform and monotonic; lowering the engine throttle diminishes all thrust terms. The overall variation of net thrust is −7.5%, as can be seen from Table 2, while the net propulsive thrust delivered by the engine, which additionally accounts for the external cowl force, is reduced by 8.5% relative to the reference net thrust at OP1.
Figure 10 illustrates the absolute variation of force components acting on the nacelle surfaces relative to the OP1 value and normalised with respect to . The nacelle cowl force is negative because of the lip suction, and is further reduced as the inlet mass flow dims, adding more thrust. However, as already noted, this term is balanced by the augmented pre-entry drag . The intake force has a very limited change, at less than 0.1% of . Exhaust wall forces exhibit a larger variability. While the internal fan nozzle force provides an almost 1% larger thrust contribution, on the core cowl the force tends towards higher drag. That region has been shown in Section 3.1 to be influenced by the shock/expansion pattern in the bypass stream and the interaction with the inboard shock wave attached to the wing and pylon. The core nozzle duct force trend resembles that of . Lastly, is increased slightly, by 0.25% in total. This exposed surface is sensitive to the core flow and to the external pressure under the wing, which varies with the angle of attack.
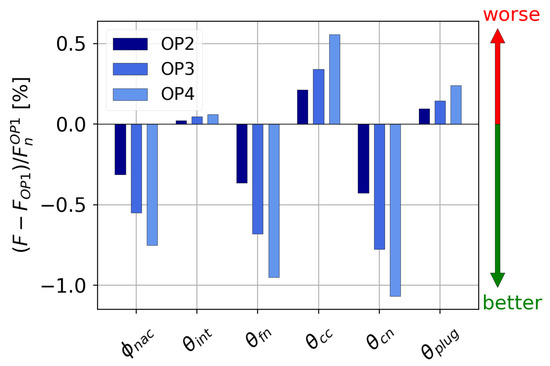
Figure 10.
Absolute percentage variation from OP1 of forces acting on the nacelle walls, normalised to .
As a final outcome of the procedure, the relation between the normalised net force and the installed TSFC is depicted by the chart in Figure 11. With decreasing engine throttle and incidence, the TSFC from the start to the end of cruise is reduced by 0.04 [g/kNs]. According to the proposed algorithm, this value, computed using the thermodynamic cycle model, is derived by the throttle setting that guarantees the contemporary achievement of the target NVT, the target lift coefficient, and the mass flux balance through the engine boundaries. As such, it incorporates the installation effects, at the same time altering the drag, thrust, and lift; thus, it represents a more accurate estimate of the amount of fuel needed to sustain the examined flight condition.
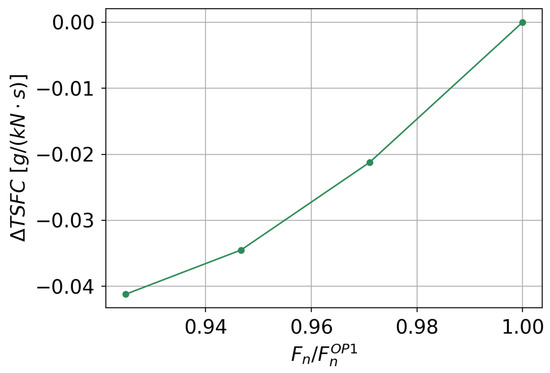
Figure 11.
Relation between net force and TSFC change along the cruise segment.
4. Conclusions
The installed performance of a reference transport aircraft (the NASA CRM) with a powered UHBPR turbofan has been investigated at highly subsonic cruise, matching a thermodynamic cycle model with detailed CFD simulations. The initial assessment of small lift variations from the nominal flight highlighted the strong interactional effect caused by the engine/airframe coupling, resulting in flow displacement in the wing pressure side and shock discontinuities in the pylon inboard side. The sensitivity of surface pressure to the angle of attack was larger in the wing than in the nacelle, where the increased pressure in the cowl afterbody and exhaust surfaces generated a net force growth with . However, this effect was balanced by the augmented airframe drag, leading to a shift in the net vehicle force towards an excess of drag.
The flow characterisation results have been used to explain the outcome of the simulated cruise segment, where each of the four operating points were computed according to the proposed procedure, achieving dynamic balance along the lift and drag directions. Because of the lower lift coefficient as fuel is burnt, airframe drag is reduced despite the limited growth of nacelle drag favoured by spillage. Thrust forces, on the contrary, were all reduced in absolute value, as the required propelling force followed the drag trend, with their sum assumed to be zero in the quasi-steady flight discretisation.
Overall, the proposed approach is able to compute the installed fuel consumption and associated fuel burn by modelling engine–airframe interaction through CFD in a more realistic way compared to semi-empirical models, in which the drag of single components is superimposed linearly. As such, it is expected to offer increased accuracy in capturing the installation penalties of integrated powerplants. Clearly, the increased fidelity comes at the cost of detailed CFD simulations; thus, the proposed method is suitable as a post-design verification or as an off-design assessment. In fact, it might be applied to integrate the flight trajectory in mission legs different from cruise as well, where fewer analytical models are available to estimate the installation penalties.
Author Contributions
Conceptualization, E.B., D.B. and A.M.; Methodology, D.B.; Software, D.B. and A.M.; Validation, D.B. and A.M.; Formal analysis, A.M. and D.B.; Investigation, F.P. and E.D.L.; Resources, E.B.; Data curation, A.M.; Writing—original draft preparation, A.M.; Writing—review and editing, E.B.; Visualization, A.M. and D.B.; Supervision, E.B.; Project administration, E.B.; Funding acquisition, E.B. All authors have read and agreed to the published version of the manuscript.
Funding
This research was conducted within the Clean Sky 2 project IVANHOE (InstalledadVAnced Nacelle uHbr Optimisation and Evaluation) funded by the European Union’s Horizon2020 research and innovation programme under grant agreement number 863415.
Data Availability Statement
Not applicable.
Acknowledgments
The authors acknowledge University of Padova Strategic Research Infrastructure Grant 2017: “CAPRI: Calcolo ad Alte Prestazioni per la Ricerca e l’Innovazione” for providing computing infrastructure for the study.
Conflicts of Interest
The authors declare no conflict of interest.
Nomenclature
The following symbols and acronyms are used in this manuscript:
| airframe | |
| CFD | Computational Fluid Dynamics |
| Drag coefficient | |
| Lift coefficient | |
| Pressure coefficient | |
| core cowl | |
| core nozzle | |
| Gauge stream force | |
| Net Force | |
| fan nozzle | |
| g | Gravitational acceleration |
| Gross Propulsive Thrust | |
| Intrinsic Net Thrust | |
| intake | |
| Mass flow rate | |
| Fuel mass | |
| M | Mach number |
| Net Propulsive Thrust | |
| Net Vehicle Thrust | |
| nacelle | |
| p | Pressure |
| OP | Operating Point |
| Surface aerodynamic force | |
| pre-entry | |
| Density | |
| RANS | Reynolds-Averaged Navier–Stokes |
| spinner | |
| TSFC | Thrust Specific Fuel Consumption |
| V | Velocity |
| W | Weight |
References
- NLR; SEO Amsterdam Economics. Destination 2050—A Route to Net Zero European Aviation; Report NLR-CR-2020-510; NLR—Royal Netherlands Aerospace Centre: Amsterdam, The Netherlands, 2021. [Google Scholar]
- Epstein, A.H. Aeropropulsion for Commercial Aviation in the Twenty-First Century and Research Directions Needed. AIAA J. 2014, 52, 901–911. [Google Scholar] [CrossRef]
- Borradaile, J. Towards the optimum ducted UHBR engine. In Proceedings of the 24th Joint Propulsion Conference, Boston, MA, USA, 11–13 July 1988. [Google Scholar] [CrossRef]
- Zimbrick, R.A.; Colehour, J.L. Investigation of very high bypass ratio engines for subsonic transports. J. Propuls. Power 1990, 6, 490–496. [Google Scholar] [CrossRef]
- Peacock, N.J.; Sadler, J.H. Advanced propulsion systems for large subsonic transports. J. Propuls. Power 1992, 8, 703–708. [Google Scholar] [CrossRef]
- Hughes, C.E. NASA Collaborative Research on the Ultra High Bypass Engine Cycle and Potential Benefits for Noise, Performance, and Emissions. In Proceedings of the ISABE 2009, Indianapolis, IN, USA, 29 September–1 October 2009. [Google Scholar]
- Daggett, D.L.; Brown, S.T.; Kawai, R.T. Ultra-Efficient Engine Diameter Study; Technical Report NASA/CR-2003-212309; NASA: Washington, DC, USA, 2003. [Google Scholar]
- Guynn, M.; Berton, J.; Fisher, K.; Haller, W.; Tong, M.; Thurman, D. Analysis of Turbofan Design Options for an Advanced Single-Aisle Transport Aircraft. In Proceedings of the 9th AIAA Aviation Technology, Integration, and Operations Conference (ATIO), Hilton Head, SC, USA, 21–23 September 2009. [Google Scholar] [CrossRef]
- Berton, J.J.; Guynn, M.D. Multi-Objective Optimization of a Turbofan for an Advanced, Single-Aisle Transport. J. Aircr. 2011, 48, 1795–1805. [Google Scholar] [CrossRef]
- Guynn, M.D.; Berton, J.J.; Fisher, K.L.; Haller, W.J.; Tong, M.T.; Thurman, D.R. Refined Exploration of Turbofan Design Options for an Advanced Single-Aisle Transport; Technical Report NASA/TM–2011-216883; NASA: Hampton, VA, USA, 2011. [Google Scholar]
- Alexiou, A.; Aretakis, N.; Roumeliotis, I.; Kolias, I.; Mathioudakis, K. Performance modelling of an ultra-high bypass ratio geared turbofan. In Proceedings of the ISABE 2017, Manchester, UK, 3–8 September 2017. [Google Scholar]
- Larsson, L.; Grönstedt, T.; Kyprianidis, K.G. Conceptual Design and Mission Analysis for a Geared Turbofan and an Open Rotor Configuration. In Proceedings of the ASME 2011 Turbo Expo: Turbine Technical Conference and Exposition, Vancouver, BC, USA, 6–10 June 2011. [Google Scholar] [CrossRef]
- Thoma, E.M.; Grönstedt, T.; Zhao, X. Quantifying the Environmental Design Trades for a State-of-the-Art Turbofan Engine. Aerospace 2020, 7, 148. [Google Scholar] [CrossRef]
- ESDU. Drag of Axisymmetric Cowls at Zero Incidence for Subsonic Mach Numbers; Technical Report 81024; ESDU International: London, UK, 1981. [Google Scholar]
- Bijewitz, J.; Seitz, A.; Hornung, M.; Luftfhart Bauhaus, E. Architectural Comparison of Advanced Ultra-High Bypass Ratio Turbofans for Medium to Long Range Application. In Proceedings of the Deutscher Luft-und Raumfhahrtkongress DLR, Augsburg, Germany, 16–18 September 2014; p. 12. [Google Scholar]
- Magrini, A.; Buosi, D.; Benini, E. Analysis of installation aerodynamics and comparison of optimised configuration of an ultra-high bypass ratio turbofan nacelle. Aerosp. Sci. Technol. 2022, 128, 107756. [Google Scholar] [CrossRef]
- Magrini, A.; Benini, E.; Yao, H.D.; Postma, J.; Sheaf, C. A review of installation effects of ultra-high bypass ratio engines. Prog. Aerosp. Sci. 2020, 119, 100680. [Google Scholar] [CrossRef]
- Vassberg, J.; Dehaan, M.; Rivers, M.; Wahls, R. Development of a Common Research Model for Applied CFD Validation Studies. In Proceedings of the 26th AIAA Applied Aerodynamics Conference, Honolulu, HI, USA, 18–21 August 2008. [Google Scholar] [CrossRef]
- Vassberg, J.; Tinoco, E.; Mani, M.; Rider, B.; Zickuhr, T.; Levy, D.; Brodersen, O.; Eisfeld, B.; Crippa, S.; Wahls, R.; et al. Summary of the Fourth AIAA CFD Drag Prediction Workshop. In Proceedings of the 28th AIAA Applied Aerodynamics Conference, Chicago, IL, USA, 28 June–1 July 2010. [Google Scholar] [CrossRef]
- Levy, D.W.; Laflin, K.R.; Tinoco, E.N.; Vassberg, J.C.; Mani, M.; Rider, B.; Rumsey, C.L.; Wahls, R.A.; Morrison, J.H.; Brodersen, O.P.; et al. Summary of Data from the Fifth Computational Fluid Dynamics Drag Prediction Workshop. J. Aircr. 2014, 51, 1194–1213. [Google Scholar] [CrossRef]
- Tinoco, E.N.; Brodersen, O.P.; Keye, S.; Laflin, K.R.; Feltrop, E.; Vassberg, J.C.; Mani, M.; Rider, B.; Wahls, R.A.; Morrison, J.H.; et al. Summary Data from the Sixth AIAA CFD Drag Prediction Workshop: CRM Cases. J. Aircr. 2018, 55, 1352–1379. [Google Scholar] [CrossRef]
- Kurzke, J.; Halliwell, I. Propulsion and Power; Springer International Publishing: Cham, Switzerland, 2018. [Google Scholar] [CrossRef]
- Magrini, A.; Buosi, D.; Benini, E.; Sheaf, C. Ultra-high bypass nacelle geometry design space exploration. In Proceedings of the AIAA Scitech 2021 Forum, Virtual, 11–15 & 19–21 January 2021. [Google Scholar] [CrossRef]
- ANSYS. ANSYS Fluent 19.2 Theory Guide; ANSYS, Inc.: Canonsburg, PA, USA, 2018. [Google Scholar]
- Mavriplis, D.J.; Vassberg, J.C.; Tinoco, E.N.; Mani, M.; Brodersen, O.P.; Eisfeld, B.; Wahls, R.A.; Morrison, J.H.; Zickuhr, T.; Levy, D.; et al. Grid Quality and Resolution Issues from the Drag Prediction Workshop Series. J. Aircr. 2009, 46, 935–950. [Google Scholar] [CrossRef]
- Vassberg, J. A Unified Baseline Grid about the Common Research Model Wing/Body for the Fifth AIAA CFD Drag Prediction Workshop (Invited). In Proceedings of the 29th AIAA Applied Aerodynamics Conference, Honolulu, HI, USA, 27–30 June 2011. [Google Scholar] [CrossRef]
- Magrini, A.; Buosi, D.; Benini, E. Maximisation of installed net resulting force through multi-level optimisation of an ultra-high bypass ratio engine nacelle. Aerosp. Sci. Technol. 2021, 119, 107169. [Google Scholar] [CrossRef]
- Ministry-Industry Drag Analysis Panel (MIDAP) Study Group. Guide to In-Flight Thrust Measurement of Turbojets and Fan Engines; AGARD: Neuilly-sur-Seine, France, 1979. [Google Scholar]
- Buosi, D.; Magrini, A.; Benini, E. Installed performance of ultra-high bypass turbofans: Estimation of power saving in optimised configurations at steady flight. In Proceedings of the AIAA Scitech 2022 Forum, San Diego, CA, USA, 3–7 January 2022. [Google Scholar] [CrossRef]
- Magrini, A.; Benini, E. Aeropropulsive assessment of engine installation at cruise for UHBPR turbofan with body force fan modelling. Aerosp. Sci. Technol. 2023, 132, 108048. [Google Scholar] [CrossRef]
- Balakrishna, S.; Acheson, M. Analysis of NASA Common Research Model Dynamic Data. In Proceedings of the 49th AIAA Aerospace Sciences Meeting including the New Horizons Forum and Aerospace Exposition, Orlando, FL, USA, 4–7 January 2011. [Google Scholar] [CrossRef]
- Sebastian, S.; Ralf, R. Experimental assessment of wing lower surface buffet effects induced by the installation of a UHBR nacelle. CEAS Aeronaut. J. 2022. [Google Scholar] [CrossRef]


Disclaimer/Publisher’s Note: The statements, opinions and data contained in all publications are solely those of the individual author(s) and contributor(s) and not of MDPI and/or the editor(s). MDPI and/or the editor(s) disclaim responsibility for any injury to people or property resulting from any ideas, methods, instructions or products referred to in the content. |
© 2023 by the authors. Licensee MDPI, Basel, Switzerland. This article is an open access article distributed under the terms and conditions of the Creative Commons Attribution (CC BY) license (https://creativecommons.org/licenses/by/4.0/).