Article

Development of a Photovoltaic-Based Module for Harvesting Solar Energy from Pavement: A Lab and Field Assessment

1
School of Civil and Environmental Engineering and Construction Management, University of Texas at San Antonio, San Antonio, TX 78249, USA
2
Zachry Department of Civil and Environmental Engineering, Texas A & M University, College Station, TX 77840, USA
3
Texas Department of Transportation, Houston District, Houston, TX 77007, USA
*
Authors to whom correspondence should be addressed.
Energies 2023, 16(8), 3338; https://doi.org/10.3390/en16083338
Submission received: 15 March 2023 / Revised: 2 April 2023 / Accepted: 4 April 2023 / Published: 9 April 2023
(This article belongs to the Section A: Sustainable Energy)

Abstract

:
The concurrent worldwide energy crisis has become a strong incentive for researchers, governments, and industry professionals to focus on sustainable energy solutions. Consequently, pavement photovoltaic energy harvesting technologies, as one of the most common sustainable energy solutions, have recently seen a significant improvement, especially in the new innovative designs of pavement solar panels. In this study, an innovative design for a prototype energy harvesting system was proposed based on thin-film photovoltaic solar panels. In addition, the feasibility of utilizing the generated power of the proposed system to illuminate a pedestrian crosswalk to enhance the safety of an at-grade intersection was also analyzed. The designed prototype consists of a thin-film solar panel, a transparent cover to protect the solar panel, and a wooden frame to support the panel and distribute the load. Different materials for the transparent covering plates were investigated, including polycarbonate with varying thicknesses, textured GlassGrit, and textured float glass with corundum skid-resistant coating on the surface. Finite element analysis was also conducted to analyze the behavior of solar panel-incorporated layered asphalt pavement subjected to dynamic wheel loading. The results showed that the suggested model could sustain the structural loads of a moving wheel without failure. Experimental results of the study showed that considering the seven hours of operation on a typical sunny day, the proposed system could generate approximately 699 Watt-hour of power during 7 h of operation (9 a.m.–4 p.m.) from the 304.8 mm (12 inches) × 304.8 mm (12 inches) pavement solar panel.

1. Introduction

Exploring any alternative sources of renewable energy creates a solution for the concurrent energy crisis and environmental degradation due to the burning of fossil fuels. Among various renewable sources, solar energy is considered the most abundant and widely distributed energy source. Roadway surfaces absorb, on average, 40 KJ/m2 of radiation energy per day during the summertime [1,2]. Additionally, approximately 15–21% of vehicle engines’ power is transmitted to the vehicles’ wheels and to the pavement [3]. Based on traffic loads and expected solar radiation on roadways, a wide range of applications of piezoelectric technology [4], thermoelectric technology [5,6], and photoelectric systems [7,8] could be integrated into the roadway to produce a considerable amount of renewable energy. Current thermal energy harvesting techniques can be categorized into three types: solar thermal [9,10], thermoelectric system [11,12], and photovoltaic system [13]. The thermal gradient systems use thermoelectric generators (TEG), which are powered by the temperature differences between the top and bottom layers of the pavement [14,15], whereas the asphalt solar thermal systems employ asphalt solar collectors which convert solar energy into heat through the fluid inside the pipelines. Among these technologies, solar photovoltaic (PV) conversion is proven to be one of the most efficient solutions, with a power density of approximately 1000 KW per square meter of a typical solar panel [16,17,18]. However, photovoltaic solar panels require large landscape and solar exposure for power production with higher efficiency. Due to the high cost and scarcity of suitable land in urban areas, photovoltaic solar panels can only be installed in remote locales resulting in significant power loss during transmission. Nevertheless, roadways, parking lots, and footpaths in urban areas acquire great portions of land, and hence, they can be utilized as platforms for harvesting solar energy [12,18]. The goal of this study is to build a prototype of a pavement photovoltaic energy harvesting module, that can be efficiently integrated into pavements, and utilize its generated power in lighting a pedestrian crosswalk to enhance pedestrian safety.
Recently, several pilot demonstration projects of solar roads and solar pavements are still in the development stage encountering challenges. The absence of anti-slip coating to maintain surface traction, difficulty in installation, and dilapidation due to environmental exposure are examples of these challenges [19]. In 2013, the Netherlands built the world’s first solar bike path paved with glass-coated solar panels that can generate 70 kWh per square meter [20]. Onyx Solar’s non-slip PV pavement [21] is an example of such innovative technology. In 2016, Colas debuted a new technology in France where solar cells are coated with glass aggregates and polymers and directly glued onto the surface [13]. Another type of solar panel technology, which was intended to power charging stations for electric vehicles, was built of transparent concrete on top, solar panels, and insulating materials beneath [22].
In recent years, the prospects of harvesting energy from pavement have gained researchers’ attention and various technologies have also been examined [23]. The primary photovoltaic system consists of three main layers: the top semi-transparent layer formed of tempered glass, a polymer layer, and a layer of glass aggregates bonded together with resin (i.e., epoxy, polyurethane, etc.) [10].
Researchers from the Korea Institute of Construction Technology (KICT), investigated the feasibility of incorporating PV cells in pavement [24]. One of their study findings was that the current thin-film PV cells are not suitable to be embedded into pavement owing to premature corrosion and wear from mechanical and environmental impacts. In addition, one of the major challenges of utilizing thin-film panels is the design of a suitable covering material with a high load-bearing capacity to sustain traffic loading while providing sufficient traction for vehicles and transmittance for solar radiation. Ma et al. [19] fabricated a photovoltaic floor tile where the solar cells were sandwiched between anti-slip tempered glass and rear support tempered glass and enclosed by EVA (Ethylene Vinyl Acetate)/PVB (Polyvinyl Butyral). The efficiency of the module was 15% and compressive strength 15–16 MPa. Northmore et al. conducted a comprehensive study on pavement solar panels incorporating material design, flexural response, and interaction with pavements [25]. In their study, they used laminated, tempered, and textured glass to protect the PV cells, and the fatigue limit of the proposed model was 16 MPa [26]. The authors also conducted finite element (FE) analysis to analyze the solar panel performance under wheel load, and demonstrated that the proposed model was structurally sound for pavement application [27]. From the aforementioned literature recommendations, limited types of materials can be used as a transparent covering for solar modules. Acrylic, polycarbonate, and tempered glass are the most common materials that can be used for such an application [25]. These materials were investigated in this study to optimize the design and provide recommendations for the materials that can be used as a transparent cover.
In this study, a PV solar module design was proposed, and laboratory experiments and field assessments were carried out to investigate the feasibility of the proposed module for use in low-volume roadways and parking lots. To evaluate the proposed system, this study focused on analyzing the effects of various environmental factors, including illuminance, irradiance, temperature, weather conditions, and the effect of moving shades, due to fast-moving vehicles, on the energy output of the proposed system. This study is divided into several subtopics. First, a brief background of the research context and motivation of the research is provided; next, the study presents a methodology including the conceptual framework of the module; the following section expands on the finite element analysis, material properties, and boundary conditions; after that, the results section includes the percentage transmittance of the covering materials, the power production efficiency of the different solar panels, and the performance of the panels under wheel loading. The results section also includes the stresses and deflection of the solar module under moving load through dynamic FE analysis simulation and compares the performance with traditional asphalt pavement; lastly, an economic analysis and comparison with other solar panel prototypes are explored, followed by the conclusions of the study. The results of these assessments under varying climatic conditions suggest that the proposed module can produce enough energy for use in an illuminated pedestrian system. However, it requires further investigation to assess the feasibility of integrating into the pavement structure for practical applications.

2. Motivation

In 2009, Brusaw et al. [28] first proposed a solar pavement with incorporated PV modules, which drew much attention to PV pavement research [29]. However, the mechanical performance of the proposed solar module was not further studied. Table 1 shows a comparison of the recent studies based on the three-layer design concept of the solar panel.
Based on previous research, several limitations should be addressed in future studies related to PV solar panels:
  • There are limited studies to assess the mechanical performance of the PV module which is required from the design perspective.
  • Limited research has investigated the performance of polycarbonate and acrylic as the top semi-transparent cover.
  • The effects of operating temperature on PV module performance should be investigated.
This study aimed to fill this knowledge gap by investigating several different perspectives:
  • The proposed module employed a polycarbonate sample of varying thicknesses as the top cover. The polycarbonate outperforms tempered glass in terms of both impact resistance and transmittance.
  • The solar modules were tested under wheel load for the parking lot application (light traffic conditions).
  • The finite element simulation model was developed to analyze the performance of the proposed module integrated into the pavement and was compared with the typical pavement model. The application of dynamic single-wheel load was a novel aspect of this study that had not been explored before.
  • This film solar panel was more flexible and ductile compared to a crystalline solar cell. Very few researchers have examined thin film solar cell efficiency.

3. Study Methodology

This section covers the design concepts of the proposed solar module, the fabrication procedure, the material selection details, and the testing procedures performed to investigate the feasibility of the proposed module.

3.1. Solar Module Design

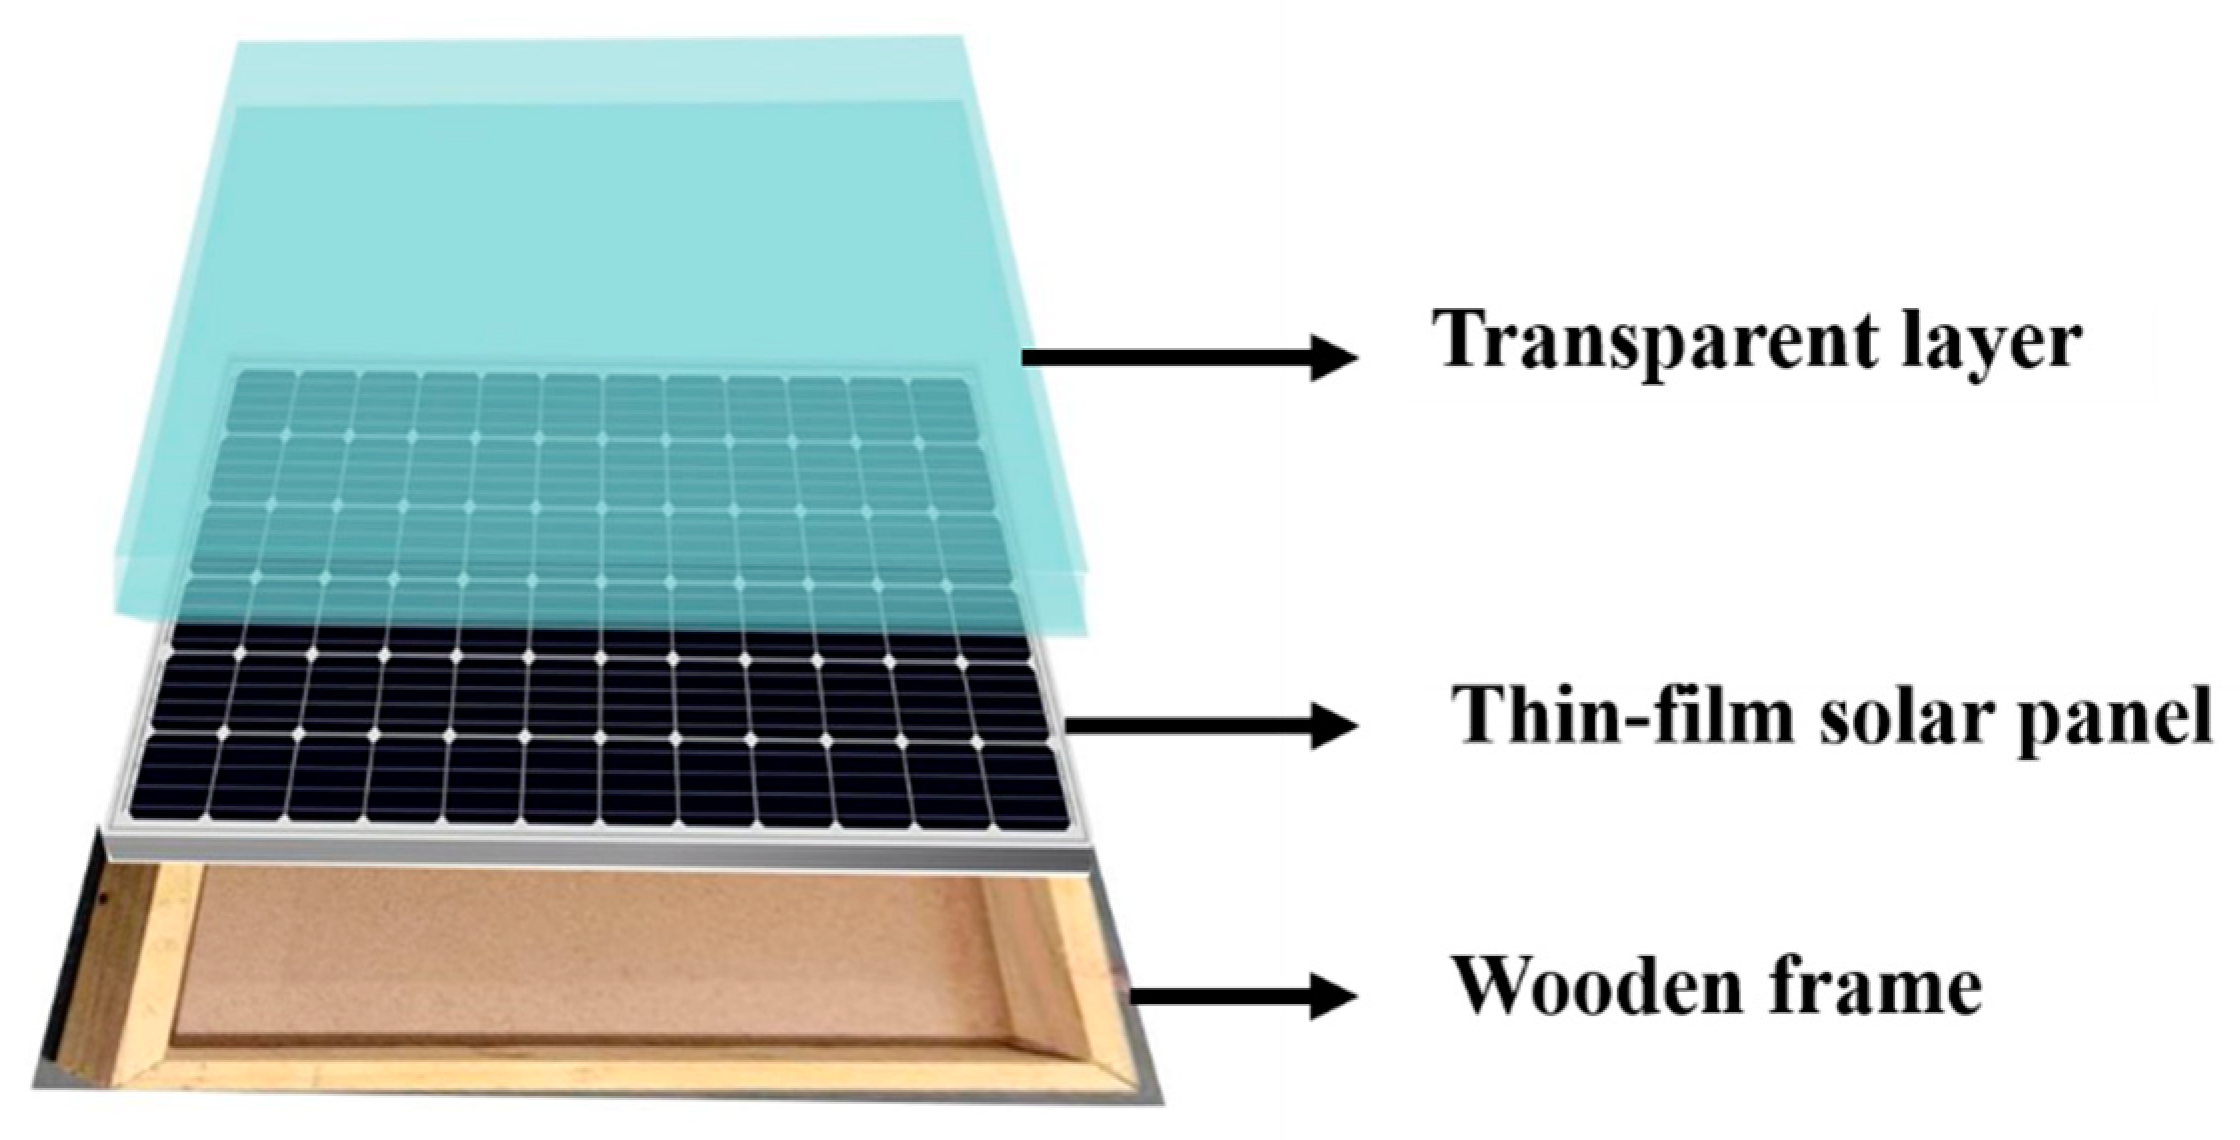
The prototype of the proposed solar panel module consists of three basic layers, namely: (a) the top covering layer, (b) the middle optical layer, and (c) the bottom supporting layer as shown in Figure 1. The top covering plate of the solar module was designed to provide three important aspects, namely: (a) transparency, to transmit sunlight to the photovoltaic layer, (b) rigidity, to withstand the applied traffic loads, and (c) friction, to provide sufficient traction and skid resistance for vehicles. The materials investigated for this layer were limited to polycarbonate and textured tempered glass to satisfy the aforementioned criteria.
The middle layer consists of a flexible thin-film solar cell commercially known as PT15-300, having the dimensions of 270 mm × 325 mm × 1.12 mm. The properties of this solar cell are provided in Table 2.
This layer can be considered the core of the solar module because it is responsible for generating power. The thin-film solar panel was selected over the traditional crystalline solar panels for four reasons. First, the thin-film solar panel performs better in hot weather, which makes it suitable for a wider range of geographic locations. The second advantage is its high flexibility compared to crystalline solar panels, which makes it capable of sustaining the deflections and the elastoplastic deformations induced by traffic loads. Third, the thin-film solar panels have a broader spectrum absorption range (250–1750 nm) compared to the traditional crystalline solar panels which are commonly limited (400–1000 nm) (i.e., the flexible panel spectrum includes more infrared and ultraviolet wavelengths) [34]. Fourth, thin film is a better performer in partial shading conditions and can have a wider range of effective working hours [35]. However, it was reported that the main disadvantage of the thin-film solar cell is its relatively faster degradation (i.e., shorter lifespan) compared to the traditional crystalline solar cell. Nevertheless, the overall merits, mentioned previously, of the thin-film solar panels outperform this demerit [36]. For these reasons, thin-film solar cells were assumed to be a more feasible choice for the proposed module in this study.
The base layer has two important functions. First, it was designed to provide adequate structural support to the above layers, and secondly, it separates the solar panel with its covering layer from the surrounding pavement layers. Several materials can be used for this layer, such as steel, aluminum, fiber-reinforced polymers (FRPs) [25], and wood. Due to cost feasibility, light weight, and easy installation, pine wood was selected over the other materials to fabricate the supporting frame of the solar module.

3.2. Module Fabrication

Figure 2 presents an overview of the fabrication process of the designed module. In addition, the following bullets summarize the fabrication procedure of the module:
  • First, the pine wood base was grooved according to the required thickness of polycarbonate samples and cut into 45° (Figure 2a–c). The pieces were fastened using wire nails to compile into a rectangular wooden frame (Figure 2d).
  • Tempered hardboard was placed on top of the stiffeners to prevent the sagging of the flexible solar cell (Figure 2e,f).
  • The thin-film solar panel and transparent covers were placed on top (Figure 2g). Figure 2h shows the assembled solar panel.

3.3. Material Selection

As previously mentioned, the bottom layer of the solar module was produced from pine wood to act as a supporting base for the solar module and isolate it from the ground. The middle layer consisted of a thin-film solar panel acting as the core of the module, at the same time, providing flexibility to withstand load-related deformations. On the other hand, for the covering layer, different materials were investigated (i.e., different modules) to optimize the design of the covering layer, which significantly influences the overall efficacy and power production of the solar module. The covering layer material controls the amount of sunlight that can be transmitted to the solar panel, and hence, affects the power generation efficacy. In addition, at the same time, the covering layer must provide sufficient traction and skid resistance, compared to the traditional pavement surface characteristics, to avoid any possible traffic disruptions that might be caused by the installation of the solar module on roads. Therefore, to optimize the design of the covering layer, while providing a sufficient structural capacity at a feasible cost, three different materials were investigated for the covering layer (namely: tempered glass, textured float glass, and polycarbonate). Details of these materials are provided in the following subsections.

3.3.1. Tempered Glass

The first material investigated for the covering layer was tempered glass. A panel with dimensions of 304.8 mm (12 inches) × 304.8 mm (12 inches) × 10 mm (0.40 inches) with a Glass Grit surface-commercially known as GlassGritTM [39] was used—see Figure 3a. The GlassGritTM was previously used for solar pedestrian walkways, and parking lots in North Idaho [40]. It is also important to note that the used glass samples were previously tested for skid resistance, in a recent research study by the University of Toledo, using the British Pendulum tester according to the ASTM E-303. The average British Pendulum Number (BPN) for the glass samples was 41.7.

3.3.2. Textured Float Glass

The second material investigated for the covering layer was a special type of corundum anti-slip low-carbon soda-lime float glass with a textured surface composed of molted corundum coating, as shown in Figure 3b. The glass panel dimensions were the same as the tempered glass sample [i.e., 304.8 mm (12 inches) × 304.80 mm × (12 inches) × 10 mm (0.40 inches)].

3.3.3. Polycarbonate

The polycarbonate samples used in this study were optical grade scratch-resistant polycarbonate—also known as hard-coated and scratch-resistant Lexan polycarbonate or safety glass [41]. The same dimensions as other materials were used for the polycarbonate samples [i.e., 304.8 mm (12 inches) × 304.8 mm (12 inches) × 10 mm (0.40 inches)]. However, it is also important to note that the polycarbonate material is approximately 250 times more impact resistant than standard glass, which makes the polycarbonate material an outperformer among the other materials in terms of impact resistance [42]. Moreover, the polycarbonate samples used were provided with a scratch-resistant coating with nano SiO2 sprayed on the surface to increase its life span and ensure efficient light transmission to the solar panel; see Figure 3c.

3.4. Testing Procedure

As previously stated, to assess the performance of the solar modules, both laboratory and field-testing procedures were performed. In the laboratory, the main objective of the testing protocol was to evaluate the percentage transmittance of each transparent cover to optimize the design of the top-covering plate. Therefore, a comparative performance evaluation was conducted based on the percentage transmittance of these different solar modules (i.e., different covering materials). Thereafter, the power output was tested in the field for these solar modules under different cloud conditions, ambient temperature, solar intensity, and solar irradiance. Solar irradiance and illuminance were measured in the testing procedure using a solar irradiance meter and a solar illuminance meter (HD 450), respectively. The modules with different covering materials were connected to a resistance box and a multichannel data logger, and the power output (P) was determined as a function of the known voltage (V) and resistance (R) as P = V 2 / R .

3.5. Percentage Transmittance of the Covering Materials

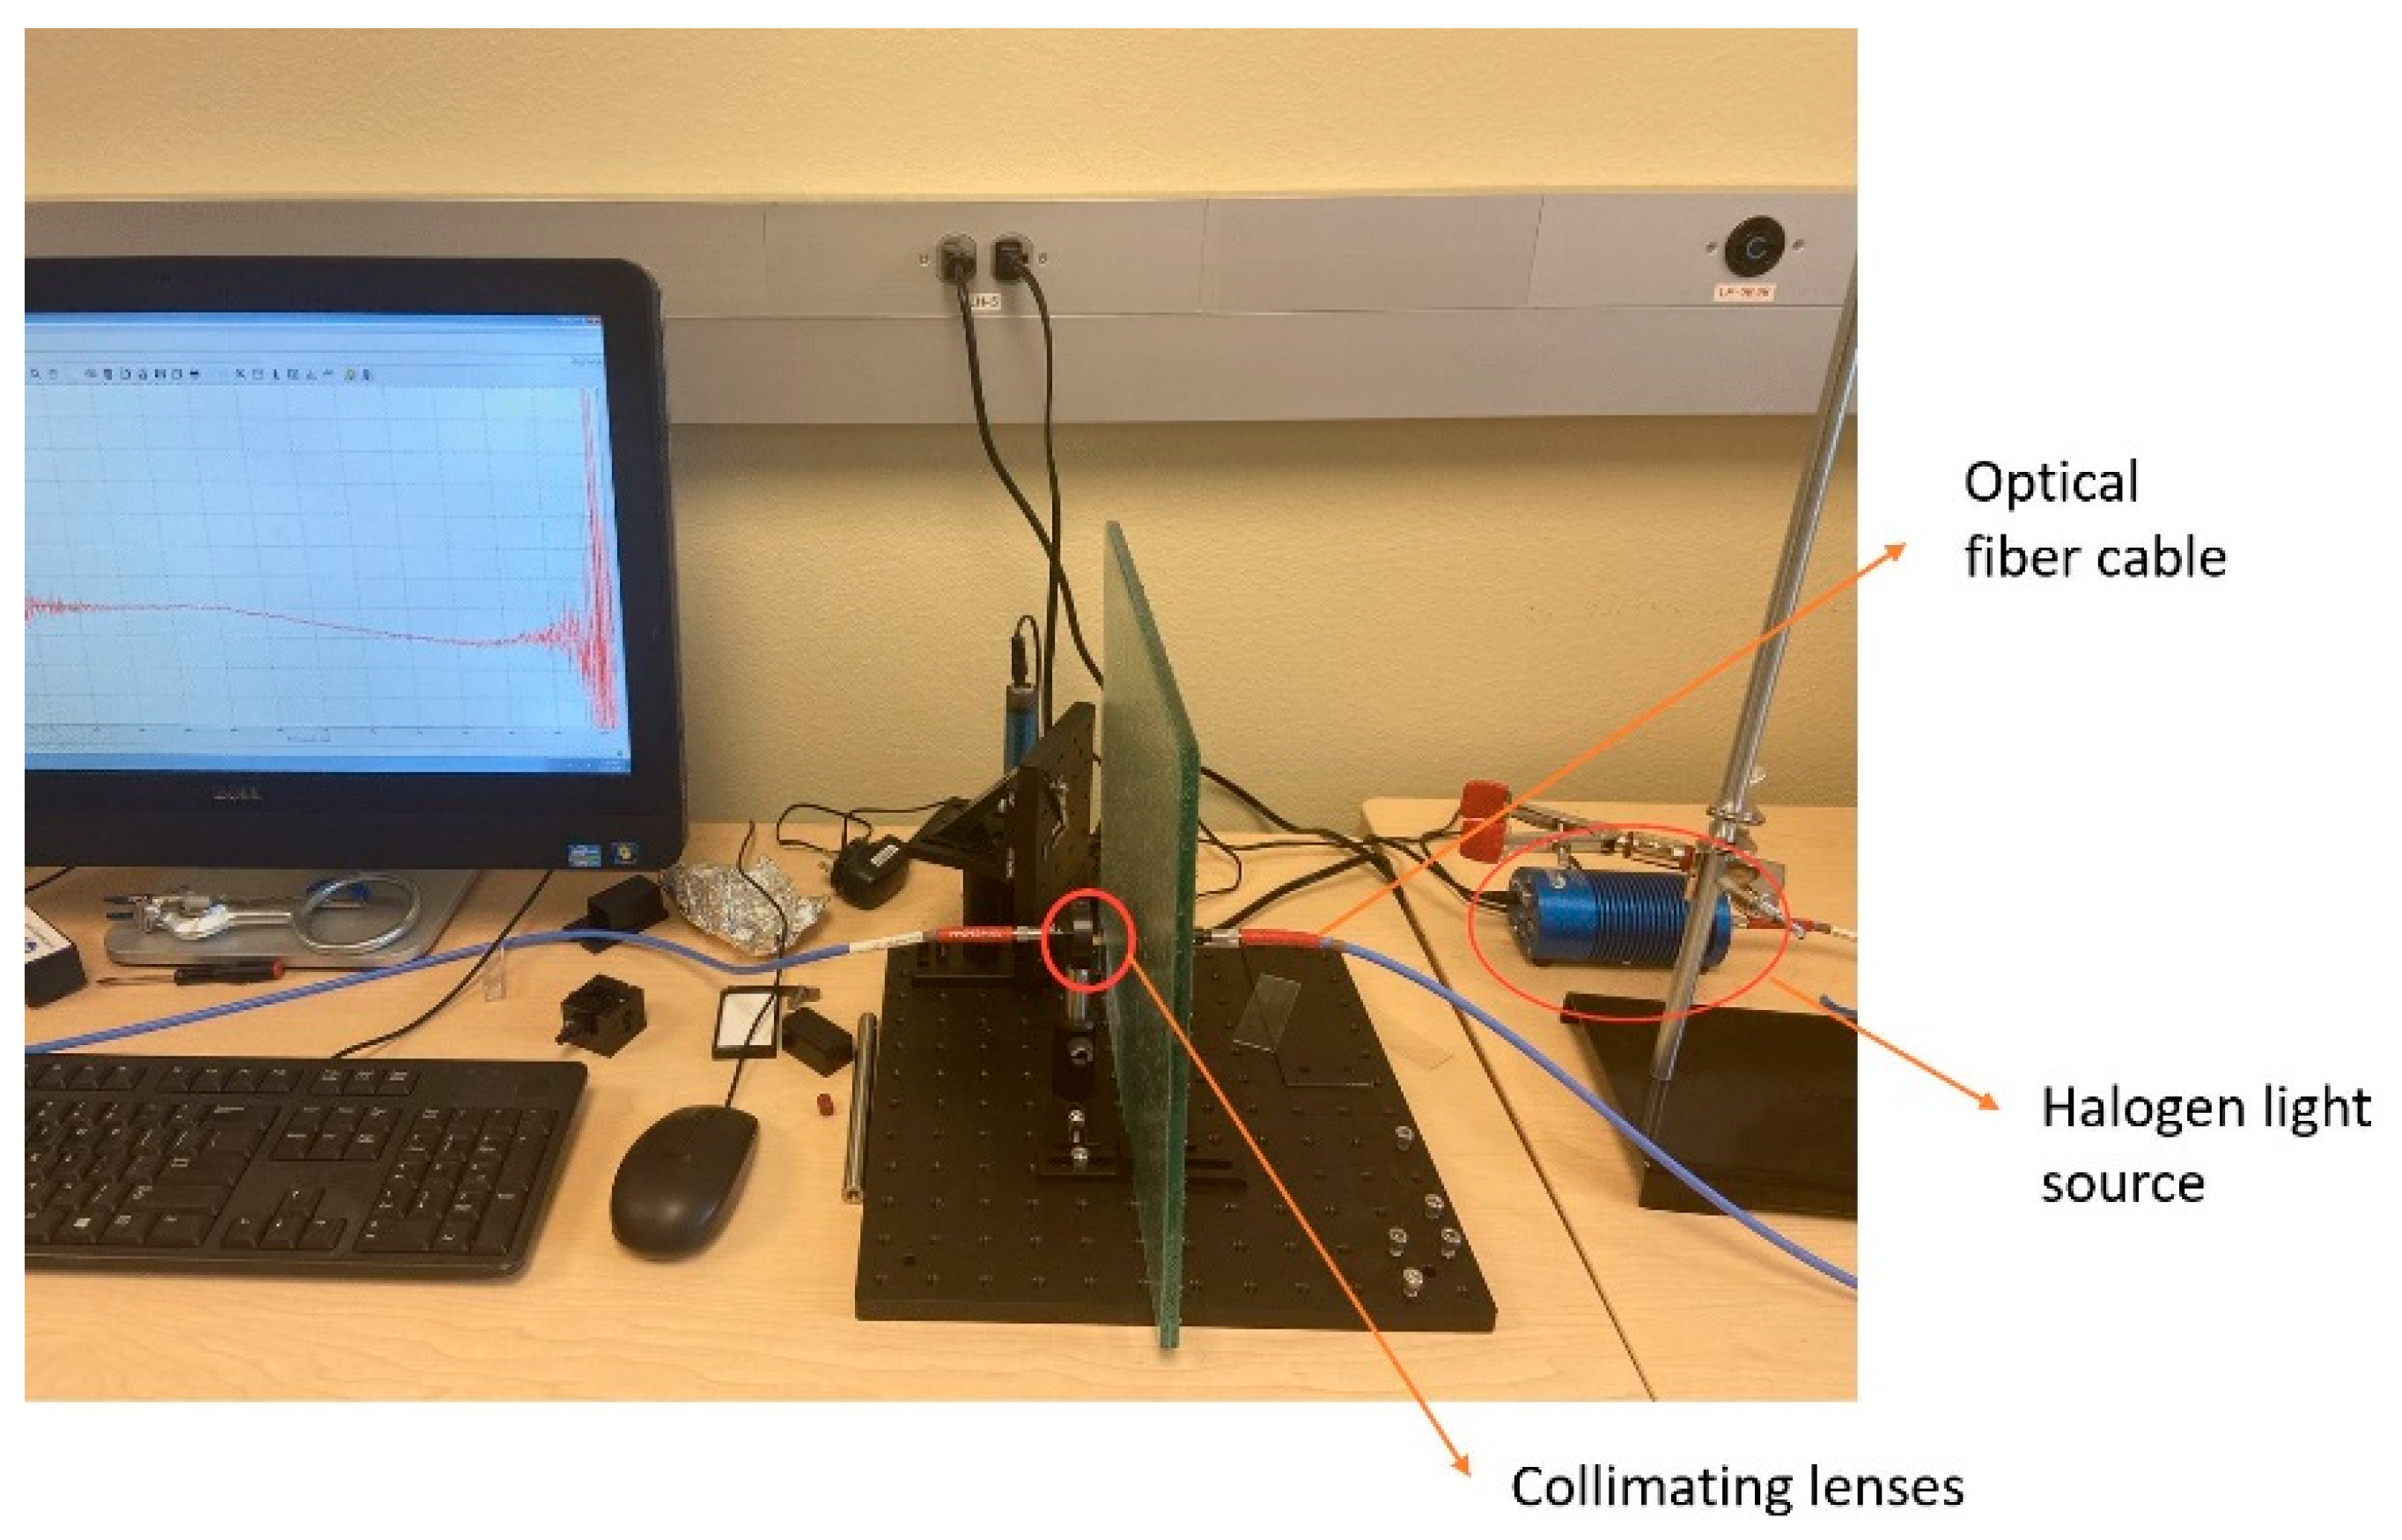
The transmittance spectroscopy test was performed to determine the percentage transmittance of the transparent covering materials at different wavelengths varying between 450 nm to 750 nm. High percentage transmittance means higher transparency which allows a higher amount of sunlight to be transmitted to the solar panel, and thereby, ensures higher efficiency of power production. As shown in Figure 4, the test setup consisted of a halogen light source, an optical fiber cable, a collimating lens, and a spectrometer [38]. The halogen light source emits the light beam and transmits it through the optical fiber cable to the collimating lenses in a free light beam path to initiate transmittance spectroscopy. A free light beam path was created to obtain the reference transmittance (100% transmittance). No object (i.e., no covering layer) was placed between the lenses while testing for reference transmittance. The collimating lenses are positioned in parallel to convert the divergent light beam into a parallel light beam that passes through the optical fiber cable to be detected by the spectrometer. When light is detected by the spectrometer, it compares the light transmitted from the source and measures the percentage transmittance of the samples. Each of the samples was placed between the collimating lenses to determine their percentage transmittance.

3.6. Field Assessment Based on Power Production

The data collection site was situated in a parking lot at the University of Texas at San Antonio (UTSA). There was no traffic interruption during the data collection period. Power generation was measured and compared among the solar panels in outdoor conditions with multiple and single resistance methods. Initially, power data was collected from all the pavement solar panels using a wide range of resistance values varying between 50 Ω to 300 Ω to determine the optimum resistance value which provides the peak power output for all the panels. Then, power generation was analyzed with the single resistance method at the optimum resistance value obtained from the multiple resistance method. The test setup is shown in Figure 5. The goal of this experiment was to determine the percentage of reduction in power due to the presence of a transparent cover in comparison to the control solar panel.
The objective of this test was to investigate the actual power production of the proposed solar module under light traffic in a parking lot. In addition, the effects of the fast- and slow-moving shades, due to vehicles’ movements at different speeds, on the power production were also assessed. Four sets of field tests were conducted on each solar module with four-wheel passes in each test, and the average power production results of each test were correlated to the control module (i.e., under no passing vehicles condition) to estimate the percentage of reduction in produced power. In all tests, vehicle speeds were kept at approximately 8 km/h (5 mph) to allow for the maximum shading period (i.e., maximum power production drop). It is important to note that for all the tests, the control module was positioned next to the tested module in comparison, but the control module was never subjected to wheel loading.

4. Finite Element Analysis

The structural bearing capacity of the solar module was evaluated with a 3-D finite element (FE) analysis before the solar module was thought to be installed into the real pavement structure. Realistic pavement and solar module performance under standard semi-trailer vehicle loading were simulated using the commercial software ABAQUS. The designed system was inserted in the middle of the wheel path of a typical pavement structure that was subjected to a moving truck wheel load, as discussed in the following subsections.

4.1. Model Description and Material Properties

A typical pavement structure consisting of three layers (namely: asphalt, base, and subgrade layers) was modeled in the ABAQUS. The thicknesses of the asphalt and the base layers were 343 mm (13.5 inches) and 406 mm (16 inches), respectively, while the subgrade layer thickness was assumed to be 2.5 m (98 inches) to eliminate the effects of the model boundary conditions on the analysis [43,44]. In addition, an initial sensitivity analysis was performed to assign the appropriate model dimensions (i.e., length and width), and the model dimensions were progressively reduced while monitoring the changes in results. Therefore, the model width was assumed to be 3.60 m (12 ft.) and the length was assumed to be 10.70 m (35 ft.). The solar module dimensions (i.e., length × width) were 304.8 mm (12 inches) × 304.8 m (12 inches) and were modeled as two parts. The lower part was the wooden base of the module with a thickness of 26.92 mm, while the upper part represented the optical grade polycarbonate sheet for which two different thicknesses (namely, 10 mm and 16 mm) were investigated. SP10 and SP16 models contain solar modules of 10 mm and 16 mm polycarbonate sheets, respectively. Thereafter, as previously mentioned, the solar module was embedded into the pavement structure exactly centered in the wheel path with the polycarbonate cover subjected to the traffic loading, as shown in Figure 6. Furthermore, for a better understanding of the structural responses of the solar modules under the traffic loading, the analysis results of the two FE models with the solar modules (i.e., the FE models with the 10 mm and 16 mm polycarbonate covers) were correlated to the corresponding results of a standard pavement structure (i.e., without a solar module) with the same dimensions, boundary conditions, and pavement layer characteristics.

4.1.1. Material Properties

The asphalt layer of the pavement structure was modeled as a viscoelastic material by specifying a Prony Series parameter with the moduli values shown in Table 3 [45], where gi and ki are the dimensionless shear and bulk moduli, respectively, and τ i is the relaxation time in seconds. The elastic modulus of the spring component of the Prony series (E0) was 30.56 MPa [45]. All the other materials for the pavement structure and the solar module were considered elastic isotropic materials with the properties shown in Table 4 [25].

4.1.2. Modeling the Semi-Trailer Truck Tire

In this study, a super single wide-based radial tire was considered to represent a semi-trailer load over the pavement structure and the solar module. The tire size designation used was 385/65R/22.5, which corresponds to a cross-sectional width of 38.5 cm (15 inches), an aspect ratio of 65% (i.e., the sidewall height, measured from the rim to the top of the tire treads, is 65% of the cross-sectional width), and the rim diameter is 57 cm (22.5 inches). Three different parts were modeled to constitute the tire model, and the interactions between these parts were defined, as exemplified in the literature [45]. The tire was composed of three parts, namely the rubber body, the carcass plies, and the steel belt, while the threads are ignored for simplification. All the parts were modeled as elastic–isotropic materials and the material properties were assigned to them according to the values presented in Table 5 [45].

4.1.3. Interactions, Loads, Boundary Conditions, and Meshing Details

The pavement–tire interaction was specified as a “surface-to-surface contact”. The interaction properties were specified using the “penalty method” with a longitudinal friction factor of 0.75 to represent the tangential behavior between the tire and the pavement surface [46]. In addition, the normal interaction behavior was specified by representing the pressure–overclosure as a “Hard Contact” in ABAQUS. All the vertical surfaces were constrained from transversal displacement in two directions, and the bottom of the subgrade layer was also restrained from vertical displacement. A vertical load of 44,500 kN (10,000 lb), equivalent to the RAPTOR wheel load, was defined vertically at the center of the tire. In addition, a uniform inflation pressure of 0.827 MPa (120 psi) was applied radially to the inner surface of the tire rubber. As previously mentioned, a moving load with a speed of 8 km/h (5 mph) was also considered at the center of the tire.
The pavement structure, solar module parts, and the rubber body of the tire model were meshed using explicit–hexahedral–8-nodded–reduced integration linear bricks (C3D8R), while both the carcass plies and the steel belt were meshed with explicit–quadratic–4-nodded–reduced integration linear shells (S4R). Mesh sizes were finer in the vicinity of the loading area and the polycarbonate cover of the solar module, while the rest of the model was relatively coarser to optimize the run time without scarifying the accuracy of the results. Table 6 shows all the mesh sizes specified for the different parts of the model. All the performed analyses were “dynamic–explicit” with the non–linear geometry control (Nlgeom) turned on. The time incrementation was set as “Automatic” in ABAQUS, to ensure stability [47].

5. Results and Discussion

5.1. Transmittance of the Covering Materials

As can be seen in Figure 7, a 100% transmittance was initially established by creating a free light beam path between the collimating lenses without any covering plates. Then, the different covering plates (i.e., GlassGrit, textured glass, and polycarbonate) were placed between the lenses, and their percentage transmittance was recorded. The percentage transmittance for the GlassGrit, textured glass, and polycarbonate was 41%, 50%, and 82%, respectively. The transparency test results are depicted in Figure 7.
Figure 7 suggests that the percentage transmittance of the polycarbonate sample is much higher than the percentage transmittance of the GlassGrit and the textured glass. The solar panel with the top polycarbonate cover of 10 mm thickness is termed SP10 throughout the paper.

5.2. Power Generation in Multiple Resistance Method

Figure 8 illustrates the power production results of the power versus the investigated resistance values for SP10 (solar panel with 10 mm polycarbonate), CSP (control solar panel with no cover), and textured FSP (solar panel with textured float glass cover). Each set of data collection was conducted at different solar irradiance and illuminance at different times of the day. Therefore, the CSP displayed different power values at the same resistance. A wide range of resistance values was tested ranging between 60 Ω to 600 Ω. It can be inferred from Figure 8 that maximum power output was achieved at 80 Ω resistance for all the solar panels. Therefore, 80 Ω was used for the rest of the experiments conducted using single resistance at the same data collection site.

5.3. Power Generation in Single Resistance Method

Figure 9 represents the power generation corresponding to the 80 Ω resistance value for the different solar modules compared to the CSP. The power difference between the CSP and other panels was stable throughout the data collection period. The temperature and associated solar irradiance during the data collection are depicted in Table 7. During the data collection period, the solar panels experienced some variation due to intermittent clouds, weather changes, and variable solar irradiance at different times of the day.
To obtain the average power output throughout the day, power data were collected for SP10 and textured FSP. Power generation data were achieved from 1:00 p.m. to 6:00 p.m. for SP10. The solar irradiance was approximately 875 W/m2 at 1 PM which dropped to 16 W/m2 at the end of the day. Figure 10 shows the power generation from SP10 and FSP from 1:00 p.m. to 6:00 p.m.
At the beginning of the data collection period, the average temperature was 21.1 °C (70 °F) which started dropping after 2:00 p.m due to a passing cloud. It was observed that towards the beginning of the data acquisition period when the solar intensity was higher, the difference in power production between two panels was less obvious. From 1:00 p.m. to 2:00 p.m., SP10 produced an average of 2.576 W power, whereas the glass panel produced 2.055 W. From 2:00 p.m. to 4:00 p.m., SP10 produced an average power of 2.284 W, whereas textured FSP was 1.711 W, which is 74.91%. From 4:00 p.m. to 6:00 p.m., textured FSP produced 0.440 W power, which is 61.45% compared to SP10.

5.4. Power Evaluation under Wheel Shading

While the solar illuminance ranged between 35 to 38 Klux during the testing of SP10, it ranged approximately within 15 to 18 Klux because of cloud covers which produced very low power output from textured FSP. As the vehicle starts to move over the solar panels, the area of the panels covered by shade increases, and when the solar panel is fully covered by the vehicle, solar irradiance values drop and the power drops to zero. The objective of this test was to investigate if there was any performance loss in power output due to the wheel run. As the vehicle moves away from the solar panel completely, the power output reaches its full output level, as illustrated in Figure 11. Each solar panel was subjected to four sets of tests under wheel loading and Figure 11 shows the output from field test four. No disruption or scratch was observed on solar panels with a polycarbonate cover and textured float glass samples after the four test wheel drives over them. However, the textured GlassGrit could bear up to two test drives under the running wheel without any scratch or significant sign of damage. When the sample was subjected to a 10-mph running wheel on top of it, it failed and fractured in field test one. Therefore, the power output under wheel shading is not shown for the textured GlassGrit.
The GlassGrit sample can be used in the parking lot and walking areas without skidding, but cannot be used under roadway traffic conditions. The speed and length of the vehicle are two important factors to determine energy loss. The Power versus Time curve depicted that the shade of the passing vehicle over the panel caused a sudden drop and rise in the power output. When the vehicle speed was higher, the time difference between the drop and rise of power output was very low due to the fast-moving shade. However, when the vehicle shading was kept over the solar panel for a certain period, the time duration between the drop and rise of power output increased. For roadway application of solar panels, the system that is required to connect the power produced by the solar panels to the grid must be capable of working with this rapid fluctuation in the power due to fast-moving shades [48].

5.5. Finite Element Analysis Results

5.5.1. Von Mises Stress Contours

The FE analysis resulted in the stress profile in Figure 12, which represents the stress contours on the transparent polycarbonate cover and in the middle of the typical pavement model after 2.250 s (when the tire is on top of the solar module). From this analysis, the maximum stresses under the tire axis for the typical pavement model, SP10 and SP16 were 4.48 MPa (651 psi), 19 MPa (2784 psi), and 14 MPa (2021 psi), respectively, when the tire location was exactly on top of the solar panel tapering off towards the edge. The results also showed that for the SP10 and SP16 models, maximum stresses were found at the vicinity of the contact edge between solar panels and the HMA layer. This is believed to be the effect of the boundary condition or the difficulty in accurate boundary conditions at the edges of the solar panels [25]. Besides, these critical regions occur as the mismatch of the elastic properties between the polycarbonate and asphalt introduces stress singularities near the interfaces.
The flexural strength of the polycarbonate at yield is 14,503.8 psi (100 MPa) and the tensile strength at yield is 60 MPa (8702.26 psi) [25,41]. From this analysis, it is evident that all the stresses developed in the transparent polycarbonate layers are well below the compressive strength and tensile yield strength in all cases, meaning that the loads being applied are safely supported. Figure 13 reveals the stress history of the solar module as the tire approaches and passes the solar panel. The stress is maximum when the tire is on top of the solar panels, i.e., after 2.250 s into the simulation. Figure 13a represents a comparison of transient stresses on top of the solar module for SP10 and SP16, and Figure 13b exhibits the distribution of stresses at the element (Xm) with the change in distance between Xm and the center of the tire location for typical pavement model. Xm is a mid-element below the central axis of the tire on the typical pavement model, as shown in Figure 12. From Figure 13, as the thickness of the polycarbonate sample increased from 10 mm to 16 mm, the corresponding maximum stresses decreased from approximately 19 MPa and 14 MPa (26%).

5.5.2. Maximum Vertical Deformation on the Transparent Layer

The maximum deflections of SP10, SP16, and typical pavement models were 0.887 mm (34.93 mils), 0.867 mm (34.14 mils), and 0.370 mm (14.58 mils), respectively, and the associated deflection contour is as shown in Figure 14. Maximum deflections increase with the decrease in thickness of the polycarbonate sheets. The maximum deflections of the SP10 and SP16 were 41.71% and 42.68%, respectively, compared to the typical pavement model.
One of the major key findings of this section is that it is possible to design and construct a solar panel with predictable performance. This section dictated that it is possible to build a solar panel that can withstand the structural loads that pavements are subjected to with the integration of an electrical system.

5.6. Application in Smart Pedestrian Systems

Large-scale application of PV-powered solar modules onto the roadway can electrify roads and transform them into large energy-gathering platforms that can be used for a variety of purposes. One such possible application is in solar-powered smart pedestrian crosswalks for providing power for illumination with light-emitting devices (LED) and energy storage systems. The purpose of such a system is to alert drivers of approaching vehicles about pedestrians to reduce the likelihood of crashes and enhance safety. Another appealing application could be the wireless electric vehicle charging system during driving with an inductance coil [49]. Currently, electric vehicles mainly use fixed charging piles which is inconvenient for drivers for long-duration charging. Therefore, PV pavement can be served as a base for adaptive wireless charging infrastructure [50].
In this study, the viability of this prototype in a solarized crosswalk was assessed based on power production. The power generated from one SP10 panel was compared to the power required to run a “smart pedestrian system” composed of self-powered embedded road studs LEDs [51].
Consider power produced in the daytime by SP10 from 9 a.m.–4 p.m. yielding 7 h × 124 W = 874 Wh of power. Since the SP10 panels would be installed on roadways and would certainly be subjected to shading as vehicles or pedestrians pass over, an estimated reduction of 20% in total power generation is considered. As a result, the power generated by SP10 would be 80% × 874 Wh = 699 Wh. On the other hand, the power consumption of a Pedestrian System with embedded road studs [51] considering an operation from 6 p.m.–6 a.m. is approximately 12 h × [40 W + 8 W (Embedded Road stud LEDs)] = 576 Wh. Therefore, it can presumably be suggested that the use of SP10 in a solar module for pedestrian applications will provide sufficient power for LED illumination with a built-in battery capable of storing the daytime solar charge power for night use. It is important to mention that the estimated power generation and consumption may vary according to other controlling factors, such as wear and tear, panel deterioration, battery life, etc.

6. Economic Analysis

The primary component of the proposed solar module consists of a 10 mm skid-resistant polycarbonate cover, a thin-film solar cell, a wooden frame, tempered hardboard, and wire nails. Table 8 shows the associated cost for the solar module, energy generation, and cost per kWh, while Table 9 provides a cost comparison with other solar road test projects.
From the comparison in Table 9, it was observed that the energy production from the SP10 module was comparatively higher than other panels because its power production was estimated based on the data collected for a single day in sunny conditions, ignoring the influence of other long-term environmental impacts, including the gradual accumulation of dirt over time. Thus, testing the solar module’s integration with the road in real-world settings is necessary to achieve actual energy generation.

7. Conclusions

This study proposed a design of a pavement solar module that can withstand structural loads for light traffic roadways, sidewalks, and parking lots. From the investigation of the power production, it can be concluded that the proposed module can produce 699 Wh throughout the day in sunny weather in the summer. These power data depend on several factors, such as solar irradiance, illuminance, weather conditions, and temperature. Although the power produced is smaller than other energy harvesting techniques, it is sufficient to provide self-powered LED illumination in the pedestrian crossing to enhance safety. The main advantage of this technology is that the prototype can be directly installed on the roadway surface and will not cost any additional public space. Although FE analysis simulation showed that the stresses developed under a single wheel load were well below the compressive and yield strength of the polycarbonate, the solar panels should be tested in the laboratory to determine the maximum magnitude of loads resisted by them. Again, the effects of repetitive loading were not investigated in the FE simulation. Therefore, this work can be expanded by investigating the durability and longevity of polycarbonate and textured glass in light traffic conditions to withstand traffic without impairing power production. It also requires laboratory evaluation to determine the magnitude of loads that can be safely resisted by the module before field application. More test case scenarios and different operating temperatures can be incorporated, and the solar panels should be tested under a larger number of turns of the wheel loading under real traffic conditions in different weather conditions, followed by the numerical analysis of the electrical and thermal performance for comprehensive analysis.

Author Contributions

Conceptualization, M.R. and S.D.; methodology, M.R.; validation, M.R.; formal analysis, M.R. and G.M.; resources, M.R.; writing—original draft preparation, M.R.; writing—review and editing, G.M. and S.D.; supervision, S.D.; project administration, S.D.; funding acquisition, S.D. All authors have read and agreed to the published version of the manuscript.

Funding

The authors would like to acknowledge the funding support of Transportation Consortium of South-Central States (Tran-SET) University Transportation Center (Grant number: 69A3551747106) for this project (Project Number: 20PUTSA42). The APC was also funded by the same source.

Data Availability Statement

Data presented in this study are available upon formal reasonable request due to restrictions directed to the corresponding authors. The data are not publicly available due to privacy policy of the companies from where the samples have been collected.

Acknowledgments

The authors would like to thank Weetect.com, Jockimo Inc., and Interstyleglass.com for supplying their materials for the successful completion of the project. Special thanks to Kathryn Mayer for her permission to conduct the transmittance test at the Science Research Laboratory.

Conflicts of Interest

The authors declare no conflict of interest.

References

  1. Zhou, Z.; Hu, S.; Zhang, X.; Zuo, J. Characteristics and application of road absorbing solar energy. Front. Energy 2013, 7, 525–534. [Google Scholar] [CrossRef]
  2. Hall, M.R.; Dehdezi, P.K.; Dawson, A.R.; Grenfell, J.R.; Isola, R. Influence of the thermophysical properties of pavement materials on the evolution of temperature depth profiles in different climatic regions. J. Mater. Civ. Eng. 2012, 24, 32–47. [Google Scholar] [CrossRef]
  3. Hendrowati, W.; Guntur, H.L.; Sutantra, I.N. Design, modeling and analysis of implementing a multilayer piezoelectric vibration energy harvesting mechanism in the vehicle suspension. Engineering 2012, 4, 728–738. [Google Scholar] [CrossRef] [Green Version]
  4. Guan, M.; Liao, W.-H. Characteristics of energy storage devices in piezoelectric energy harvesting systems. J. Intell. Mater. Syst. Struct. 2008, 19, 671–680. [Google Scholar] [CrossRef]
  5. Datta, U.; Dessouky, S.; Papagiannakis, A.T. Harvesting thermoelectric energy from asphalt pavements. Transp. Res. Rec. J. Transp. Res. Board 2017, 2628, 12–22. [Google Scholar] [CrossRef]
  6. Tahami, A.; Gholikhani, M.; Dessouky, S. A Novel Thermoelectric Approach to Energy Harvesting from Road Pavement. In International Conference on Transportation and Development 2020; American Society of Civil Engineers: Reston, VA, USA, 2020. [Google Scholar]
  7. Northmore, A.; Tighe, S. Developing Innovative Roads Using Solar Technologies. In Proceedings of the 2012 Annual Conference of the Canadian Society for Civil Engineering, Volume 2, Edmonton, AB, Canada, 6–9 June 2012; Canadian Society for Civil Engineering: Montreal, QC, Canada, 2012. [Google Scholar]
  8. Dezfooli, A.S.; Nejad, F.M.; Zakeri, H.; Kazemifard, S. Solar pavement: A new emerging technology. Sol. Energy 2017, 149, 272–284. [Google Scholar] [CrossRef]
  9. Abbas, F.A.; Alhamdo, M.H. Thermal Performance of Asphalt Solar Collector by Improving Tube and Slab Characteristics. Int. J. Thermofluids 2023, 17, 100293. [Google Scholar] [CrossRef]
  10. Vizzari, D.; Gennesseaux, E.; Lavaud, S.; Bouron, S.; Chailleux, E. Pavement energy harvesting technologies: A critical review. RILEM Tech. Lett. 2021, 6, 93–104. [Google Scholar] [CrossRef]
  11. Pan, P.; Wu, S.; Xiao, Y.; Liu, G. A review on hydronic asphalt pavement for energy harvesting and snow melting. Renew. Sustain. Energy Rev. 2015, 48, 624–634. [Google Scholar] [CrossRef]
  12. Yuan, D.; Jiang, W.; Sha, A.; Xiao, J.; Shan, J.; Wang, D. Energy output and pavement performance of road thermoelectric generator system. Renew. Energy 2022, 201, 22–33. [Google Scholar] [CrossRef]
  13. Li, S.; Ma, T.; Wang, D. Photovoltaic pavement and solar road: A review and perspectives. Sustain. Energy Technol. Assess. 2023, 55, 102933. [Google Scholar] [CrossRef]
  14. Tahami, S.A.; Gholikhani, M.; Nasouri, R.; Dessouky, S.; Papagiannakis, A. Developing a new thermoelectric approach for energy harvesting from asphalt pavements. Appl. Energy 2019, 238, 786–795. [Google Scholar] [CrossRef]
  15. Gholikhani, M.; Roshani, H.; Dessouky, S.; Papagiannakis, A. A critical review of roadway energy harvesting technologies. Appl. Energy 2020, 261, 114388. [Google Scholar] [CrossRef]
  16. Coutu, R.A., Jr.; Newman, D.; Munna, M.; Tschida, J.H.; Brusaw, S. Engineering Tests to Evaluate the Feasibility of an Emerging Solar Pavement Technology for Public Roads and Highways. Technologies 2020, 8, 9. [Google Scholar] [CrossRef] [Green Version]
  17. Efthymiou, C.; Santamouris, M.; Kolokotsa, D.; Koras, A. Development and testing of photovoltaic pavement for heat island mitigation. Sol. Energy 2016, 130, 148–160. [Google Scholar] [CrossRef]
  18. Al-Qadami, E.H.H.; Mustaffa, Z.; Al-Atroush, M.E. Evaluation of the pavement geothermal energy harvesting technologies towards sustainability and renewable energy. Energies 2022, 15, 1201. [Google Scholar] [CrossRef]
  19. Ma, T.; Yang, H.; Gu, W.; Li, Z.; Yan, S. Development of walkable photovoltaic floor tiles used for pavement. Energy Convers. Manag. 2019, 183, 764–771. [Google Scholar] [CrossRef]
  20. MacDonald, F. The Solar Road in the Netherlands Is Working Even Better than Expected. Science Alert. 2015. Available online: http://www.sciencealert.com/solar-roads-in-the-netherlands-are-working-even-better-than-expected (accessed on 20 October 2016).
  21. Klimenta, D.; Jevtić, M.; Andriukaitis, D.; Mijailović, V. Increasing the transmission performance of a conventional 110 kV cable line by combining a hydronic concrete pavement system with photovoltaic floor tiles. Electr. Eng. 2021, 103, 1401–1415. [Google Scholar] [CrossRef]
  22. Mehta, A.; Aggrawal, N.; Tiwari, A. Solar Roadways-The future of roadways. Int. Adv. Res. J. Sci. Eng. Technol. (IARJSET) 2015, 2, 161–163. [Google Scholar]
  23. Pei, J.; Zhou, B.; Lyu, L. e-Road: The largest energy supply of the future? Appl. Energy 2019, 241, 174–183. [Google Scholar] [CrossRef]
  24. Lee, K.; Correia, A.J. A Pilot Study for Investigation of Novel Methods to Harvest Solar Energy from Asphalt Pavements. 2010. Available online: http://www.uri.edu/cve/ritrc/10KICTPilotFinalReportACKWL3-10.doc (accessed on 7 July 2021).
  25. Northmore, A. Canadian Solar Road Panel Design: A Structural and Environmental Analysis. Master’s Thesis, University of Waterloo, Waterloo, ON, Canada, 2014. [Google Scholar]
  26. Northmore, A.; Tighe, S. Innovative Pavement Design: Are Solar Roads Feasible? In Proceedings of the 2012 Conference & Exhibition of the Transportation Association of Canada, Fredericton, NB, Canada, 14–17 October 2012; Transportation Association of Canada: Ottawa, ON, Canada, 2012. [Google Scholar]
  27. Northmore, A.B.; Tighe, S.L. Performance modelling of a solar road panel prototype using finite element analysis. Int. J. Pavement Eng. 2016, 17, 449–457. [Google Scholar] [CrossRef]
  28. Brusaw, S.D.; Brusaw, J.A. Solar Roadway Panel. Google Patents USD712822S1, 9 September 2014. [Google Scholar]
  29. Zhou, B.; Pei, J.; Nasir, D.M.; Zhang, J. A review on solar pavement and photovoltaic/thermal (PV/T) system. Transp. Res. Part D: Transp. Environ. 2021, 93, 102753. [Google Scholar] [CrossRef]
  30. Gnatov, A.; Argun, S.; Rudenko, N. Smart Road as a Complex System of Electric Power Generation. In Proceedings of the 2017 IEEE First Ukraine Conference on Electrical and Computer Engineering (UKRCON), Kyiv, Ukraine, 29 May–2 June 2017. [Google Scholar]
  31. Li, S.; Chen, Z.; Liu, X.; Zhang, X.; Zhou, Y.; Gu, W.; Ma, T. Numerical simulation of a novel pavement integrated photovoltaic thermal (PIPVT) module. Appl. Energy 2021, 283, 116287. [Google Scholar] [CrossRef]
  32. Vizzari, D.; Chailleux, E.; Lavaud, S.; Gennesseaux, E.; Bouron, S. Fraction factorial design of a novel semi-transparent layer for applications on solar roads. Infrastructures 2020, 5, 5. [Google Scholar] [CrossRef] [Green Version]
  33. PT15-300 Solar Panel. Available online: https://www.powerfilmsolar.com/products/electronic-component-solar-panels/weatherpro-series/pt15-300 (accessed on 12 July 2021).
  34. Advantages Make Thin Film Solar Panels Shine. Available online: https://solartown.com/learning/solar-panels/advantages-make-thin-film-solar-panels-shine/ (accessed on 15 July 2021).
  35. Tzikas, C.; Gómez, G.; van den Donker, M.; Bakker, K.; Smets, A.H.; Folkerts, W. Do Thin Film PV Modules Offer an Advantage under Partial Shading Conditions. In Proceedings of the 33rd European Photovoltaic Solar Energy Conference and Exhibition, Amsterdam, The Netherlands, 25–29 September 2017. [Google Scholar]
  36. Rothman, J. Pros and Cons of the Three Different Types of Solar Panels. Available online: https://hahasmart.com/blog/91/pros-and-cons-of-the-three-different-types-of-solarpanels#:~:text=Disadvantages%20of%20Thin%20Film%20Solar,come%20with%20a%20shorter%20warranty (accessed on 22 July 2021).
  37. Hossain, M.F.T. Feasibility Study of a Pavement Solar Box for Intersections. Ph.D. Thesis, The University of Texas at San Antonio, San Antonio, TX, USA, 2019. [Google Scholar]
  38. Hossain, M.F.T.; Dessouky, S.; Biten, A.B.; Montoya, A.; Fernandez, D. Harvesting solar energy from asphalt pavement. Sustainability 2021, 13, 12807. [Google Scholar] [CrossRef]
  39. Jockimo GlassGrit™. Available online: https://www.jockimo.com/products/by-product-type/glass-flooringtreads/featuresoptions/196-platinum-level-glassgrit (accessed on 15 July 2021).
  40. Solar Roadways_Phase II Research. July 2011. Available online: https://solarroadways.com/research/phase-ii-research/ (accessed on 15 July 2021).
  41. Scratch Resistant Polycarbonate Sheet. Available online: https://www.weetect.com/scratch-resistant-polycarbonate-sheet/ (accessed on 15 July 2021).
  42. LEXAN vs. Plexiglass. Available online: https://www.polymershapes.com/lexan-vs-plexiglass/#:~:text=LEXAN%3A%20Pros%20%26%20Cons,when%20impact%20is%20a%20concern (accessed on 15 July 2021).
  43. Alkaissi, Z.A. Effect of high temperature and traffic loading on rutting performance of flexible pavement. J. King Saud Univ.-Eng. Sci. 2020, 32, 1–4. [Google Scholar] [CrossRef]
  44. Howard, I.L.; Warren, K.A. Finite-element modeling of instrumented flexible pavements under stationary transient loading. J. Transp. Eng. 2009, 135, 53–61. [Google Scholar] [CrossRef]
  45. Mabrouk, G.M.; Elbagalati, O.S.; Dessouky, S.; Fuentes, L.; Walubita, L.F. 3D-finite element pavement structural model for using with traffic speed deflectometers. Int. J. Pavement Eng. 2022, 23, 4065–4079. [Google Scholar] [CrossRef]
  46. Ong, G.P.; Fwa, T.F. Mechanistic interpretation of braking distance specifications and pavement friction requirements. Transp. Res. Rec. J. Transp. Res. Board 2010, 2155, 145–157. [Google Scholar] [CrossRef]
  47. Explicit Dynamic Analysis. 2021. Available online: https://abaqus-docs.mit.edu/2017/English/SIMACAEANLRefMap/simaanl-c-expdynamic.htm (accessed on 15 August 2021).
  48. Selvaraju, R.K. Characterization of Solar Roadways Via Computational and Experimental Investigations; The University of Western Ontario: London, ON, Canada, 2012. [Google Scholar]
  49. Kandasamy, V.; Keerthika, K.; Mathankumar, M. Solar based wireless on road charging station for electric vehicles. Mater. Today Proc. 2021, 45, 8059–8063. [Google Scholar] [CrossRef]
  50. Zhou, B.; Pei, J.; Calautit, J.K.; Zhang, J.; Guo, F. Solar self-powered wireless charging pavement—A review on photovoltaic pavement and wireless charging for electric vehicles. Sustain. Energy Fuels 2021, 5, 5139–5159. [Google Scholar] [CrossRef]
  51. Smart Pedestrian System. Available online: https://www.ellumin.com/wp-content/uploads/2019/08/INTELLIGENT-PEDESTRIAN-SYSTEM-URBAN-TYPE-new.pdf (accessed on 2 May 2021).
  52. Hu, H.; Vizzari, D.; Zha, X.; Roberts, R. Solar pavements: A critical review. Renew. Sustain. Energy Rev. 2021, 152, 111712. [Google Scholar] [CrossRef]
  53. Brusaw, S. Solar Roadways. 2021. Available online: https://solarroadways.com/ (accessed on 31 January 2023).
  54. Sola Road. 2023. Available online: https://www.solaroad.nl/ (accessed on 31 January 2023).
  55. Wattway by Colas. 2023. Available online: https://www.wattwaybycolas.com/ (accessed on 31 January 2023).
  56. Zha, X.; Zhang, C.; Wu, Z.; Zhang, Q. Mechanical analysis and model preparation for hollow slab element of solar pavement. Acta Energ. Sol. Sin. 2016, 37, 136–141. [Google Scholar]
Figure 1. Schematic drawing for the solar module assembly.
Energies 16 03338 g001
Figure 2. Fabrication steps for the solar panel. (a) 45° angle cutting, (b) grooved cut sample, (c) 45° angle cut grooved sample, (d) rectangular hollow frame, (e) rectangular frame with stiffeners, (f) rectangular frame with hardboard, (g) thin film solar cell, and (h) assembled solar panel [37,38].
Energies 16 03338 g002
Figure 3. (a) Tempered GlassGrit with (b) textured 16 mm polycarbonate sheet, and (c) textured float glass.
Energies 16 03338 g003
Figure 4. Instrument setup for transmittance test (Science research laboratory, UTSA).
Energies 16 03338 g004
Figure 5. (a) Test of solar panel under the wheel load, and (b) experimental setup for performance evaluation in outdoor conditions.
Energies 16 03338 g005
Figure 6. Meshed FE model assembly.
Energies 16 03338 g006
Figure 7. Percentage transmittance for the transparent covering materials.
Energies 16 03338 g007
Figure 8. Power production for the solar modules at different resistance values versus the CSP for (a) GSP, (b) SP10, and (c) textured float glass panel.
Energies 16 03338 g008
Figure 9. Power production of the different solar modules at a resistance value of 80 Ω (a) GSP, (b) SP10, and (c) textured FSP.
Energies 16 03338 g009
Figure 10. Power generation from SP10 and textured FSP for longer periods.
Energies 16 03338 g010
Figure 11. Power comparison with CSP for (a) SP10, and (b) textured FSP during field test three.
Energies 16 03338 g011
Figure 12. Von-Mises stress contour at the top of the polycarbonate covers for (a) SP10, (b) SP16, and (c) in the middle section of the typical pavement model after 2.250 s into the simulation.
Energies 16 03338 g012
Figure 13. Von-Mises stress (a) on top of the solar module for SP10 and SP16 and (b) at element Xm for a typical pavement model as a function of the distance between tire and panel.
Energies 16 03338 g013
Figure 14. Vertical deflection contours on the transparent polycarbonate layer for (a) SP10, (b) SP16, and (c) typical pavement model after 2.250 s.
Energies 16 03338 g014
Table 1. Recent studies on layered PV solar panel technologies.
Solar PrototypeSolar CellPercentage TransmittanceCompressive Strength StrengthsLimitations of the Study
Gnatov, Argun, and Rudenko [30]High-strength plexiglass layer (the inner side fixes the electric heating element and the bottom mounts piezoelectric elements), a solar panel layer, and the envelope layer ____________This system integrated both piezoelectric elements with PV modules and was used with rechargeable batteriesIt requires investigation of the mechanical properties of the module and optical properties of the top covering layer
Ma et al., 2019 [19]Photovoltaic floor tile consisting of front tempered glass for anti-slip, EVA/PVB foils, PV cells, and rear tempered glass for supportNine monocrystalline solar cells in series90%74 kPaSatisfactory performance of power conversion efficiency (15%), high heat resistance, anti-slip, durability, and compressive strength. The study also indicated that the negative influence of different operating temperatures was investigatedThe prototype tiles were designed for pedestrian traffic but were not intended for use in road infrastructure.
Senji Li et al., 2021 [31]Integrated Photovoltaic and Thermal system (PIVT). Five layers: anti-slip layers, tempered glass, PV cell, tempered glass base, and asphaltCrystalline solar cell68.20%____Waste utilization, easy installation, and maintenance. Integration of both photovoltaic and thermal systems is a relatively new techniqueThe diffuse reflection leads to poor transmittance of the top layer
Vizzari et al., 2020 [32]Semi-transparent layer made with glass aggregates bonded with polyurethane + PV cell + porous concreteCrystalline Silicon solar cell________High skid resistance: BPN (British Pendulum Number) varies between 46 to 89. The use of Polyurethane instead of Resin diminishes the aging effectThe bottom porous layer has negative impacts on the bearing capacity of the structure. No information on the compressive strength and percentage transmittance
Table 2. Properties of PT15-300 thin film solar cell [33].
ParameterValue
Power 3.08 W
Operating Voltage15.4 V
Current200 mA
Average Voltage (Open Circuit)19 V
Maximum Voltage (Open Circuit)22.2 V
Current (Short Circuit)256 mA
Table 3. Prony series for viscoelastic material definition (pavement temperature 21.1 °C (70 °F)) [45].
giki τ i ,   s
E10.0455692640.0455692641 × 10−6
E20.0617779050.0617779051 × 10−5
E30.0814018050.0814018051 × 10−4
E40.1387847040.1387847041 × 10−3
E50.3153081360.3153081361 × 10−2
E60.1772918280.1772918281 × 10−1
E70.0898316860.0898316861 × 100
E80.0153056150.0153056151 × 101
E90.0059892840.0059892841 × 102
E100.0034258070.0034258071 × 103
E110.0032297040.0032297041 × 104
E120.0034998630.0034998631 × 105
E130.0036164760.0036164761 × 106
Table 4. Material characteristics for the pavement structure and the solar module components [37,41,45].
MaterialDensity (gm/cm3|pcf)Young’s Modulus (MPa|Ksi)Poisson’s Ratio
Asphalt layer2.353|146Prony Series0.35
Base layer2.08|13083.5|12.10.4
Subgrade layer1.76|11031|4.50.45
Polycarbonate1.13|70.542350|340.840.32
Pinewood0.48|309000|1305.340.33
Table 5. Material properties of the FE tire model [45].
PartDensity (kg/m3|pcf)Young’s Modulus (Pa|psi)Poisson’s Ratio
Rubber1200|759 × 106|13.05 × 1020.495
Steel belt5900|3682 × 1011|29 × 1060.300
Carcass1500|934 × 109|58 × 1040.300
Table 6. Mesh size used in the model.
PartsMesh Size (m)
HMA layer 0.152
Base0.178
Subgrade0.381
Polycarbonate0.013
Wood0.013
Wheel path0.013
Table 7. Summary of power generation in comparison to control solar panel.
Type of Solar PanelTemperature and Weather ConditionsPower Generation as a Percentage of CSPSolar Irradiance (W/m2)
GSP89 °F
Sunny
64.60370
SP1096 °F
Sunny
93470
Textured FSP85 °F
Sunny
64.30800
Table 8. Cost per unit area and energy production of solar panel.
Polycarbonate CoverSolar CellWooden BaseMiscellaneousTotal Cost ($/m2)Energy Production Per Year from One Panel (kWh)Energy Production (kWh/m2)Cost Per Energy ($/kWh)
SP10$115$71$4$220678.490.4222.85
Table 9. Energy production and cost comparison of other test projects on solar pavements [52].
Test ProjectsModule Size (m) (Length × Width × Thickness)Cell TypePower Production Per Year (kWh/m2)Manufacturing Cost ($/m2)
Solar Roadways [53]0.66 × 0.76Polysilicon70.59000–12,000
Solar Road [54]2.50 × 3.50 × 0.21Polysilicon7813,000–15,000
Wattway [55]1.398 × 0.69 × 0.007Polysilicon53.41500–2000
Hollow slab [56]0.50 × 0.50 × 0.25Polysilicon34.9400–800
SP100.093 × 0.093 × 0.037Thin film 90.42067
Disclaimer/Publisher’s Note: The statements, opinions and data contained in all publications are solely those of the individual author(s) and contributor(s) and not of MDPI and/or the editor(s). MDPI and/or the editor(s) disclaim responsibility for any injury to people or property resulting from any ideas, methods, instructions or products referred to in the content.

