
Fuzzy-Based Failure Modes, Effects, and Criticality Analysis Applied to Cyber-Power Grids


Abstract
:1. Introduction
- Computation of risk priority number (RPN) does not take into account the relative importance of severity, occurrence, and detection risk factors;
- Different combinations of S, O, and D can produce the same RPN value;
- The numerical scales used to represent the risk factors are usually attributed arbitrarily, being essentially qualitative scales;
- Assessment of risk factors has a subjective character. Hence, an integer number may not represent the uncertainty associated with expert knowledge, and;
- Although risk factors are represented as intervals, the RPN computing method is inappropriate for this kind of data.
2. Literature Review
3. Type-I Fuzzy Inference Systems
3.1. Fuzzy Sets and Fuzzy Logic
3.2. Fuzzy Membership Functions
3.3. Fuzzy If-Then Rules
THEN (RPN is moderate).
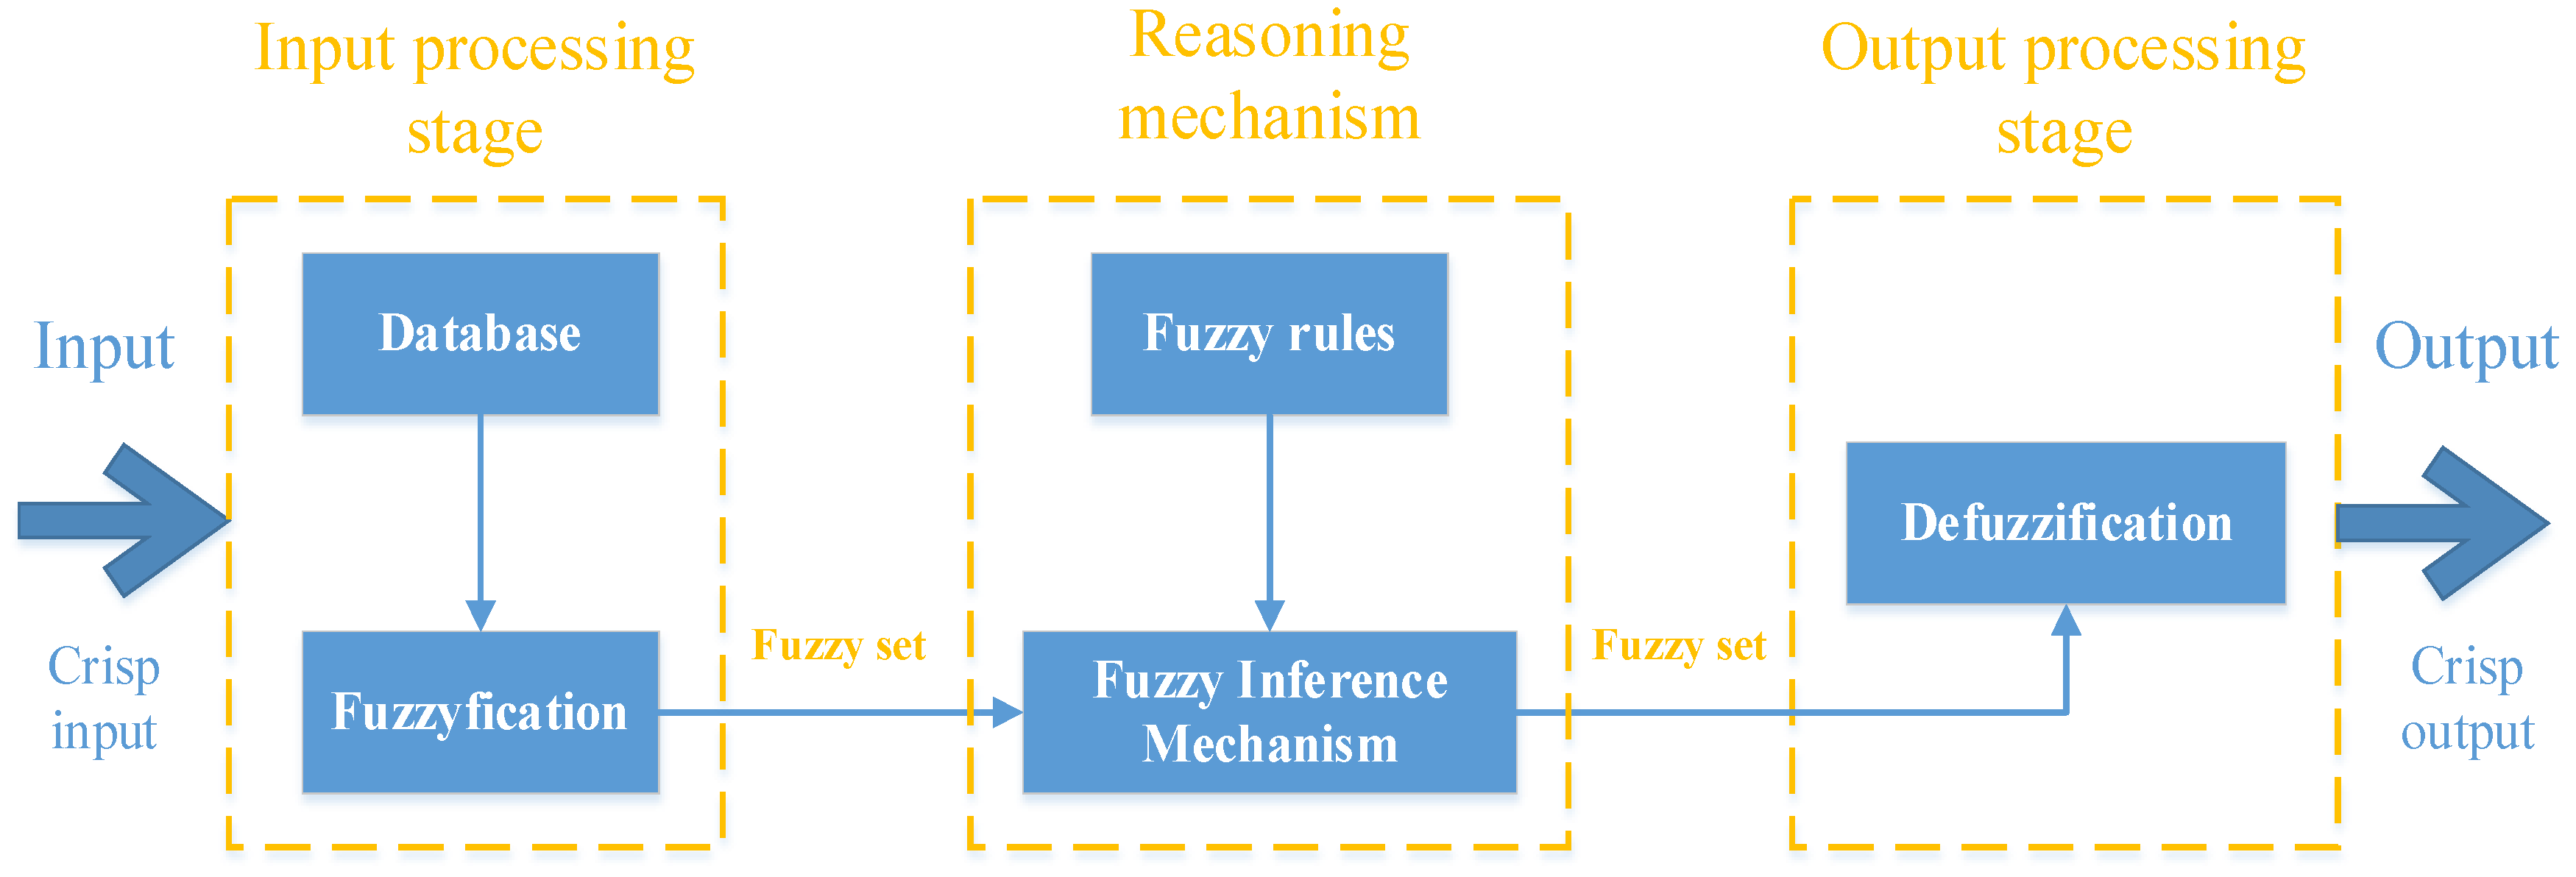
3.4. Fuzzy Inference Systems
- The input processing stage is called fuzzification, where the input variables are transformed into fuzzy sets;
- The reasoning mechanism, which performs the inference procedure based on the pre-defined fuzzy rules and the selected fuzzy inference mechanism to derive a reasonable output or conclusion and;
- In the output processing stage, defuzzification transforms the fuzzy sets resulting from the reasoning mechanism into a crisp value.
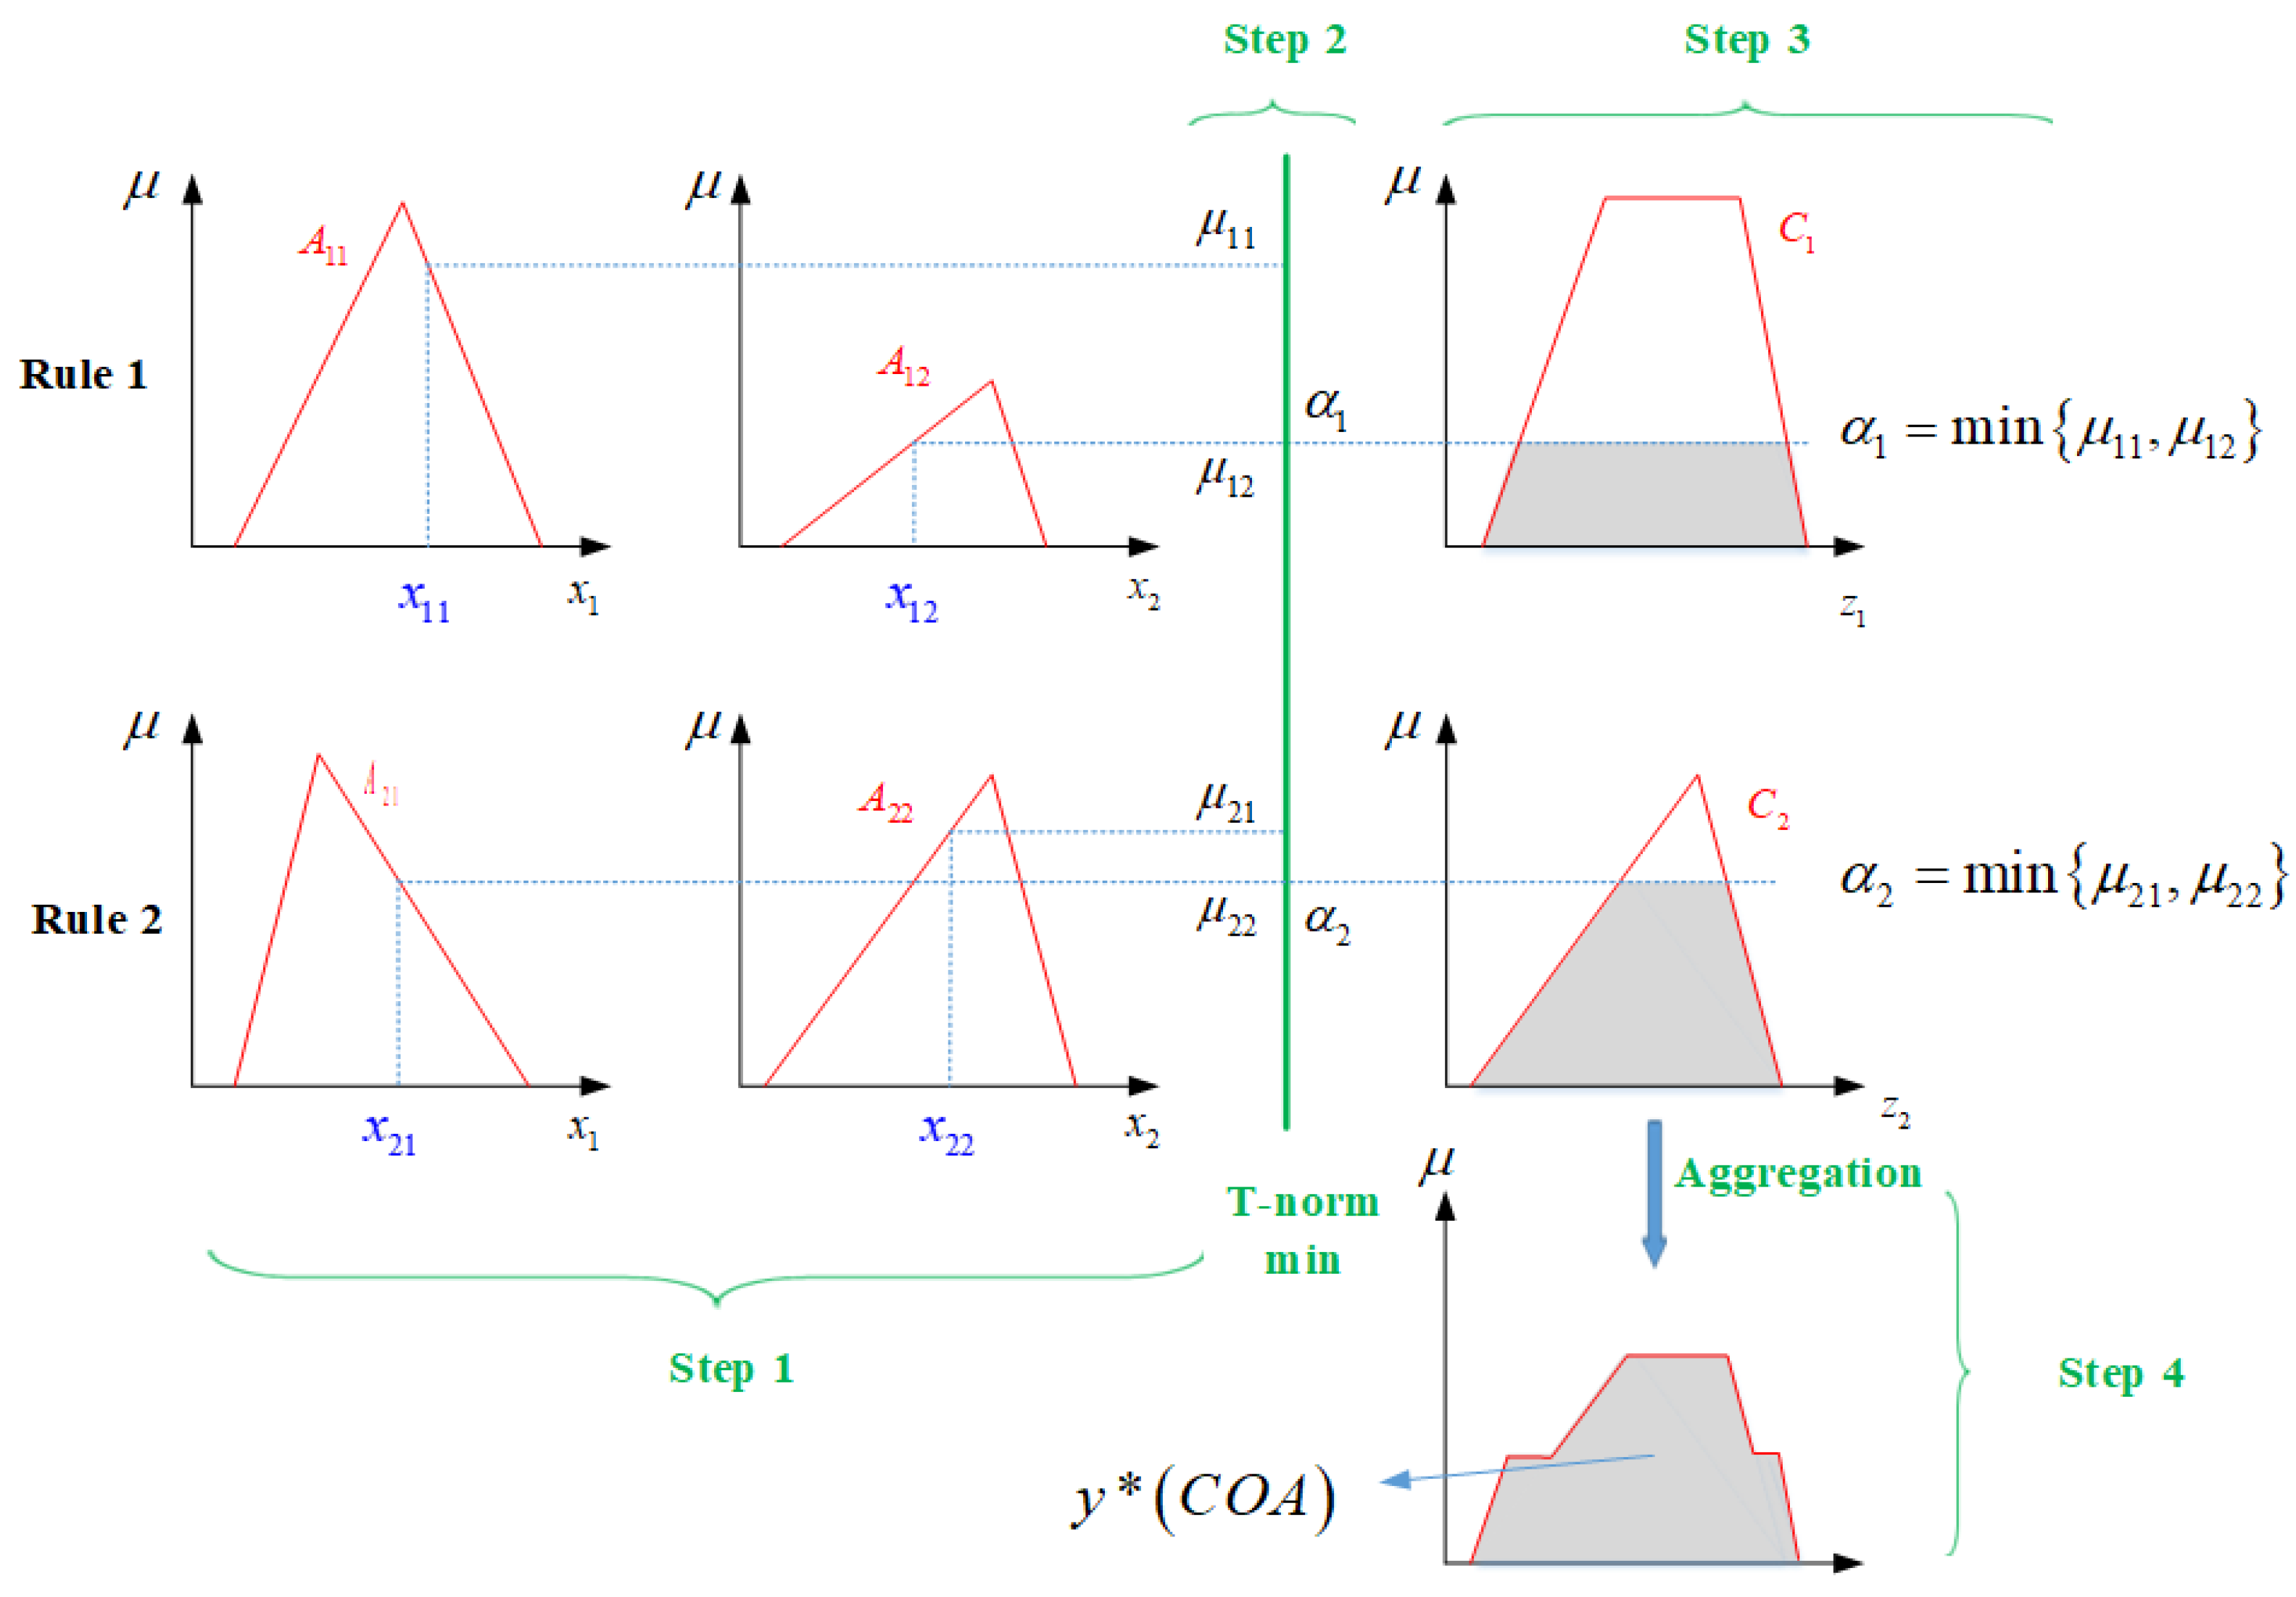
- Step 1: Obtain the membership value for each input variable in the antecedent part of the fuzzy rule. In the example of Figure 4, for Rule 1, the membership value for the input in the fuzzy set is , and the membership value for the input variable in the fuzzy set is . The same analysis is valid for rule 2. This step is known as fuzzification, and the membership functions can be specially defined for the application or taken from a database; this step represents the Input Processing Stage depicted in Figure 3.
- Step 2: Combine the membership values on the antecedent part of each rule through a specific fuzzy operator, usually the minimum min(•) operator or the maximum max(•) operator, to obtain a fuzzy rule’s weight (called firing strength). This step is equivalent to using the AND operator or the OR operator in Boolean logic. If the result of the combination is greater than zero, the rule is “fired,” and its consequent will be computed using this firing strength. In the example of Figure 4, the operator min(•), equivalent to the Boolean operator AND, is used to obtain the minimal value between and , resulting in the rule 1 firing strength . The same analysis is valid for rule 2;
- Step 3: Generate the qualified consequents of each rule by weighting each consequent fuzzy set with the firing strength obtained in step 2. This step is equivalent to the implication (THEN) in Boolean logic. In the example of Figure 4, the fuzzy output rule 1 is weighted by the firing strength . The implication operator, usually the min operator, truncates the consequent’s fuzzy set at the value, obtaining the shaded area in set C1. The same analysis is valid for rule 2.
- Step 4: Aggregate all the qualified consequents to produce the FIS fuzzy output, then this output is defuzzified to obtain the final crisp output. The aggregation process combines all rule’s consequents to obtain a single fuzzy set through an aggregation operator, usually the operator max(•). Defuzzification is the process of extracting a crisp representative value from a fuzzy set. This work considers the centroid of the area, COA, because it is the most popular defuzzification method [34]. In Figure 4, the application of the operator max(•) between the rule’s outputs produces the shaded area, and the application of the operator COA produces the FIS crisp output .
3.5. FMECA Risk Factors Expressed in Fuzzy Terms
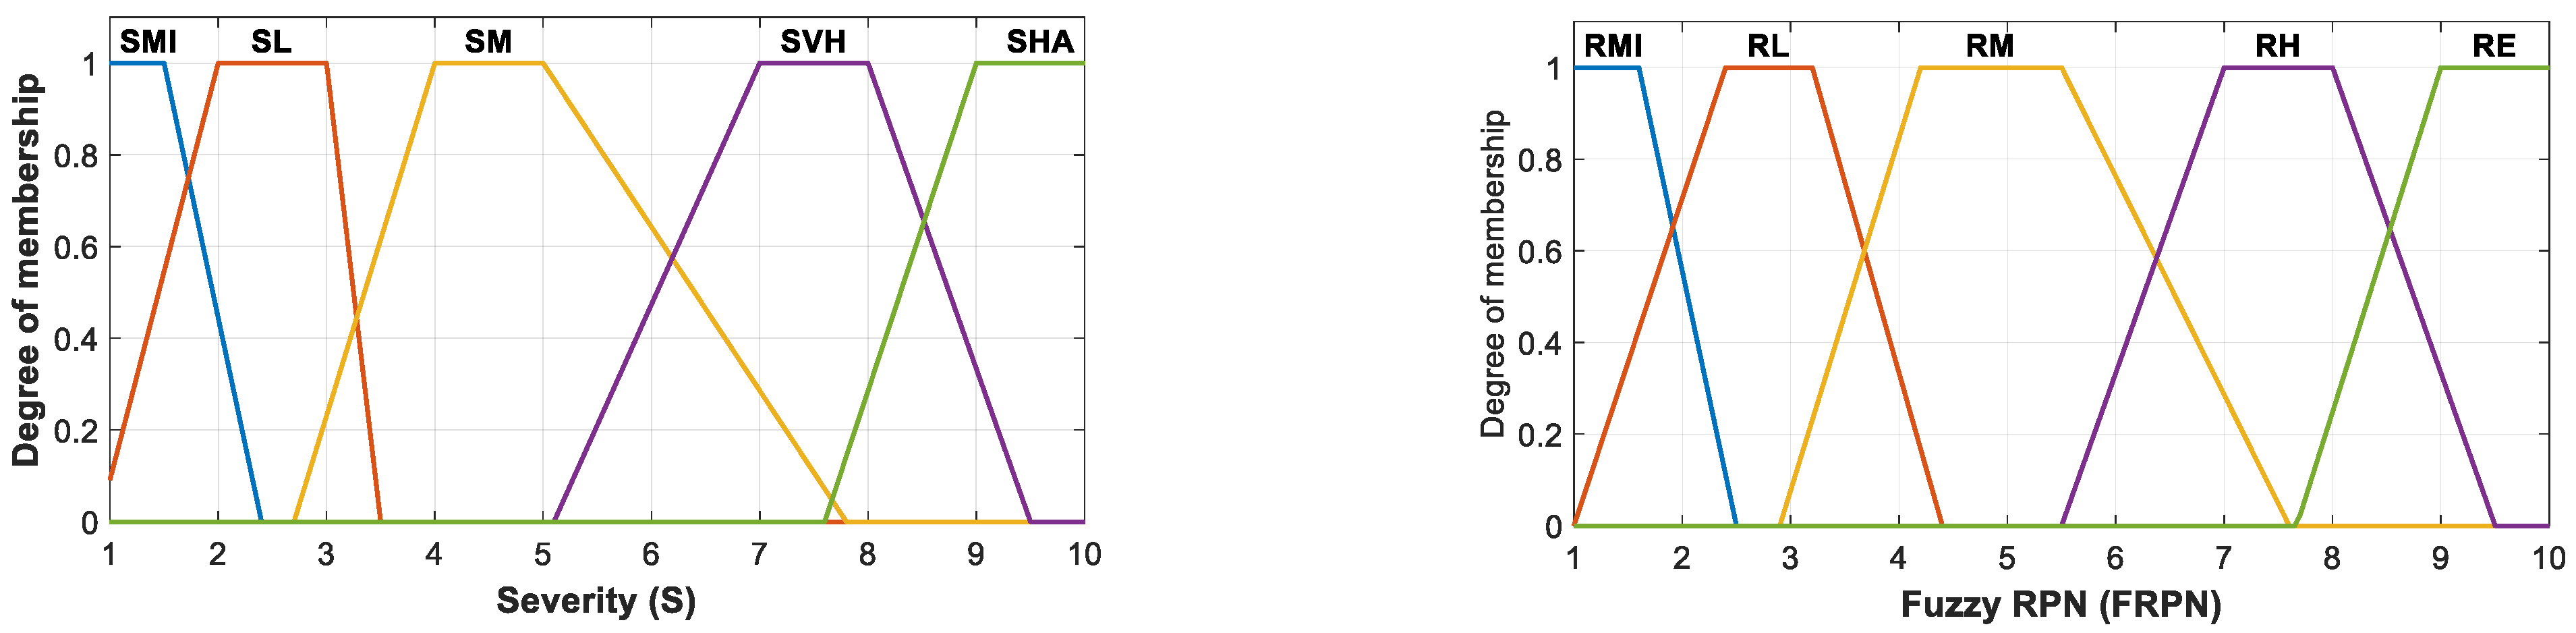
- The Severity categories are as follows: Severity Minor (SMI), Severity Low (SL), Severity Moderate (SM), Severity Very High (SVH), and Severity Hazardous (SH);
- The term-set for Severity T(S) is as follows: ;
- The semantic rule for the term set for Severity is shown in Table 1.
- Regarding Occurrence, we consider the following assumptions:
- The Occurrence categories are the following: Occurrence Remote (OR), Occurrence Very Unlikely (OVU), Occurrence Occasional (OO), Occurrence Probable (OR), and Occurrence Frequent (OF);
- The term-set for Occurrence T(O) is as follows: ;
- The semantic rule for is shown in Table 2.
- The categories for Detection are as follows: Detection Almost Certain (DAC), Detection High (DH), Detection Moderate (DM), Detection Low (DL), and Detection Absolutely Impossible (DAI);
- The term-set for Detection T(D) is as follows: ;
- The semantic rule for is shown in Table 3 as follows:
- The categories for the RPN were defined as follows: Risk Minor (RMI), Risk Low (RL), Risk Moderate (RM), Risk High (RH), and Risk Extreme (RE);
- The term-set for RPN T(RPN) is as follows: ;
- The semantic rule for is shown in Table 4.
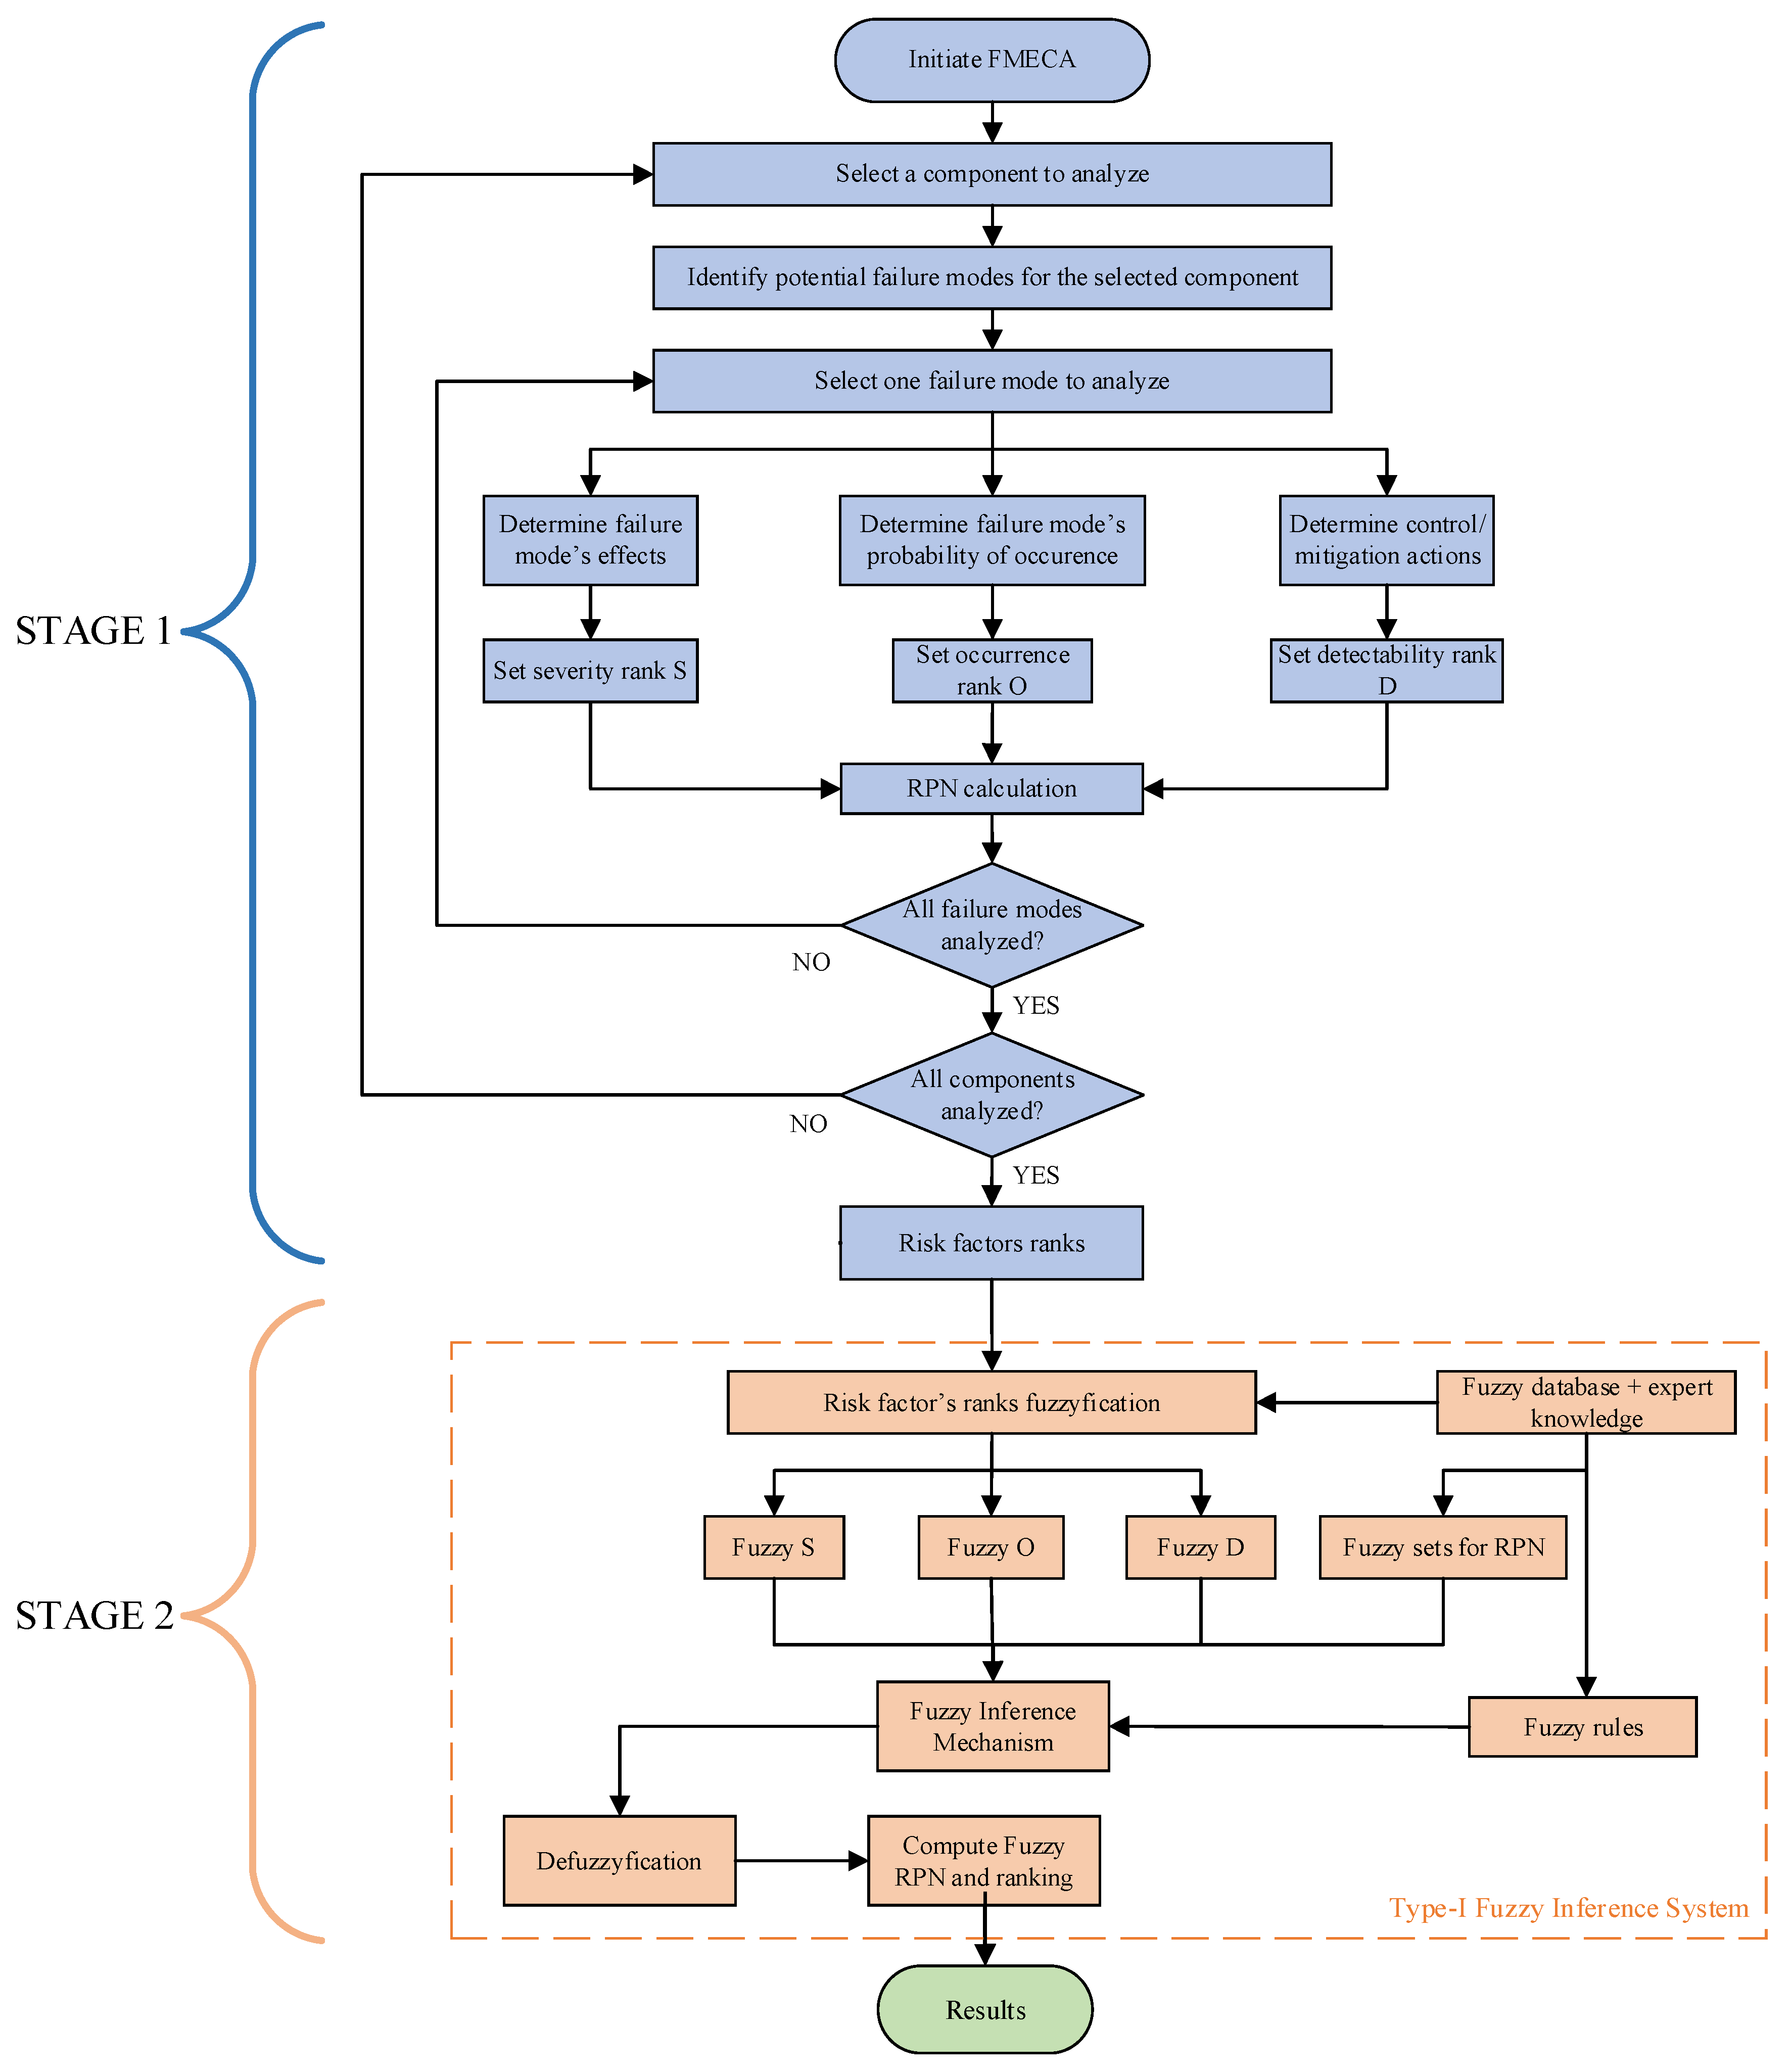
4. Implementation
- Stage 1: The classical FMECA is accomplished first. As a result, one obtains the value of the three risk factors for each failure mode, the failure mode overall risk represented by the RPN computed through the Equation (1), and the failure modes ranking according to Section 1. The steps taken are shown in blue in Figure 5;
- Stage 2: This stage comprises the fuzzy-FMECA. Its steps are shown now in orange in Figure 5. The fuzzy database (composed of the fuzzy sets) and the fuzzy rules are constructed considering the expert criteria of the FMECA team members. Following, using the information of the fuzzy database, the risk factors (S, O, D, and RPN) are fuzzified. The fuzzy risk factors and the fuzzy rules are the input for the fuzzy inference mechanism. Once the inference mechanism is executed, the fuzzy RPN and the failure mode’s ranking are obtained.
4.1. Fuzzy Categories for the FMECA Risk Factors
4.2. Membership Functions for the FMECA Risk Factors
- The functions’ shapes are non-symmetrical to allow different overlapping levels between categories;
- The triangular membership function OR has the lower limit at O = 0 and the upper limit at O = 2.5; the maximum membership value occurs at O = 1.5;
- The triangular membership function OVU has the lower limit at O = 0.8 and the upper limit at O = 4.2; the maximum membership value occurs at O = 2.8, that is, at the mid-point of its respective interval;
- Categories OR and OVU are superposed. When a failure mode’s severity is rated as 1, we can say that it belongs to category OR with membership 0.667 and, simultaneously, to category OVU with membership 0.1. When a failure mode’s occurrence is rated as 2, we can say that it belongs to category OR with a membership of 0.50, and at the same time, it belongs to category OVU with a membership of 0.60. The simultaneous membership of a particular failure mode into two different categories shows the flexibility of the system to represent the vagueness associated with the risk perception of the members of the FMECA team;
- The membership functions for detection were parametrized following the abovementioned criteria.
- Most functions are shaped as non-symmetrical to allow different overlapping levels between categories;
- The trapezoidal membership function SMI has the lower limit at S = 0 and the upper limit at S = 2.4; the maximum membership value occurs between S = 1 and S = 1.5;
- The trapezoidal membership function SL has the lower limit at S = 0.9 and the upper limit at S = 3.5; the maximum membership value occurs between S = 2 and S = 3;
- Categories SMI and SL are superposed. When a failure mode’s severity is rated as 1, we can say that it belongs to category SMI with the maximum membership of 1.0 and, at the same time, it belongs to category SL with a membership of 0.09. When a failure mode’s severity is rated as 2, we can say that it belongs to category SM with the maximum membership of 1.0 and, at the same time, it belongs to category SL with a membership of 0.44;
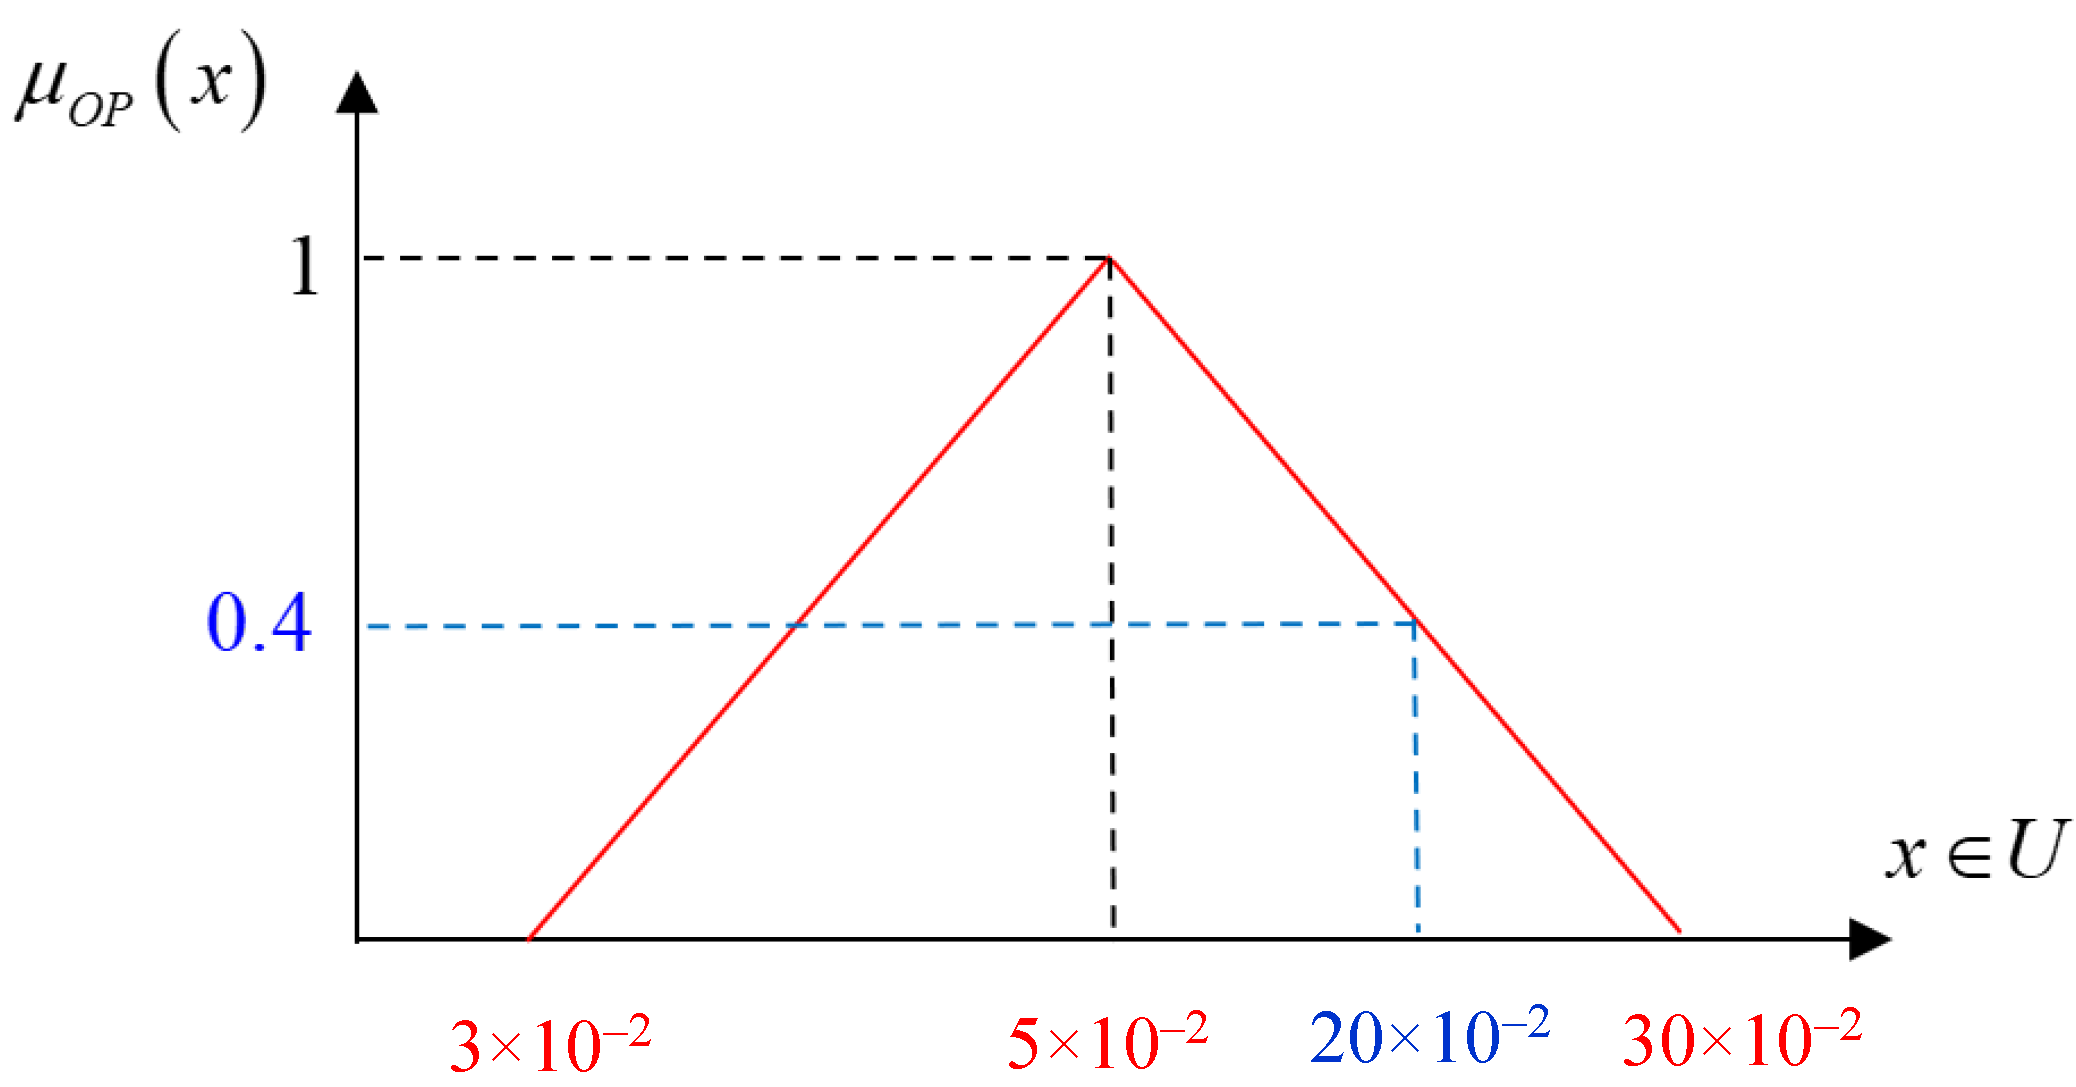
- The membership functions for the FuzzyRPN consider the full membership around the mid-point of each category; as an example, for the risk category RM with limits between 4 and 6, the full membership is achieved when resulting fuzzy RPN are computed between 4.2 and 5.5, and for the risk category RH the full membership is achieved when the resulting RPN are computed between 7 and 8.
4.3. Fuzzy If-Then rules for the Proposed Approach
4.4. Operations for the Type-I Fuzzy Inference System
- “And” method—min;
- “Implication” method—min;
- “Aggregation” method—max;
- Defuzzification—COA;
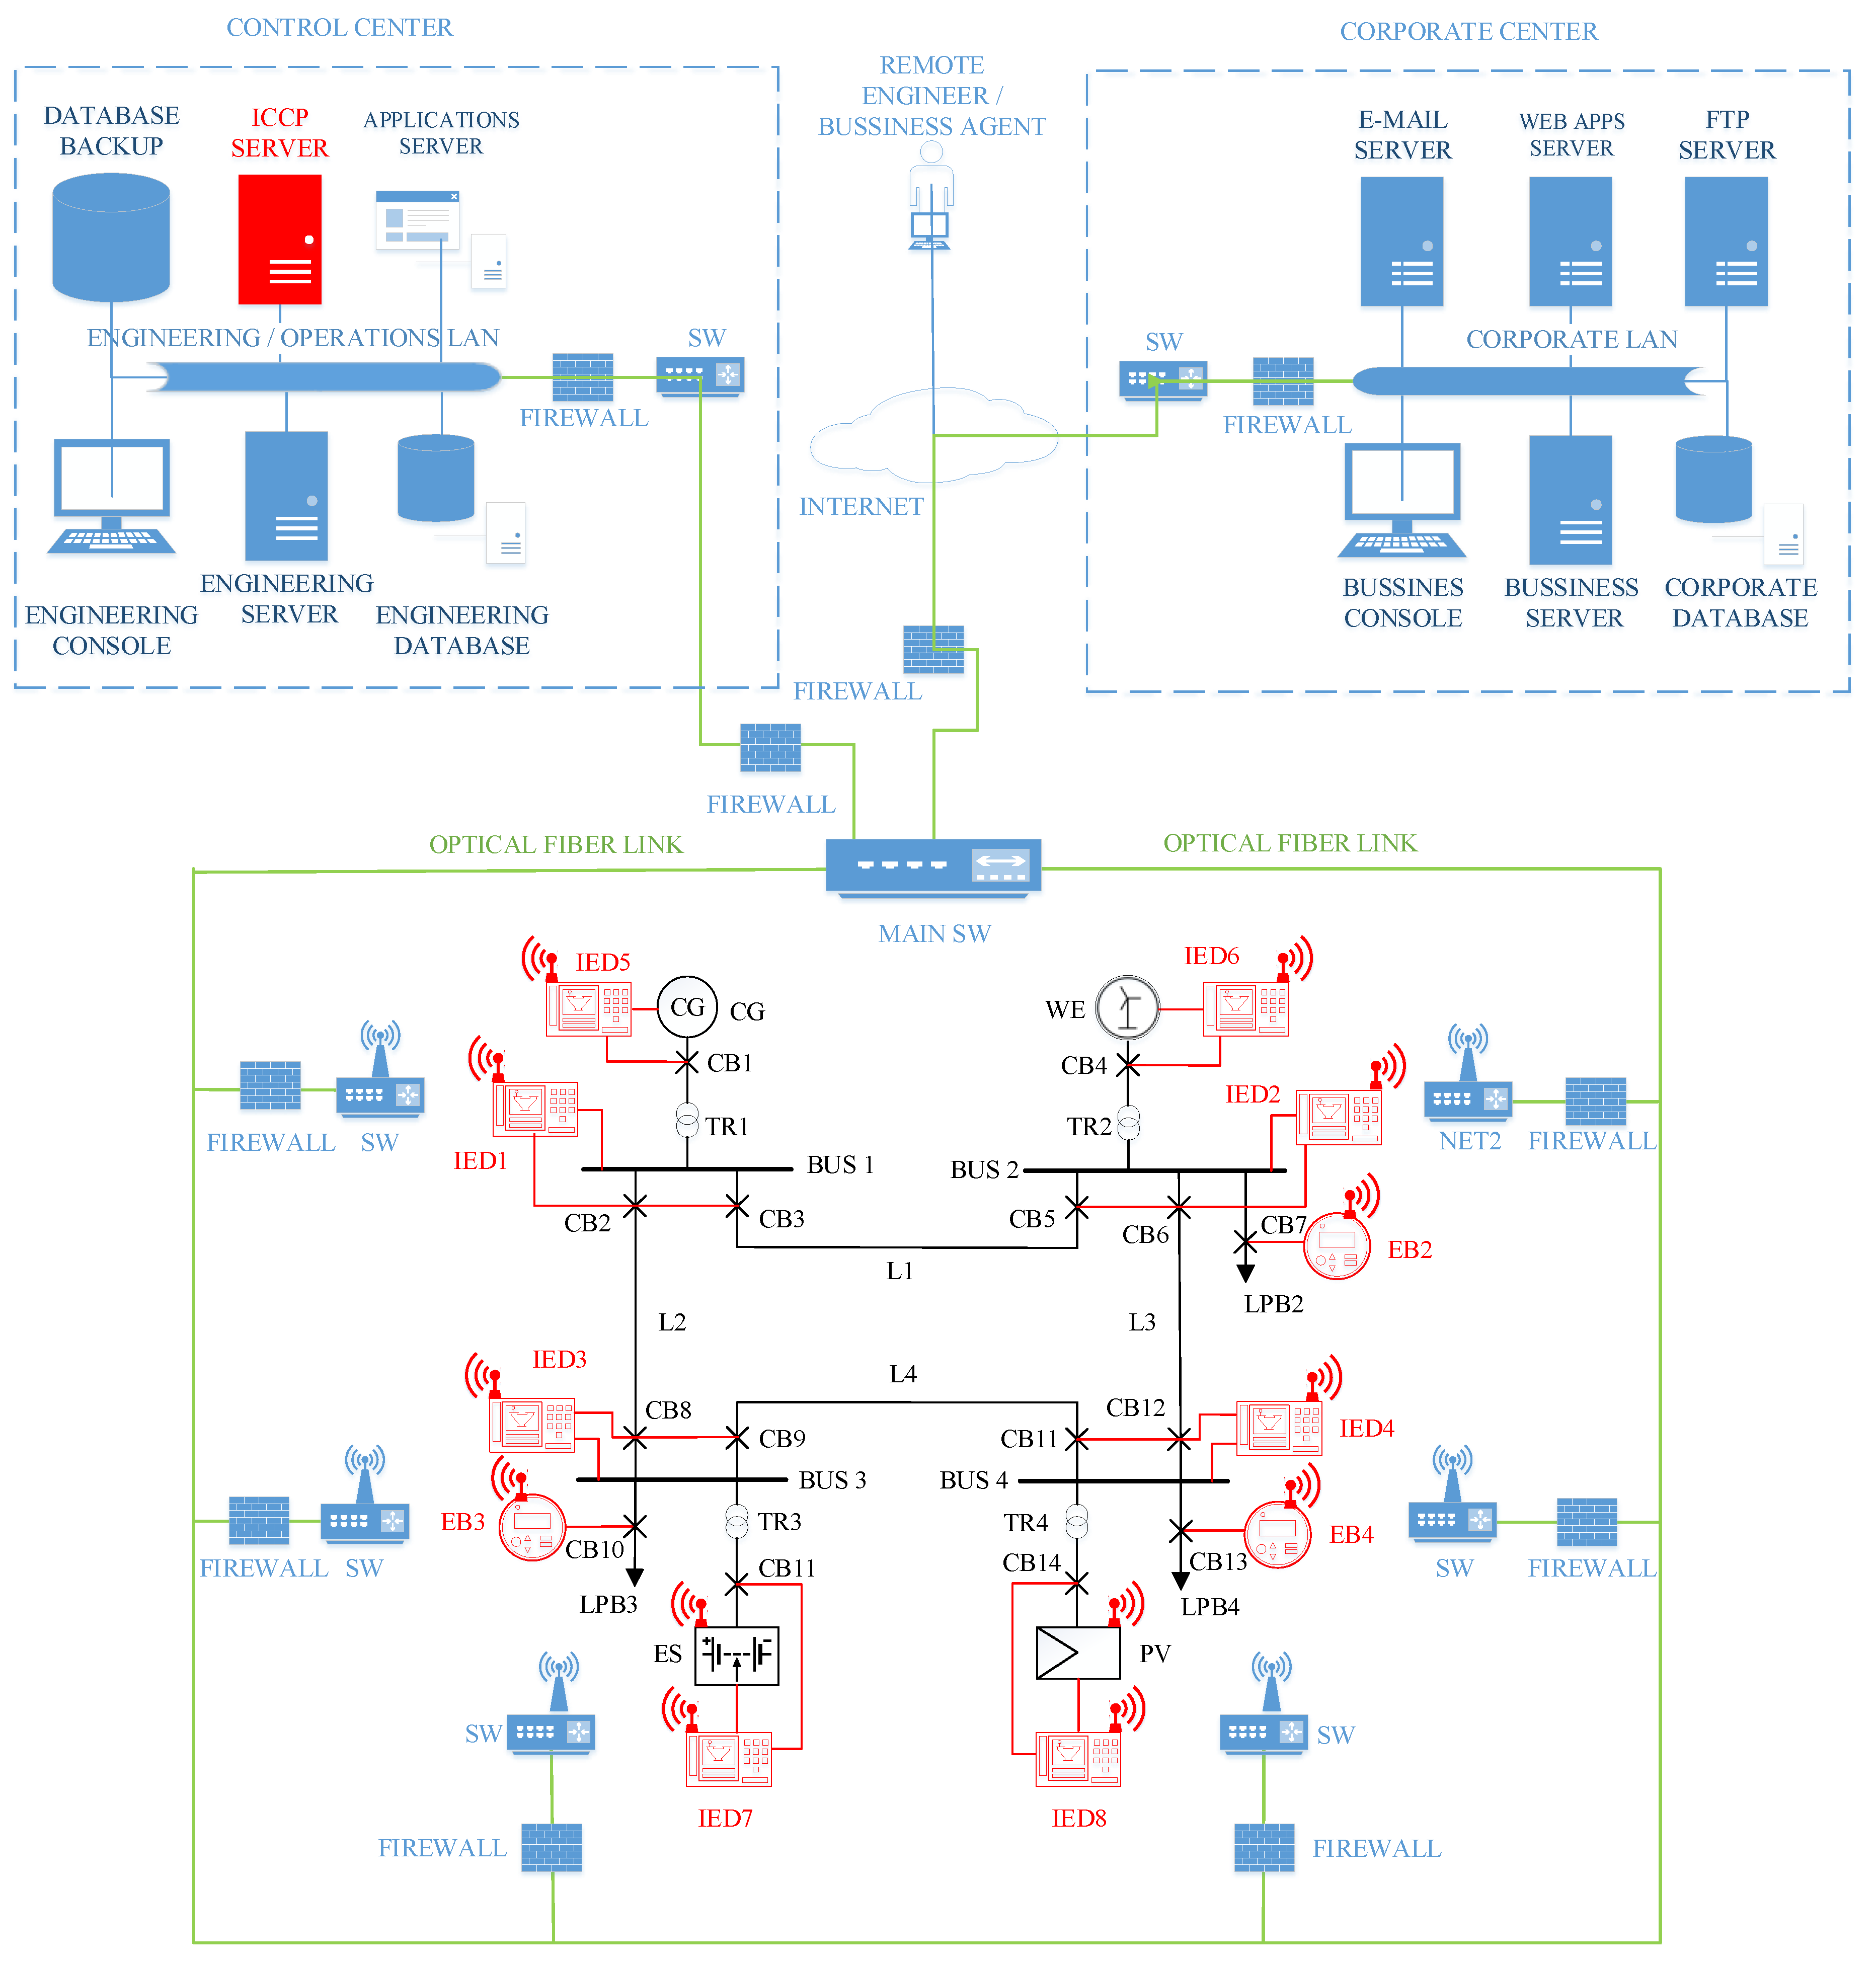
5. Application of the Fuzzy-FMECA Approach to a Cyber-Power Grid
5.1. Cyber-Power Grid Test System
5.2. Membership Functions for the FIS Implemented
6. Results and Discussion
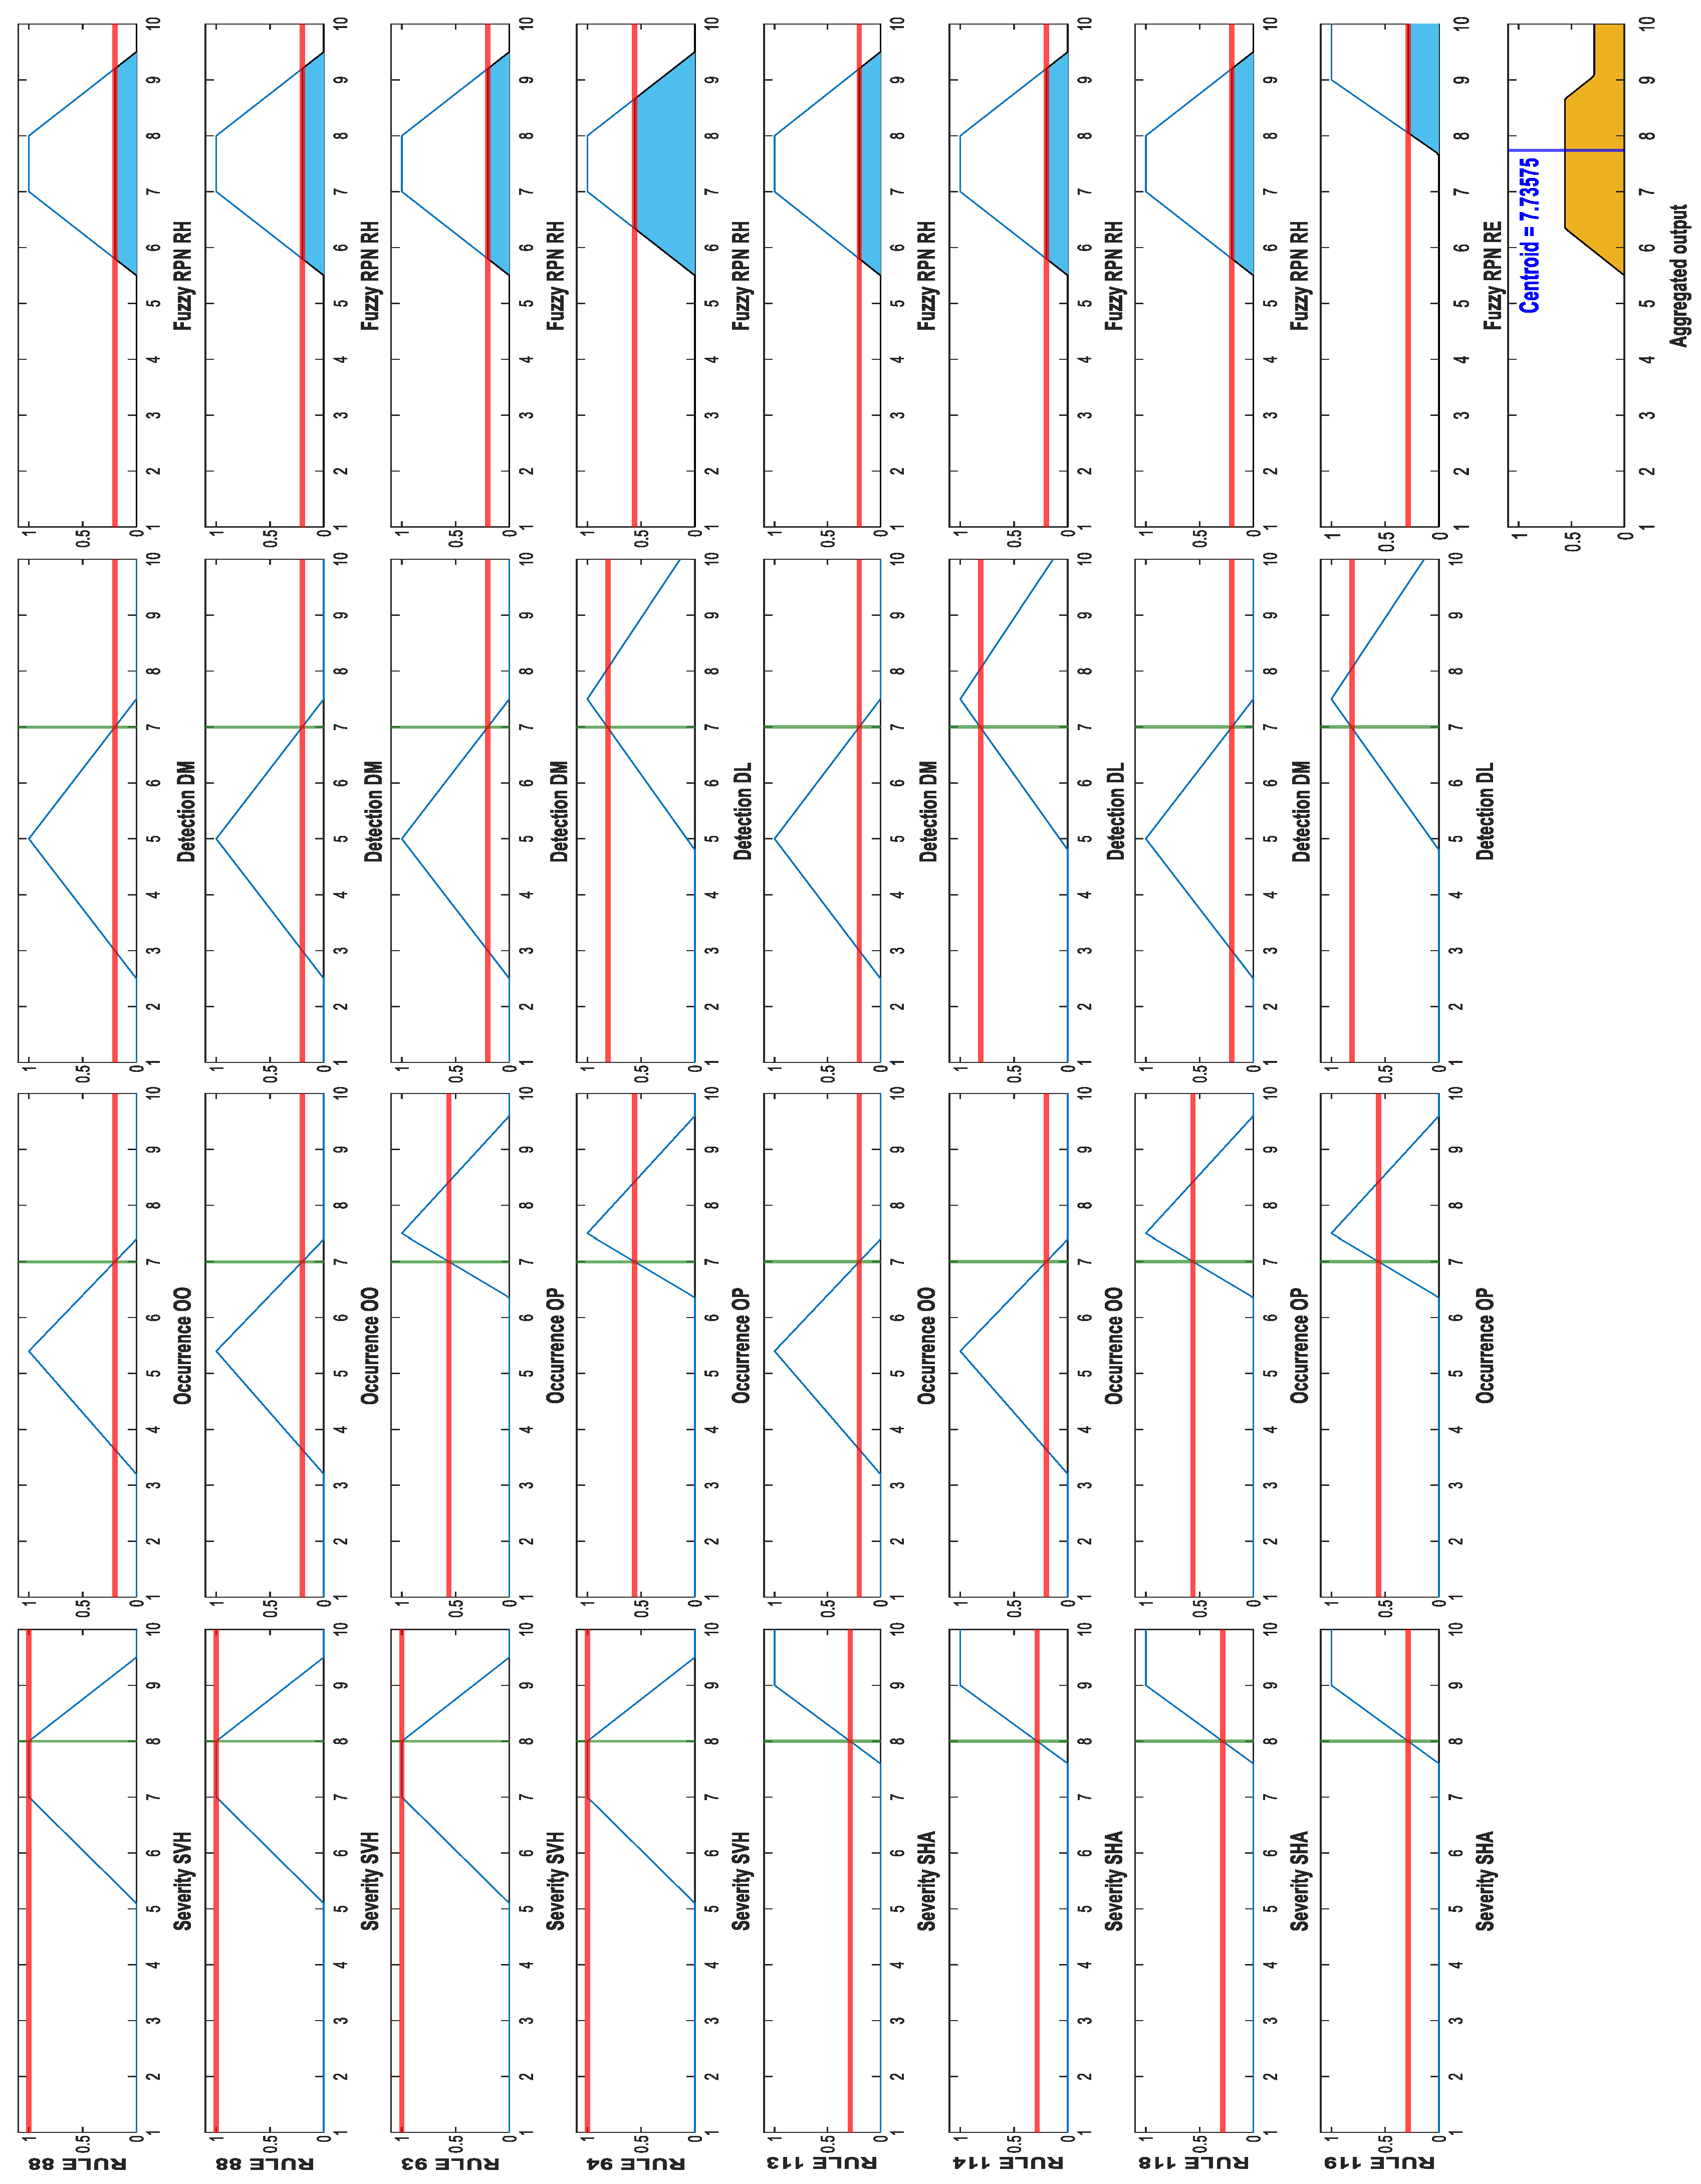
6.1. Classical FMECA × Fuzzy-FMECA: Higher Differences in Prioritization for the Riskiest Failure Modes
- Rule 88: If (S is SVH) and (O is OO) and (D is DM,) then (RPN is RH)
- Rule 89: If (S is SVH) and (O is OO) and (D is DL), then (RPN is RH)
- Rule 93: If (S is SVH) and (O is OP) and (D is DM), then (RPN is RH)
- Rule 94: If (S is SVH) and (O is OP) and (D is DL), then (RPN is RH)
- Rule 113: If (S is SHA) and (O is OO) and (D is DM), then (RPN is RH)
- Rule 114: If (S is SHA) and (O is OO) and (D is DL), then (RPN is RH)
- Rule 118: If (S is SHA) and (O is OP) and (D is DM), then (RPN is RH)
- Rule 119: If (S is SHA) and (O is OP) and (D is DL), then (RPN is RE)
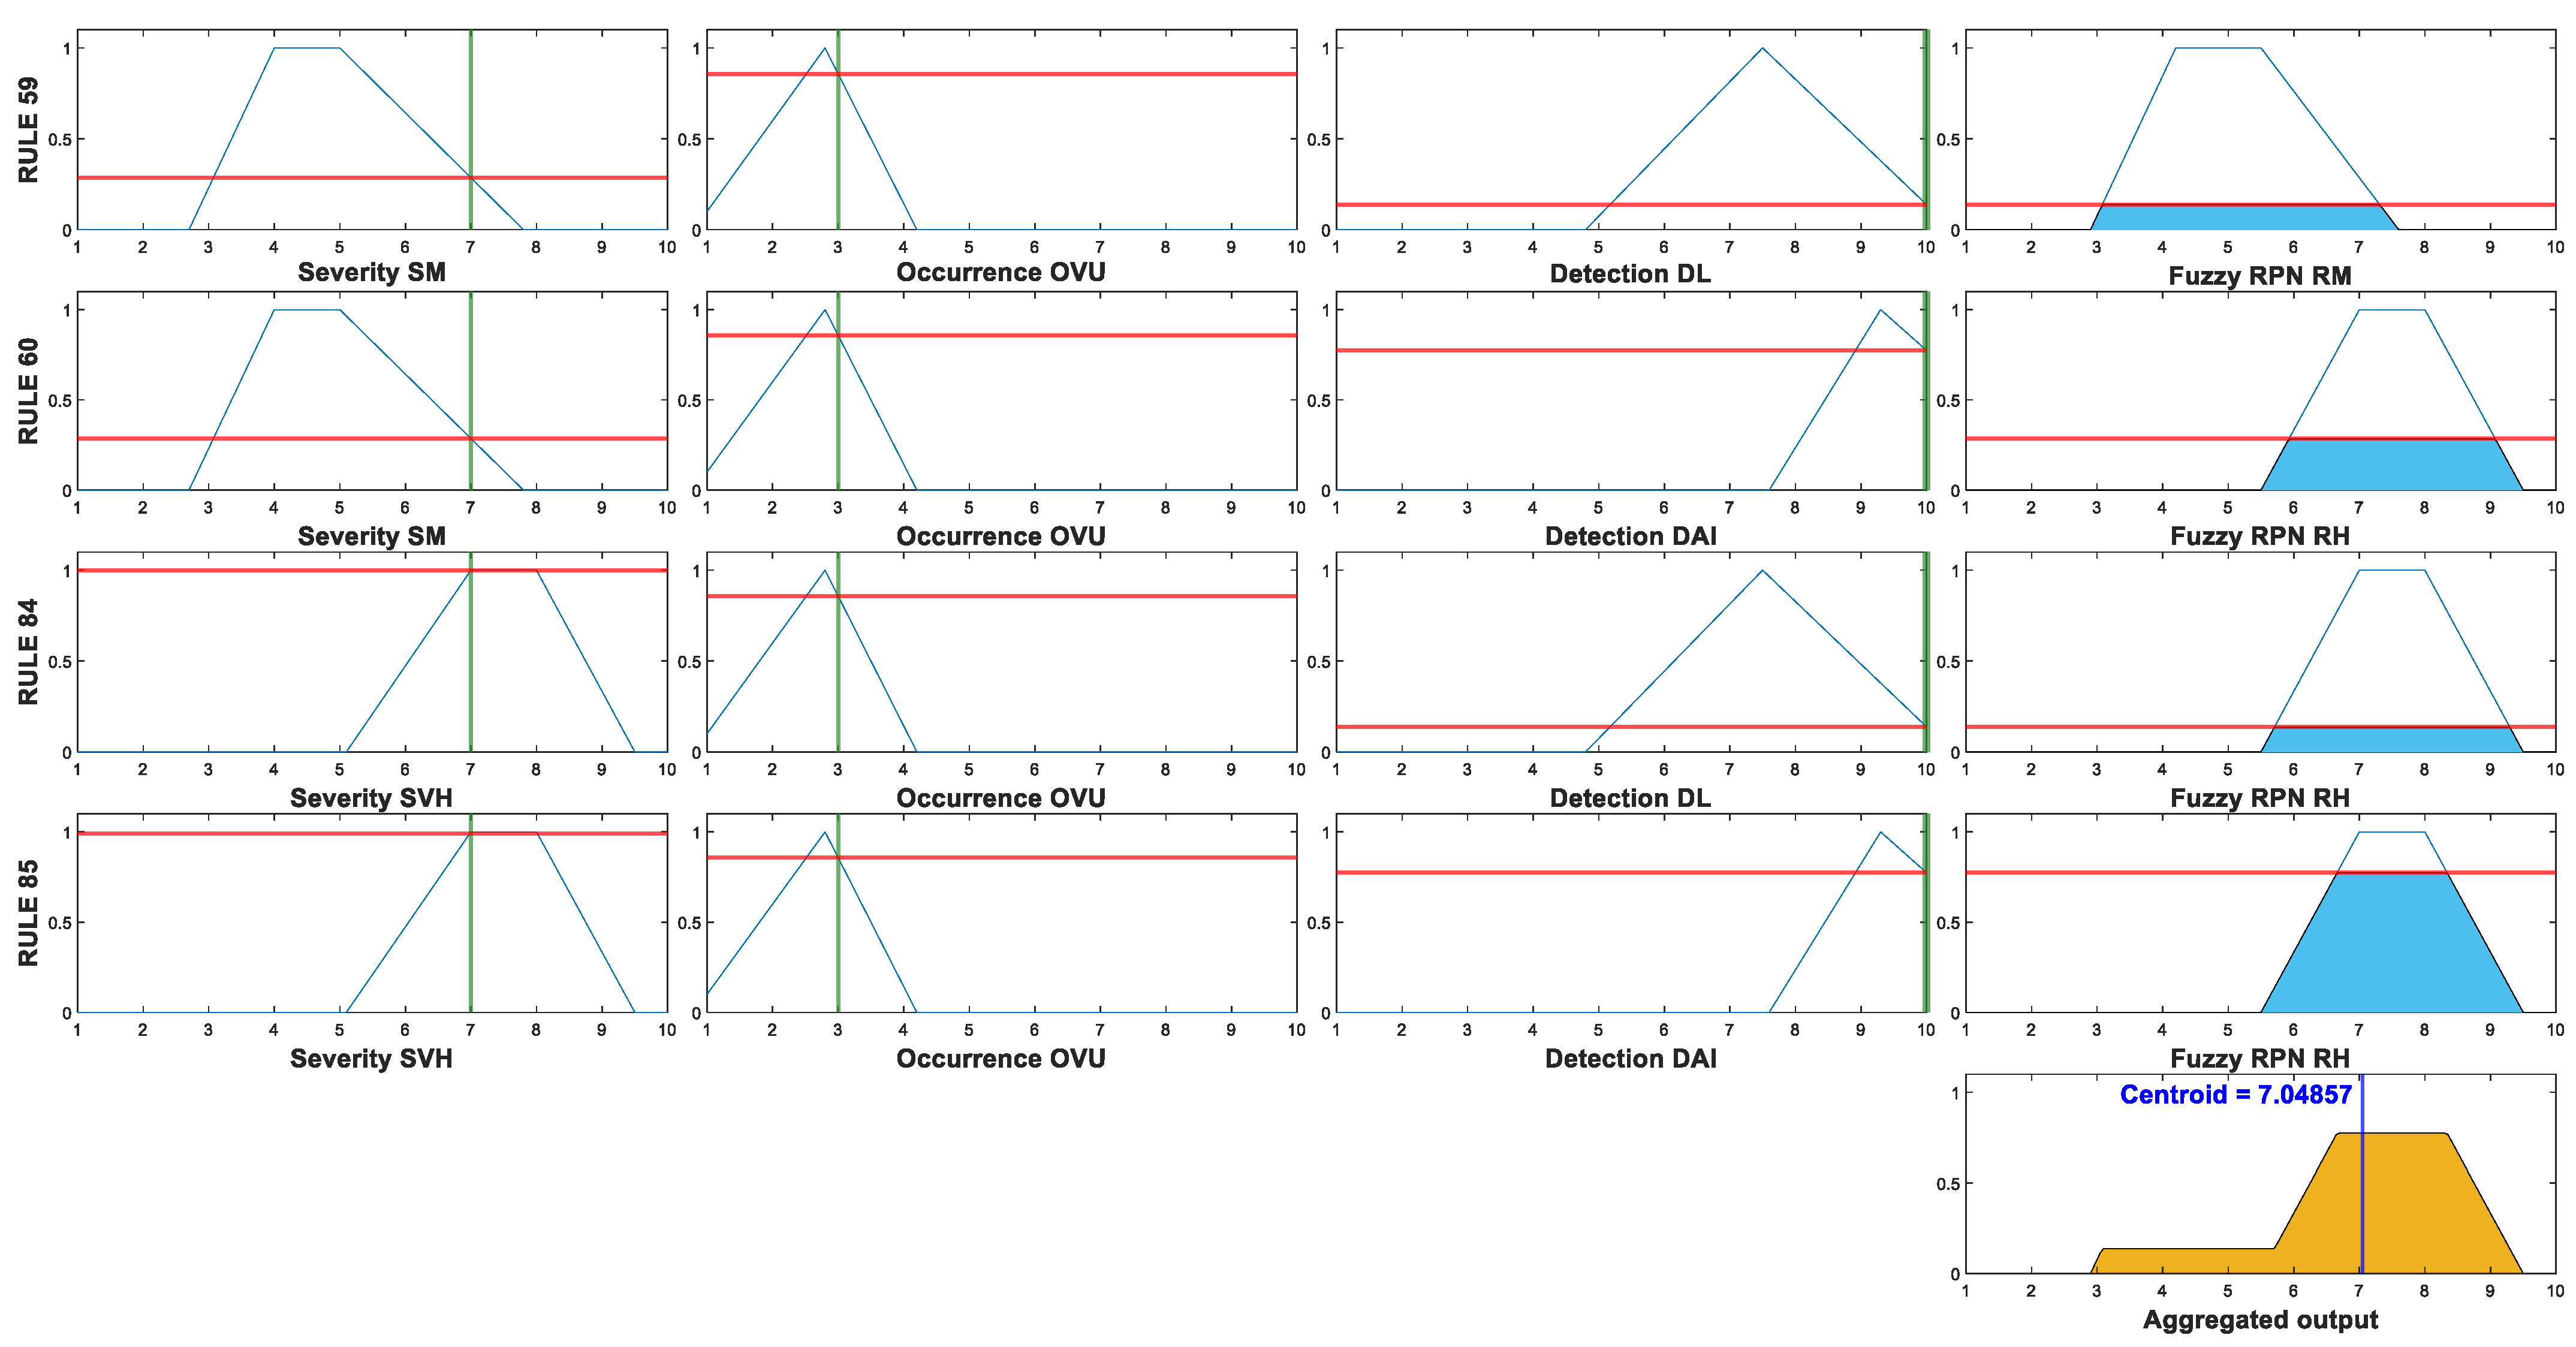
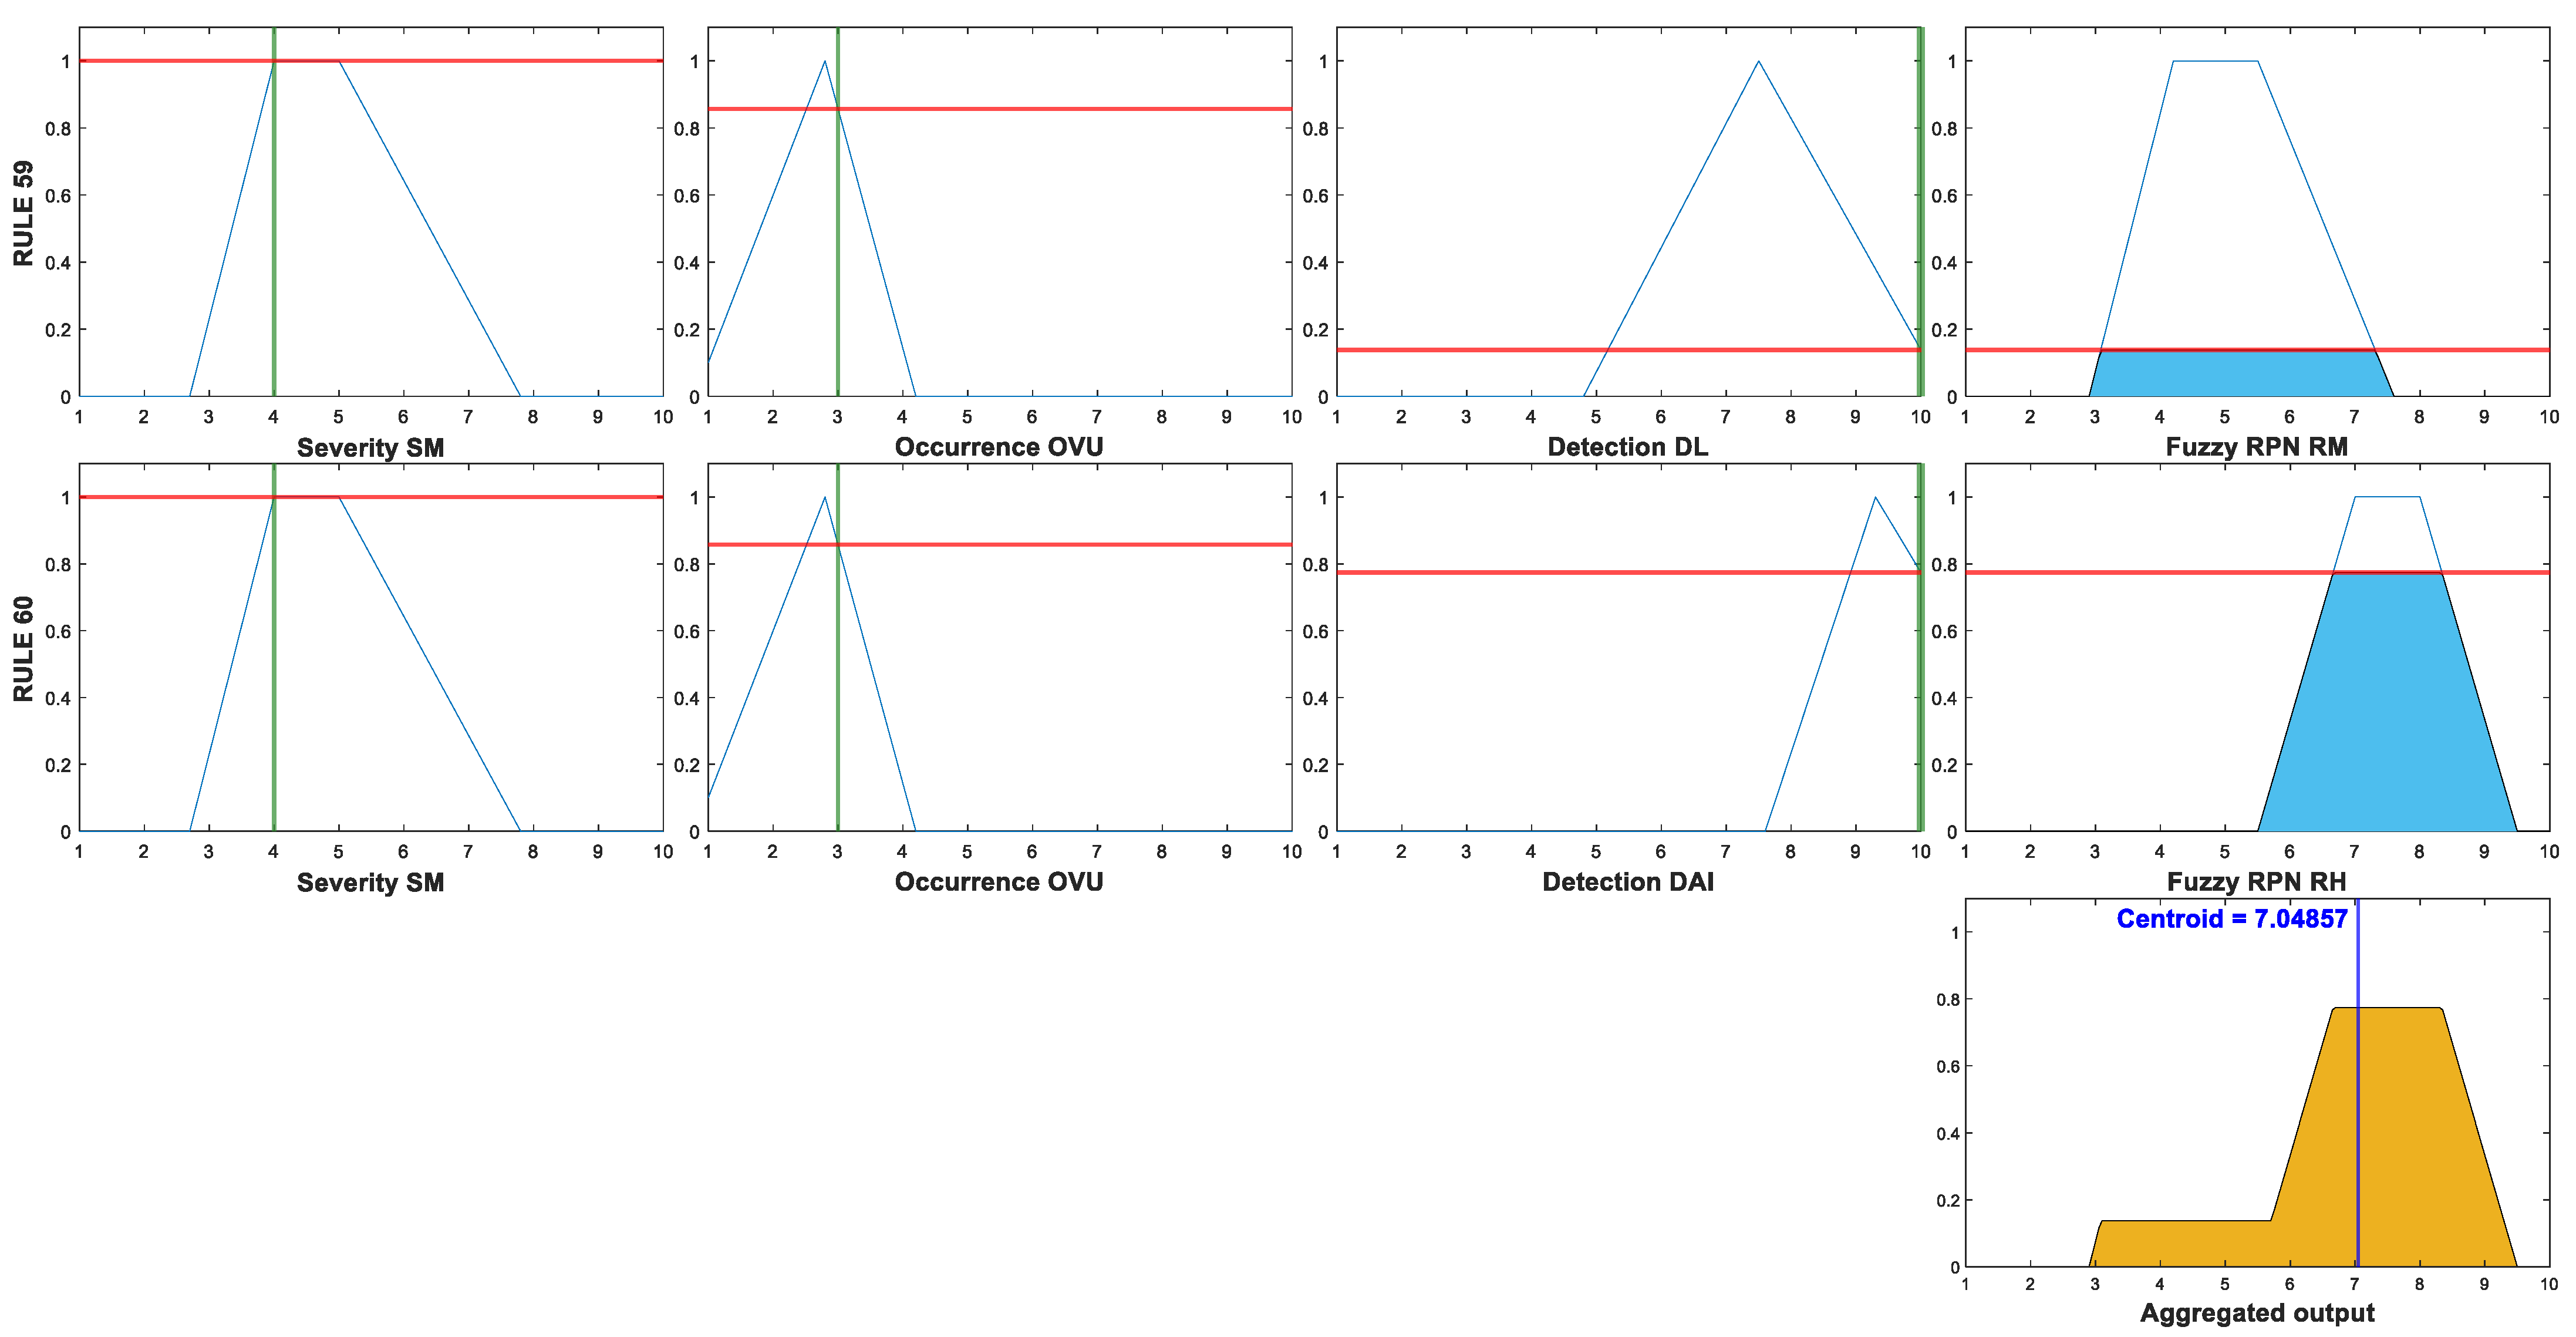
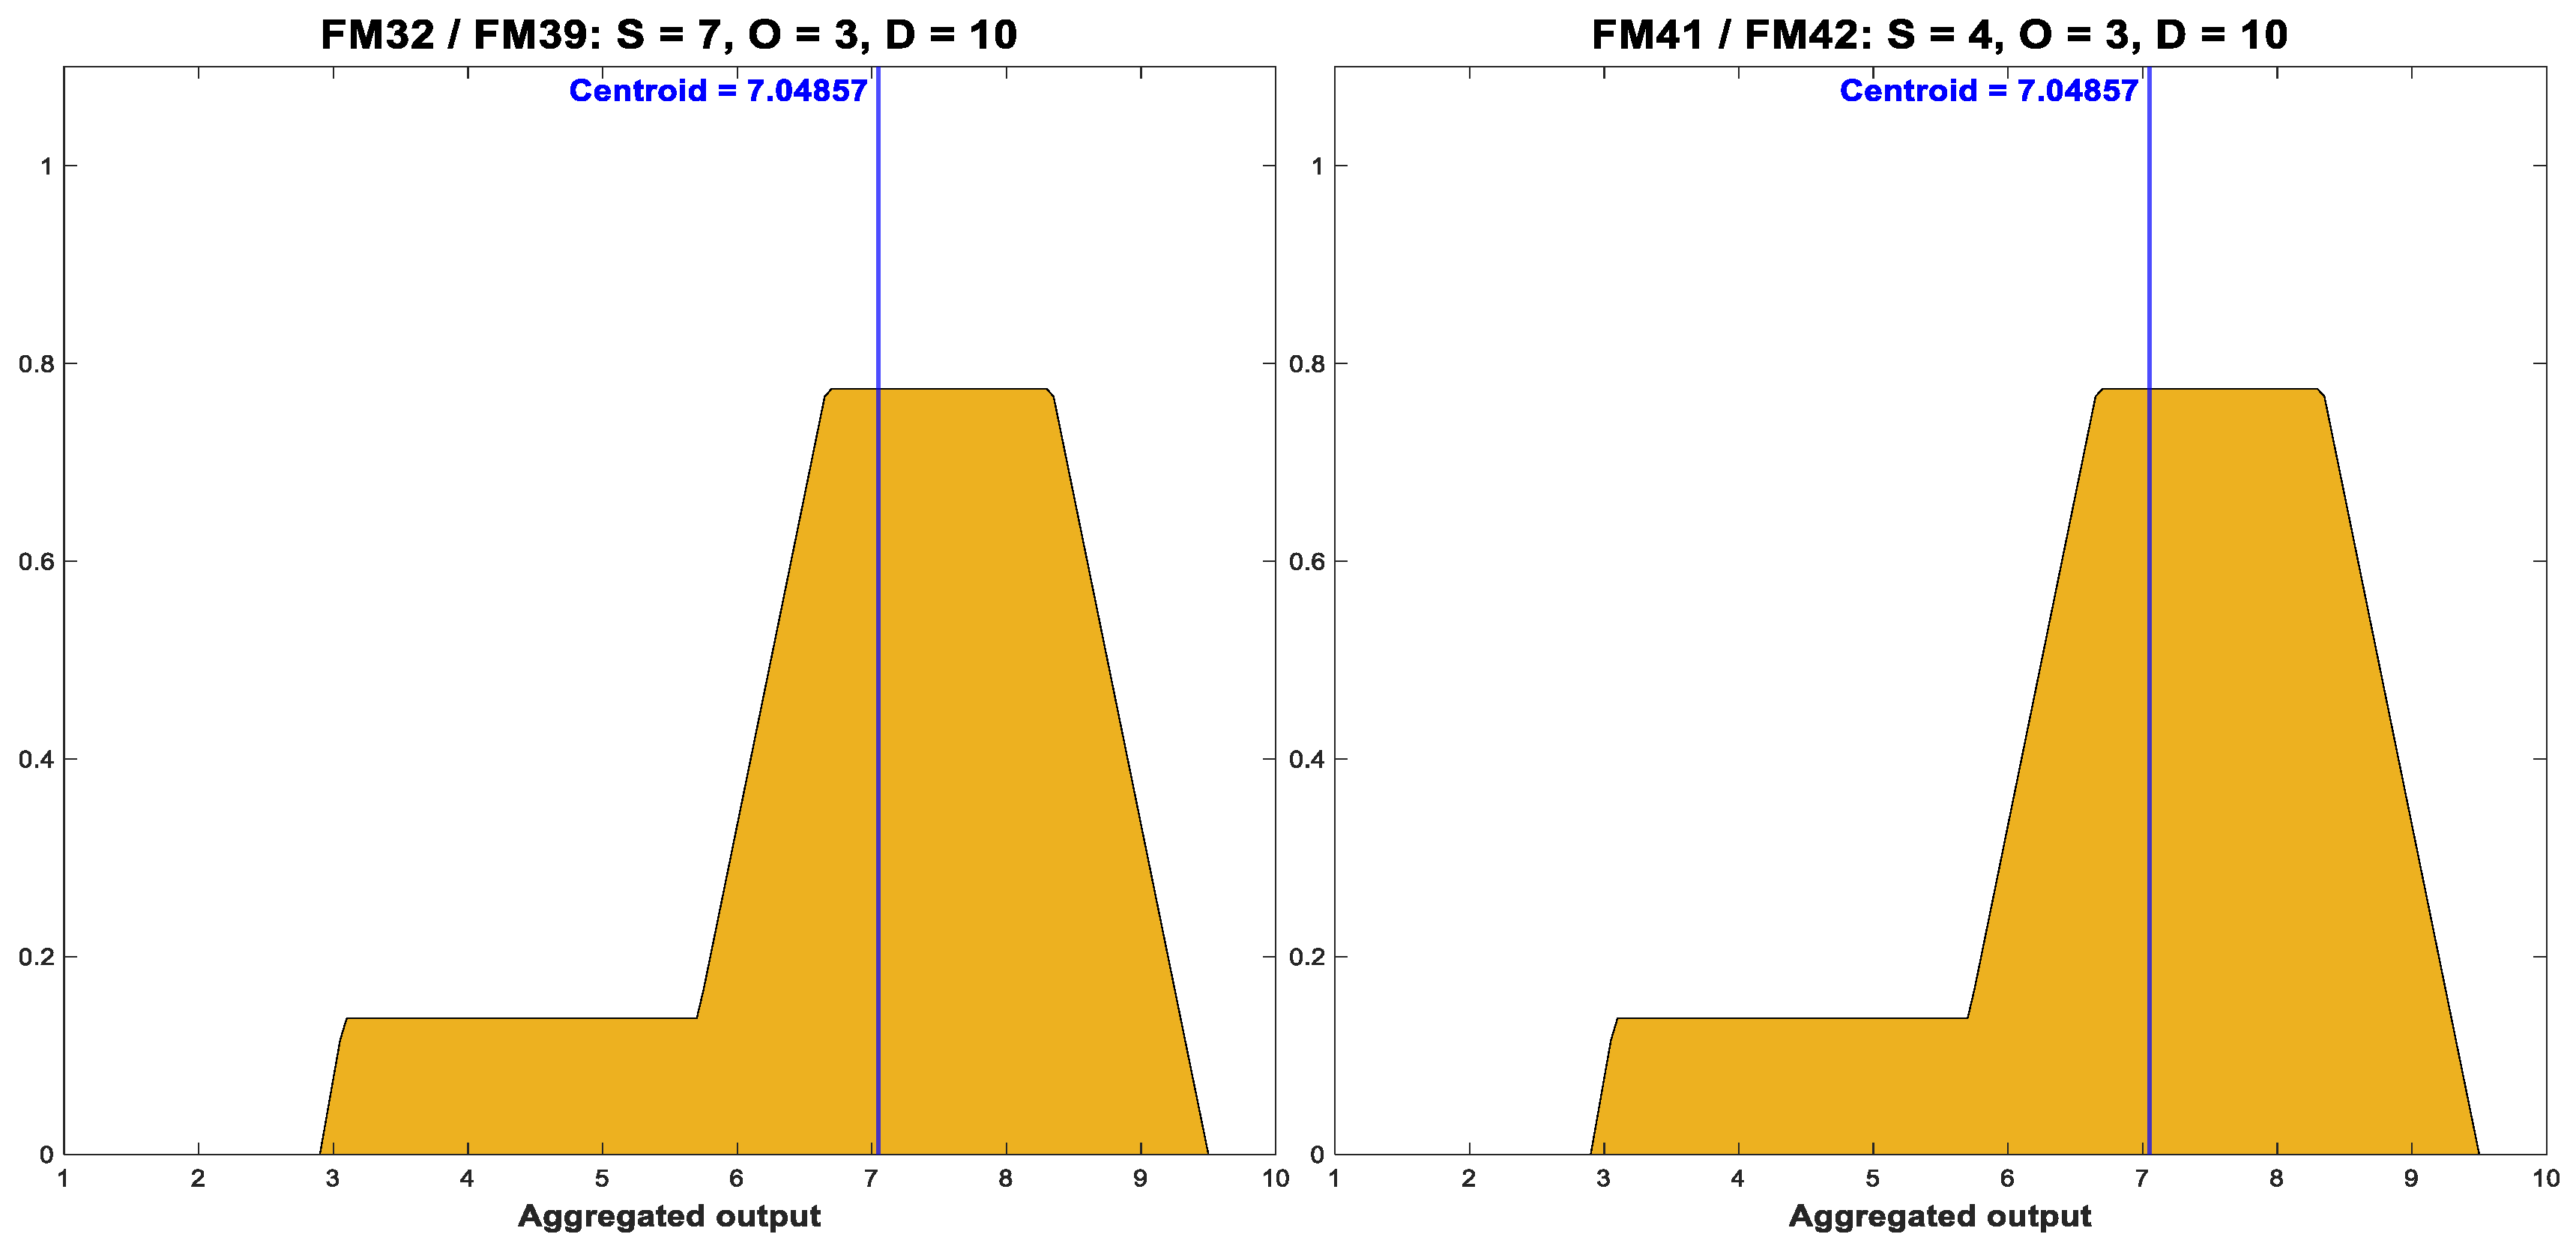
6.2. Classical FMECA × Fuzzy-FMECA: Failure Modes with the Same FRPN
- Rule 59:
- If (S is SM) and (O is OVU) and (D is DL), then (RPN is RM)
- Rule 60:
- If (S is SM) and (O is OVU) and (D is DAI), then (RPN is RH)
- Rule 84:
- If (S is SVH) and (O is OVU) and (D is DL), then (RPN is RH)
- Rule 85:
- If (S is SVH) and (O is OVU) and (D is DAI), then (RPN is RH)
- Rule 59:
- If (S is SM) and (O is OVU) and (D is DL), then (RPN is RM);
- Rule 60:
- If (S is SM) and (O is OVU) and (D is DAI), then (RPN is RH).
- Establish individual categories for the risk factors rankings, that is, ten categories instead of 5;
- Adjusting the overlapping between fuzzy categories and;
- Adjust the membership function parameters or use non-linear membership functions.
7. Conclusions
- The use of integers-based classical rankings to assess the three risk factors restricts the exploitation of all fuzzy features of the proposed method;
- The limits of the risk categories of the classic FMECA analysis were taken from IEC standards. They may not adequately represent the risk thresholds in real cases and should be calibrated with experimental data, and;
- The use of 5 risk categories can constrain the diversity to represent the risk criteria of the experts.
- Definition of tailor-made risk categories and scales for the FMECA risk factors in the context of cyber-power grids;
- The use of ten risk categories to represent the risk factors;
- A sensibility analysis of the overlapping between the membership functions;
- The use of non-linear membership functions;
- The application of Type-II fuzzy inference systems for the fuzzy-FMECA analysis in cyber-power grids and;
- The proposal for a statistical-based comparison method for different FMECA approaches.
Author Contributions
Funding
Data Availability Statement
Conflicts of Interest
Appendix A
- If (S is SMI) and (O is OR) and (D is DAC), then (RPN is RMI)
- If (S is SMI) and (O is OR) and (D is DH), then (RPN is RMI)
- If (S is SMI) and (O is OR) and (D is DM,) then (RPN is RL)
- If (S is SMI) and (O is OR) and (D is DL), then (RPN is RL)
- If (S is SMI) and (O is OR) and (D is DAI,) then (RPN is RM)
- If (S is SMI) and (O is OVU) and (D is DAC), then (RPN is RMI)
- If (S is SMI) and (O is OVU) and (D is DH), then (RPN is RMI)
- If (S is SMI) and (O is OVU) and (D is DM), then (RPN is RL)
- If (S is SMI) and (O is OVU) and (D is DL), then (RPN is RL)
- If (S is SMI) and (O is OVU) and (D is DAI), then (RPN is RM)
- If (S is SMI) and (O is OO) and (D is DAC), then (RPN is RMI)
- If (S is SMI) and (O is OO) and (D is DH), then (RPN is RL)
- If (S is SMI) and (O is OO) and (D is DM), then (RPN is RL)
- If (S is SMI) and (O is OO) and (D is DL), then (RPN is RM)
- If (S is SMI) and (O is OO) and (D is DAI), then (RPN is RH)
- If (S is SMI) and (O is OP) and (D is DAC), then (RPN is RMI)
- If (S is SMI) and (O is OP) and (D is DH), then (RPN is RL)
- If (S is SMI) and (O is OP) and (D is DM), then (RPN is RL)
- If (S is SMI) and (O is OP) and (D is DL), then (RPN is RM)
- If (S is SMI) and (O is OP) and (D is DAI), then (RPN is RH)
- If (S is SMI) and (O is OF) and (D is DAC), then (RPN is RL)
- If (S is SMI) and (O is OF) and (D is DH), then (RPN is RL)
- If (S is SMI) and (O is OF) and (D is DM), then (RPN is RM)
- If (S is SMI) and (O is OF) and (D is DL), then (RPN is RH)
- If (S is SMI) and (O is OF) and (D is DAI), then (RPN is RH)
- If (S is SL) and (O is OR) and (D is DAC), then (RPN is RMI)
- If (S is SL) and (O is OR) and (D is DH), then (RPN is RMI)
- If (S is SL) and (O is OR) and (D is DM), then (RPN is RL)
- If (S is SL) and (O is OR) and (D is DL), then (RPN is RL)
- If (S is SL) and (O is OR) and (D is DAI), then (RPN is RM)
- If (S is SL) and (O is OVU) and (D is DAC), then (RPN is RMI)
- If (S is SL) and (O is OVU) and (D is DH), then (RPN is RL)
- If (S is SL) and (O is OVU) and (D is DM), then (RPN is RL)
- If (S is SL) and (O is OVU) and (D is DL), then (RPN is RM)
- If (S is SL) and (O is OVU) and (D is DAI), then (RPN is RH)
- If (S is SL) and (O is OO) and (D is DAC), then (RPN is RMI)
- If (S is SL) and (O is OO) and (D is DH), then (RPN is RL)
- If (S is SL) and (O is OO) and (D is DM), then (RPN is RL)
- If (S is SL) and (O is OO) and (D is DL), then (RPN is RM)
- If (S is SL) and (O is OO) and (D is DAI), then (RPN is RH)
- If (S is SL) and (O is OP) and (D is DAC), then (RPN is RL)
- If (S is SL) and (O is OP) and (D is DH), then (RPN is RL)
- If (S is SL) and (O is OP) and (D is DM), then (RPN is RM)
- If (S is SL) and (O is OP) and (D is DL), then (RPN is RH)
- If (S is SL) and (O is OP) and (D is DAI), then (RPN is RH)
- If (S is SL) and (O is OF) and (D is DAC), then (RPN is RL)
- If (S is SL) and (O is OF) and (D is DH), then (RPN is RM)
- If (S is SL) and (O is OF) and (D is DM), then (RPN is RH)
- If (S is SL) and (O is OF) and (D is DL), then (RPN is RH)
- If (S is SL) and (O is OF) and (D is DAI), then (RPN is RE)
- If (S is SM) and (O is OR) and (D is DAC), then (RPN is RMI)
- If (S is SM) and (O is OR) and (D is DH), then (RPN is RL)
- If (S is SM) and (O is OR) and (D is DM), then (RPN is RL)
- If (S is SM) and (O is OR) and (D is DL), then (RPN is RM)
- If (S is SM) and (O is OR) and (D is DAI), then (RPN is RH)
- If (S is SM) and (O is OVU) and (D is DAC), then (RPN is RMI)
- If (S is SM) and (O is OVU) and (D is DH), then (RPN is RL)
- If (S is SM) and (O is OVU) and (D is DM), then (RPN is RL)
- If (S is SM) and (O is OVU) and (D is DL), then (RPN is RM)
- If (S is SM) and (O is OVU) and (D is DAI), then (RPN is RH)
- If (S is SM) and (O is OO) and (D is DAC), then (RPN is RL)
- If (S is SM) and (O is OO) and (D is DH), then (RPN is RL)
- If (S is SM) and (O is OO) and (D is DM), then (RPN is RM)
- If (S is SM) and (O is OO) and (D is DL), then (RPN is RH)
- If (S is SM) and (O is OO) and (D is DAI), then (RPN is RH)
- If (S is SM) and (O is OP) and (D is DAC), then (RPN is RL)
- If (S is SM) and (O is OP) and (D is DH), then (RPN is RM)
- If (S is SM) and (O is OP) and (D is DM), then (RPN is RH)
- If (S is SM) and (O is OP) and (D is DL), then (RPN is RH)
- If (S is SM) and (O is OP) and (D is DAI), then (RPN is RE)
- If (S is SM) and (O is OF) and (D is DAC) then (RPN is RL)
- If (S is SM) and (O is OF) and (D is DH), then (RPN is RM)
- If (S is SM) and (O is OF) and (D is DM), then (RPN is RH)
- If (S is SM) and (O is OF) and (D is DL), then (RPN is RH)
- If (S is SM) and (O is OF) and (D is DAI), then (RPN is RE)
- If (S is SVH) and (O is OR) and (D is DAC), then (RPN is RMI)
- If (S is SVH) and (O is OR) and (D is DH), then (RPN is RL)
- If (S is SVH) and (O is OR) and (D is DM) then (RPN is RL)
- If (S is SVH) and (O is OR) and (D is DL), then (RPN is RM)
- If (S is SVH) and (O is OR) and (D is DAI), then (RPN is RH)
- If (S is SVH) and (O is OVU) and (D is DAC), then (RPN is RL)
- If (S is SVH) and (O is OVU) and (D is DH), then (RPN is RL)
- If (S is SVH) and (O is OVU) and (D is DM), then (RPN is RM)
- If (S is SVH) and (O is OVU) and (D is DL), then (RPN is RH)
- If (S is SVH) and (O is OVU) and (D is DAI), then (RPN is RH)
- If (S is SVH) and (O is OO) and (D is DAC), then (RPN is RL)
- If (S is SVH) and (O is OO) and (D is DH), then (RPN is RM)
- If (S is SVH) and (O is OO) and (D is DM,) then (RPN is RH)
- If (S is SVH) and (O is OO) and (D is DL), then (RPN is RH)
- If (S is SVH) and (O is OO) and (D is DAI), then (RPN is RE)
- If (S is SVH) and (O is OP) and (D is DAC), then (RPN is RL)
- If (S is SVH) and (O is OP) and (D is DH), then (RPN is RM)
- If (S is SVH) and (O is OP) and (D is DM), then (RPN is RH)
- If (S is SVH) and (O is OP) and (D is DL), then (RPN is RH)
- If (S is SVH) and (O is OP) and (D is DAI), then (RPN is RE)
- If (S is SVH) and (O is OF) and (D is DAC), then (RPN is RM)
- If (S is SVH) and (O is OF) and (D is DH), then (RPN is RH)
- If (S is SVH) and (O is OF) and (D is DM), then (RPN is RH)
- If (S is SVH) and (O is OF) and (D is DL), then (RPN is RE)
- If (S is SVH) and (O is OF) and (D is DAI), then (RPN is RE)
- If (S is SHA) and (O is OR) and (D is DAC), then (RPN is RL)
- If (S is SHA) and (O is OR) and (D is DH), then (RPN is RL)
- If (S is SHA) and (O is OR) and (D is DM), then (RPN is RM)
- If (S is SHA) and (O is OR) and (D is DL), then (RPN is RH)
- If (S is SHA) and (O is OR) and (D is DAI), then (RPN is RH)
- If (S is SHA) and (O is OVU) and (D is DAC), then (RPN is RL)
- If (S is SHA) and (O is OVU) and (D is DH), then (RPN is RM)
- If (S is SHA) and (O is OVU) and (D is DM), then (RPN is RH)
- If (S is SHA) and (O is OVU) and (D is DL), then (RPN is RH)
- If (S is SHA) and (O is OVU) and (D is DAI), then (RPN is RE)
- If (S is SHA) and (O is OO) and (D is DAC), then (RPN is RL)
- If (S is SHA) and (O is OO) and (D is DH), then (RPN is RM)
- If (S is SHA) and (O is OO) and (D is DM), then (RPN is RH)
- If (S is SHA) and (O is OO) and (D is DL), then (RPN is RH)
- If (S is SHA) and (O is OO) and (D is DAI), then (RPN is RE)
- If (S is SHA) and (O is OP) and (D is DAC), then (RPN is RM)
- If (S is SHA) and (O is OP) and (D is DH), then (RPN is RH)
- If (S is SHA) and (O is OP) and (D is DM), then (RPN is RH)
- If (S is SHA) and (O is OP) and (D is DL), then (RPN is RE)
- If (S is SHA) and (O is OP) and (D is DAI), then (RPN is RE)
- If (S is SHA) and (O is OF) and (D is DAC), then (RPN is RM)
- If (S is SHA) and (O is OF) and (D is DH), then (RPN is RH)
- If (S is SHA) and (O is OF) and (D is DM), then (RPN is RH)
- If (S is SHA) and (O is OF) and (D is DL), then (RPN is RE)
- If (S is SHA) and (O is OF) and (D is DAI), then (RPN is RE)
References
- Rausand, M.; Høyland, A. System Reliability Theory: Models, Statistical Methods and Applications; John Wiley & Sons, Inc.: Hoboken, NJ, USA, 2004; ISBN 3-17-572399-3. [Google Scholar]
- Stamatis, D.H. Failure Mode and Effect Analysis: FMEA from Theory to Execution, 2nd ed.; ASQ Quality Press: Milwaukee, VI, USA, 2003; ISBN 0-87-389598-3. [Google Scholar]
- IEC 60812:2006; Analysis Techniques for System Reliability—Procedure for Failure Mode and Effects Analysis (FMEA). International Electrotechnical Commission: London, UK, 2018.
- SAE J1739_202101; Potential Failure Mode and Effects Analysis (FMEA) Including Design FMEA, Supplemental FMEA-MSR, and Process FMEA. SAE International: Warrendale, PA, USA, 2021.
- Zúñiga, A.A.; Fernandes, J.F.P.; Branco, P.J.C. A Fuzzy-Based Failure Modes and Effects Analysis (FMEA) in Smart Grids. In Advances in Intelligent Systems and Computing, Proceedings of the International Conference on Information Technology & Systems ICITS 2019, Quito, Ecuador, 6–8 February 2019; Rocha, Á., Ferrás, C., Paredes, M., Eds.; Springer: Cham, Switzerland, 2019; Volume 918, pp. 507–516. ISBN 978-3-03011-890-7. [Google Scholar]
- Pourramazan, A.; Saffari, S.; Barghandan, A. Study of Failure Mode and Effect Analysis (FMEA) on Capacitor Bank Used in Distribution Power Systems. Int. J. Innov. Res. Electr. Electron. Instrum. Control Eng. IJIREEICE 2017, 5, 113–118. [Google Scholar] [CrossRef]
- Eyuboglu, O.H.; Dindar, B.; Gul, O. Risk Assessment by Using Failure Modes and Effects Analysis (FMEA) Based on Power Transformer Aging for Maintenance and Replacement Decision. In Proceedings of the 2020 2nd Global Power, Energy and Communication Conference, GPECOM 2020, Izmir, Turkey, 20–23 October 2020; pp. 251–255. [Google Scholar] [CrossRef]
- Asadi, F.; Phumpho, S.; Pongswatd, S. Remote Monitoring and Alert System of HV Transformer Based on FMEA. Energy Rep. 2020, 6, 807–813. [Google Scholar] [CrossRef]
- Colli, A. Failure Mode and Effect Analysis for Photovoltaic Systems. Renew. Sustain. Energy Rev. 2015, 50, 804–809. [Google Scholar] [CrossRef]
- Herz, M.; Friesen, G.; Jahn, U.; Köntges, M.; Lindig, S.; Moser, D. Quantification of Technical Risks in PV Power Systems; IEA PVPS: Paris, France, 2021. [Google Scholar]
- Díaz, H.; Guedes Soares, C. Failure Mode Identification and Effect Analysis of Offshore Wind Turbines and Substations. In Developments in Renewable Energies Offshore, Proceedings of the 4th International Conference on Renewable Energies Offshore, RENEW 2020, Lisbon, Portugal, 12–15 October 2020; Taylor & Francis: Abingdon, UK, 2021; pp. 444–460. [Google Scholar] [CrossRef]
- Zúñiga, A.A.; Baleia, A.; Fernandes, J.; da Costa Branco, P.J. Classical Failure Modes and Effects Analysis in the Context of Smart Grid Cyber-Physical Systems. Energies 2020, 13, 1215. [Google Scholar] [CrossRef] [Green Version]
- Bucolo, M.; Buscarino, A.; Famoso, C.; Fortuna, L. Chaos Addresses Energy in Networks of Electrical Oscillators. IEEE Access 2021, 9, 153258–153265. [Google Scholar] [CrossRef]
- Markowski, A.S.; Mannan, M.S.; Kotynia (Bigoszewska), A.; Siuta, D. Uncertainty Aspects in Process Safety Analysis. J. Loss Prev. Process Ind. 2010, 23, 446–454. [Google Scholar] [CrossRef]
- Markowski, A.S.; Siuta, D. Fuzzy Logic Approach for Identifying Representative Accident Scenarios. J. Loss Prev. Process Ind. 2018, 56, 414–423. [Google Scholar] [CrossRef]
- Huang, J.; You, J.X.; Liu, H.C.; Song, M.S. Failure Mode and Effect Analysis Improvement: A Systematic Literature Review and Future Research Agenda. Reliab. Eng. Syst. Saf. 2020, 199, 106885. [Google Scholar] [CrossRef]
- Hassan, S.; Wang, J.; Kontovas, C.; Bashir, M. Modified FMEA Hazard Identification for Cross-Country Petroleum Pipeline Using Fuzzy Rule Base and Approximate Reasoning. J. Loss Prev. Process Ind. 2022, 74, 104616. [Google Scholar] [CrossRef]
- Daneshvar, S.; Yazdi, M.; Adesina, K.A. Fuzzy Smart Failure Modes and Effects Analysis to Improve Safety Performance of System: Case Study of an Aircraft Landing System. Qual. Reliab. Eng. Int. 2020, 36, 890–909. [Google Scholar] [CrossRef]
- Fattahi, R.; Tavakkoli-Moghaddam, R.; Khalilzadeh, M.; Shahsavari-Pour, N.; Soltani, R. A Novel FMEA Model Based on Fuzzy Multiple-Criteria Decision-Making Methods for Risk Assessment. J. Enterp. Inf. Manag. 2020, 33, 881–904. [Google Scholar] [CrossRef]
- Bahrebar, S.; Blaabjerg, F.; Wang, H.; Vafamand, N.; Khooban, M.H.; Rastayesh, S.; Zhou, D. A Novel Type-2 Fuzzy Logic for Improved Risk Analysis of Proton Exchange Membrane Fuel Cells in Marine Power Systems Application. Energies 2018, 11, 721. [Google Scholar] [CrossRef] [Green Version]
- Liu, S.; Guo, X.; Zhang, L. An Improved Assessment Method for FMEA for a Shipboard Integrated Electric Propulsion System Using Fuzzy Logic and DEMATEL Theory. Energies 2019, 12, 3162. [Google Scholar] [CrossRef] [Green Version]
- Deng, X.; Jiang, W. Fuzzy Risk Evaluation in Failure Mode and Effects Analysis Using a D Numbers Based Multi-Sensor Information Fusion Method. Sensors 2017, 17, 2086. [Google Scholar] [CrossRef] [PubMed] [Green Version]
- Komatina, N.; Aleksic, A.; Banduka, N. Determination of Failures Priority Based on FMEA, Fuzzy Sets, and Fuzzy Logic Rules. In Proceedings of the 8th International Conference on Industrial Engineering—SIE 2022, Belgrade, Serbia, 29–30 September 2022. [Google Scholar]
- Jin, G.; Meng, Q.; Feng, W. Optimization of Logistics System with Fuzzy FMEA-AHP Methodology. Processes 2022, 10, 1973. [Google Scholar] [CrossRef]
- Mazdak Khodadadi-Karimvand; TaheriFar, S. Safety Risk Assessment; Using Fuzzy Failure Mode and Effect Analysis. Trans. Fuzzy Sets Syst. 2022, 1, 90–98. [Google Scholar] [CrossRef]
- Zhou, B.; Chen, J.; Wu, Q.; Pamučar, D.; Wang, W.; Zhou, L. Risk Priority Evaluation of Power Transformer Parts Based on Hybrid Fmea Framework Under Hesitant Fuzzy Environment. Facta Univ. Ser. Mech. Eng. 2022, 20, 399–420. [Google Scholar] [CrossRef]
- Li, H.; Liang, M.; Li, F.; Zuo, J.; Zhang, C.; Ma, Y. Operational Safety Risk Assessment of Water Diversion Infrastructure Based on FMEA with Fuzzy Inference System. Water Supply 2022, 22, 7513–7531. [Google Scholar] [CrossRef]
- Cruz-Rivero, L.; Méndez-Hernández, M.L.; Mar-Orozco, C.E.; Aguilar-Lasserre, A.A.; Barbosa-Moreno, A.; Sánchez-Escobar, J. Functional Evaluation Using Fuzzy FMEA for a Non-Invasive Measurer for Methane and Carbone Dioxide. Symmetry 2022, 14, 421. [Google Scholar] [CrossRef]
- Soltanali, H.; Khojastehpour, M.; De Almeida, E. Sustainable Food Production: An Intelligent Fault Diagnosis Framework for Analyzing the Risk of Critical Processes. Sustainability 2022, 14, 1083. [Google Scholar] [CrossRef]
- Akula, S.K.; Salehfar, H.; Behzadirafi, S. Comparision of Traditional and Fuzzy Failure Mode and Effects Analysis for Smart Grid Electrical Distribution Systems. In Proceedings of the 2022 North American Power Symposium (NAPS), Salt Lake City, UT, USA, 9–11 October 2022. [Google Scholar]
- Lin, C.-T.; Lee, G. Neural Fuzzy Systems: A Neuro-Fuzzy Synergism to Intelligent Systems; Prentice Hall, Inc.: Upper Saddle River, NJ, USA, 1996; ISBN 0-13-235169-2. [Google Scholar]
- Castillo, O.; Melin, P.; Kacprzyk, J.; Pedrycz, W. Type-2 Fuzzy Logic: Theory and Applications. In Proceedings of the 2007 IEEE International Conference on Granular Computing (GRC 2007), Fremont, CA, USA, 2–4 November 2007; p. 145. [Google Scholar] [CrossRef]
- Mendel, J.M.; Hagras, H.; Tan, W.-W.; Melek, W.W.; Ying, H. Introduction to Type-2 Fuzzy Logic Control: Theory and Applications; Wiley-IEEE Press: Hoboken, NJ, USA, 2014; ISBN 978-1-11827-839-0. [Google Scholar]
- Jang, J.-S.R.; Sun, C.-T.; Mizutani, E. Neuro-Fuzzy and Soft Computing: A Computational Approach to Learning and Machine Intelligence; Prentice Hall, Inc.: Upper Saddle River, NJ, USA, 1997. [Google Scholar]
- Zadeh, L.A. The Concept of a Linguistic Variable and Its Application to Approximate Reasoning-I. Inf. Sci. 1975, 8, 199–249. [Google Scholar] [CrossRef]
- Chen, S.-J.; Hwang, C.-L.; Hwang, F.P. Fuzzy Multiple Attribute Decision Making: Methods and Applications; Springer: Berlin/Heidelberg, Germany, 1992; ISBN 978-3-54055-820-0. [Google Scholar]


| Semantic Rule | Fuzzy Subset |
|---|---|
| The effect of the failure mode is considered Minor when assessed as 1 | |
| The effect of the failure mode is considered Low when assessed between 2 and 3 | |
| The effect of the failure mode is considered Moderate when assessed between 4 and 6 | |
| The effect of the failure mode is considered Very High when assessed between 7 and 8 | |
| The effect of the failure mode is considered Hazardous when assessed between 9 and 10 |
| Semantic Rule | Fuzzy Subset |
|---|---|
| The occurrence of the failure mode is considered Remote when assessed as 1 | |
| The occurrence of the failure mode is considered Very Unlikely when assessed between 2 and 3 | |
| The occurrence of the failure mode is considered Occasional when assessed between 4 and 6 | |
| The occurrence of the failure mode is considered Probable when assessed between 7 and 8 | |
| The occurrence of the failure mode is considered Frequent when assessed between 9 and 10 |
| Semantic Rule | Fuzzy Subset |
|---|---|
| The detection of the failure mode is considered Almost Certain when assessed as 1 | |
| The detection of the failure mode is considered High when assessed between 2 and 3 | |
| The detection of the failure mode is considered Moderate when assessed between 4 and 6 | |
| The detection of the failure mode is considered Low when assessed between 7 and 8 | |
| The detection of the failure mode is considered Absolutely Impossible when assessed between 9 and 10 |
| Semantic Rule | Fuzzy Subset |
|---|---|
| The overall risk of the failure mode is considered Minor when assessed around 1 | |
| The overall risk of the failure mode is considered Low when assessed between 2 and 3 | |
| The overall risk of the failure mode is considered Moderate when assessed between 4 and 6 | |
| The overall risk of the failure mode is considered Very High when assessed between 7 and 8 | |
| The overall risk of the failure mode is considered Hazardous when assessed between 9 and 10 |
| Severity (S) | Occurrence (O) | Detection (D) | FuzzyRPN 1 | Rating |
|---|---|---|---|---|
| Hazardous—SHA | Frequent—OF | Absolutely impossible—DAI | Extreme—RE | 9, 10 |
| Very High—SVH | Probable—OP | Low—DL | High—RH | 7, 8 |
| Moderate—SM | Occasional—OO | Moderate—DM | Moderate—RM | 4, 5, 6 |
| Low—SL | Very unlikely—OVU | High—DH | Low—RL | 2, 3 |
| Minor—SMI | Remote—OR | Almost Certain—DAC | Minor—RMI | 1 |
| Category | Occurrence | Detection |
|---|---|---|
| 1 | tri(x; 0,1.5,2.5) | tri(x;0,1.5,2.3) |
| 2, 3 | tri(x; 0.8,2.8,4.2) | tri(x;1.1,2.9,4.5) |
| 4, 5, 6 | tri(x; 3.2,5.4,7.4) | tri(x;2.5,5.0,7.5) |
| 7, 8 | tri(x; 6.4,7.5,9.6) | tri(x;4.8,7.5,10.4) |
| 9, 10 | tri(x; 8.7,9.3,11.4) | tri(x;7.6,9.3,12.4) |
| Category | Severity | FuzzyRPN |
|---|---|---|
| 1 | trap(x; 0.1,0.6,1.5,2.4) | trap(x; 1.0,1.0,1.6, 2.5) |
| 2,3 | trap(x;0.9,2.0,3.0,3.5) | trap(x; 1.0,2.4,3.2,4.1) |
| 4,5,6 | trap(x;2.7,4.0,5.0,7.8) | trap(x;2.9,4.2,5.5,7.6) |
| 7,8 | trap(x;5.1,7.0,8.0,9.5) | trap(x;5.5,7.0,8.0,9.5) |
| 9,10 | trap(x;7.6,9.0,10.0,12.2) | trap(x;7.67,9.06,10,10) |
| Failure Mode | Equipment | Failure Mode(s) | S | O | D | RPN | Rank |
|---|---|---|---|---|---|---|---|
| FM01 | Busbar | Loss of structural integrity | 7 | 5 | 9 | 315 | 9 |
| FM02 | Busbar | Loss of structural integrity | 7 | 6 | 9 | 378 | 3 |
| FM03 | Busbar | Loss of structural integrity | 7 | 5 | 9 | 315 | 10 |
| FM04 | Busbar | Loss of electrical continuity | 8 | 4 | 10 | 320 | 6 |
| FM05 | Busbar | Electrical disturbances | 8 | 4 | 10 | 320 | 7 |
| FM06 | Bus-bar | Electrical disturbances | 8 | 4 | 8 | 256 | 17 |
| FM07 | Cable | Cable integrity defect | 8 | 7 | 5 | 280 | 15 |
| FM08 | Cable | Electrical operation failure | 6 | 6 | 10 | 360 | 4 |
| FM09 | CB | Insulation failure | 6 | 5 | 7 | 210 | 26 |
| FM10 | CB | Wrong operation | 7 | 6 | 4 | 168 | 37 |
| FM11 | CB | Bushing breakdown | 6 | 5 | 10 | 300 | 11 |
| FM12 | CB | Bushing terminal hot spot | 6 | 4 | 8 | 192 | 29 |
| FM13 | CB | CB contacts degradation | 6 | 5 | 9 | 270 | 16 |
| FM14 | Transformer | Bushing breakdown | 6 | 4 | 10 | 240 | 22 |
| FM15 | Transformer | Bushing terminal hot spot | 6 | 4 | 7 | 168 | 39 |
| FM16 | Transformer | Magnetic-core delamination | 6 | 4 | 7 | 168 | 38 |
| FM17 | Transformer | Winding overheating | 7 | 6 | 7 | 294 | 14 |
| FM18 | Transformer | Tap changer contacts degradation | 6 | 3 | 9 | 162 | 40 |
| FM19 | Transformer | Tank rupture | 8 | 3 | 9 | 216 | 23 |
| FM20 | Transformer | Winding isolation degradation or breakdown | 6 | 4 | 10 | 240 | 21 |
| FM21 | Transformer | Distortion, loosening, or winding displacement | 7 | 5 | 9 | 315 | 8 |
| FM22 | Transformer | Transformer explosion | 9 | 5 | 10 | 450 | 1 |
| FM23 | Transformer | Cooling system failure | 8 | 3 | 7 | 168 | 36 |
| FM24 | HMI | Operational failure | 5 | 5 | 10 | 250 | 19 |
| FM25 | HMI | Security failure | 9 | 2 | 10 | 180 | 33 |
| FM26 | SW | Performance decreased | 6 | 7 | 6 | 252 | 18 |
| FM27 | SW | Operational failure (Switch blackout) | 6 | 6 | 10 | 360 | 5 |
| FM28 | SW | Operational failure (Switch blackout) | 6 | 5 | 10 | 300 | 13 |
| FM29 | SW | Network/Cyber storm | 6 | 4 | 7 | 168 | 35 |
| FM30 | SW | Power outage | 6 | 3 | 10 | 180 | 34 |
| FM31 | SV | Data errors | 6 | 5 | 10 | 300 | 12 |
| FM32 | SV | Power outages | 7 | 3 | 10 | 210 | 25 |
| FM33 | SV | Security failure | 10 | 2 | 10 | 200 | 28 |
| FM34 | IED | Communication failure | 6 | 5 | 8 | 240 | 20 |
| FM35 | IED | Communication failure | 6 | 4 | 8 | 192 | 30 |
| FM36 | IED | Communication Failure | 6 | 5 | 7 | 210 | 27 |
| FM37 | IED | Monitoring failure | 6 | 5 | 6 | 180 | 32 |
| FM38 | IED | Control failure | 8 | 7 | 7 | 392 | 2 |
| FM39 | IED | Power outages | 7 | 3 | 10 | 210 | 24 |
| FM40 | IED | Security failure | 9 | 3 | 7 | 189 | 31 |
| FM41 | Optical fiber | Fracture | 4 | 3 | 10 | 120 | 41 |
| FM42 | Optical fiber | Humidity induced | 4 | 3 | 10 | 120 | 42 |
| Configuration | MF Severity | MF Occurrence | MF Detection | MF Fuzzy RPN |
|---|---|---|---|---|
| FIS | Trapezoidal | Triangular | Triangular | Trapezoidal |
| Failure Mode | Classic RPN | Classic Rank | FIS FRPN | FIS Rank |
|---|---|---|---|---|
| FM01 | 315 | 9 | 8.216 | 4 |
| FM02 | 378 | 3 | 8.138 | 7 |
| FM03 | 315 | 10 | 8.216 | 5 |
| FM04 | 320 | 6 | 8.325 | 2 |
| FM05 | 320 | 7 | 8.325 | 3 |
| FM06 | 256 | 17 | 7.760 | 15 |
| FM07 | 280 | 15 | 7.556 | 19 |
| FM08 | 360 | 4 | 7.872 | 9 |
| FM09 | 210 | 26 | 6.831 | 34 |
| FM10 | 168 | 37 | 5.819 | 42 |
| FM11 | 300 | 11 | 7.872 | 10 |
| FM12 | 192 | 29 | 7.041 | 28 |
| FM13 | 270 | 16 | 7.872 | 11 |
| FM14 | 240 | 22 | 7.226 | 22 |
| FM15 | 168 | 39 | 5.974 | 39 |
| FM16 | 168 | 38 | 5.974 | 40 |
| FM17 | 294 | 14 | 6.860 | 33 |
| FM18 | 162 | 40 | 6.329 | 37 |
| FM19 | 216 | 23 | 7.688 | 17 |
| FM20 | 240 | 21 | 7.226 | 23 |
| FM21 | 315 | 8 | 8.216 | 6 |
| FM22 | 450 | 1 | 8.679 | 1 |
| FM23 | 168 | 36 | 6.906 | 31 |
| FM24 | 250 | 19 | 7.500 | 21 |
| FM25 | 180 | 33 | 7.529 | 20 |
| FM26 | 252 | 18 | 6.779 | 36 |
| FM27 | 360 | 5 | 7.872 | 12 |
| FM28 | 300 | 13 | 7.872 | 13 |
| FM29 | 168 | 35 | 5.974 | 41 |
| FM30 | 180 | 34 | 7.001 | 30 |
| FM31 | 300 | 12 | 7.872 | 14 |
| FM32 | 210 | 25 | 7.049 | 24 |
| FM33 | 200 | 28 | 8.048 | 8 |
| FM34 | 240 | 20 | 7.675 | 18 |
| FM35 | 192 | 30 | 7.041 | 29 |
| FM36 | 210 | 27 | 6.831 | 35 |
| FM37 | 180 | 32 | 6.047 | 38 |
| FM38 | 392 | 2 | 7.736 | 16 |
| FM39 | 210 | 24 | 7.049 | 25 |
| FM40 | 189 | 31 | 6.906 | 32 |
| FM41 | 120 | 41 | 7.049 | 26 |
| FM42 | 120 | 42 | 7.049 | 27 |
| Id | Equipment | Failure Mode | Failure Causes | Failure Effects | S | O | D | FMECA Rank | Fuzzy Rank |
|---|---|---|---|---|---|---|---|---|---|
| FM22 | Transformer | Transformer explosion | Internal short circuit | Serious damage in the substation; personnel injuries or death | 9 | 5 | 10 | 1 | 1 |
| FM38 | IED | Control failure | Defective data processing (software error) | Inability to control power system operation | 8 | 7 | 7 | 2 | 16 |
| FM02 | Bus bar | Loss of structural integrity | Break of the support insulators | Bus bar break; no electrical connection | 7 | 6 | 9 | 3 | 7 |
| FM08 | Cable | Electrical operation failure | Short circuits transients | Excessive heat (saturation) | 6 | 6 | 10 | 4 | 9 |
| FM27 | SW | Operational failure (SW blackout) | SW is locked up | Incorrect SW function or SW malfunction | 6 | 6 | 10 | 5 | 12 |
| FM04 | Bus bar | Loss of electrical continuity | Arc flash | Degradation of the physical structure | 8 | 4 | 10 | 6 | 2 |
| FM05 | Bus bar | Electrical disturbances | Short circuits between bus bars | Short circuits | 8 | 4 | 10 | 7 | 3 |
| FM21 | Transformer | Distortion, loosening, or displacement of the winding | Short circuits | Internal short circuits; transformer damage | 7 | 5 | 9 | 8 | 6 |
| FM01 | Busbar | Loss of structural integrity | Fracture of the Cooper bar | Bus bar break; no electrical connection | 7 | 5 | 9 | 9 | 4 |
| FM03 | Busbar | Loss of structural integrity | Cracking of connection welds | Bus bar break; no electrical connection | 7 | 5 | 9 | 10 | 5 |
Disclaimer/Publisher’s Note: The statements, opinions and data contained in all publications are solely those of the individual author(s) and contributor(s) and not of MDPI and/or the editor(s). MDPI and/or the editor(s) disclaim responsibility for any injury to people or property resulting from any ideas, methods, instructions or products referred to in the content. |
© 2023 by the authors. Licensee MDPI, Basel, Switzerland. This article is an open access article distributed under the terms and conditions of the Creative Commons Attribution (CC BY) license (https://creativecommons.org/licenses/by/4.0/).
Share and Cite
Zúñiga, A.A.; Fernandes, J.F.P.; Branco, P.J.C. Fuzzy-Based Failure Modes, Effects, and Criticality Analysis Applied to Cyber-Power Grids. Energies 2023, 16, 3346. https://doi.org/10.3390/en16083346
Zúñiga AA, Fernandes JFP, Branco PJC. Fuzzy-Based Failure Modes, Effects, and Criticality Analysis Applied to Cyber-Power Grids. Energies. 2023; 16(8):3346. https://doi.org/10.3390/en16083346
Chicago/Turabian StyleZúñiga, Andrés A., João F. P. Fernandes, and Paulo J. C. Branco. 2023. "Fuzzy-Based Failure Modes, Effects, and Criticality Analysis Applied to Cyber-Power Grids" Energies 16, no. 8: 3346. https://doi.org/10.3390/en16083346
APA StyleZúñiga, A. A., Fernandes, J. F. P., & Branco, P. J. C. (2023). Fuzzy-Based Failure Modes, Effects, and Criticality Analysis Applied to Cyber-Power Grids. Energies, 16(8), 3346. https://doi.org/10.3390/en16083346