Article

Micro-Grid Day-Ahead Stochastic Optimal Dispatch Considering Multiple Demand Response and Electric Vehicles

1
School of Computer and Electrical Engineering, Hunan University of Arts and Science, Changde 415000, China
2
Key Laboratory of Hunan Province for Control Technology of Distributed Electric Propulsion Air Vehicle, Changde 415000, China
*
Author to whom correspondence should be addressed.
Energies 2023, 16(8), 3356; https://doi.org/10.3390/en16083356
Submission received: 15 March 2023 / Revised: 3 April 2023 / Accepted: 8 April 2023 / Published: 11 April 2023

Abstract

:
Multiple demand responses and electric vehicles are considered, and a micro-grid day-ahead dispatch optimization model with photovoltaic is constructed based on stochastic optimization theory. Firstly, an interruptible load model based on incentive-based demand response is introduced, and a demand response mechanism for air conditioning load is constructed to implement an optimal energy consumption curve control strategy for air conditioning units. Secondly, considering the travel demand and charging/discharging rules of electric vehicles, the electric vehicle optimization model is built. Further, a stochastic optimization model of micro-grid with demand response and electric vehicles is developed because of the uncertainty of photovoltaic power output. Finally, the simulation example verifies the effectiveness of the proposed model. The simulation results show that the proposed model can effectively tackle the uncertainty of photovoltaic, as well as reduce the operating cost of micro-grid. Therefore, the effective interaction between users and electric vehicles can be realized.

1. Introduction

As global environmental issues become increasingly prominent, distributed photovoltaic (PV) has been vigorously developed due to its reliability, environmental protection and other advantages. Meanwhile, the development of electric vehicles (EVs) provides a new solution to the problems of energy and environment [1]. The micro-grid can aggregate distributed PV and EVs and is an important tool in the process of building a new type of power system [2].
In micro-grid operation optimization, more and more research is directed to load demand responses (DR) and EVs. In [3], a two-stage coordination method for micro-grid operation based on price-based DR and battery energy storage was proposed. In [4], the flexibility of aggregating energy storage and DR was used to reduce losses and improve the performance of the micro-grid, leading to more efficient energy management. Considering separately transferable and non-transferable loads for implementation, DR schemes based on direct load control were implemented into the system. In [5], a scene approach was used to represent the uncertainty of electricity production and load. In addition, DR and EVs based on time-of-use tariffs were analyzed. The EVs and loads were engaged as adjustable resources. Qiu et al. [6] developed a two-stage robust optimization method based on adaptive uncertainty sets for micro-grid with DR. The analysis focused on the selection of the uncertainty set and the solution was performed using a column and constraint generation algorithm. Zhao et al. [7] proposed an optimization strategy for day-ahead operation of micro-grid, which considered the uncertainty of distributed renewable energy generation, electricity load and day-ahead market price. A transferable load approach was used for DR and a sensitivity analysis of DR cost was conducted. MansourLakouraj et al. [8] discussed the optimal operation of micro-grid in electricity markets and described the communication between distribution market operators and micro-grid operators. It was verified that DR can significantly reduce operating costs in the worst case scene. Rajamand et al. [9] considered the uncertainty of renewable energy, market prices and load demand, and the uncertainty was estimated by a point estimation method. The price based demand response of different types of loads was also taken into account, and the impact of demand response on cost was analyzed. There were two types of loads in [10] for micro-grid, namely flexible and inflexible loads. Flexible loads could respond to price signals and participate in demand response programs. The uncertainty of renewable energy generation was modeled as stochastic optimization using scene generation and decision reduction methods. In summary, only DR has been analyzed in the above studies, and DR under price-based transferable load has been considered more often. The interruptible load is also studied to some extent in the DR, but the effect of different load shedding is not considered. Moreover, the participation of EVs is not considered.
In [11], a stochastic optimization-based micro-grid management and operation planning support management system was proposed. The EVs were managed as adjustable resources in this paper. In [12], a multi-objective technical/economic/environmental optimization concept for scheduling the charging/discharging of electric vehicles was proposed. Meanwhile, to stimulate participation in energy services, this paper stated that the system operator needed to compensate the end-users of electricity and the owners of electric vehicles for the loss of benefits, with 27.34% and 9.7%, respectively. In [13], a two-layer optimization model was proposed to minimize the operating costs, voltage fluctuations and power losses of smart micro-grid. In the outer layer, the size and capacity of distributed energy resources, including renewable energy sources, electric vehicle charging stations and energy storage systems, were obtained simultaneously to improve the stability and energy efficiency of the power system. Hou et al. [14] proposed a multi-objective model for the economic dispatch of a micro-grid with electric vehicles, transferable loads and other distributed generators (diesel engines and energy storage devices). The model mainly considered the gradual power fluctuation between the micro-grid and the main grid as an objective and was studied from the orderly charging and discharging of electric vehicles. Li et al. [15] considered the DR of EVs into the optimal scheduling of isolated micro-grid and guided EVs users to actively participate in micro-grid scheduling to achieve peak shaving and valley filling. In [16], energy storage, dispatchable resources and uncertainty resources were optimized in a smart micro-grid. EVs were involved as energy storage and loads were used as curtailable loads. It can be found that although EVs were involved in the micro-grid optimization as an adjustable resource, the travel demand impact of EVs was not analyzed.
To summarize, the main problems in the existing studies are as follows.
1.
The impact of different reductions in interruptible load when considering DR in micro-grid optimization has not been analyzed.
2.
DR is more divided into transferable load and interruptible load, but the air conditioning load model and its role in the optimization model are not considered.
3.
EVs are only treated as an adjustable resource in micro-grid optimization, and the travel demand of electric vehicles is not analyzed in depth. Therefore, a micro-grid uncertainty day-ahead optimization model considering multiple DR and EVs is proposed in this paper.
The main contributions of this paper are summarized as follows:
1.
The power output scenes of distributed PV in micro-grid are generated using Latin hypercube sampling by beta distribution, and the scenes are reduced using backward scene reduction method. The comparison shows that stochastic optimization is more appropriate in some cases to deal with the uncertainty of PV output.
2.
An interruptible load model based on incentive-based DR is constructed, and interruptible levels are set for better participation in optimization. Meanwhile, an air conditioning load DR model is constructed and the effect of air conditioning load on optimization results under the power market is analyzed.
3.
The travel demand of EVs and charging and discharging management of individual EVs are included in the optimization model. In addition, the impact of the participation of different categories of electric vehicles in the optimization is evaluated.
The remainder of this paper is organized as follows: Section 2 provides an introduction to multiple DR models. Section 3 constructs an optimization model that considers the demand for electric vehicle trips. Section 4 focuses on the construction of a day-ahead uncertainty optimization model for micro-grid. In Section 5, simulation analysis is given to evaluate the effectiveness of the proposed model. Finally, the conclusion of this paper is given in Section 6.

2. Multiple Demand Response Models

The structure diagram of the micro-grid in this paper is shown in Figure 1. The micro-grid mainly includes distributed photovoltaic (PV), micro-gas turbine (MT), electric vehicle (EVs), energy storage system (ESS), central air conditioning load (CAC) and other loads. At the same time, the micro-grid interacts with the superior grid. In the following paper, the demand response of CAC and load and the uncertainty of photovoltaic output will be analyzed.

2.1. Interruptible Load Demand Response Model

According to the different response methods, loads are classified into fixed loads, tariff-based transferable loads and incentive-based interruptible loads [17]. The transferable load is that load whose operating hours are adjusted according to the tariff but whose operating power and electricity consumption remain basically the same. The interruptible load is represented as a contract between the grid operator and the customer, and the amount of interruptible load and the corresponding incentives are specified in the contract. In this paper, the incentive mechanism considered is interruptible load compensation [18].
When considering the interruptible load demand response, the amount of interruptible load interruptions will have an impact on the customer’s electricity consumption behavior [19]. The interruptible load curtailment is divided into different classes. Obviously, the higher the interruption level, the higher the compensation price.
F D R , t = m = 1 n m ( λ c u t , m L c u t , m , t )
where n m denotes the number of interruption levels, λ c u t , m is the m-th level interruption load compensation price, and L c u t , m , t is the m-th level interruption load volume in time period t and denotes the decision variable.
In addition, the interruptible load needs to satisfy the following operational constraints:
0 L c u t , m , t L c u t , m , m a x , t
L c u t , t = m = 1 n m L c u t , m , t
L c u t , t 1 + L c u t , t L c , m a x
where L c u t , m , m a x , t is the upper limit of the m-th level of interrupted load in time period t, L c u t , t denotes the amount of interrupted load in time period t, L c , m a x denotes the maximum amount of interrupted load that can be called in continuous time.

2.2. Air Conditioning Load Demand Response

In micro-grid optimization, this paper mainly considers the central air-conditioning system (CAC) of a building, which is called the adjustable load. CAC can relieve grid pressure by regulating the system temperature. However, the temperature needs to be regulated in such a way as to ensure that the comfort level of the users is satisfied [20].
According to the principle of conservation of energy, the heat gained by a public building over a period of time is the difference between the heat transferred in during that period and the heat transferred out from the inside [21]. From the thermodynamic equations, the following equations can be satisfied in public buildings.
γ d T i n d t + β T i n ( α Q ) = 0
where T i n indicates the indoor temperature. α , β and γ are parameters determined according to the individual characteristics of the public building and its CAC. Q is the total cooling energy provided by the CAC.
Accordingly, for public buildings, the time-varying equation for T i n , t is defined as follows:
T i n , t = e β γ Δ t T i n , t 1 + 1 e β γ Δ t α t Q t β
α t = K wall A wall T c l + T d + q win A win F d F s F c l + K win A win T out , t + 1000 k 1 k 2 k 3 P h e + 1000 k 4 k 5 k 6 k 7 P l e + C c l n φ q s h + n φ q l h + 1.01 G n T out , t + 38.5 G n
β = K wall A wall + K win A win + 1.01 G n
γ = C a V ρ a + S h A i n
where K w a l l , A W a l l and T c l are the hourly values of heat transfer coefficient, total area and cooling load temperature, respectively. T d is the corrected value of T c l about the region. q w i n , A w i n , F d , F s , F c l and K w i n are the maximum solar heat gain, total area, correction factor based on glass type, shading factor associated with internal shading measures, cooling load factor and heat transfer coefficient, respectively. T o u t , t is the outdoor temperature. For building electric heating equipment, k 1 , k 2 , k 3 and P h e are the installation coefficient, load factor, simultaneous utilization rate, and installed capacity, respectively. For architectural lighting equipment, k 4 , k 5 , k 6 , k 7 and P l e are the simultaneous usage rate, thermal storage coefficient, rectifier power consumption coefficient, installation coefficient, and installed power, respectively. C c l denotes the coefficient of cooling load. n is the total number of people in the public building. Φ is the occupant aggregation factor. q s h is the sensible heat increment per adult male, and q l h is the latent heat increment per adult. G n denotes the fresh air volume of the building. C a denotes the specific heat capacity of constant pressure air. V is the volume of the cooling space in the building. ρ a is the air density. S h is the heat storage coefficient of the interior wall. A i n is the total area of the interior wall [22].
CAC usually consists of a chiller that generates cold energy along with a thermal storage tank for storing and releasing the cold energy, which are denoted as Q s t , t and Q r e , t , respectively [23]. Correspondingly, Q t is defined as follows:
Q t = Q c h , t Q s h , t + Q r e , t
0 Q c h , t Q c h , m a x
0 Q s h , t Q s h , m a x
0 Q r e , t Q r e , m a x
0 S c , t S c , m a x
S c , t = S c , t 1 + Q s t , t η r e , t Q r e , t / η r e Δ t
where Q c h , m a x denotes the maximum cold energy produced by the chiller. Q s t , m a x and Q r e , m a x are the maximum cold energy stored and released from the thermal storage tank, respectively. S c , t and S c , m a x are the cold energy in time period t and the cold energy capacity of the thermal storage tank, respectively. η r e , t and η r e are the storage and release efficiency of the thermal storage tank, respectively.
Finally, the total power consumption of CAC cooling is mainly a function of chiller power consumption, storage and release process power consumption of heat storage tanks. The function is shown as follows:
P c o l d , t = Q c h , t / μ c h + Q s t , t μ s t + Q r e , t μ r e
where μ c h , μ s h and μ r e are the energy conversion efficiency of the chiller, the energy conversion efficiency of the storage and release process of the thermal storage tank, respectively.

3. Electric Vehicles Optimization Model

According to the travel situation, EVs owners set the next day’s EVs grid connection time, off-grid time and driving distance for each leg of the trip. Because the information is shared with the operator, the operator develops the appropriate charging and discharging strategy based on the status of the next day’s EVs. When EVs are connected to the micro-grid, the micro-grid dispatching platform is responsible for charging and discharging the EVs to ensure that they have enough power to meet the driving demand [24]. Meanwhile, the micro-grid dispatching platform needs to ensure that the revenue gained by the owners of EVs participating in aggregation is greater than the resulting loss, such as battery loss, thus leading to the formation of cooperation.
The cost of EVs is the cost of EVs battery depletion; when the discharge reaches a certain number of times, the EVs battery needs to be replaced. It can be defined as follows:
F E V , t = v = 1 n v C b , v L c , v S E V , v d D O D , v g v d , v , t η v d , v + E v d t r , v , t
where n v is the number of EVs. C b , v denotes the battery purchase costs for the v-th EVs. L c , v is the number of charging or discharging rounds in the life cycle of the v-th EVs battery. S E V , v is the battery capacity of the v-th EVs. d D O D , v is the depth of discharging of the battery available for the v-th EVs. g v d , v , t is the power discharged by the v-th EVs at time t, and it is the decision variable. η v d , v is the discharging efficiency of the v-th EVs. d t r , v , t is the distance traveled by the vth EVs in time period t. E v is the v-th EV energy requirement, which represents the power consumed by EVs per unit distance traveled [25].
Considering the travel pattern of its owners as well as the charging and discharging pattern, in order to be more in line with the actual situation, when EVs are involved in grid interaction, EVs participation is optimized to meet the following conditions:
S E V , v , m i n S E V , v , t S E V , v , m a x
0 g v c , v , t g v c , v , m a x μ v c , v , t
0 g v d , v , t g v d , m a x μ v d , v , t
μ v c , v , t + μ v d , v , t = μ I , v , t
S E V , v , o = S E V i , v
S E V , v , 24 = S E V f , v
S E V , v , t = S E V , v , t 1 + μ v c , v g v c , v , t g v d , v , t μ v d , v E v d t r , v , t
where S E V , v , t is the storage capacity of the v-th EVs in time period t. S E V , v , m i n and S E V , v , m a x are the upper and lower limits of the storage capacity of the v-th EVs, respectively. g v c , v , t is the charging power of the v-th EVs in time period t. It is also a decision variable. g v c , c , m a x and g v d , v , m a x are the upper limit of charging and discharging power of the v-th EVs, respectively. The Boolean variables, μ v c , v , t and μ v d , v , t indicate whether the v-th EVs are in charging and discharging state in time period t, respectively. They are 0–1 variables. μ I , v , t denotes whether the v-th EVs in time period t are in the state of access to the grid, as a 0–1 variable. S E V i , v and S E V f , v denote the storage capacity of the v-th EVs at the beginning and end of the period, respectively. η v c , v denotes the charging efficiency for the v-th EVs.

4. Micro-Grid Stochastic Optimization Model

4.1. Photovoltaic Power Output Uncertainty Model

PV output has a particularly strong relationship with sunlight intensity, which approximately obeys the beta distribution [26]. Therefore, the output probability density function of PV is defined as follows:
f P P V , t = 1 B a t , b t P P V , t P P V N a t 1 1 P P V , t P P V N b t 1
a t = μ P V , t μ P V , l 1 μ P V , t σ P V , t 2 1 b t = 1 μ P V , t μ P V , t 1 μ P V , t σ P V , t 2 1
where P P V , t is the power generated by the PV array at time t. P P V N is the rated power of PV generation. σ P V , t 2 is the variance of the light intensity at time t. B ( a t , b t ) is the beta function.
According to the PV output probability density function, the scenes are generated using Latin hypercube sampling [27], and the generated scenes are reduced using backward fast reduction method to obtain the reduced scenes [28].

4.2. Objective Function

The objective function consists of six components: gas turbine operating costs, start-stop costs, environmental costs, power purchase and sale costs, electric vehicle battery depletion costs and demand response compensation costs. Among them, the environmental cost refers to the environmental loss corresponding to the emission of polluting gases from gas turbines and the penalty received.
min t = 1 T F M T , t + F G r i d , t + F D R , t + F E V , t
Gas turbine operating costs include operating costs, start-up and shutdown costs and environmental costs [29]. They can be defined as follows:
F M T , t = i n i k i μ o , i , t + j = 1 n j k i , j g i , j , t + λ s u , i μ s u , i , t + λ s d , i μ s d , i , t + g i , t l = 1 n l Q i , l V l + Y l
g i , t = j = 1 n j g i , j , t
where, n i is the number of gas turbines. k i is the fixed cost of the i-th gas turbine. The Boolean variables μ o , i , t , μ s u , i , t and μ s d , i , t indicate whether gas turbine i is working, starting, or stopping in time period t, respectively. They are all 0–1 variables. The commonly used secondary operating cost function of gas turbine is linearized by segments. n j is the number of segments linearized. k i , j is the slope of the generation cost of the jth segment of gas turbine i. g i , j , t is the j-th section output of gas turbine i at time t. It is a decision variable. λ s u , j and λ s d , i denote the cost of starting and stopping the gas turbine i, respectively. g i , t is time t gas turbine i output power. nl is the amount of pollutant gas. Q i , l is the l-th pollutant gas emission intensity of gas turbine i. V l and Y l denote the environmental value of the pollutant gas and the order of magnitude of the fine for item l, respectively.
In addition, power purchase and sale costs can be defined as follows:
F G r i d , t = λ b u y , t P b u y , t λ s e l l , t P s e l l , t
where λ b u y , t and λ s e l l , t indicate the price of electricity purchase and sale of electricity between the micro-grid and the superior grid. P b u y , t and P s e l l , t indicate the power purchase and sale of power with the higher grid.

4.3. Related Constraints

There are four constraints need to be satisfied for micro-grid operation [30]. They are the power balance constraint, the gas turbine constraint, the energy storage constraint and the interactive power constraint with the superior grid.
Firstly, the power balance constraint is defined as follows:
P P V , t + g i , t + P b u y , t + P e s s d i s , t + g v d , v , t = P c o l d , t + P e s s c h , t + P l o a d , t L c u t , t + P s e l l , t + g v c , v , t
where P e s s c h , t and P e s s d i s , t denote the charging and discharging power of energy storage at time t. P l o a d , t denotes the load power at time t.
Secondly, the gas turbine constraint is defined as follows:
μ o , i , t μ o , i , t 1 μ s u , i , t
μ o , i , t 1 μ o , i , t μ s d , i , t
0 g i , j , t g i , j , m a x μ o , i , t
g i , m i n μ o , i , t g i , t g i , m a x μ o , i , t
r d , i g i , t g i , t 1 r u , i
t u , i μ s u , t h = t t + t u , i 1 μ o , i , t ( t T t u , i + 1 )
t d , i μ s d , t h = t t + t d , i 1 μ o , i , t ( t T t d , i + 1 )
h = t t u , j t u i , i μ o , i , t = 0
h = t t d , j t d 6 i , i μ o , i , t = 0
where g i , m a x and g i , m i n are the maximum and minimum output power of gas turbine i, respectively. g i , j , m a x is the upper limit of the j-th section output of gas turbine i. r u , i and r d , i are the upward and downward climb rates of gas turbine i, respectively. t u , i and t d , i are the minimum on and off times for gas turbine i, respectively. t u i , i and t d i , i are the initial on and off times of gas turbine i, respectively.
Thirdly, the energy storage constraint is defined as follows:
E e s s , t = E e s s , t 1 + μ e s s c h P e s s c h , t P e s s d i s , t / μ e s s d i s
E e s s , m i n E e s s , t E e s s , m a x
0 P e s s c h , t P e s s c h , m a x
0 P e s s d i s , t P e s s d i s , m a x
where E e s s , t denotes the electrical energy stored in the ESS at time t. μ e s s c h and μ e s s d i s denote the charging and discharging efficiency of the energy storage plant. E e s s , m a x and E e s s , m i n indicate the maximum and minimum values of stored electrical energy. P e s s c h , m a x and P e s s d i s , m a x indicate the maximum power of charging and discharging.
Finally, the interactive power constraint with the superior grid is defined as follows:
P b u y , m i n P b u y , t P b u y , m a x
P s e l l , m i n P s e l l , t P s e l l , m a x
where P b u y , m i n and P b u y , m a x denote the minimum and maximum values of power purchased by the micro-grid from the superior grid. P s e l l , m i n and P s e l l , m a x indicate the minimum and maximum values of electricity sold by the micro-grid.

5. Simulation Analysis

To verify the correctness of the above model, this paper uses resources that contain EVs, energy storage units, gas turbines and air-conditioning load to perform simulation analysis. The interruptible load is set to three levels, and the maximum interruptible load ratio from the first level to the third level is 0.15, 0.1 and 0.08, respectively, with the corresponding compensation prices of 500, 700 and 800 (RMB/MWh). The value of the interruption ratio for different classes of interruptible load is the ratio of the total load value at each moment. The proposed model is solved using MATLAB+CPLEX. Meanwhile, to analyze the effects of PV uncertainty, DR and EVs on the optimization results, four scenes are set up and the results shown in Table 1. Scene 5 represents the consideration of uncertainty of PV, DR and EVs, where the uncertainty of PV output is handled using robust optimization [31]. The PV uncertainty scene and load requirements are shown in Figure 2. The lines of different colors in Figure 2 indicate the scenes after the reduction of PV output. The outdoor temperature is shown in Figure 3. Considering two types of EVs in the model, the first type of EVs travels at 08:00 a.m. and 17:00 p.m., both with a travel distance of 22 miles. The second type of EVs travels at 09:00 a.m. and 21:00 p.m., both with a travel distance of 11 miles. The parameters are shown in Table 2. Additionally, air conditioning load minimum and maximum comfort temperature settings are 24.8 °C and 27.3 °C. Environmental pollution gas parameters of the gas turbine are shown in Table 3. The maximum/minimum power of the gas turbine is 3.31/1.3 MW, and the up-and-down climbing rate is 1.5/1.5.
The optimization results of different scenes are compared and analyzed by using CPLEX. The optimization results obtained for different scenes are shown in Table 4.
As shown in Table 4, optimization results, the effect of EVs on the optimization results is analyzed in scene 1 and scene 2. It can be seen that the optimization result of scene 2 without EVs participation is much higher than that of scene 1 with EVs participation. The reason for this phenomenon is that EVs are not used as adjustable resources in scene 2. This makes the rest of the equipment in the micro-grid increase its power output and the power purchased from the upper grid, thus increasing the cost. From the analysis of the results of scene 1 and scene 2, it is also known that the participation of EVs can effectively reduce the system operation cost.
The impact of DR is analyzed by comparing the optimization results of scene 1 and scene 3. It can be found that the system cost can be reduced to a certain extent and the system economy can be improved when considering DR. Because the demand response is mainly considered as interruptible load, load value is reduced during the peak load to achieve peak shaving. Compared to scene 2, scene 3 is more likely to reduce system costs and achieve economic improvements when only EVs participation is considered. Moreover, it also shows that EVs participation has greater potential for optimal operation.
Compare the optimization results of scene 1 and scene 4 to analyze the impact of PV uncertainty on the optimization results. According to the optimization results, it can be found that the uncertainty cost of considering PV output in scene 4 is smaller than that of the deterministic scene 1. Because the uncertainty of PV output is not considered in the deterministic scene 1, making it impossible to guarantee whether the optimization results match the actual grid operation by only using the deterministic scene in the optimization. Therefore, the results illustrate that considering uncertainty can effectively reduce the system costs.
Comparing scene 4 and scene 5, the results of different uncertainty methods are analyzed. It can be found that the total cost obtained in scene 5 is larger than the result of scene 4. This is mainly because scene 5 uses robust optimization to deal with uncertainty and considers the optimization results under extreme scenarios, and the results are more conservative, so the results are larger than those in scene 4. It can be shown that it is more suitable to use stochastic optimization to deal with uncertainty in practical situations.
Combining the optimization results of the four scenes, it can be found that the proposed model obtains the smallest value of the objective function under the uncertainty of PV output force. The operating cost of the micro-grid can be effectively reduced by considering EVs, DR and the uncertainty of PV output in the optimization.
To analyze the output results of different devices, the optimization results of the scene with the highest probability of occurrence are selected for analysis. The output forces of different devices are shown in Figure 4, Figure 5, Figure 6, Figure 7, Figure 8 and Figure 9.
As shown in Figure 4, the energy storage devices are charged during the early morning load trough phase to increase the load trough. Meanwhile, it can been found that the gas turbine MT output gradually increases from early morning, and the output starts to stabilize at around 05:00 until the output gradually decreases at around 20:00 in the evening. During the midday load peak, the PV output reaches its maximum and the energy storage equipment is discharged to meet the load demand. In the afternoon, when the load is low around 16:00, the energy storage equipment is charged. At the evening peak around 19:00, the energy storage equipment is discharged to meet the demand.
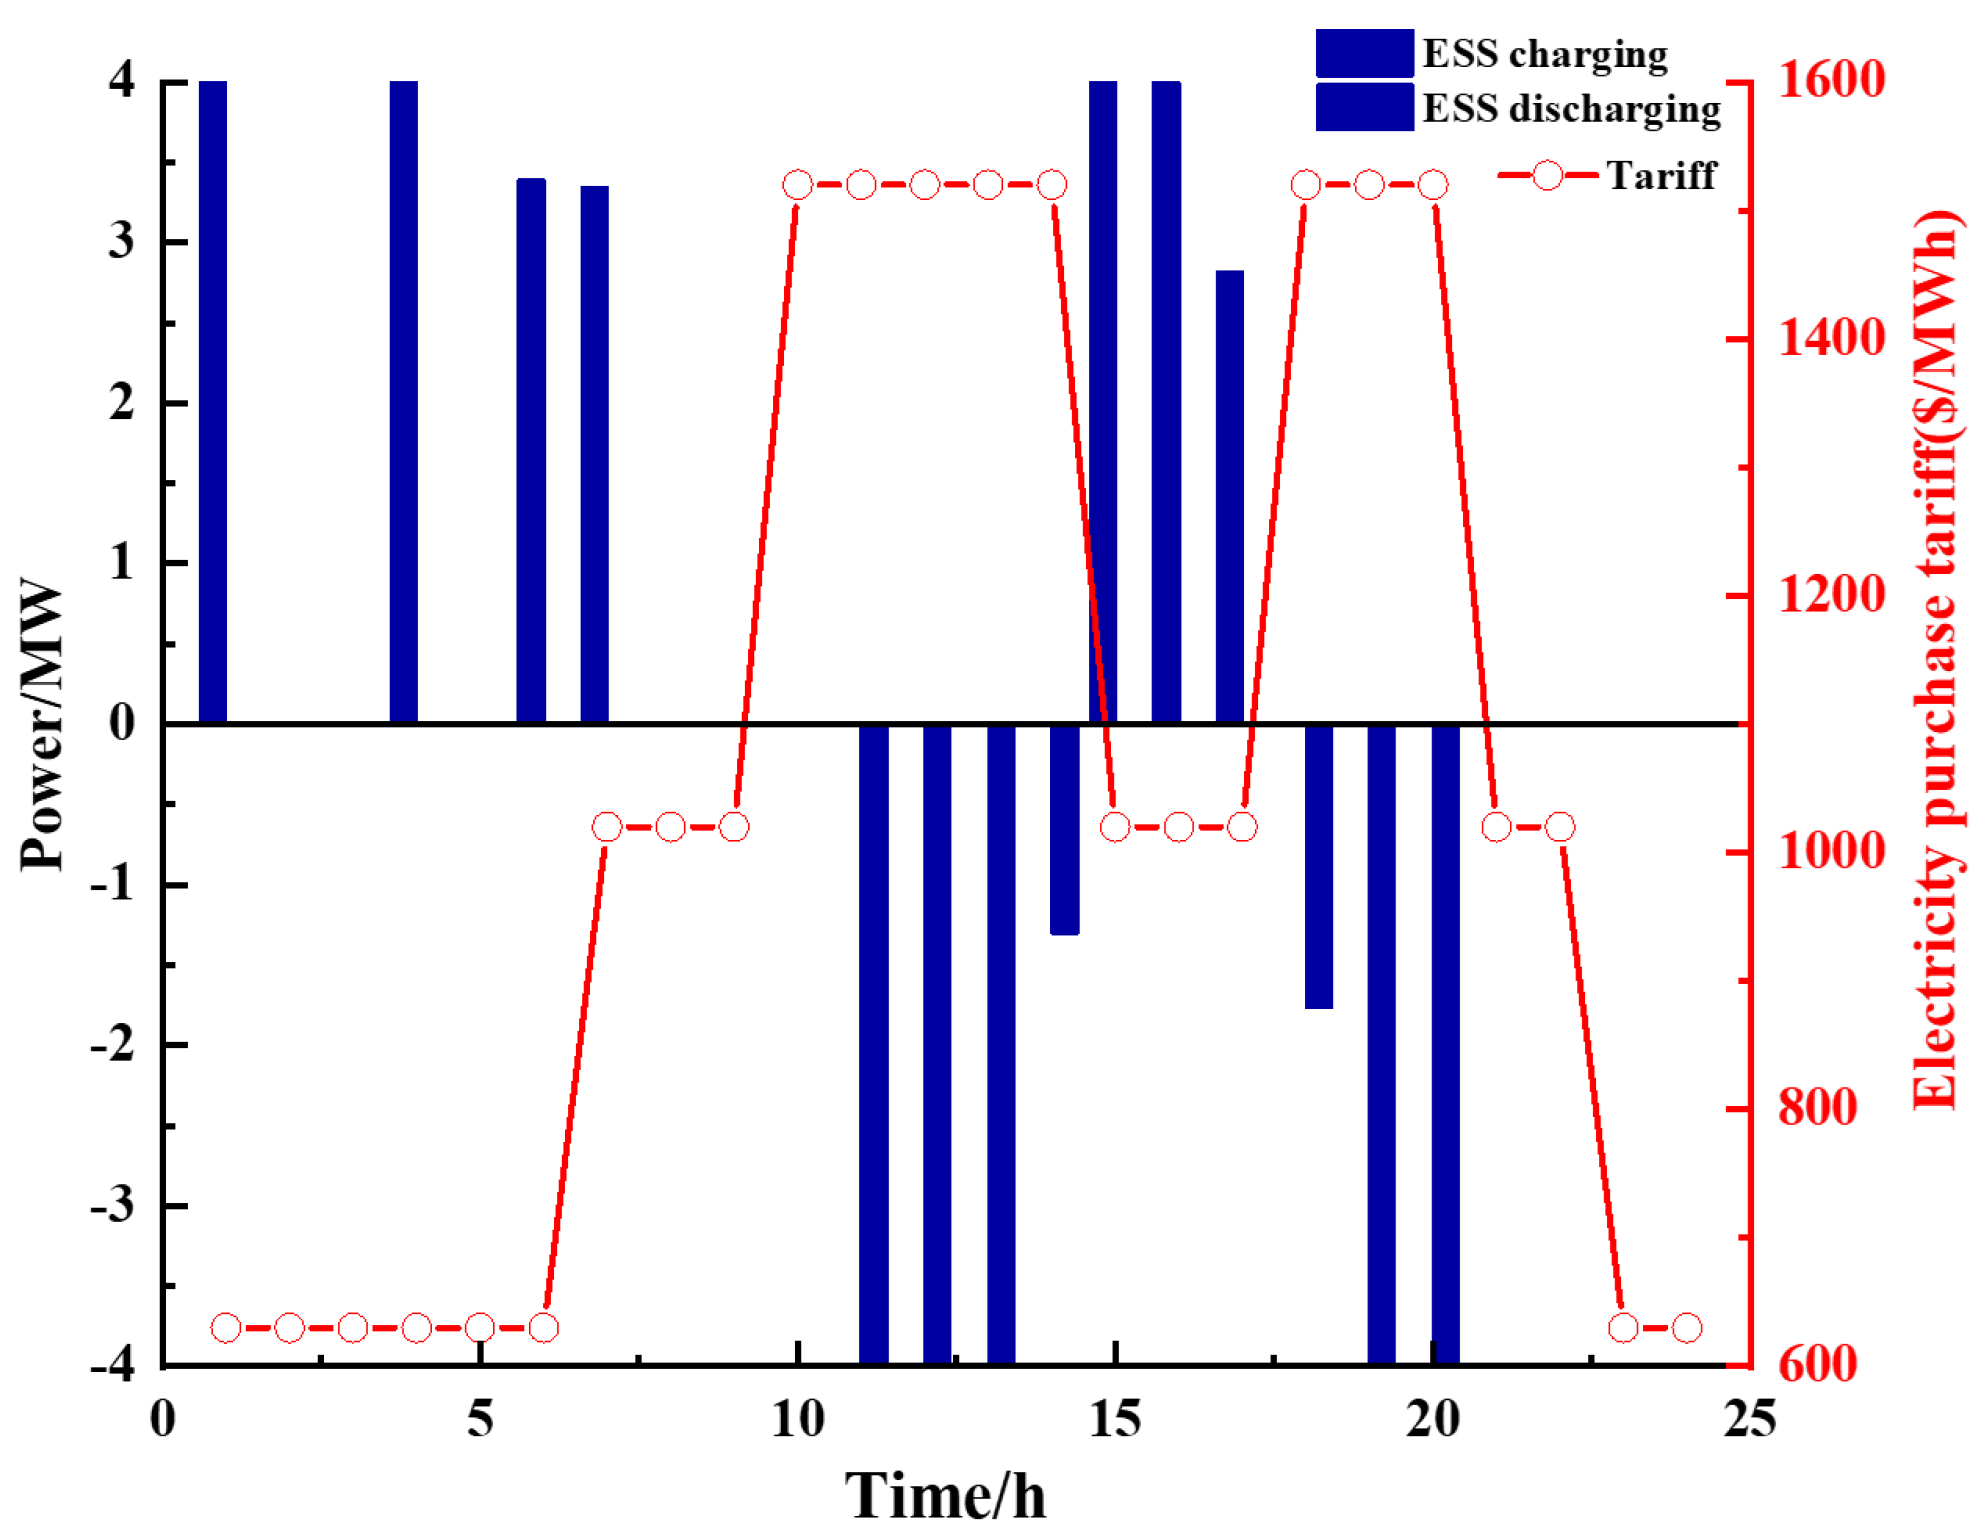
The relationship between energy storage device outputs and electricity prices is shown in Figure 5. It can be found that during the low load hours in the early morning, when electricity prices are low, energy storage is charged to reduce storage charging costs, and in the midday peak load hours, when electricity prices are higher, energy storage is discharged to gain revenue. The situation is similar in the afternoon load trough and evening load peak to enhance the economics of energy storage devices.
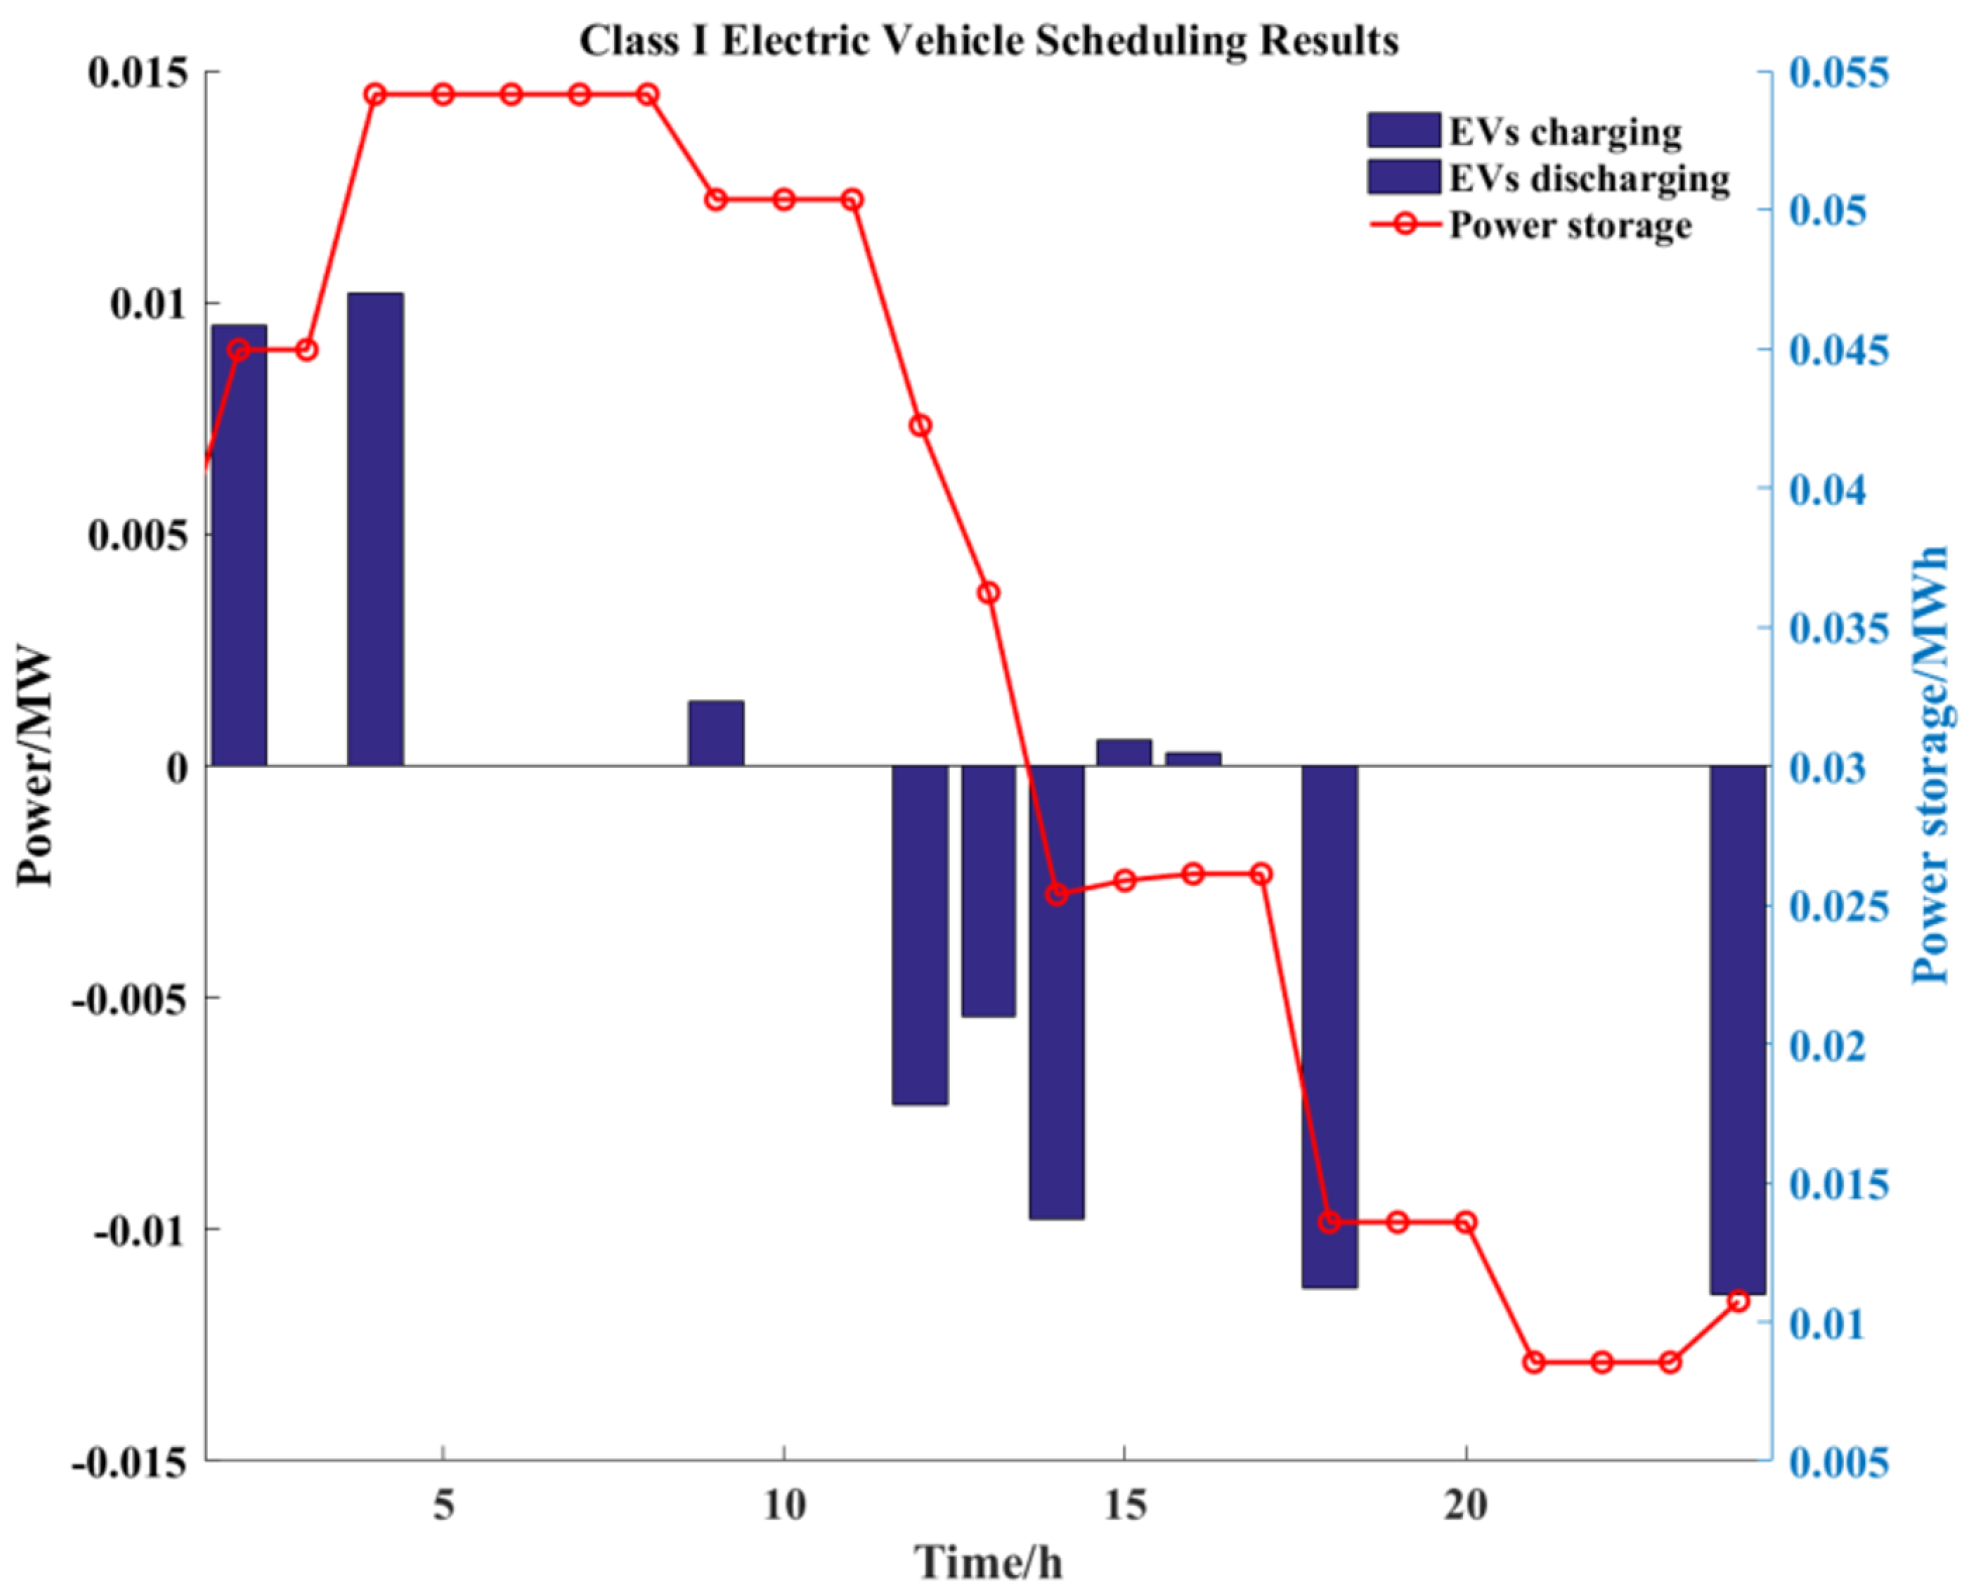
The optimization results of the two types of EVs are shown in Figure 6 and Figure 7. From the results, it can be found that the optimization results of the two types of EVs have some similarity, such as both charging at 01:00–05:00 am, which can save cost while lifting the load trough. Moreover, both discharge at the time of 12:00–14:00 h. The main difference between the optimization results of the two types EVs is the difference in the upper and lower limits of driving distance and storage capacity. In the first type of EVs, it only takes less time to be charged. However, the second type of EVs requires a longer time for charging. Therefore, the optimization needs to focus on the analysis in combination with the driving rules of EVs.
The results of the different levels of interruptible load optimization are shown in Figure 8. According to the results, it can be found that the first level of interruptible load has the highest percentage of interruptible load and the lowest price of interruptible compensation, and the first level of interruptible load has the highest percentage of interruptible load in the whole optimization period. Furthermore, the second and third levels of interruptible load are interrupted at approximately the same time, mainly during peak load hours. However, one of the main differences is that the second level of interruptible load is interrupted at 17:00 to reduce the load demand. The peak load reduction is achieved through the participation of different levels of interruptible loads in the optimization.
The optimization results of the air conditioning units are shown in Figure 9. It can be found that the chiller cooling capacity is not cooled for only four periods in the whole scheduling cycle. And the chiller storage tank storage has reached the upper limit at 7 h, so the chiller is limited to meet the indoor temperature requirements. This reduces the output of the chiller accordingly. During peak load and peak tariff hours, the storage tank releases cold energy and additional cooling is provided by the chiller. The storage and release of chilled energy from the storage tank can effectively make full use of the energy during low tariff hours. Therefore, the system operating costs are reduced effectively.

6. Conclusions

In this paper, based on stochastic optimization theory, a micro-grid day-ahead optimization model with DR and EVs considering PV power output uncertainty is constructed. The model is validated by the analysis of arithmetic cases under different scenes, and the following conclusions are obtained:
1.
Stochastic optimization deals with the uncertainty of PV output and the use of backward scene reduction method, which can effectively reduce the operating costs of micro-grid. The uncertainty of PV output is handled more realistically using stochastic optimization.
2.
Considering interruptible loads, air conditioning units and EVs in the micro-grid optimization behavior can achieve the reduction of micro-grid operation costs. Moreover, considering EVs alone is more beneficial to reduce micro-grid operating costs than considering DR alone.
3.
EV participation in the optimization needs to focus on the analysis of the travel pattern of EVs, so as to better achieve the aggregation and optimization of EVs.
The following research work will focus on considering the impact of orderly charging of electric vehicles on system optimization and the study of optimal scheduling of multiple energy micro-grids.

Author Contributions

Conceptualization, J.L. (Jianying Li); Methodology, J.L. (Jianying Li); Software, Y.Z. and J.L. (Jianquan Lu); Validation, M.Y., Y.Z. and J.L. (Jianqi Li); Formal analysis, J.L. (Jianying Li) and M.Y.; Investigation, J.L. (Jianquan Lu); Resources, M.Y.; Data curation, J.L. (Jianying Li), Y.Z. and J.L. (Jianquan Lu); Writing–original draft, J.L. (Jianying Li); Writing–review & editing, M.Y. and J.L. (Jianqi Li); Visualization, J.L. (Jianquan Lu); Project administration, J.L. (Jianying Li); Funding acquisition, J.L. (Jianqi Li). All authors have read and agreed to the published version of the manuscript.

Funding

This research was funded by the National Natural Science Foundation of China (Grant no. 62273142); the Program of Natural Science Foundation of Hunan Province (Grant no. 2021JJ30477 and 2021JJ50023); Hunan enterprise science and Technology Commissioner program (Grant no. 2021GK5074); the science and technology innovation program of Hunan Province (Grant no. 2021GK2010); the Research Foundation of Education Bureau of Hunan Province, China (Grant no. 22A0490 and B08007054).

Conflicts of Interest

The authors declare no conflict of interest.

References

  1. Jayalakshmi, N.; Jadoun, V.K.; Gaonkar, D.; Shrivastava, A.; Kanwar, N.; Nandini, K. Optimal operation of multi-source electric vehicle connected microgrid using metaheuristic algorithm. J. Energy Storage 2022, 52, 105067. [Google Scholar]
  2. Srilakshmi, E.; Singh, S.P. Energy regulation of EV using MILP for optimal operation of incentive based prosumer microgrid with uncertainty modelling. Int. J. Electr. Power Energy Syst. 2022, 134, 107353. [Google Scholar] [CrossRef]
  3. Wang, B.; Zhang, C.; Dong, Z.Y. Interval optimization based coordination of demand response and battery energy storage system considering SoC management in a microgrid. IEEE Trans. Sustain. Energy 2020, 11, 2922–2931. [Google Scholar] [CrossRef]
  4. Erenoğlu, A.K.; Şengör, İ.; Erdinç, O.; Taşcıkaraoğlu, A.; Catalão, J.P. Optimal energy management system for microgrids considering energy storage, demand response and renewable power generation. Int. J. Electr. Power Energy Syst. 2022, 136, 107714. [Google Scholar] [CrossRef]
  5. Sheidaei, F.; Ahmarinejad, A. Multi-stage stochastic framework for energy management of virtual power plants considering electric vehicles and demand response programs. Int. J. Electr. Power Energy Syst. 2020, 120, 106047. [Google Scholar] [CrossRef]
  6. Qiu, Y.; Li, Q.; Huang, L.; Sun, C.; Wang, T.; Chen, W. Adaptive uncertainty sets-based two-stage robust optimisation for economic dispatch of microgrid with demand response. IET Renew. Power Gener. 2020, 14, 3608–3615. [Google Scholar] [CrossRef]
  7. Zhao, H.; Lu, H.; Li, B.; Wang, X.; Zhang, S.; Wang, Y. Stochastic optimization of microgrid participating day-ahead market operation strategy with consideration of energy storage system and demand response. Energies 2020, 13, 1255. [Google Scholar] [CrossRef] [Green Version]
  8. MansourLakouraj, M.; Shahabi, M.; Shafie-khah, M.; Catalão, J.P. Optimal market-based operation of microgrid with the integration of wind turbines, energy storage system and demand response resources. Energy 2022, 239, 122156. [Google Scholar] [CrossRef]
  9. Rajamand, S. Effect of demand response program of loads in cost optimization of microgrid considering uncertain parameters in PV/WT, market price and load demand. Energy 2020, 194, 116917. [Google Scholar] [CrossRef]
  10. Karimi, H.; Jadid, S. Optimal energy management for multi-microgrid considering demand response programs: A stochastic multi-objective framework. Energy 2020, 195, 116992. [Google Scholar] [CrossRef]
  11. Gomes, I.; Melicio, R.; Mendes, V. A novel microgrid support management system based on stochastic mixed-integer linear programming. Energy 2021, 223, 120030. [Google Scholar] [CrossRef]
  12. Das, R.; Wang, Y.; Putrus, G.; Kotter, R.; Marzband, M.; Herteleer, B.; Warmerdam, J. Multi-objective techno-economic-environmental optimisation of electric vehicle for energy services. Appl. Energy 2020, 257, 113965. [Google Scholar] [CrossRef]
  13. Rezaeimozafar, M.; Eskandari, M.; Amini, M.H.; Moradi, M.H.; Siano, P. A bi-layer multi-objective techno-economical optimization model for optimal integration of distributed energy resources into smart/micro grids. Energies 2020, 13, 1706. [Google Scholar] [CrossRef] [Green Version]
  14. Hou, H.; Xue, M.; Xu, Y.; Xiao, Z.; Deng, X.; Xu, T.; Liu, P.; Cui, R. Multi-objective economic dispatch of a microgrid considering electric vehicle and transferable load. Appl. Energy 2020, 262, 114489. [Google Scholar] [CrossRef]
  15. Li, Y.; Li, K. Incorporating demand response of electric vehicles in scheduling of isolated microgrids with renewables using a bi-level programming approach. IEEE Access 2019, 7, 116256–116266. [Google Scholar] [CrossRef]
  16. Garcia-Guarin, J.; Alvarez, D.; Bretas, A.; Rivera, S. Schedule optimization in a smart microgrid considering demand response constraints. Energies 2020, 13, 4567. [Google Scholar] [CrossRef]
  17. Pandžić, H.; Kuzle, I.; Capuder, T. Virtual power plant mid-term dispatch optimization. Appl. Energy 2013, 101, 134–141. [Google Scholar] [CrossRef]
  18. Mesarić, P.; Krajcar, S. Home demand side management integrated with electric vehicles and renewable energy sources. Energy Build. 2015, 108, 1–9. [Google Scholar] [CrossRef]
  19. Wang, K.; Zhu, Z.; Guo, Z. Optimal Day-Ahead Decision-Making Scheduling of Multiple Interruptible Load Schemes for Retailer With Price Uncertainties. IEEE Access 2021, 9, 102251–102263. [Google Scholar] [CrossRef]
  20. Sun, G.; Qian, W.; Huang, W.; Xu, Z.; Fu, Z.; Wei, Z.; Chen, S. Stochastic adaptive robust dispatch for virtual power plants using the binding scenario identification approach. Energies 2019, 12, 1918. [Google Scholar] [CrossRef] [Green Version]
  21. Gurubalan, A.; Simonson, C.J. A comprehensive review of dehumidifiers and regenerators for liquid desiccant air conditioning system. Energy Convers. Manag. 2021, 240, 114234. [Google Scholar] [CrossRef]
  22. Ma, Y.; Xu, W.; Yang, H.; Zhang, D. Two-stage stochastic robust optimization model of microgrid day-ahead dispatching considering controllable air conditioning load. Int. J. Electr. Power Energy Syst. 2022, 141, 108174. [Google Scholar] [CrossRef]
  23. Ono, H.; Ohtani, Y.; Matsuo, M.; Yamaguchi, T.; Yokoyama, R. Optimal operation of heat source and air conditioning system with thermal storage tank using nonlinear programming. Energy 2021, 222, 119936. [Google Scholar] [CrossRef]
  24. ur Rehman, U.; Riaz, M.; Wani, M.Y. A robust optimization method for optimizing day-ahead operation of the electric vehicles aggregator. Int. J. Electr. Power Energy Syst. 2021, 132, 107179. [Google Scholar] [CrossRef]
  25. Yang, Z.; Li, Q.; Yan, Y.; Shang, W.L.; Ochieng, W. Examining influence factors of Chinese electric vehicle market demand based on online reviews under moderating effect of subsidy policy. Appl. Energy 2022, 326, 120019. [Google Scholar] [CrossRef]
  26. Ju, L.; Tan, Z.; Yuan, J.; Tan, Q.; Li, H.; Dong, F. A bi-level stochastic scheduling optimization model for a virtual power plant connected to a wind–photovoltaic–energy storage system considering the uncertainty and demand response. Appl. Energy 2016, 171, 184–199. [Google Scholar] [CrossRef] [Green Version]
  27. Chen, Z.; Wu, L.; Fu, Y. Real-time price-based demand response management for residential appliances via stochastic optimization and robust optimization. IEEE Trans. Smart Grid 2012, 3, 1822–1831. [Google Scholar] [CrossRef]
  28. Zeng, L.; Xu, J.; Wang, Y.; Liu, Y.; Tang, J.; Jiang, Z.; Wen, M. Day-ahead interval optimization of combined cooling and power microgrid based on interval measurement. Energy Build. 2022, 273, 112383. [Google Scholar] [CrossRef]
  29. Zeng, L.; Xu, J.; Wu, M.; Tang, J.; Wu, Q.; Wang, Q.; Fan, G. Day-ahead interval optimization for CCHP system considering uncertainty of wind power and PV. Int. J. Electr. Power Energy Syst. 2022, 138, 107895. [Google Scholar] [CrossRef]
  30. Liu, G.; Tao, Y.; Xu, L.; Chen, Z.; Qiu, J.; Lai, S. Coordinated management of aggregated electric vehicles and thermostatically controlled loads in hierarchical energy systems. Int. J. Electr. Power Energy Syst. 2021, 131, 107090. [Google Scholar] [CrossRef]
  31. Hosseini, S.M.; Carli, R.; Dotoli, M. A residential demand-side management strategy under nonlinear pricing based on robust model predictive control. In Proceedings of the 2019 IEEE International Conference on Systems, Man and Cybernetics (SMC), Bari, Italy, 6–9 October 2019; pp. 3243–3248. [Google Scholar]
Figure 1. Structure diagram of micro-grid.
Energies 16 03356 g001
Figure 2. Photovoltaic scenes and load requirements.
Energies 16 03356 g002
Figure 3. The curve of outdoor temperature.
Energies 16 03356 g003
Figure 4. Optimization results of different equipment output.
Energies 16 03356 g004
Figure 5. Energy storage optimization results under different electricity prices.
Energies 16 03356 g005
Figure 6. Optimization results of the first type of EVs (BYD).
Energies 16 03356 g006
Figure 7. Optimization results of the second type of EVs (Nissan).
Energies 16 03356 g007
Figure 8. Optimization results for interruptible loads.
Energies 16 03356 g008
Figure 9. Optimization results for air conditioning units.
Energies 16 03356 g009
Table 1. Different optimization scene settings.
ScenesPV UncertaintyDREVs
1
2
3
4
Table 2. Electric-vehicle-related parameters.
TypeBattery
Capacity
/(kWh)
Energy
Requirement
/(kW/mile)
Battery
Cost/$
Time of
Travel/h
The Driving Distance
Corresponding to
Each Travel
Period/(mile)
First570.22922,8008,1722,22
Second240.22896009,2111,11
Table 3. Environmental pollution gas parameters of gas turbines.
Pollution GasNOxCO2COSO2
Emission load/(kg/MWh)0.6188184.0830.17020.00093
Environmental value/($/kg)10.002880.1250.75
Penalty coefficient/($/kg)0.250.001250.020.125
Table 4. Optimization results for different scenes.
ScenesTotal Objective
Function/$
The Costs
of DR/USD
The Costs
of EVs/USD
Remaining
Costs/USD
15747.9813,799211.079−8262.13
225,391.613,800.8/11,590.8
39579.23/206.5519372.68
45659.0313,660.9210.036−8211.91
55695.589213,697.4327209.0186−8210.8621
Disclaimer/Publisher’s Note: The statements, opinions and data contained in all publications are solely those of the individual author(s) and contributor(s) and not of MDPI and/or the editor(s). MDPI and/or the editor(s) disclaim responsibility for any injury to people or property resulting from any ideas, methods, instructions or products referred to in the content.