Abstract
An oil recovery technique, different composition waterflooding (DCW), dependent on the varying injected water composition has been the subject of various research work in the past decades. Research work has been carried out at the lab, well and field scale whereby the introduction of different injection water composition vis-a-vis the connate water is seen to bring about improvements in the oil recovery (improvements in both macroscopic and microscopic recoveries) based on the chemical reactions, while being sustainable from ease of implementation and reduced carbon footprint points of view. Although extensive research has been conducted, the main chemical mechanisms behind the oil recovery are not yet concluded upon. This research work performs a data analysis of the various experiments, identifies gaps in existing experimentation and proposes a comprehensive experimentation measurement reporting at the system, rock, brine and oil levels that leads to enhanced understanding of the underlying recovery mechanisms and their associated parameters. Secondly, a sustainable approach of implementing Machine Learning (ML) and Artificial Intelligence Tools (AIT) is proposed and implemented which aids in improving the screening of the value added from this DCW recovery. Two primary interaction mechanisms are identified as part of this research, gaps in current experimentation are identified with recommendations on what other parameters need to be measured and finally the accuracy of application of ML/AI tools is demonstrated. This work also provides for efficient and fast screening before application of more resource and cost intensive modeling of the subsurface earth system. Improved understanding, knowledge and screening enables making better decisions in implementation of DCW, which is a sustainable recovery option given the current state of affairs with zero carbon and net zero initiatives being on the rise.
1. Introduction
Different composition waterflooding (DCW) has been in the spotlight of intense research as a potential Enhanced Oil Recovery (EOR) method. DCW research has panned multi-scales from the core level to full field while covering pilots, and simulation modeling. DCW leads to improved recovery from the oilfields through not only physical displacement of the hydrocarbon but also chemical interactions between the rock and fluids leading to improved displacement efficiency.
Different multi-scale experiments [1,2] have demonstrated the improved oil recovery resulting from injecting water which is different in composition as compared to the in-situ formation water. Despite multitude of research based investigations, the critical chemical mechanisms for DCW aren’t confidently ascertained [3]. The initial research on DCW started with coreflood experiments carried out on Berea sandstones. Morrow et al. research [4] is one of the initial cited researches on sandstones. Ever since the research based investigation of DCW has progressed from core plugs to composite cores and from sandstones to carbonates [5]. The research publications currently provide proof of research at multi-scale levels from the core scale to wellbore, inter-well and field scale [6,7] where the impact of DCW effects in terms of additional incremental cumulative volumetric oil production/recovery and reduction in residual oil saturation were evidenced [2,8,9]. It is hypothesized that the improved recovery of oil is a function of the interactions between the rock, connate brine, injected brine and in-situ oil leading to changes in wettability [10] and interfacial tension (IFT) [6,11,12,13,14,15,16]. Successful prediction of DCW hinges on the comprehension of the system (oil-brine-rock) interplay [17]. Therefore, understanding and screening of the DCW EOR would involve taking into account multiple variables related to the rock, fluids and the system, which poses a considerable challenge [18].
The main mechanisms identified from the decades of research and arguments contrary are summarized as follows. McGuire et al. [19] posited that increment of pH and saponification of the oil can generate natural-surfactants which improve recovery by lowering of IFT. However, other investigators (Lager et al., 2006) [20] have stated, on the contrary, that positive effect of DCW has been evidenced in cores with low acid-numbers (not conducive to alkaline flooding) by lowering of the residual oil saturation. Lately, it has been demonstrated by Al-saedi et al. [16] that pH change is observed with the incremental positive change of volumetric cumulative oil production. Increased values of pH in both rock types (sandstone & carbonate) corefloods from areas around North Sea and Middle East have been reported where the value changes reported are from around 7–8 pH upto 9–10 pH. During DCW, the cations attached to the clay are substituted by the protons present in the water phase leading to an increase in the pH of the system due to release of hydroxyl ions [21].
The migration of fines being impacted by salinity, rate of flow, pH, temperature, residual oil saturation, fractional flow of oil and water, polarity of oil and core wettability was stated in the investigation by Sarkar et al. [22]. Tang et al. [23] purported that injection of different composition water can initiate the detachment of particles of clay from the rock surface. Boussour et al. [20] published results which exhibit incremental oil recovery without permeability reduction and no fines-particles in the effluent stream [24,25] contradicting the aforementioned research on fine migration being an important mechanism for DCW. The authors posit that absence of fine-particles in the effluent doesn’t rule out the release of fines which can be in part linked to the pressure difference increases and warrants substantiation by scanning of cores at the end of the flooding experiment [26]. In carbonates the dissolution of the rock has been demonstrated through NMR (Nuclear Magnetic Resonance) measurements indicating the change in the surface-relaxation of the rock and improved connectivity among the porous system [5].
The exchange of cation and anions in sandstones and carbonates respectively is Multicomponent Ion Exchange (MIE). In sandstones, DCW desorbs the hydrocarbon from the rock through lower valence cation substitution the higher valence cation (e.g., Ca2+ by Na+) [27]. DCW results in the release of liquid hydrocarbons by replacing of ions [28] and the system becomes more water-wet. Research done by Bourbiaux [29] demonstrates that changing the salinity alone but not altering the divalent/monovalent cations ratio doesn’t induce the desired DCW EOR effect.
Double Layer Expansion is the expansion of the Electrical Double Layer (EDL), charged electrical envelope between the system which in this case comprises the hydrocarbon-water-rock, as a result of ion exchange/interaction and/or pH related dissociation. It was posited by Lee et al. [30]. The wettability alteration of the rock is due to an expanding/contracting EDL. This can be measured with the zeta potential, the charges at the oil/brine and rock/brine interfaces are the prime element that controls the water film stability between the oil and the rock and hence the rock wettability. In many researches and investigation [31,32] EDL was identified as a primary mechanism in DCW. Rezaei Doust et al. introduced the concept of salt-in effect where desorption of the oil from the rock due to different and lower salinity water presence occurs [33]. Akin to EOR mechanisms of alkaline/surfactant techniques, surfactants are generated by DCW as a result of the oil-water interaction, which causes release of oil from rock [19] through alteration of the IFT between oil-water. However, DCW experiments have demonstrated evidence of incremental oil recovery with low Acid-Number contrary to the literature on surfactant flooding which states the need fora high Acid-Number. Yet another mechanism is formation of micro-dispersions (oil surrounding a water core) which results in EOR through two separate mechanisms of wettability alteration through surface active materials removal and expansion of the layer of high salinity connate-water [14].
Efforts by researchers were done to address this challenge of having to consider multiple variables and mechanisms through statistical regression analysis [34] which highlighted that the parameters of chlorite and kaolinite were positively correlated to the residual oil saturation. These findings identified the importance of the rock mineral composition on the success of the DCW EOR. However, the main limitation to the study was insufficient/incomplete experimental data and measurements of the initial and boundary conditions. Overcoming this limitation requires the use of machine learning (ML) and artificial intelligence tools (AIT). The major challenge in the usage of ML and AIT is that they cannot be generalized as they are specific to a data set to which they are calibrated, and this also requires that they are supplied with large amounts of data for repeated calibration. Additionally, the challenges of overfitting, excessive training, coincidence, bias and lack of interpretability are prevalent in these cases.
Although ML/AIT have the aforementioned challenges it has found prevalent applications in the Oil and Gas Industry from exploration, reservoir characterization, reservoir development to forecasting and predictive maintenance of facilities [35].
The challenges mentioned in DCW EOR and application of ML/AIT provided the motivation for this work to perform meta-analysis of different experiments which helped to identify the gaps in the experiments, identify the different mechanisms, the list of critical input parameters and to identify a sustainable approach towards application of AI starting with an ML system which enables quick screening of the subject reservoir system before proceeding with detailed experimentation and modeling. The good accuracy and hence predictability from AI systems in supporting screening for DCW is further presented in this work.
2. Method, Experiments and Mechanisms
The method involved a detailed analysis of the varied scales of experiments (eg. coreflood, single well, multi well, sector and field level. The main parameters contributing to the impact of DCW is still centered around the properties of the system, rock, brine and hydrocarbon despite the scales of the experiments and the incremental recovery is considered which normalize the scale effect) which helped in evaluating the different essential parameters like, reservoir conditions at initial state, mineral compositions of the rock-surface, formation-water, crude oil/hydrocarbon, injected-brine and their interactions/interplay, leading to wettability changes, production profiles in terms of oil recovery, pore volume injected, effluent ion analysis, pressure differential response and final tertiary recovery (Figure 1). From Figure 1, the key parameters that are reported in the different experiments are illustrated and certain key parameters that are important but not reported by many experiments are highlighted. The lack of information of these critical parameters like for example the rock mineral composition are critical to have a comprehensive data set that aids in better understanding of the success of the DCW EOR. Another critical component highlighted through the data analysis of the different experiments is the lack of consistent information of the oil/hydrocarbon properties like Total Acid Number and Total Base Number. The numbers of 1 and 36 on the left side of Figure 1 depicts the number of experiments. The numbers of 8 and 32 on the right side of Figure 1 depicts the number of parameters reported in each of the experiments. The statistical summary of the parameters are presented in Table 1.
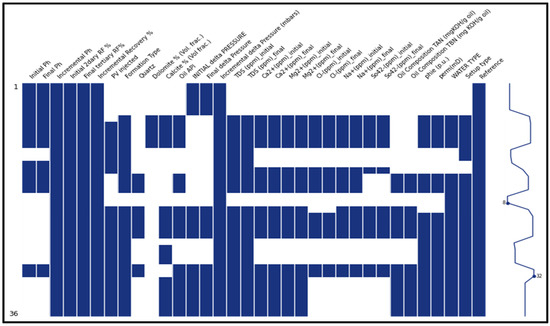
Figure 1.
Matrix of parameters measured and reported from various experiments.

Table 1.
Statistical Summary of the Various Input Parameters from DCW Experiments.
Further data analysis was carried out to understand the correlation between the various parameters listed in the different experiments. The correlation matrix represents the parameters that have the positive and negative correlations as shown in Figure 2. The blue colours show the positive correlations while the orange colours show the negative correlations. Strong correlations are seen with respect to the fluid properties of Oil API and cation concentrations with respect to the incremental recovery.
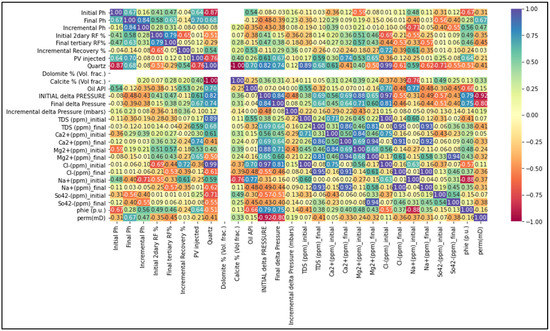
Figure 2.
Positive and Negative Parameter Correlation Matrix from various experiments.
Morrow et al. on the basis of their low salinity investigation on Berea sandstone attributed the significant incremental oil production to necessary conditions [12] as: presence of clay minerals; connate-water existence and existence of hydrocarbon to create a mixed-wet setting. The coreflood experiments were done where the oil recovery versus the brine injection {pore volumes (PV)} were monitored and plotted indicating impact of DCW for Berea cores [12].
The relative proportion of the cation/anions in the injected-brine vis-a-vis connate-brine is to be accounted for comprehending the DCW effect [28]. Seccombe et al. [8] showed that based on Endicott field corefloods and SWCTT that there exists a linear relationship (1:1) of the incremental oil recovery and the percentage of the clay content (a range between 4–14% of clay content results in 4–14% additional oil recovery). The wettability of the reservoir at the start of DCW has an impact on the incremental recovery and wettability is impacted by the temperature, crude composition, the brine composition & pH and the rock minerals & composition [20].
DCW EOR has been shown to be effective in carbonates too [36,37,38] and this is because of the mixed wet state generally found in carbonates, which is one of the initial conditions necessary for DCW improved recovery. The injected water ionic composition is critical in recovery from carbonates in addition to the identification of the recovery being directly proportional to increase in temperature.
The above are in line with the data analysis findings as evidenced from the correlation matrix (Figure 2) where the incremental recovery and the final recovery are impacted by the initial and final pH, the fluid ion composition, the rock composition, rock porosity and permeability, the delta pressure experienced during the flooding and the recovery factor achieved before the start of the DCW EOR.
The multiple interaction parameters and mechanisms necessitate the use of comprehensive ML/AIT models that can help in understanding the critical parameters and screening for DCW EOR. The following are some of the approaches. ML/AIT tools have been used in reservoir exploration, reservoir management, reservoir development and predictive maintenance both as a classifier and regressor [35]. One of the researches have demonstrated the application of Artificial Neural Network based AIT to polymer projects [39]. Another research involved predicting the recovery factor for a water flood based on the data from reservoirs that were used for testing and then using ANN for prediction based on 10 parameters involving the reservoir rock and fluid properties [40]. Reservoir selection and application have involved application of Random Forest, Decision Trees and Gradient Boosting coupled with numerical simulation and optimization algorithms [41,42,43,44]. Sustainable application of the ML/AIT approach would hence involve first the collection of data from different sources either from lab/experiments and/or couple with data from physics based models and then using the data for training, validation and testing phase using different ML/AIT algorithms. This method has been used to develop a sustainable approach to understanding and screening for the DCW EOR. Physics based numerical simulations with different uncertainties on the operations of the flooding mechanisms were carried out to determine the responses for the cumulative oil production. The numerical simulation set up is shown in Figure 3 with an injector at one end and the producer at the other end. The saturation distribution is shown in Figure 3. This was followed by the creation of the multiple experiments for the different salinity injection. The data snapshot followed by the statistical summary of the data are shown in Table 2 and Table 3 respectively. The correlation matrix of the parameters as illustrated in Figure 4 provides understanding of the collinearity between the parameters and enhancing the understanding of the pertinent parameters. This is followed by application of the different ML models where multi-variate linear regression training and testing scores are presented in Table 4 and Table 5 respectively. The high R-squared values of the training and testing provide confidence in the model. Table 6 shows the model predictability with respect to the cumulative oil production and the error % is between −0.7% to 1.2% which demonstrates the high predictability of the multi-variate linear regression model.
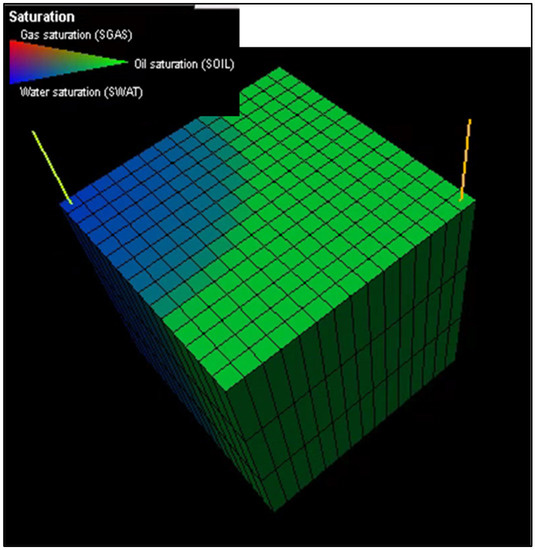
Figure 3.
Physics based numerical 3D model setup with Producer and Injector.
Table 2.
Data Snapshot of the key input and output parameters for DCW EOR physics based model.
Table 3.
Data Statistics of the parameters for DCW EOR physics based model.
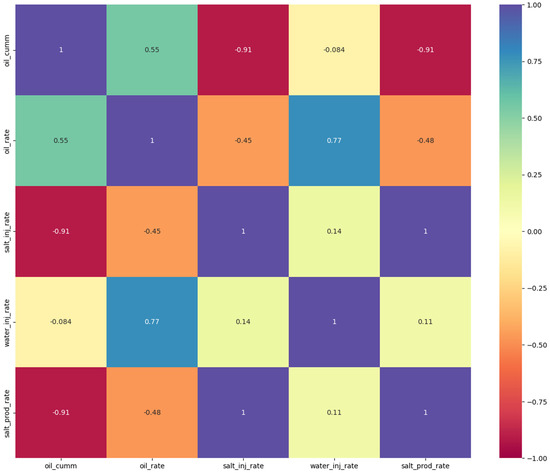
Figure 4.
Correlation Matrix of the parameters for the 3D Physics based model.
Table 4.
Training performance scores from multi-variate linear regression.
Table 5.
Testing Performance scores from multi-variate linear regression.
Table 6.
Prediction Results and the Error % from multi-variate linear regression.
3. Results
The results from the data analysis of different scale experiments highlight the correlation between multiple parameters that impact DCW outcome and further supports in identifying missing parameters which are not being reported/measured (Figure 1 and Figure 2). The sustainable process of application of ML/AI is as shown in Figure 5 which allows both better understanding and screening of DCW EOR. The process starts with data collection from various experiments either lab or physics based models, this is followed by data screening then by data analysis and finally application/evaluation of the ML/AI algorithms. Figure 6 shows an example of bivariate data analysis which aids in the understanding of the relationship and correlation between the multi-parameters.
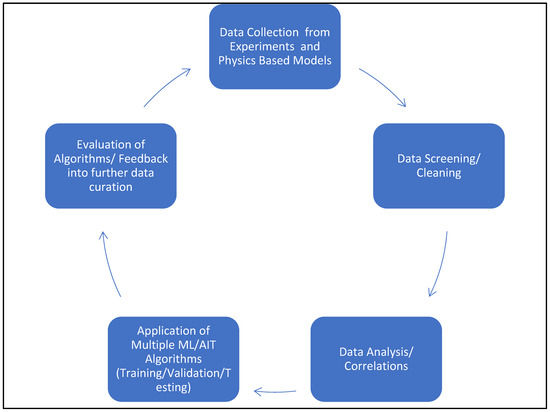
Figure 5.
Sustainable Process Workflow of ML/AI Application towards DCW EOR.
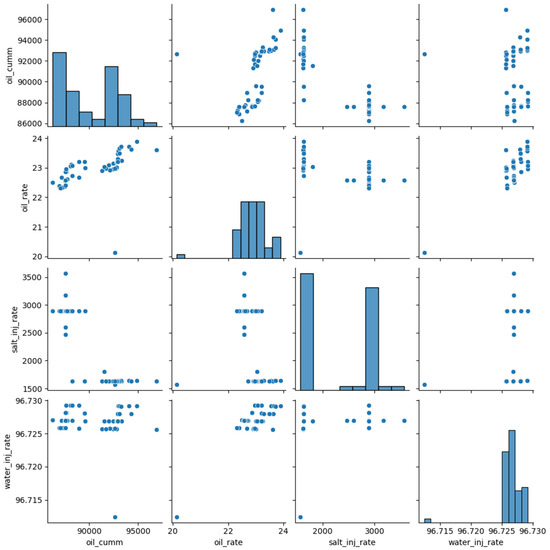
Figure 6.
Pair Grid Analysis of the different parameters from the physics based model.
Random Forest (RF) a classification and regression algorithm, contains various decision trees (DT) and it overcomes the disadvantages of over fitting or having a local optima that comes with using a single DT. RF involves the bagging approach where an ensemble of the results from different trees of low correlations are used for an enhanced prediction. RF training and testing results are depicted in Table 7 and Table 8 respectively. The hyperparameters used in the RF are max_depth in the range from 4 to 10, max_features of sqrt and log; n_estimators in the range of 80 to 120 which were optimized based on the grid search.
Table 7.
Random Forest Training performance scores.
Table 8.
Random Forest Testing performance scores.
Table 9 shows the model predictability with respect to the cumulative oil production and the error % is between −0.4% to 1.07% which demonstrates the high predictability of the Random Forest model.
Table 9.
Random Forest Prediction Results and the Error %.
AdaBoost is a supervised ML model used for classification and regression problems. It provides strong predictions through sequentially learning from a combination of a series of weak models AdaBoost training and testing results are presented in Table 10 and Table 11 respectively. The hyperparameters used in AdaBoost are learning rate from 0.01 to 1; n_estimators in the range of 10 to 100 which were optimized based on the grid search.
Table 10.
AdaBoost Training performance scores.
Table 11.
AdaBoost Testing performance scores.
Table 12 shows the AdaBoost model predictability with respect to the cumulative oil production and the error % is between −0.7% to 0.99% which demonstrates the high predictability of the AdaBoost model.
Table 12.
AdaBoost Prediction Results and the Error %.
The performance scores are compared between the multi-variate linear regression, Random Forest and AdaBoost are presented in Table 13.
Table 13.
Performance Score comparison between the multi-variate linear regression and different ML/AIT models.
4. Discussion
The findings from the data analysis of the different experiments highlights that there are two primary interactions which is the rock-fluid and the fluid-fluid interactions, also it highlights the need for comprehensive data collection and a consistent standard for measurement and reporting that will enhance the understanding of the DCW EOR mechanisms and its critical parameters. A minimum requirement of experiments is to conduct the corefloods at full reservoir conditions using the live oil and formation brine. This needs to be coupled with in-situ saturation monitoring utilizing gamma ray detectors and also semi dynamic Pc measurement techniques that are able to capture the full cycle of drainage and imbibition Pc curves. From these curves we can measure the area under the spontaneous imbibition to evaluate the change in the wettability of the core plug. Additionally the core plug should be taken from the full core after the X-ray CT scan/X-ray diffraction (XRD) and the evaluation of the core plug for the level of heterogeneity based on pore throat size distribution needs to be done [45].
The experiments should also include atomic force microscopy and zeta potential measurement at the different interfaces which are measured in mV and provide indication of the change in the charges at the interface as the DCW is performed through the cores. Additionally, to understand the effect caused due to DCW experiments evaluation of the liquid-liquid interactions through microscopic photographs need to be conducted.
For the different components in the DCW interaction there are specific tests/experiments to be done as follows:
For the oil: TAN/TBN/SARA, mass spectrometry, viscosity, PVT.
For the oil-water interface: AES, XPS (X-ray photoelectron spectroscopy, to determine the surface composition by measuring the surface carbon content), Zeta-potential analyser and CEC.
For the water: Brine analysis, PHREEQC, Ph.
For the water-rock interface: AES, XPS, Zeta-potential analyser, CEC.
For the bulk rock: SEM-EDX, XRD, XRF.
The above measurements and modelling requirements are time consuming and resource intensive and therefore it is prudent to have a pre-screening technique [18] that will ensure efficiency and greater value added for the time and effort as researchers and investigators move from initial screening and understanding to the field implementation.
The sustainable approach of ML/AIT has been presented which shows that better screening of DCW EOR process and the determination of critical parameters can be achieved. In the sustainable approach the cycle from data gathering/collection, cleaning/screening, correlation/analysis, application and evaluation of ML/AIT enables better predictability and hence screening of the DCW EOR. As demonstrated and presented in Table 13 the Random Forest algorithm and AdaBoost provide better predictability as compared to the initial multi-variate linear regression. This provides a sustainable approach for screening of the DCW EOR before proceeding to more resource intensive experimental data gathering to piloting and full field implementation.
5. Future Work
The future work involves further development of the ML/AIT from the current stage to the next stage inclusive of further models and data sets from multiple sources. This would also involve creation of multiple modeling scenarios with variation in different parameters and the impact of these parameters on the recovery. This can further lead to identification of the critical parameters from the modeling perspective. Additionally, based on the comprehensive experiment data collection and measurements identified through this work, further lab coreflood/pilot/field experiments can be performed, analysed and screened for enhanced understanding and reporting of the critical mechanism and its associated parameters.
6. Conclusions
Although extensive R&D has been conducted on the topic of DCW, the critical chemical mechanisms are still an area of further investigation and ongoing research. The following are the main conclusions that are arrived at based on this work.
- Through the review of various experiments predominantly hinging upon lab based corefloods the underlying critical mechanism includes 2 primary interactions (rock-fluid & fluid-fluid) which alters wettability, interfacial tension, or both.
- The detailed meta-analysis of the various experiments highlights a lack of comprehensive data set of measurements and no standard approach being followed for reporting out DCW EOR experiments, which hinders the understanding of the critical mechanisms and their parameters. A comprehensive experimentation and measurement is recommended which will alleviate the aforementioned challenge.
- Experiments should entail measurement at both the initial and final conditions of the experimentation and specific measurements for each component rock (mineral composition through SEM-EDX, XRD, XRF), brine (pH, Ionic compositions, TDS), oil (API, TAN, TBN) and total system (System temperature, Delta Pressure, Capillary Pressure, Relperm, Wettability, IFT, Recovery Factors, XES, AES, Zeta Potential at interfaces and CEC).
- This work presents and implements a sustainable process workflow for application of ML/AI (comparison between multi-variate Linear Regression, Random Forest and AdaBoost) which ensures improved screening of the DCW EOR process before investment of considerable resources into experimentation and measurement.
- This work concludes better accuracy is obtained from ML/AI as compared to multi-variate Linear Regression with error in the prediction of the Cumulative Oil production being narrowed down to the range of −0.4% to 1.07%. This clearly demonstrates the capability of the ML/AI models to reproduce with accuracy the results comparable to computationally intensive 3-D physics based models for DCW.
Author Contributions
Conceptualization, T.T. and P.S.; methodology, T.T.; software, T.T.; validation, T.T., P.S. and D.K.G.; formal analysis, T.T.; investigation, T.T.; resources, T.T.; data curation, T.T.; writing—original draft preparation, T.T.; writing—review and editing, T.T.; visualization, T.T.; supervision, P.S. and D.K.G.; project administration, T.T., P.S. and D.K.G.; funding acquisition, T.T. All authors have read and agreed to the published version of the manuscript.
Funding
This research received no external funding.
Data Availability Statement
The supporting data can be provided based on further request.
Acknowledgments
The authors would like to thank the University of Petroleum and Energy Studies administration and the Department of Petroleum Engineering & Earth Sciences, UPES for providing all the necessary support for conducting this work. Special thanks to Sharon Sebastian for her inputs on Data Science and ML/AI.
Conflicts of Interest
The authors declare that they have no known competing financial interests or personal relationships that could have appeared to influence the work reported in this paper. The authors also declare no conflict of interest.
References
- Singh, N.; Sarma, H.K. Successful in the lab, not as effective in the field? Uncertainties in the field observations of low salinity water flooding in sandstone and carbonate reservoirs—A critical analysis. In Proceedings of the SPE Western Regional Meeting 2021, Virtual, 20–22 April 2021. [Google Scholar] [CrossRef]
- Vledder, P.; Fonseca, J.C.; Wells, T.; Gonzalez, I.; Ligthelm, D. Low salinity water flooding: Proof of wettability alteration on a field wide scale. In Proceedings of the SPE Improved Oil Recovery Symposium 2010, Tulsa, OK, USA, 24–28 April 2010; pp. 1–10. [Google Scholar] [CrossRef]
- Nande, S.B.; Patwardhan, S.D. A review on low salinity waterflooding in carbonates: Challenges and future perspective. J. Pet. Explor. Prod. Technol. 2021, 12, 1037–1055. [Google Scholar] [CrossRef]
- Tang, G.Q.; Morrow, N.R. Salinity, Temperature, Oil Composition, and Oil Recovery by Waterflooding. SPE Reserv. Eng. 1997, 12, 269–276. [Google Scholar] [CrossRef]
- Yousef, A.A.; Al-Saleh, S.H.; Al-Kaabi, A.; Al-Jawfi, M.S. Laboratory Investigation of the Impact of Injection-Water Salinity and Ionic Content on Oil Recovery from Carbonate Reservoirs. SPE Reserv. Eval. Eng. 2011, 14, 578–593. [Google Scholar] [CrossRef]
- Skauge, A. Low salinity flooding—A critical review. In Proceedings of the IOR 2013-17th European Symposium on Improved Oil Recovery, St. Petersburg, Russia, 16–18 April 2013; pp. 16–18. [Google Scholar]
- Zahid, A.; Stenby, E.H.; Shapiro, A.A. Smart waterflooding (high sal/low sal) in carbonate reservoirs. In Proceedings of the SPE Europec/EAGE Annual Conference 2012, Copenhagen, Denmark, 4–7 June 2012. [Google Scholar] [CrossRef]
- Seccombe, J.; Lager, A.; Jerauld, G.; Jhaveri, B.; Buikema, T.; Bassler, S.; Paskvan, F. Demonstration of low-salinity EOR at Interwell scale, Endicott Field, Alaska. In Proceedings of the SPE Improved Oil Recovery Symposium, Tulsa, OK, USA, 24–28 April 2010. [Google Scholar] [CrossRef]
- Lager, A.; Webb, K.J.; Collins, I.R.; Richmond, D.M. LoSal enhanced oil recovery: Evidence of enhanced oil recovery at the reservoir scale. In Proceedings of the SPE Symposium on Improved Oil Recovery, Tulsa, OK, USA, 20–23 April 2010; Available online: http://www.onepetro.org/doi/10.2118/113976-MS%0Ahttps://www.onepetro.org/download/conference-paper/SPE-113976-MS?id=conference-paper%2FSPE-113976-MS (accessed on 15 January 2022).
- Suijkerbuijk, B.M.; Hofman, J.P.; Ligthelm, D.J.; Romanuka, J.; Brussee, N.; van derLinde, H.A.; Marcelis, A.H. Fundamental investigations into wettability and low salinity flooding by parameter isolation. In Proceedings of the SPE Improved Oil Recovery Symposium 2012, Tulsa, OK, USA, 14–18 April 2012; pp. 1–23. [Google Scholar] [CrossRef]
- Sheng, J.J. Critical Review of Low-Salinity Waterflooding. J. Pet. Sci. Eng. 2014, 120, 216–224. [Google Scholar] [CrossRef]
- Morrow, N.; Buckley, J. Improved Oil Recovery by Low-Salinity Waterflooding. J. Pet. Technol. 2011, 63, 106–112. [Google Scholar] [CrossRef]
- Emadi, A.; Sohrabi, S.M. Visual investigation of oil recovery by LowSalinity water injection: Formation of water micro-dispersions and wettability alteration. In Proceedings of the SPE Annual Technical Conference and Exhibition, New Orleans, LA, USA, 30 September–2 October 2013; pp. 1–15. [Google Scholar] [CrossRef]
- Mahzari, P.; Sohrabi, M. Crude oil/brine interactions and spontaneous formation of micro-dispersions in low salinity water injection. In Proceedings of the SPE Improved Oil Recovery Symposium, Tulsa, OK, USA, 12–16 April 2014. [Google Scholar] [CrossRef]
- Alshakhs, M.J.; BuKhamseen, N.Y.; AlGarni, S.A. Paradigm Shift in Smartwater Simulation Methods. In Proceedings of the International Petroleum Technology Conference, Dhahran, Saudi Arabia, 13–15 January 2020. [Google Scholar]
- Al-Saedi, H.N.; Flori, R.E.; Alsaba, M. Investigation of Smart Waterflooding in Sandstone Reservoirs: Experimental and Simulation Study Part 2. SPE J. 2020, 25, 1670–1680. [Google Scholar] [CrossRef]
- Egbe, D.I.O.; Ghahfarokhi, A.J.; Amar, M.N.; Torsæter, O. Application of Low-Salinity Waterflooding in Carbonate Cores: A Geochemical Modeling Study. Nat. Resour. Res. 2020, 30, 519–542. [Google Scholar] [CrossRef]
- Thomas, T.; Sharma, P.; Gupta, D. Meta-analysis of rock, brine, oil interactions and expert system development. Mater. Today Proc. 2022, 50, 969–976. [Google Scholar] [CrossRef]
- McGuire, P.L.; Chatham, J.R.; Paskvan, F.K.; Sommer, D.M.; Carini, F.H. Low salinity oil recovery: An exciting new EOR opportunity for Alaska’s North Slope. In Proceedings of the SPE Western Regional Meeting, Irvine, CA, USA, 30 March–1 April 2005; pp. 1–15. Available online: https://www.onepetro.org/conference-paper/SPE-93903-MS (accessed on 15 January 2022).
- Soraya, B.; Malick, C.; Philippe, C.; Bertin, H.J.; Hamon, G. Oil Recovery by Low-Salinity Brine Injection: Laboratory Results on Outcrop and Reservoir Cores. In Proceedings of the SPE Annual Technical Conference and Exhibition, New Orleans, LA, USA, 4–7 October 2009. [Google Scholar] [CrossRef]
- Austad, T.; Rezaeidoust, A.; Puntervold, T. SPE 129767 chemical mechanism of low salinity water flooding in sandstone reservoirs. In Proceedings of the SPE Improved Oil Recovery Symposium, Tulsa, OK, USA, 24–28 April 2010; pp. 19–22. [Google Scholar]
- Sarkar, A.; Sharma, M. Fines Migration in Two-Phase Flow. J. Pet. Technol. 1990, 42, 646–652. [Google Scholar] [CrossRef]
- Tang, G.-Q.; Morrow, N.R. Influence of brine composition and fines migration on crude oil/brine/rock interactions and oil recovery. J. Pet. Sci. Eng. 1999, 24, 99–111. [Google Scholar] [CrossRef]
- Jerauld, G.R.; Lin, C.-Y.; Webb, K.J.; Seccombe, J.C. Modeling Low-Salinity Waterflooding. SPE Reserv. Eval. Eng. 2008, 11, 1000–1012. [Google Scholar] [CrossRef]
- Cissokho, M.; Boussour, S.; Cordier, P.; Bertin, H.; Hamon, G. Low salinity oil recovery on clayey sandstone: Experimental study. Petrophysics 2010, 51, 305–313. [Google Scholar]
- Fogden, A.; Kumar, M.; Morrow, N.R.; Buckley, J.S. Mobilization of Fine Particles during Flooding of Sandstones and Possible Relations to Enhanced Oil Recovery. Energy Fuels 2011, 25, 1605–1616. [Google Scholar] [CrossRef]
- Robbana, E.; Buikema, T.; Mair, C.; Williams, D.; Mercer, D.; Webb, K.; Reddick, C. Low salinity enhanced oil recovery—Laboratory to day one field implementation—LoSal EOR into the Clair Ridge project. In Proceedings of the Abu Dhabi International Petroleum Exhibition and Conference, Ankara, Turkey, 11–13 May 2011; pp. 12–14. [Google Scholar] [CrossRef]
- Fjelde, F.; Polanska, P.; Taghiyev, T.; Asen, A. Low salinity water flooding: Retention of polar oil components in sandstone reservoirs. In Proceedings of the IOR 2013—17th European Symposium on Improved Oil Recovery, St. Petersburg, Russia, 16–18 April 2013; pp. 16–18. [Google Scholar]
- Bourbiaux, B. Low Salinity Effects on Oil Recovery Performance: Underlying Physical Mechanisms and Practical Assessment. Oil Gas Sci. Technol. 2020, 75, 37. [Google Scholar] [CrossRef]
- Lee, S.Y.; Webb, K.J.; Collins, I.R.; Lager, A.; Clarke, S.; O’Sullivan, M.; Routh, A.F.; Wang, X. Low salinity oil recovery: Increasing understanding of the underlying mechanisms. In Proceedings of the SPE Improved Oil Recovery Symposium, Tulsa, OK, USA, 24–28 April 2010. [Google Scholar] [CrossRef]
- Nasralla, R.A.; Nasr-El-Din, H.A. Double-Layer Expansion: Is It a Primary Mechanism of Improved Oil Recovery by Low-Salinity Waterflooding? SPE Reserv. Eval. Eng. 2014, 17, 49–59. [Google Scholar] [CrossRef]
- Al-Shalabi, E.W.; Sepehrnoori, K.; Delshad, M. Does the Double Layer Expansion Mechanism Contribute to the LSWI Effect on Hydrocarbon Recovery from Carbonate Rocks? In Proceedings of the SPE Reservoir Characterisation and Simulation Conference and Exhibition: New Approaches in Characterisation and Modelling of Complex Reservoirs, Abu Dhabi, UAE, 16–18 September 2013; Volume 1, pp. 319–335. Available online: http://www.scopus.com/inward/record.url?eid=2-s2.0-84894157452&partnerID=40&md5=693ef3ae0622d935dc63f2b25c4f076b (accessed on 15 January 2022).
- RezaeiDoust, A.; Puntervold, T.; Strand, S.; Austad, T. Smart Water as Wettability Modifier in Carbonate and Sandstone: A Discussion of Similarities/Differences in the Chemical Mechanisms. Energy Fuels 2009, 23, 4479–4485. [Google Scholar] [CrossRef]
- Aladasani, A.; Bai, B.; Wu, Y.-S.; Salehi, S. Studying low-salinity waterflooding recovery effects in sandstone reservoirs. J. Pet. Sci. Eng. 2014, 120, 39–51. [Google Scholar] [CrossRef]
- Tariq, Z.; Aljawad, M.S.; Hasan, A.; Murtaza, M.; Mohammed, E.; El-Husseiny, A.; Alarifi, S.A.; Mahmoud, M.; Abdulraheem, A. A systematic review of data science and machine learning applications to the oil and gas industry. J. Pet. Explor. Prod. Technol. 2021, 11, 4339–4374. [Google Scholar] [CrossRef]
- Strand, S.; Høgnesen, E.J.; Austad, T. Wettability alteration of carbonates—Effects of potential determining ions (Ca2+ and SO42−) and temperature. Colloids Surf. A Physicochem. Eng. Asp. 2006, 275, 1–10. [Google Scholar] [CrossRef]
- Awolayo, A.; Sarma, H.; AlSumaiti, A.M. A laboratory study of ionic effect of smart water for enhancing oil recovery in carbonate reservoirs. In Proceedings of the SPE EOR Conference at Oil and Gas West Asia 2014: Driving Integrated and Innovative EOR, Muscat, Oman, 31 March–2 April 2014; pp. 46–69. Available online: http://www.scopus.com/inward/record.url?eid=2-s2.0-84905842680&partnerID=40&md5=35fd11c0fb23a109f9476fabbeb3cb32 (accessed on 15 January 2022).
- Romanuka, J.; Hofman, J.P.; Ligthelm, D.J.; Suijkerbuijk, B.M.; Marcelis, A.H.; Oedai, S.; Austad, T. Low salinity EOR in carbonates. In Proceedings of the SPE Improved Oil Recovery Symposium, Tulsa, OK, USA, 14–18 April 2012. [Google Scholar] [CrossRef]
- Sun, Q.; Ertekin, T. Development and application of an artificial-neural-network based expert system for screening and optimization of polymer flooding projects. In Proceedings of the SPE Kingdom of Saudi Arabia Annual Technical Symposium and Exhibition, Dammam, Saudi Arabia, 23–26 April 2018; Available online: https://onepetro.org/SPESATS/proceedings/18SATS/All-18SATS/Dammam,Saudi Arabia/215584 (accessed on 15 January 2022).
- Mahmoud, A.; Elkatatny, S.; Chen, W.; Abdulraheem, A. Estimation of Oil Recovery Factor for Water Drive Sandy Reservoirs through Applications of Artificial Intelligence. Energies 2019, 12, 3671. [Google Scholar] [CrossRef]
- El-M Shokir, E.M.; Goda, H.M.; Sayyouh, M.H.; Fattah, K.A. Selection and evaluation EOR method using artificial intelligence. In Proceedings of the Annual International Conference and Exhibition, Abuja, Nigeria, 5–7 August 2002. [Google Scholar] [CrossRef]
- Javadi, A.; Moslemizadeh, A.; Moluki, V.S.; Fathianpour, N.; Mohammadzadeh, O.; Zendehboudi, S. A Combination of Artificial Neural Network and Genetic Algorithm to Optimize Gas Injection: A Case Study for EOR Applications. J. Mol. Liq. 2021, 339, 116654. [Google Scholar] [CrossRef]
- Ng, C.S.W.; Ghahfarokhi, A.J.; Amar, M.N. Application of nature-inspired algorithms and artificial neural network in waterflooding well control optimization. J. Pet. Explor. Prod. Technol. 2021, 11, 3103–3127. [Google Scholar] [CrossRef]
- Syed, F.I.; Muther, T.; Dahaghi, A.K.; Negahban, S. AI/ML assisted shale gas production performance evaluation. J. Pet. Explor. Prod. Technol. 2021, 11, 3509–3519. [Google Scholar] [CrossRef]
- Webb, K.J.; Black, C.J.J.; Tjetland, G.; Exploration, B.P. A laboratory study investigating methods for improving oil recovery in carbonates. In Proceedings of the International Petroleum Technology Conference 2005, Doha, Qatar, 21–23 November 2005; pp. 1–7. Available online: https://www.onepetro.org/download/conference-paper/IPTC-10506-MS?id=conference-paper%2FIPTC-10506-MS (accessed on 15 January 2022).


Disclaimer/Publisher’s Note: The statements, opinions and data contained in all publications are solely those of the individual author(s) and contributor(s) and not of MDPI and/or the editor(s). MDPI and/or the editor(s) disclaim responsibility for any injury to people or property resulting from any ideas, methods, instructions or products referred to in the content. |
© 2023 by the authors. Licensee MDPI, Basel, Switzerland. This article is an open access article distributed under the terms and conditions of the Creative Commons Attribution (CC BY) license (https://creativecommons.org/licenses/by/4.0/).