Article

Techno-Economic Assessment of High-Safety and Cost-Effective Syngas Produced by O2-Enriched Air Gasification with 40–70% O2 Purity

1
School of Energy and Power Engineering, Nanjing Institute of Technology, Nanjing 211167, China
2
Department of Chemical Technology, Warsaw University of Technology, 00-664 Warsaw, Poland
3
College of Engineering, Peking University, Beijing 100871, China
4
School of Energy and Environment, Southeast University, Nanjing 210096, China
*
Author to whom correspondence should be addressed.
Energies 2023, 16(8), 3414; https://doi.org/10.3390/en16083414
Submission received: 4 March 2023 / Revised: 7 April 2023 / Accepted: 11 April 2023 / Published: 13 April 2023
(This article belongs to the Special Issue Progress in Alternative Fuels for Future Electrical Power System)

Abstract

:
To strike a better balance between gas quality and production cost of biomass-based syngas, a process for high-safety and cost-effective syngas production is designed and studied, which takes advantage of biomass O2-enriched air gasification with 40–70% O2 purity and methanation synthesis. Based on the simulation data, the process is evaluated from techno-economic aspects, including syngas composition, higher heat value (HHV), upper and lower explosive limits (UEL and LEL), toxicity, unit production cost (UPC) and levelized cost of energy (LCOE). Five kinds of biomass are studied as feedstock. The effects of O2 purity, methanation pressure, feedstock cost, and plant scale are determined, respectively. The results show that O2 purity is an important parameter for technical performance, while methanation pressure is a minor parameter except for exergy efficiency. With respect to cost indicators, feedstock cost, and plant scale are crucial variables; by contrast, O2 purity plays a relatively minor role. This process can generate non-toxic syngas containing 33.2–34.9 vol.% CH4. The UEL and LEL are about 34% and 12%, and the average explosive range is about 22%. The HHVs of syngas generated from five kinds of feedstock sit between 13.67–14.33 MJ/m3, and the exergy efficiency achieves 68.68%. The UPC varies between 0.05 $/Nm3 and 0.27 $/Nm3, and the LCOE varies between 3.78 $/GJ and 18.28 $/GJ. When the plant scale is rational, the process shows strong competitiveness in either UPC or LCOE. The techno-economic results demonstrate that the studied process offers an alternative and sustainable pathway to supply gaseous fuel for low-income areas.

1. Introduction

Clean gaseous fuels are highly expected by many undeveloped countries. As biomass is a widely available, renewable, and affordable energy source, gaseous biofuels, such as synthetic natural gas (SNG), biogas, and syngas, are regarded as green alternative fuels that can mitigate global warming and resource depletion issues. Gaseous biofuels can play an important role in sustainable development by substituting conventional natural gas. SNG is the expected product in previous studies, and it can be ejected into a well-developed gas grid [1,2]. However, SNG has relatively higher costs, and its economic competitiveness is lower, especially for low-income areas [3,4]. Gaseous biofuel with low or medium heating value and high safety is significant in low-income areas.
Biogas, without CO2 removal, can be directly used as an affordable fuel for cooking and heating. Apart from anaerobic digestion, steam gasification is commonly employed for the production of SNG or syngas that is equivalent to biogas. Dual fluidized bed gasifiers are generally used for exothermic steam gasification. In this technology, the gasification and combustion reactions are conducted in two separate reactors connected by circulating inert or catalytic bed material, which transfers heat from the combustion rector to the gasification reactor. However, these types of gasifiers are complex and difficult to design, operate and maintain. By contrast, air or oxygen-enriched air gasification can be carried out in one reactor, and the process is autothermic, i.e., the heat required by the gasification process can be completely satisfied by oxidation reactions within the gasifier.
The last studies showed that the production cost of syngas is much less than that of SNG, indicating the production cost reduces with the decrease in O2 purity [5,6]. Specifically, O2-enriched air gasification (OAG) has an obvious advantage over air gasification in the heating value of producer gas. O2-enriched air gasification may be a more suitable choice to produce affordable biofuels at a lower cost. With regard to O2-enriched air gasification, O2 purity is the key parameter that essentially affects gasification performances. The O2-enriched air with 30–40% O2 purity was generally applied to produce low and medium-grade syngas with high N2 contents and low energy contents [7,8]; meanwhile, the oxygen with a purity of 70% or higher was employed for the production of high-grade syngas with very low N2 contents and high energy contents [9]. However, the heating value of syngas generated by the gasification with O2 purity below 40% is commonly low, while the production cost of the producer gas with O2 purity beyond 80% is a bit high. The O2-enriched air gasification with 40–70% O2 purity has not received sufficient attention [10], which may strike a better balance between heating value and production cost.
Furthermore, safety has always been a concern for all fuels under all utilization scenarios. Previous studies show that the producer gas generated by biomass gasification contains plenty of CO, which is harmful to human beings. To lower CO content to a safe level, methanation synthesis is a good upgrading measure [10]. Then, the process integrated with O2-enriched air gasification with 40–70% O2 purity and methanation synthesis is a potential pathway to produce cost-effective and high-safety syngas.
To generate high-safety and cost-effective syngas for low-income users, the objective of this work is to design and evaluate a process of syngas production by integrating O2-enriched air gasification with 40–70% O2 purity. The process is modeled using Aspen Plus software and then studied from techno-economic aspects, such as explosive limit, toxicity, and production cost. The work offers an alternative pathway of clean and renewable fuel supply for low-income areas lacking natural gas and guides the further development of this practical process.

2. Process Configuration

As shown in Table 1, five kinds of biomass are considered as feedstock, including rice straw (RS), cornstalk (CS), sawdust (SD), sunflower residual (SR), and cotton residual (CR) [11,12]. The syngas production process integrated with O2-enriched air gasification and methanation synthesis is illustrated in Figure 1. It mainly consists of (1) an O2-enriched air gasification unit with 40–70% purity oxygen (OAG); (2) a vacuum pressure swing adsorption unit (VPSA); (3) producer gas cleaning unit (PGC); (4) a methanation synthesis unit. (5) Auxiliary devices, including heaters and coolers for heat utilization and an organic Rankine cycle unit for partial power compensation (ORC). The Aspen Plus software (Aspen Plus 10.1) is applied for the process simulation.
(1) 
O2-enriched air gasification (OAG)
The feedstock is first dried, and the low-temperature heat used here is recovered within this process. Then, biomass is gasified using O2-enriched air and steam as gasifying agents. The gasifying agents, the steam (mWG), and O2-enriched air (mOEA) streams are preheated to 200 °C by the heaters HTG and HTO2, respectively. A two-stage gasifier is employed in this process, and the second-stage gasifier is constantly operated at 800 °C and atmospheric pressure. All heat recovered from producer gas is used to heat the streams, such as water, O2-enriched air, and ORC working medium with matched temperatures.
Regarding the simulation of the gasification unit, the pyrolysis and gasification processes are simulated using RYield and RGibbs models with the PR-BM property method, respectively. The RGibbs model is restricted by chemical equilibrium with temperature approach. Additionally, the STEAM-TA method employed for heating and cooling models is related to water and steam. The following assumptions are adopted in the simulation [5]: (1) The reactors are operated under a steady state with uniform temperature and pressure. (2) The residence times are long enough for the reactions to reach chemical equilibrium. (3) The influence of particle sizes is ignored. (4) Ash in biomass does not participate in the gasification reactions. (5) The carbon conversion efficiency of the feedstock is 98%. (6) The heat loss is assumed to be 3% of the input energy of biomass (LHV). Additionally, a Design-Spec function is set to calculate the flow rates of air at a given operating condition based on energy conservation. The simulation of the O2-enriched air gasification is verified based on Ye et al.’s experimental data [13], and the relative errors of the concentrations of H2, CO, CH4, CO2, and N2 do not exceed 10%.
(2) 
Vacuum Pressure Swing Adsorption (VPSA)
Cryogenic distillation is the most common process of air separation for highly pure oxygen production. The VPSA technology is another energy-saving and cost-effective method for air separation. It uses zeolite, a material that adsorbs nitrogen to leave a rich stream of oxygen at ambient temperatures. Standard VPSA equipment packages can supply oxygen from 40–150 t/h and 80%–93% O2 purity at pressures to integrate with most applications [14,15], and the specific energy of the 80% O2 purity product of different manufactures and scales varies from 0.29 to 0.35, in kWh/Nm3 of pure O2 [16]. In this study, 80% O2 purity is employed to simplify the modeling of VPSA. It is assumed that the oxygen purities of 40%, 50%, 60%, and 70% are generated by blending air into 80% purity O2-enriched air. To simplify the VPSA simulation and focus on electricity consumption, the Compr, Sep, and Heater models in Aspen Plus software are applied [5]. The power consumption of the VPSA unit is calculated by a user-specified FORTRAN subroutine using the specific energy of 0.29 kWh/Nm3 of pure O2.
(3) 
Producer Gas Cleaning (PGC)
The oil-based gas washer (OLGA) technology is integrated to clean the producer gas at low temperatures [17]. The high-temperature producer gas is firstly cooled to about 400 °C by the cooler CL1. The recovered heat stream (Q1) is used as the heat source of the pyrolyzer. Then the producer gas first passes through a hot gas filter to remove particles, which operates at 400 °C. Then the gas is cooled to 80 °C in the first OLGA unit, followed by an absorption step in the second unit, during which coolers CL2 and CL3 are employed to recover heat. The separation process is simulated by the Sep model in Aspen Plus. The outlet temperatures of CL2 and CL3 are set to about 200 °C and 80 °C, respectively. The heat recovered by CL2 is preferably used to generate steam and preheat O2–enriched air, while that by CL3 is firstly used to dry feedstock. Then, the residual heat stream (Q2) is used by the ORC unit. Finally, the cooler CL4 is set to adjust the PG temperature for the subsequent compression. All the coolers are simulated by the Heater model in Aspen Plus. The pressure drops over OLGA are less than 50 mbar [18]. The total pressure drop of 5 kPa in PGC is set to simulate the power loss of this unit.
(4) 
Methanation Synthesis
The clean syngas is compressed by a multi-stage compressor (CMPR) and fed into the methanation reactor (MR). The compressor is simulated by the polytropic model using the ASME method. Then, CO and H2 are converted into CH4 and H2O through the methanation reactions and water–gas shift reactions. Since methane synthesis is highly exothermic, lower methanation temperature is favorable to the synthesis performances. Compared to a fixed bed methanation reactor, a fluidized bed has notable advantages in temperature control and catalyst distribution. This study adopts a single isothermal once-through fluidized bed methanation reactor (MR), which allows for simultaneous methanation and water gas shift reactions [19]. The operation temperature of MR is kept at 300 °C. The heat released by exothermic reactions (Q3) is mainly used to heat the ORC working medium. A certain amount of water is used for the synthesis reactions to suppress carbon formation. Finally, in the syngas (SG), the output of the methanation synthesis is cooled down by the cooler CLSG, which also removes most vapor in syngas and recovers sensible heat (Q4) with a temperature above 80 °C for the ORC unit.
The MR is simulated by the RGibbs model and verified based on a case report on conventional SNG production [20]. The heaters and coolers are simulated by the Heater model with a pressure drop of 0.5 kPa and an energy efficiency of 98%. The water pump is modeled with an isentropic efficiency of 85% and mechanical efficiency of 98%. Additionally, the simulation of the ORC unit is simplified, and only the output power is calculated by a user-specified FORTRAN subroutine with a net efficiency of 25%.

3. Assessment Methodology

3.1. Requirements on Syngas

According to the Chinese technical standard [21], natural gas is divided into four classes (3T, 4T, 10T, and 12T) with an HHV range of 12.26–45.96 MJ/Nm3. The HHVs of 10T and 12T exceed 34 MJ/Nm3, which is obviously greater than those of the syngas generated by biomass gasification. In the following analysis, the syngas is compared with the classes 3T and 4T based on HHVs (Table 2).
The following indicators are studied to demonstrate the technical competitiveness of the process: composition, syngas yield, and HHV of the syngas. The syngas yield (Y) is defined as below:
Y = V S G m b i o , d a f ( Nm 3 / kg daf )
where VSG is the volume flow rate of syngas, in Nm3/h; mbio,daf is the mass flow rate of biomass on a dry ash-free basis, in kg/h.
Additionally, syngas contains species that are flammable (mainly CH4, H2, and CO) and toxic gases (mainly CO). Both explosivity and toxicity are studied then. The upper and lower explosive limits (UEL and LEL) of syngas are calculated below [10]:
U E L = 1 4.76 · f O i = 1 n f i U E L i + 0.01 f N 3.76 · f O ( % )
L E L = 1 4.76 · f O i = 1 n f i L E L i + 0.01 f N 3.76 · f O ( % )
where UEL and LEL are the upper and lower explosive limits of syngas, respectively, %. UELi and LELi are the upper or lower explosive limits of flammable component i in syngas, respectively, in %. fO is the molar fraction of oxygen; fN is the total molar fraction of inert components (N2 and CO2).
The toxicity of syngas can be directly evaluated according to the CO concentration in syngas: Prohibitive (P, CO > 20%), Marginal (M, 10 vol.% < CO ≤ 20 vol.%), Good (G, 2 vol.% < CO ≤ 10 vol.%) and Excellent (E, CO ≤ 2 vol.%) [10].

3.2. Exergy Analysis

The performance of energy conversion is always a concern in this area. This study adopts exergy efficiency to evaluate this performance to include the effect of the product’s pressure. The overall exergy efficiency is defined below:
η e x = S E S G S C E · m b i o , d b + P T × 100 %
where SESG is the exergy flow rate of syngas (SG), including physical and chemical items, in MJ/h [22], and the specific chemical exergies of CH4, H2, and CO are 831.69, 236.1, and 275.06, in kJ/mol [6]. mbio,db is the mass flow rate of biomass on a dry basis, in t/h. PT is the net electrical power required by the process in MJ/h. The specific chemical exergy of biomass (SCE) on a dry basis is calculated by the following correlation [23]:
SCE = 363.439C + 1075.633H + 86.308O + 4.147N + 190.798S + 21.1A (kJ/kg)
where C, H, O, N, S, and A represent carbon, hydrogen, oxygen, nitrogen, sulfur, and ash contents of fuel, respectively, in wt.% on a dry basis.

3.3. Economic Assessment

The unit production cost (UPC) is evaluated to demonstrate the economic competitiveness of the process. The UPC is calculated based on the cost model involving total capital investment (TCI) and total production cost (TPC) [5]. TCI includes fixed capital investment (FCI) and working capital (WC), and the former item includes indirect investment and direct investment. The TCI can be estimated based on the TCI model and the percentage of each component [5]. The equipment costs (ECs) are the key data to estimate TCI, which are closely related to the production capacities (PCs) of the devices. Table 3 lists the EC data of the gasifier, gas cleaning and methanation reactor, etc., in the benchmark year of 2019 [5,6]. The US dollar to Chinese Yuan exchange rate was 6.8985.
TPC primarily consists of raw materials, utilities, maintenance and operating, depreciation, plant overhead costs, administrative cost, distribution, and selling costs. The investment for utilities is obtained according to the technical data. The depreciation is calculated according to the straight line method with a 4% salvage value and 20 years lifetime. Based on the TPC model [5], UPC is calculated based on the TPC value and annual yield of the product.
Recently the selling price of natural gas in China has varied from 0.348 $/Nm3 to 0.406 $/Nm3 (2.4–2.8 ¥/Nm3). It can be used as the reference for the product’s UPC. However, as there is a significant difference in heating values between syngas and natural gas, the levelized cost of energy (LCOE) is applied to compare the costs at the same baseline, and it is defined as below:
L C O E = U P C H H V S G
Converted from the selling prices, the LCOE of natural gas ranges from 10.32 $/GJ to 11.61 $/GJ (71.2–80.1 ¥/GJ).

3.4. Sensitivity Analysis

The sensitivity coefficient of an index to a variable is defined below:
sensitivity   coefficient = Δ I / I Δ V / V
where I and V are the indicator and variable, respectively, and Δ denotes the change in I or V.

4. Results and Discussion

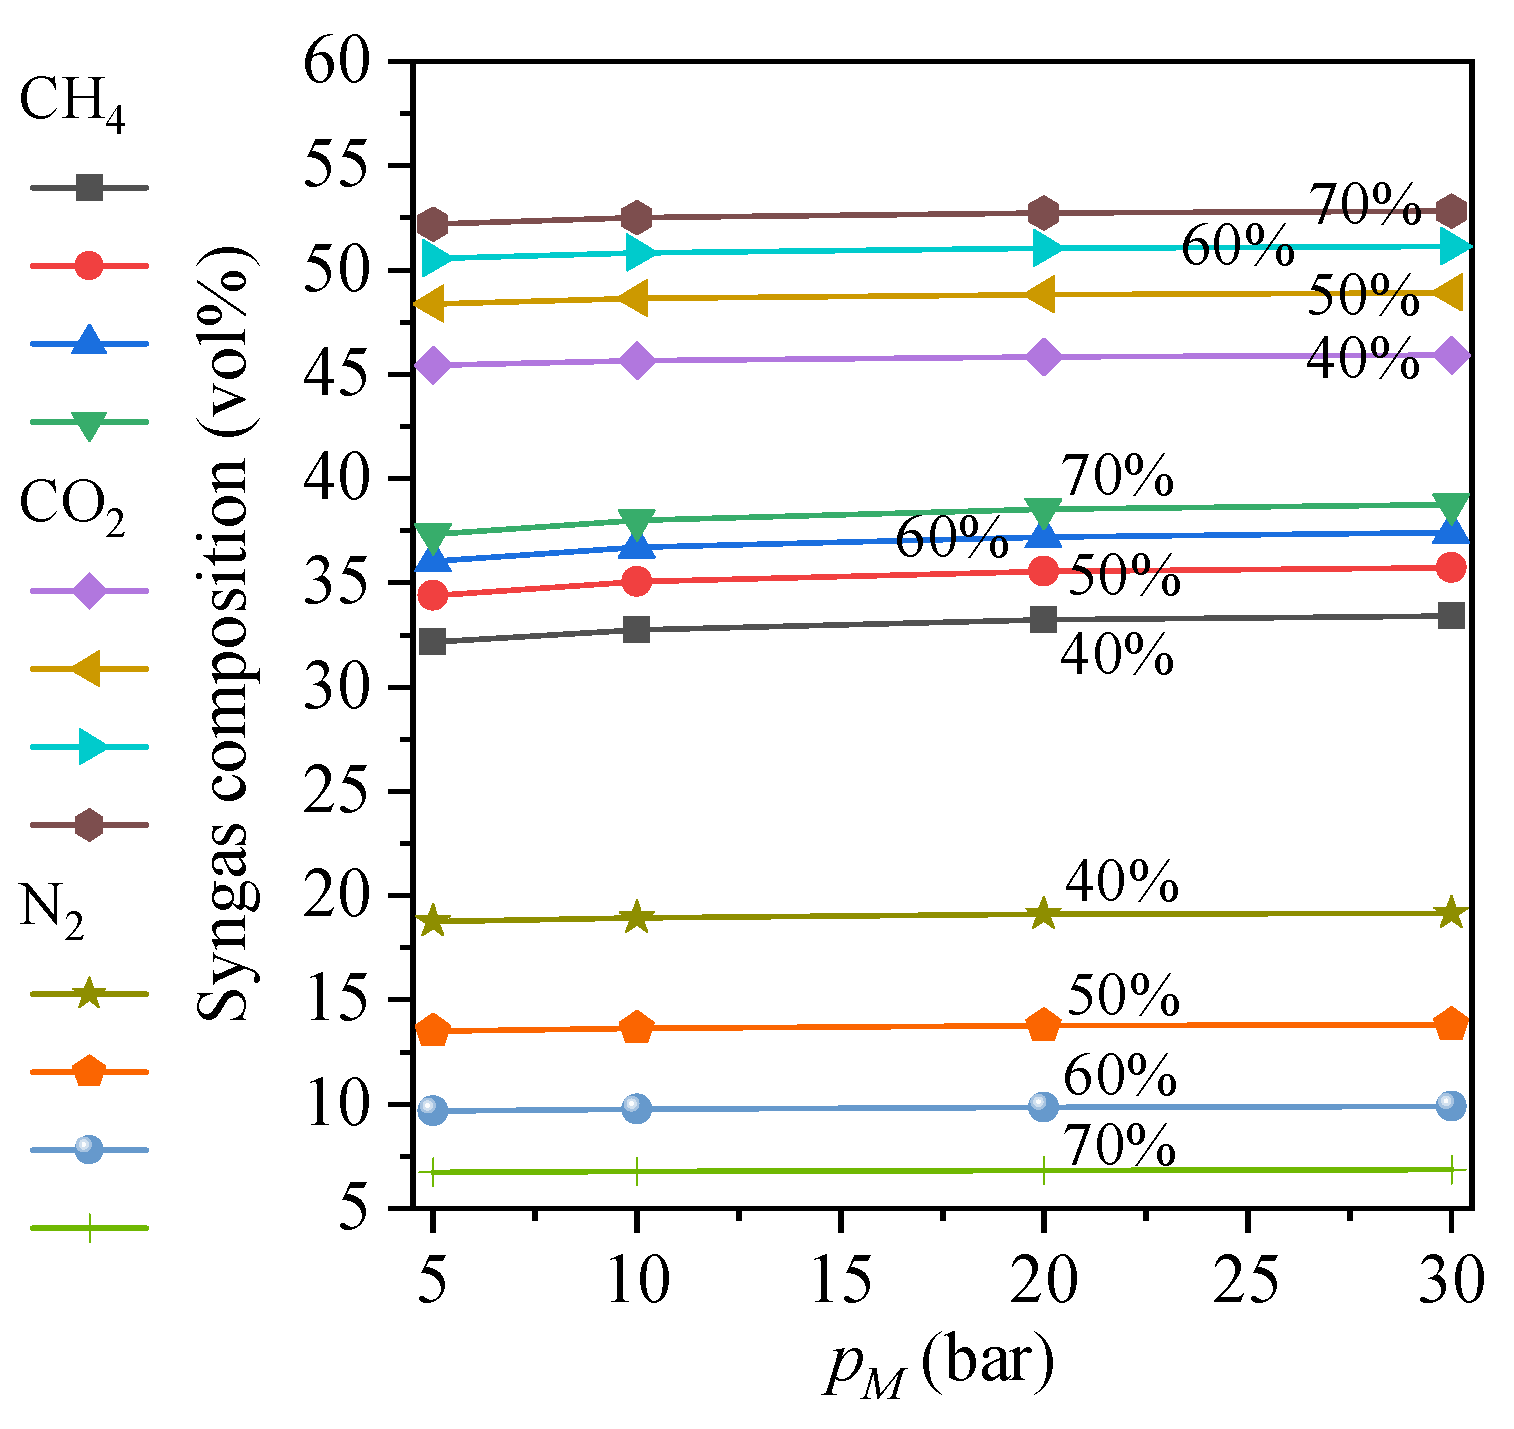
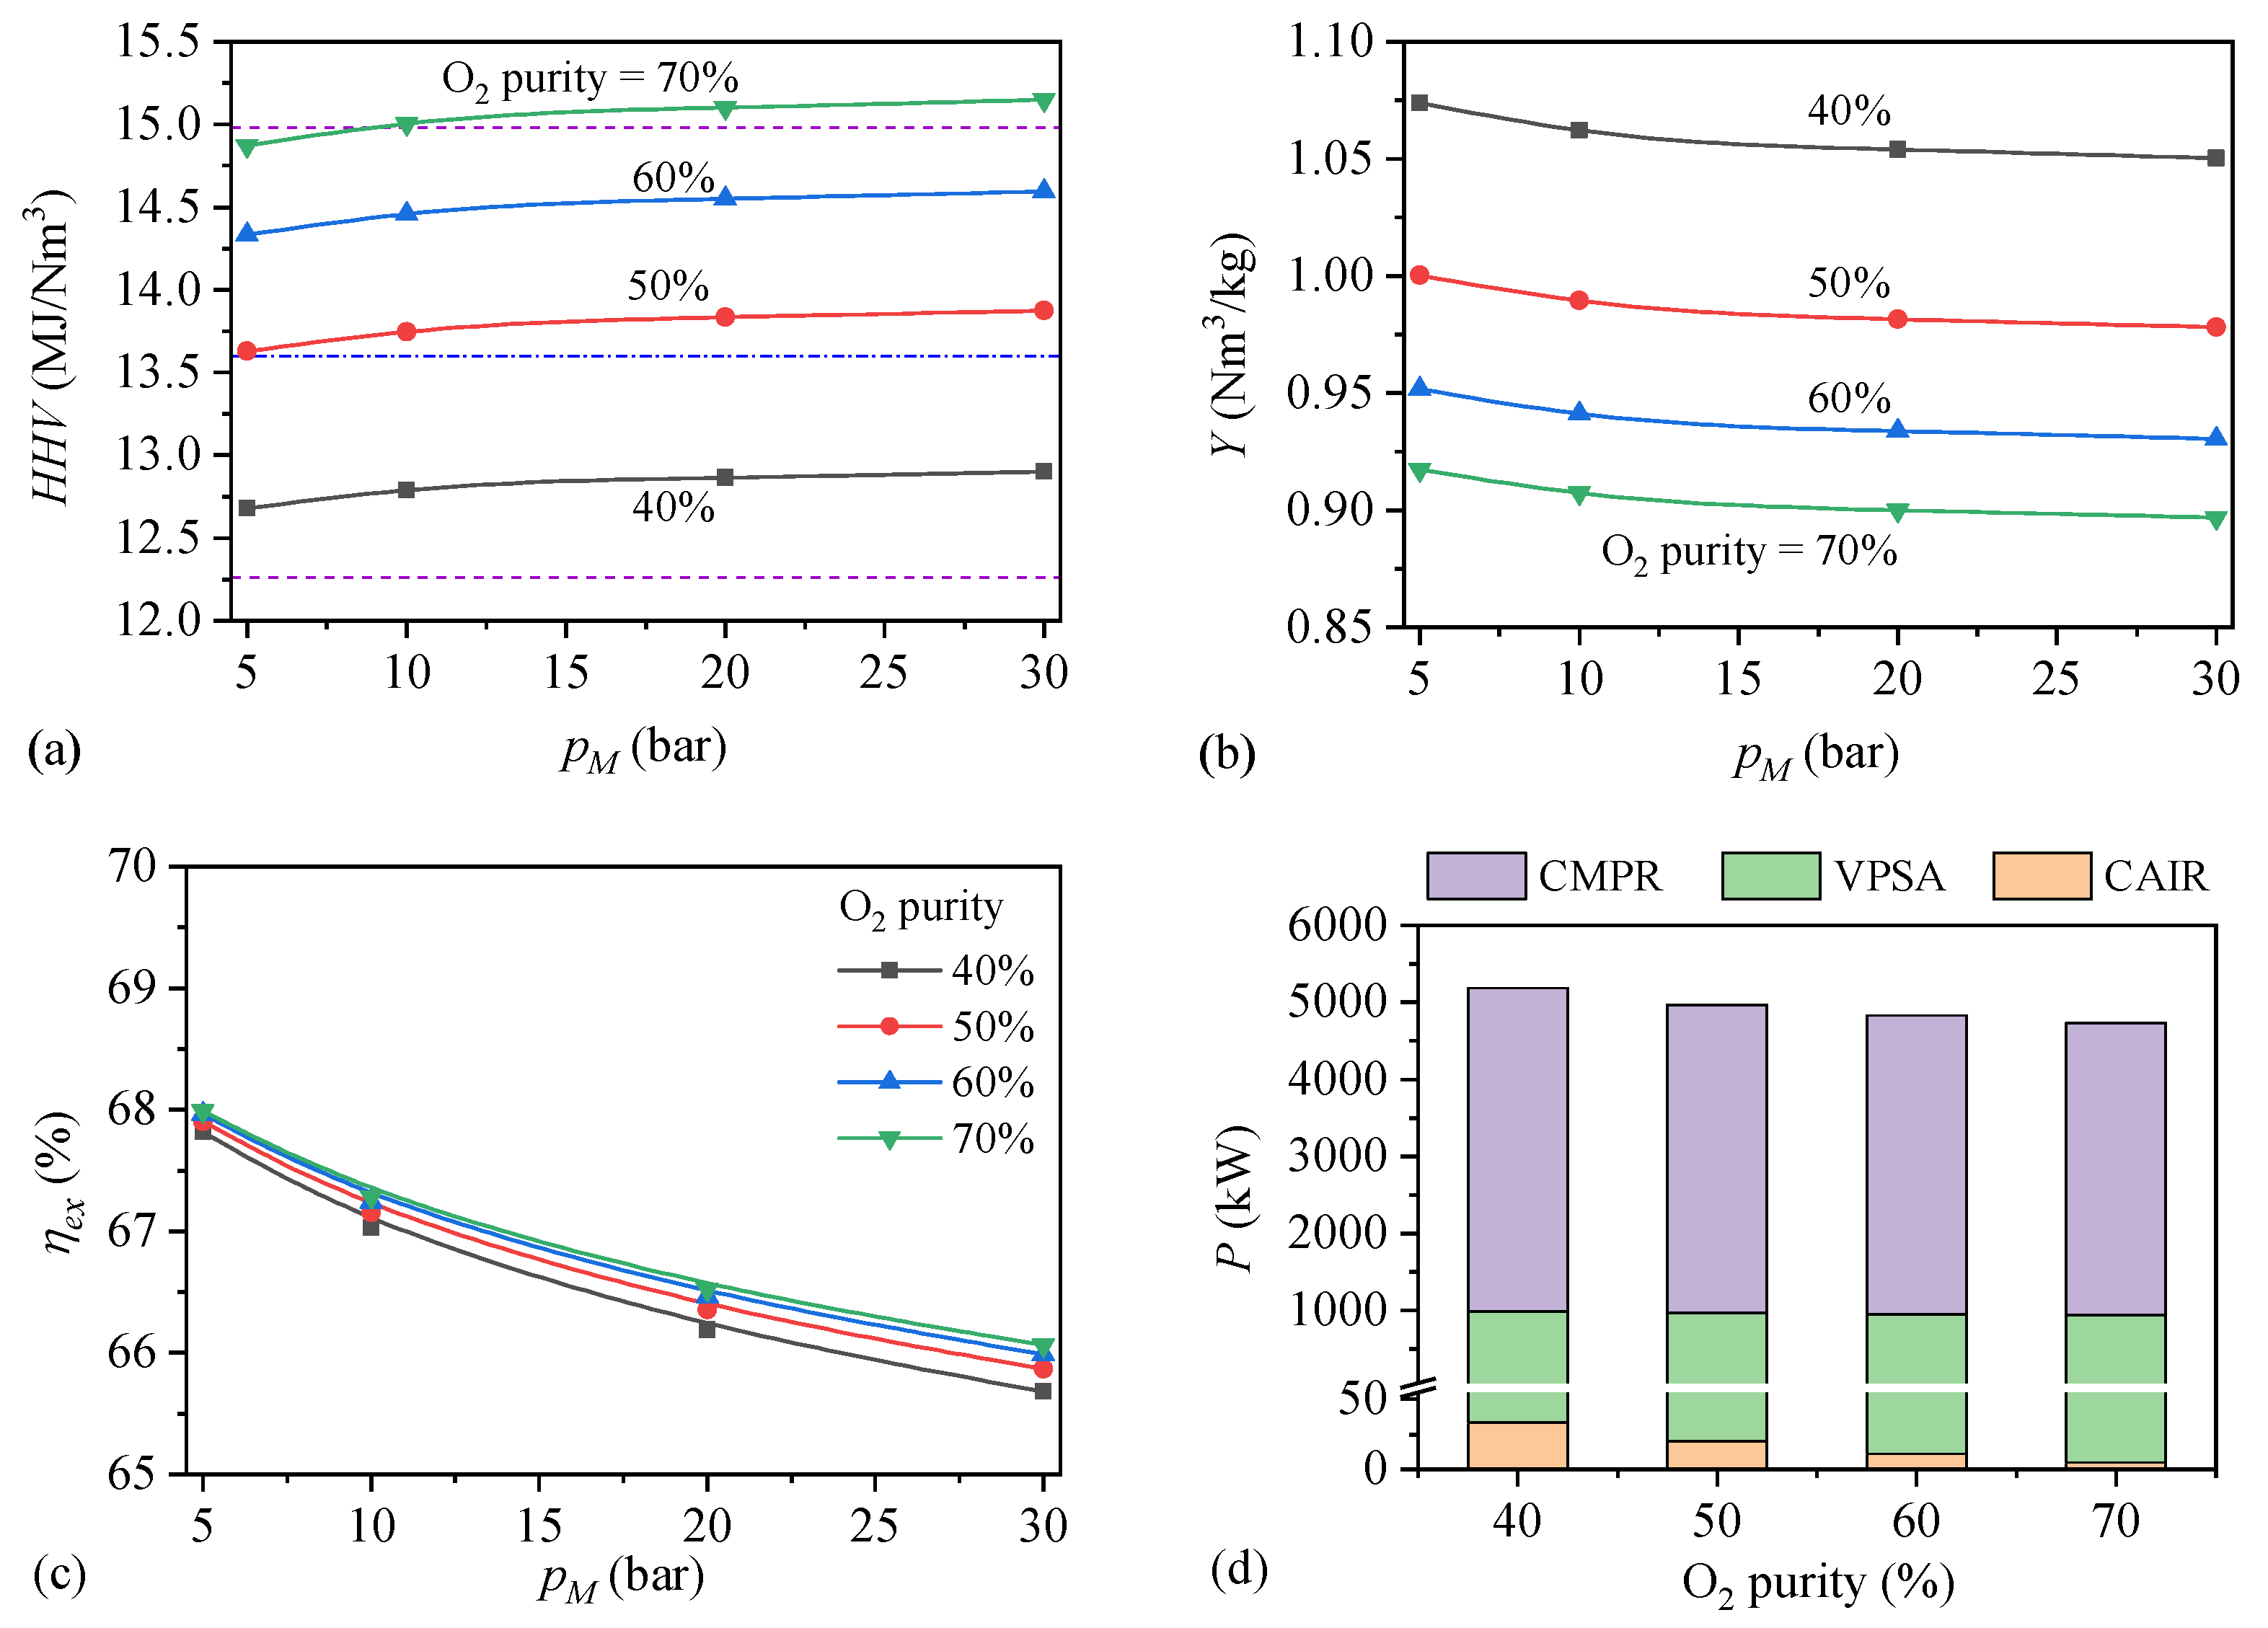
4.1. Technical Performances

(1) 
Effects of O2 purity and methanation pressure
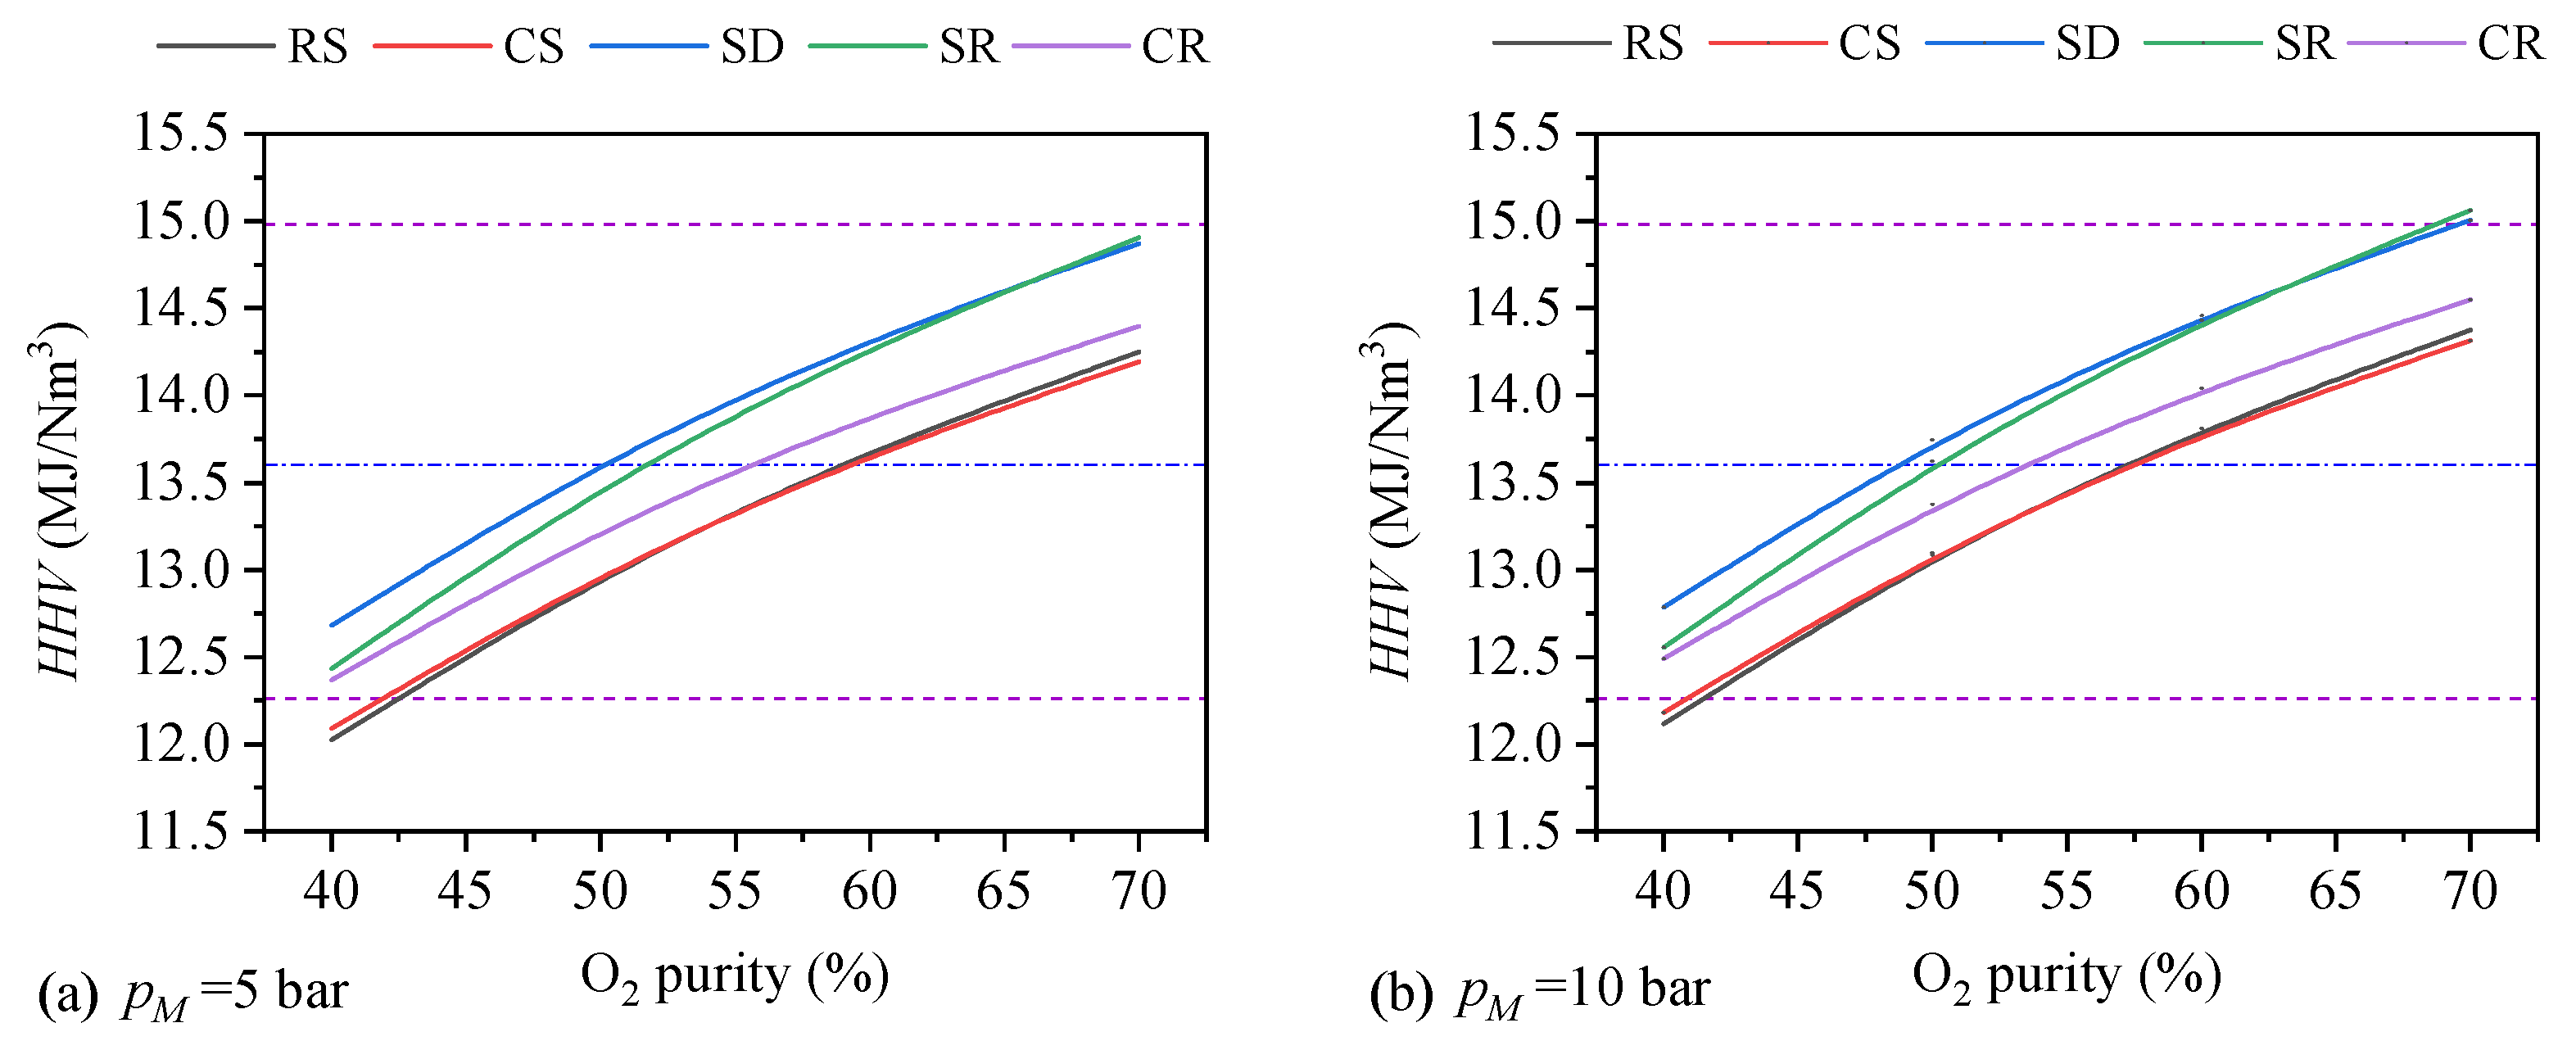
The sawdust is first studied as the representative feedstock. This study mainly focuses on the effects of O2 purity and methanation pressure, which have a crucial influence on the composition of CH4-riched syngas [6]. The other parameters, such as steam-to-biomass ratio, gasification temperature, etc., are not concerned in this study since the investigations on these variables are sufficient, and their effects are clear [24,25]. Table 4 summarizes the composition and safety indicators of both producer gas and syngas at constant methanation pressure (10 bar). When the O2 purity rises from 40% to 70%, the N2 contents in producer gas and syngas decrease gradually from 14.2 vol.% to 4.8 vol.% and from 20.4 vol.% to 7.3 vol.%, respectively, resulting in increases in the contents of other species. Table 4 shows that the UEL and LEL of producer gas vary from 60.7% to 63.2% and from 7.5% to 8.2%, respectively, and the explosive range (UELLEL) is about 54%. By contrast, the UEL and LEL of syngas range from 32.6% to 36.3% and from 11.4% to 13.0%, respectively, and the explosive range (UELLEL) is only about 21%. These indicate that the syngas produced by this process has an obvious advantage over the producer gas in explosion risk. Additionally, regarding toxicity performance, all the producer gas with different O2 purities is rated as “Prohibitive” (CO contents > 20%), while all the syngas is rated as “Excellent” (CO contents < 2%) [10]. These indicate that this process with various O2 purities can generate high–safety syngas.
Furthermore, as shown in Figure 2, when the O2 purity is fixed, all the concentrations of CH4, CO2, and N2 change slightly with the increase in pM. Thus, it can be inferred that all the syngas produced with different pM has excellent safety performances. More specifically, CH4 concentration increases visibly firstly (pM ≤ 10 bar) and then slowly (pM > 10 bar); meanwhile, the CO2 and N2 contents increase very slightly. The reason is that the CO methanation reaction leads to a reduction in the number of molecules, then the contents of the three main species rise simultaneously. At any given pM, the N2 content decreases correspondingly with the increase in the O2 purity, resulting in increases in the contents of other constituent species. The sensitivity coefficients of CH4, CO2, and N2 contents to pM are on average 0.008, −0.006, and 0.08, respectively. By contrast, the sensitivity coefficients of CH4, CO2, and N2 contents to O2 purity are about 0.26, 0.25, and −1.45, respectively. These indicate that O2 purity is more crucial than methanation pressure for the syngas composition.
Figure 3a shows that when the O2 purity is constant, the HHV increases visibly firstly (pM ≤ 10 bar) and then slowly (pM > 10 bar) with the increase in pM, which is caused by the variation of CH4 content. When the pM is kept unchanged, the HHV obviously rises with the increase in O2 purity since less N2 is brought into syngas by the gasifying agent. According to the HHV range, the syngas cannot meet the requirement of 4T (Table 2). Note that when the pM exceeds 10 bar, the HHV is greater than the upper value of 3T (Table 2), which is indicated by the dashed line in Figure 3a. The syngas with excessive heating value is not recommended considering the interchangeability of gaseous fuels.
Figure 3b shows that when the O2 purity is constant, the Y decreases gradually and then slightly with the increase in pM due to the volume reduction caused by the methanation synthesis. When the pM is kept unchanged, the Y visibly decreases with the increase in the O2 purity.
Figure 3c shows that when the O2 purity is constant, the ηex gradually decreases with the increase in pM, which is mainly caused by the increased power of the multi-stage compressor (CMPR). When the pM is fixed, the ηex visibly rises with the increase in O2 purity. At the pM of 10 bar, more O2-enriched air is needed, and the power of the VPSA unit rises with the increase in O2 purity; however, the flow rate of inert gas N2 entering into the process decreases significantly, resulting in the declines in the power rates of the multi-stage compressor CMPR significantly and the fan CAIR, as shown in Figure 3d. Finally, the combined result is that the total power of the process decreases with the increase in O2 purity.
The sensitivity coefficients of HHV, YSG, and ηex to O2 purity are, on average, 0.26, −0.24, and 0.007, respectively. While the coefficients to pM are averagely 0.007, −0.009, and −0.01, respectively. The results indicate that the technical performances (HHV and Y) except ηex are more sensitive to O2 purity than methanation pressure. Higher O2 purity (≥50%) and lower pM (5–10 bar) are beneficial to this process. Considering the existing outliers in Figure 3a and potential outliers for other feedstock, the effects of O2 purity and pM are further analyzed and optimized based on the technical performances using other types of biomass as feedstock.
(2) 
Syngas properties of different feedstock
The explosive and toxic properties of the syngas produced from other feedstock are similar to those of sawdust-derived syngas. All the syngas are rated as “Excellent,” even at the pM of 5 bar. It should be noted that the purpose of this process is to generate high-safety syngas. It is just good enough to convert CO and H2 contents to certain low concentrations, and full conversion is not necessary. Additionally, the influences of O2 purity and pM on Y and ηex of the syngas produced from other feedstock are also similar to those of sawdust-derived syngas.
The interchangeability of gaseous fuels is closely associated with HHV; therefore, the HHV has a specific range to meet the interchangeability requirement. Figure 4 shows that the HHV of the syngas generated from all feedstock at 5 bar and 10 bar ranges from 12.0–15.1 MJ/m3, which gradually increases with the increase in O2 purity. Correspondingly, the LHV of the syngas varies from 10.8–13.6 MJ/m3. According to the HHVs in Table 2, this process integrating OAG with 40–70% O2 purity can only generate syngas that is equivalent to the class 3T. The O2 purity of 40% or 70% should be carefully used because it may result in outliers beyond the HHV range of class 3T, especially at higher pM, as indicated by Figure 4b. Taking the combined effects of O2 purity and pM on HHV and ηex, 5 bar is the optimal value of pM, and the O2 purity over the range of 50–60% is recommended to be used in the syngas production because the HHVs of the syngas are close to the standard value of the class 3T (13.62 MJ/Nm3). This is beneficial to the compatibility of the existing combustors. Otherwise, 70% O2 purity can be applied to obtain higher exergy efficiencies. The relative difference of HHVs in the technical standard is within ±10% [10], and for the same type of feedstock, the relative differences between HHVs with 40%–70% purity and those with 60% purity are within ±6%. Hence, a compromise and conservative choice is to use 60% O2 purity for all the feedstock.
Table 5 shows the composition, HHV, Y, and ηex of syngas derived from five sorts of feedstock with 60% O2 purity and 5 bar pM. The CH4 concentration in syngas (33.24–34.89 vol.%) from other feedstock is similar to that from sawdust. The total concentration of inert gases (CO2 and N2) is about 62 vol.%. The HHV, Y, and ηex range between 13.67–14.33 MJ/Nm3, 0.922–1.088 Nm3/kgdaf, and 66.96–68.68%, respectively. The average values of UEL and LEL are 34% and 12%, respectively, which also change little with the type of biomass. The explosive range has an average of 22%. Certainly, all the syngas is rated as “Excellent” regarding toxicity.

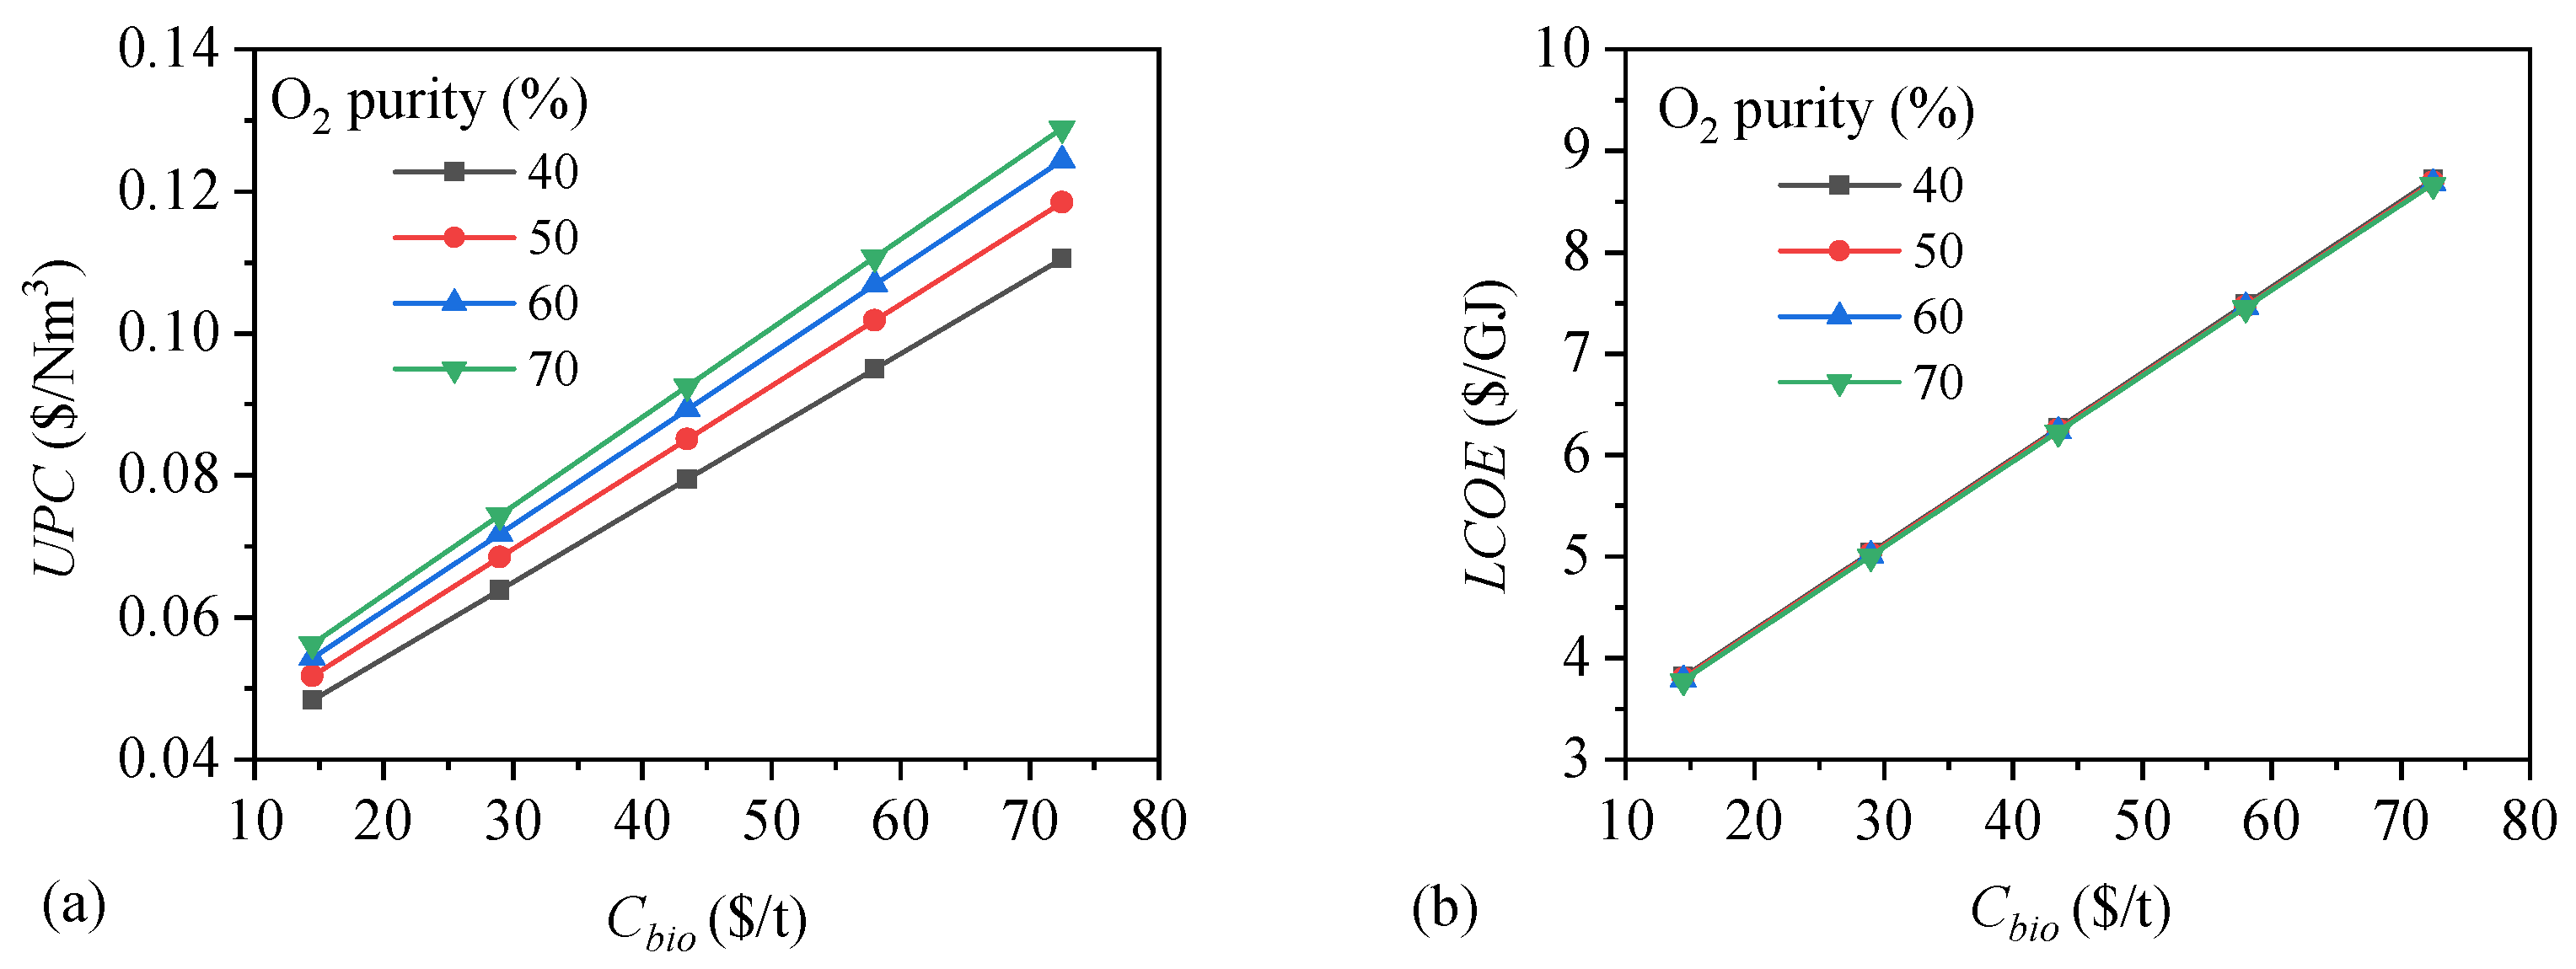
4.2. Economic Performances

(1) 
Feedstock Cost
In this section, sawdust is chosen as the representative feedstock, and the influence in yield is approximately taken into account by that of feedstock cost (Cbio). Additionally, the pM is fixed at 5 bar. It assumes that the Cbio ranges from 14.50 $/t to 72.48 $/t (100–500 ¥/t) [5,26]. Based on the above technical results and the Cbio of 43.49 $/t (300 ¥/t), the decreasing order of the top three components in UPC is feedstock cost (>50%), O&M (~21%), and depreciation (~9%). Due to the O&M and depreciation being closely related to the fixed capital investment, the plant scale should be analyzed. Additionally, the plant scale is very crucial to the economic performance of biomass conversion projects, which can be represented by the mass flow rate of feedstock (mbio). The plant scale within the range of 5–25 t/h is studied by reference to the scales of a dozen existing biomass-fired power plants in Jiangsu Province, China. Additionally, the electricity cost accounts for less than 10% of UPC even when Cbio is 14.50 $/t; that is because the specific power consumption of the VPSA technique is quite lower, and it changes little once the O2 purity is fixed. Thus, the electricity cost is not analyzed in this study.
Figure 5 shows that with the same O2 purity, both UPC and LCOE nearly proportionally increase with the increase in Cbio. The UPC varies between 0.05 $/Nm3 and 0.13 $/Nm3 (0.33–0.89 ¥/Nm3), which is obviously lower than that with an O2-purity of 80% or higher [5]. Meanwhile, with the plant scale of 25 t/h, the LCOE varies between 3.78 $/GJ and 8.71 $/GJ (26.08–60.12 ¥/GJ), which is always less than that of natural gas (10.32–11.61 $/GJ). The results indicate that the syngas generated by this process has strong economic competitiveness.
Additionally, with the increase in O2 purity, the UPC with the same Cbio visibly increases while the LCOE decreases very slightly. When the O2 purity is improved, both the equipment cost and the power rate of VPSA unit rise, resulting in increases in total equipment cost, fixed capital investment, and production cost. Together, these changes lead to an increase in UPC. However, as indicated in Figure 3a and Figure 5a, the variations of UPC and HHV with O2 purity have opposite trends, and the combined changes result in the variation of LCOE with O2 purity according to Equation (6). Compared with the effects of O2 purity on the technical performances, it is a minor variable for economic performances, especially LCOE. However, higher O2 purity is beneficial to both ηex and LCOE. This implies that LCOE is a more rational indicator than UPC, and the later indicator may mislead the decision-makers. It also indicates that VPSA is an attractive technology for O2-enriched gasification from the perspectives of heating value, exergy efficiency, and cost of the syngas.
(2) 
Plant Scale
Figure 6a shows that at Cbio of 43.49 $/t (300 ¥/t), the UPC decreases sharply firstly and gradually with the increase in plant scale, which sits between 0.08 $/Nm3 and 0.27 $/Nm3 (0.55–1.87 ¥/Nm3). In contrast, the changes in UPC with O2 purity are relatively small. Figure 6b indicates that the LCOE also decreases sharply firstly and gradually with the increase in plant scale. It sits between 6.23 $/GJ and 18.28 $/GJ (42.95–126.11 ¥/GJ) and changes little with O2 purity. When the plant scale is less than 6 t/h, the LCOE is higher than that of natural gas; then the syngas has no economic competitiveness. To obtain syngas that can be competitive with natural gas, the plant scale should be not less than 7 t/h, which is much less than that for SNG production (≥11.25 t/h) [5]. Conservatively, a plant of 10 t/h or larger is recommended.
This process integrating O2-enriched air gasification offers a way to utilize the biomass residues and supply high-safety, cost-effective and renewable fuel. It is especially attractive in rural areas where there are no natural gas facilities at current, or the cost is high to construct new facilities. The fuel can be used for power and heat generation. It can be applied to build a community with self-sufficiency in energy. Based on the experience of the biomass-fired power plant, the syngas production plant can create about one hundred jobs for local residents.

5. Conclusions

A process integrating O2-enriched air gasification with 40–70% O2 purity and methanation synthesis is studied for the production of high-safety and cost-effective syngas. The main findings of the present study are as follows.
O2 purity is an important parameter to the technical performances of this process, while methanation pressure is a minor parameter except for exergy efficiency. Feedstock cost and plant scale are crucial parameters to economic performances; by contrast, O2 purity plays a minor role. The O2 purity of 60% is a compromise and conservative choice for all the feedstock.
This process, with optimal parameters, can generate high-safety syngas containing 33.2–34.9 vol.% CH4 and approximately 62 vol.% inert gases (CO2 and N2). The UEL and LEL are about 34% and 12%, and the average explosive range is about 22%. Additionally, all the syngas is rated as “Excellent” regarding toxicity. The HHV of syngas generated from five types of feedstock sit between 13.67–14.33 MJ/m3, which is equivalent to that of the medium-HHV of city gas.
The exergy efficiency of this process with optimal parameters ranges from 66.96% to 68.68%, indicating strong competitiveness in energy conversion efficiency. The UPC varies between 0.05 $/Nm3 and 0.27 $/Nm3 (0.33–1.87 ¥/Nm3), and the LCOE varies between 3.78 $/GJ and 18.28 $/GJ (26.08–126.11 ¥/GJ). When the plant scale exceeds 7 t/h, the syngas has a strong competitiveness in either UPC or LCOE.
The demonstration of this process, including the development of an O2-enrich air gasifier, is attractive since the process can generate high-safety and cost-effective syngas with relatively simple process configuration and devices. Additionally, a life cycle sustainability assessment of the syngas produced by this process should be carried out to determine its environmental competitiveness.

Author Contributions

Conceptualization, S.Z., W.R.-P. and H.Z.; methodology, S.Z. and H.G.; data curation, S.Z.; investigation, J.Q., Q.W. and Y.W.; formal analysis, S.Z., H.G. and Y.W.; funding acquisition, S.Z. and J.Q.; software, J.Q. and Q.W.; validation, H.G., W.R.-P. and H.Z.; visualization, J.Q. and H.G.; writing—original draft, S.Z. and Y.W.; writing—review and editing, H.G., W.R.-P. and H.Z.; supervision, H.Z.; project administration, S.Z.; project administration, S.Z. All authors have read and agreed to the published version of the manuscript.

Funding

This work was supported by the Science and Technology Innovation Fund for College Students of Nanjing Institute of Technology (TB202303062) and Project of Teaching Reforms of School of Energy and Power Engineering of Nanjing Institute of Technology (ndjyjg2022-04).

Data Availability Statement

The data presented in this study are available within this article.

Conflicts of Interest

The authors declare no conflict of interest.

References

  1. Bailera, M.; Lisbona, P.; Romeo, L.M.; Espatolero, S. Power to Gas projects review: Lab, pilot and demo plants for storing renewable energy and CO2. Renew. Sustain. Energy Rev. 2017, 69, 292–312. [Google Scholar] [CrossRef]
  2. Prussi, M.; Padella, M.; Conton, M.; Postma, E.D.; Lonza, L. Review of technologies for biomethane production and assessment of Eu transport share in 2030. J. Clean. Prod. 2019, 222, 565–572. [Google Scholar] [CrossRef] [PubMed]
  3. Song, G.; Xiao, J.; Yu, Y.; Shen, L. A techno-economic assessment of SNG production from agriculture residuals in China. Energy Sources Part B Econ. Plan. Policy 2016, 11, 465–471. [Google Scholar] [CrossRef]
  4. Haro, P.; Johnsson, F.; Thunman, H. Improved syngas processing for enhanced Bio-SNG production: A techno-economic assessment. Energy 2016, 101, 380–389. [Google Scholar] [CrossRef]
  5. Cui, X.; Song, G.; Yao, A.; Wang, H.; Wang, L.; Xiao, J. Technical and Economic Assessments of a novel biomass-to-synthetic natural gas (SNG) process integrating O2-enriched air gasification. Process Saf. Environ. Prot. 2021, 156, 417–428. [Google Scholar] [CrossRef]
  6. Song, G.; Wang, L.; Yao, A.; Cui, X.; Xiao, J. Technical and Economic Assessment of a High-Quality Syngas Production Process Integrating Oxygen Gasification and Water Electrolysis: The Chinese Case. ACS Omega 2021, 6, 27851–27864. [Google Scholar] [CrossRef]
  7. Wang, Z.; He, T.; Qin, J.; Wu, J.; Li, J.; Zi, Z.; Liu, G.; Wu, J.; Sun, L. Gasification of biomass with oxygen-enriched air in a pilot scale two-stage gasifier. Fuel 2015, 150, 386–393. [Google Scholar] [CrossRef]
  8. Nam, H.; Maglinao, A.L.; Capareda, S.C.; Rodriguez-Alejandro, D.A. Enriched-air fluidized bed gasification using bench and pilot scale reactors of dairy manure with sand bedding based on response surface methods. Energy 2016, 95, 187–199. [Google Scholar] [CrossRef]
  9. Gu, H.; Tang, Y.; Yao, J.; Chen, F. Study on biomass gasification under various operating conditions. J. Energy Inst. 2019, 92, 1329–1336. [Google Scholar] [CrossRef]
  10. Song, G.; Xiao, J.; Yan, C.; Gu, H.; Zhao, H. Quality of gaseous biofuels: Statistical assessment and guidance on production technologies. Renew. Sustain. Energy Rev. 2022, 169, 112959. [Google Scholar] [CrossRef]
  11. Feng, F.; Song, G.; Shen, L.; Xiao, J. Environmental benefits analysis based on life cycle assessment of rice straw-based synthetic natural gas in China. Energy 2017, 139, 341–349. [Google Scholar] [CrossRef]
  12. Ying, T.; Cao, H. Progress of biomass gasification technology. Chinese J. Bioprocess Eng. 2017, 15, 57–65. (In Chinese) [Google Scholar] [CrossRef]
  13. Ye, R.; Liu, J.; Li, X.; Zheng, L.; Li, M.; Wang, G.; Zhang, D. Experimental study on biomass of bubbling testbed with steam-oxygen enriched air gasification of directional. Acta Energiae Solaris Sin. 2016, 37, 1636–1642. [Google Scholar]
  14. Air-Liquide Standard Plants Fully-Packaged Modular Solutions. Available online: https://www.engineering-airliquide.com/sites/activity_eandc/files/2017/04/12/air-liquide-brochure-standard-plants-170418.pdf (accessed on 15 February 2021).
  15. Beijing-Peking-University- Pioneer-Technology-Co., -Ltd Vacuum Pressure Swing Adsorption Oxygen Plant (VPSA-O2). Available online: https://www.vpsatech.com/VPSA-Oxygen.html#local (accessed on 15 February 2021).
  16. Liu, X.; Dou, Q.; Min, W.; Chen, T.; Xue, Z. Pressure swing adsorption for oxygen generation and its application in EAF steelmaking. Steelmaking 2020, 36, 6–10. [Google Scholar]
  17. Vilela, C.M.; Boymans, E.; Vreugdenhil, B. Co-production of aromatics in biomass and waste gasification. Processes 2021, 9, 463. [Google Scholar] [CrossRef]
  18. Zwart, R.W.R.; Boerrigter, H.; Deurwaarder, E.P.; van der Meijden, C.M.; Paasen, S.V.B. Production of Synthetic Natural Gas (SNG) from Biomass. Available online: https://www.biosng.com/fileadmin/biosng/user/documents/reports/e06018.pdf (accessed on 19 September 2021).
  19. Seemann, M.C.; Schildhauer, T.J.; Biollaz, S.M.A. Fluidized bed methanation of wood-derived producer gas for the production of synthetic natural gas. Ind. Eng. Chem. Res. 2010, 49, 7034–7038. [Google Scholar] [CrossRef]
  20. Gassner, M.; Maréchal, F. Thermo-economic process model for thermochemical production of Synthetic Natural Gas (SNG) from lignocellulosic biomass. Biomass Bioenergy 2009, 33, 1587–1604. [Google Scholar] [CrossRef] [Green Version]
  21. GB/T 13611-2018; Classification and Basic Characteristics of City Gas. Technical-Standard; Standards Press of China: Beijing, China, 2018.
  22. Szargut, J. Exergy Method: Technical and Ecological Applications; WIT Press: Southampton, UK, 2005. [Google Scholar]
  23. Song, G.; Xiao, J.; Zhao, H.; Shen, L. A unified correlation for estimating specific chemical exergy of solid and liquid fuels. Energy 2012, 40, 164–173. [Google Scholar] [CrossRef]
  24. Watson, J.; Zhang, Y.; Si, B.; Chen, W.T.; de Souza, R. Gasification of biowaste: A critical review and outlooks. Renew. Sustain. Energy Rev. 2018, 83, 1–17. [Google Scholar] [CrossRef]
  25. Cao, Y.; Wang, Q.; Du, J.; Chen, J. Oxygen-enriched air gasification of biomass materials for high-quality syngas production. Energy Convers. Manag. 2019, 199, 111628. [Google Scholar] [CrossRef]
  26. Yuan, X.; Chen, L.; Sheng, X.; Liu, M.; Xu, Y.; Tang, Y.; Wang, Q.; Ma, Q.; Zuo, J. Life Cycle Cost of Electricity Production: A Comparative Study of Coal-Fired, Biomass, and Wind Power in China. Energies 2021, 14, 3463. [Google Scholar] [CrossRef]
Figure 1. Process flow sheet of the high-safety and cost-effective syngas production process.
Energies 16 03414 g001
Figure 2. Effects of pM and O2 purity on syngas composition of sawdust-derived syngas.
Energies 16 03414 g002
Figure 3. Effects of O2 purity and pM on (a) HHV, (b) Y, (c) ηex, and (d) power rates of sawdust-derived syngas.
Energies 16 03414 g003
Figure 4. Effects of O2 purity on HHV of syngas produced from five types of feedstock at pM of (a) 5 bar and (b) 10 bar.
Energies 16 03414 g004
Figure 5. Variations of (a) UPC and (b) LCOE with feedstock cost and O2 purity.
Energies 16 03414 g005
Figure 6. Variations of (a) UPC and (b) LCOE with plant scale and O2 purity.
Energies 16 03414 g006
Table 1. Composition of five kinds of biomass, in wt.%.
Composition RSCSSDSRCR
Proximate analysis ar
Moisture9.109.367.898.105.40
Fixed Carbon16.7516.7514.7776.4075.80
Volatile Matter63.6870.7475.7812.2012.30
Ash10.463.151.563.306.50
Ultimate analysis daf
Carbon43.9744.8544.2450.1942.10
Hydrogen5.995.636.206.106.00
Nitrogen1.200.920.990.023.09
Sulfur0.170.130.110.000.00
Oxygen48.6748.4748.4643.6948.80
ar: as received; daf: dry ash free.
Table 2. Regulations on HHVs of different types of natural gas in the technical standard.
ItemHHV (MJ/Nm3)
Class3T4T
Upper Value14.9819.04
Standard Value13.6217.31
Lower Value12.2615.58
Table 3. PC and EC of the syngas production plant with a plant scale of 25 t/h.
EquipmentBenchmarkPCEC (Million $)
Two-stage GasifierBiomass25 t/h3.266
Gas CleaningSyngas30.7 t/h2.025
CompressorsSyngas30.7 t/h0.494
Methanation reactorSyngas30.7 t/h0.877
Heat exchangersWater143 t/h0.119
ORCOutput2.39 MW0.510
VPSAO2 stream2510 m3/h0.809
Table 4. Composition, explosivity, and toxicity of producer gas and syngas using sawdust as feedstock.
ItemO2 Purity
40%50%60%70%
Producer gas
CH4 (vol.%)6.7 7.0 7.2 7.4
H2 (vol.%)32.9 34.5 35.7 36.6
CO (vol.%)28.6 30.0 31.1 31.8
CO2 (vol.%)17.5 18.3 18.9 19.3
N2 (vol.%)14.2 10.0 7.1 4.8
UEL (%)63.2 62.1 61.3 60.7
LEL (%)8.2 7.9 7.6 7.5
ToxicityPPPP
Syngas
CH4 (vol.%)30.8 33.1 34.9 36.2
H2 (vol.%)3.6 3.6 3.6 3.7
CO (vol.%)0.02 0.02 0.03 0.03
CO2 (vol.%)45.2 48.4 50.8 52.6
N2 (vol.%)20.4 14.8 10.6 7.3
UEL (%)36.3 34.6 33.5 32.6
LEL (%)13.0 12.3 11.8 11.4
ToxicityEEEE
Table 5. Technical properties of syngas produced from five types of biomass.
FeedstockComposition (vol.%)HHVYηex
CH4H2CO(MJ/Nm3)(Nm3/kgdaf)(%)
RS33.28 3.64 0.03 13.69 0.956 66.96
CS33.24 3.57 0.03 13.67 0.964 67.10
SD34.89 3.63 0.03 14.33 0.952 67.95
SR34.80 3.55 0.03 14.28 1.088 68.68
CR33.80 3.61 0.03 13.89 0.922 67.92
Disclaimer/Publisher’s Note: The statements, opinions and data contained in all publications are solely those of the individual author(s) and contributor(s) and not of MDPI and/or the editor(s). MDPI and/or the editor(s) disclaim responsibility for any injury to people or property resulting from any ideas, methods, instructions or products referred to in the content.

