Article

Interpretation of Sand Body Architecture in Complex Fault Block Area of Craton Basin: Case Study of TIII in Sangtamu Area, Tarim Basin

1
Institute of Petroleum Exploration and Development, PetroChina Tarim Oilfield Company, Korla 841000, China
2
School of Geosciences, Yangtze University, Wuhan 430100, China
3
Research Institute of Petroleum Exploration and Development, PetroChina, Beijing 100083, China
*
Author to whom correspondence should be addressed.
Energies 2023, 16(8), 3454; https://doi.org/10.3390/en16083454
Submission received: 9 March 2023 / Revised: 10 April 2023 / Accepted: 11 April 2023 / Published: 14 April 2023

Abstract

:
The complex fault block oilfields in the craton basin contain vast reserves of oil and gas resources. During the development of an oilfield, the flow of oil, gas, and water, is controlled by faults and configuration boundaries. The distribution of remaining oil and gas depends on the interpretation of the reservoir’s architecture. However, recognizing the faults and the architecture boundary remains a challenge, hindering the efficient development of these resources. This study proposes a new idea for interpreting the configuration of thick sand bodies. This study was conducted in order to interpret the fine architecture of thick sand bodies in the Sangtamu area, using core samples, well logging, and production data, guided by sedimentation patterns from ancient to modern times. Results indicate that the Sangtamu area is a braided river delta front sedimentary system, dominated by the backbone underwater distributary channel and branch-type underwater distributary channels. The backbone channel is larger in scale, with a relatively large rock grain size and a box-shaped logging curve, whereas the smaller-scale branch channels have a bell-shaped logging curve resulting from the gradual weakening of water energy. Sandstone bodies from different types of underwater distributary channels are spatially overlapped, forming thick plate-like sandstones. The architecture interface between channels can be used as the fluid seepage boundary and can help prevent bottom water intrusion to a certain extent. The remaining oil is primarily concentrated in the architecture boundary area, which presents the next potential tapping area.

1. Introduction

Complex fault block areas are found in craton basins worldwide. When there is a steady supply of oil and gas, and adequate preservation, unique structural changes can give rise to complex fault block oil and gas fields. Examples of such oil and gas fields include the Sangtamu, Dagang, and Shengli oilfields in China [1,2,3,4,5], as well as the Yilgarn oilfield in Australia [6]. In these complex fault block oil and gas fields, there are often multiple oil-water systems in the same fault block, due to the common constraints of fault boundary, sand body boundary, and physical boundary. Different fault blocks exhibit varying fluid movements during oil and gas field development, leading to different development outcomes. When fault distribution is clearly defined, researching the sand body architecture with precision is crucial for predicting the remaining oil distribution [7,8,9].
Research on sand body architecture is crucial, particularly during the intermediate and advanced phases of oil and gas field development [10,11]. Many scholars have conducted a significant amount of research on the architecture interpretation of underground reservoirs, such as predicting single sand bodies using logging and seismic data [12], the analytic hierarchy process [13] or the rock properties near the architecture interface [14]. Yue [15] proposes a set of methods for point dam identification and fine dissection of the internal configuration of point dams, and determines the identification marks of underground point dams based on logging data. The stacking pattern of meandering channel reservoirs was studied in detail, applying seismic forward modeling [16]. Qin proposed an automatic identification method for braided river architecture units and a method for quantitatively predicting the size of sand bodies using seismic data [17]. However, in the context of complex fault blocks, the scale and interrelationship of various types of sand bodies in the braided river delta front, are still not well understood [18].
The Tarim Basin, situated in southern Xinjiang, China, is a prototypical cratonic basin in the country. The basin is enclosed by the Tianshan, Kunlun, and Altun Mountains, spanning 520 km from north to south and 1400 km from east to west, with an area of approximately 7.2 × 10⁵ km2 [19,20]. The Sangtamu oilfield, situated in the northern part of the Tarim Basin, is divided into six fault blocks, due to the development of multiple faults. The Triassic system in the Sangtamu oilfield is a coarse-grained delta-lake sedimentary system of short handling distance. Within this system, the Triassic TIII formation constitutes a delta front deposit largely composed of underwater distributary channel microfacies [21]. The Sangtamu oilfield’s Triassic strata are characterized by a continuous distribution of underwater distributary channels [22,23]. Since the discovery and development of oil and gas in the 1990s, the Sangtamu oilfield has progressed through various stages, including production, construction, stable production, low-speed production, and development adjustment [24,25]. Given that the comprehensive water content is now above 90%, it is imperative to conduct detailed research into sand body architecture and remaining oil distribution, in order to develop an effective development adjustment plan.
This study utilized core, logging, and production data, to analyze the architecture of Triassic thick sandstone in the Sangtamu oilfield, building upon prior research. Lithofacies and architecture units were identified through observation and description of the core. Based on similar outcrops and modern sedimentation, we divide underwater distributary channels into two types, that is the backbone underwater distributary channel, and the branch-type underwater distributary channels. Different types of underwater distributary channels overlap each other, forming highly heterogeneous reservoirs. The objective was to study the distribution, scale, and overlapping relationships of genetic sand bodies within the Sangtamu oilfield, and provide guidance for further enhanced oil recovery of the oilfield.

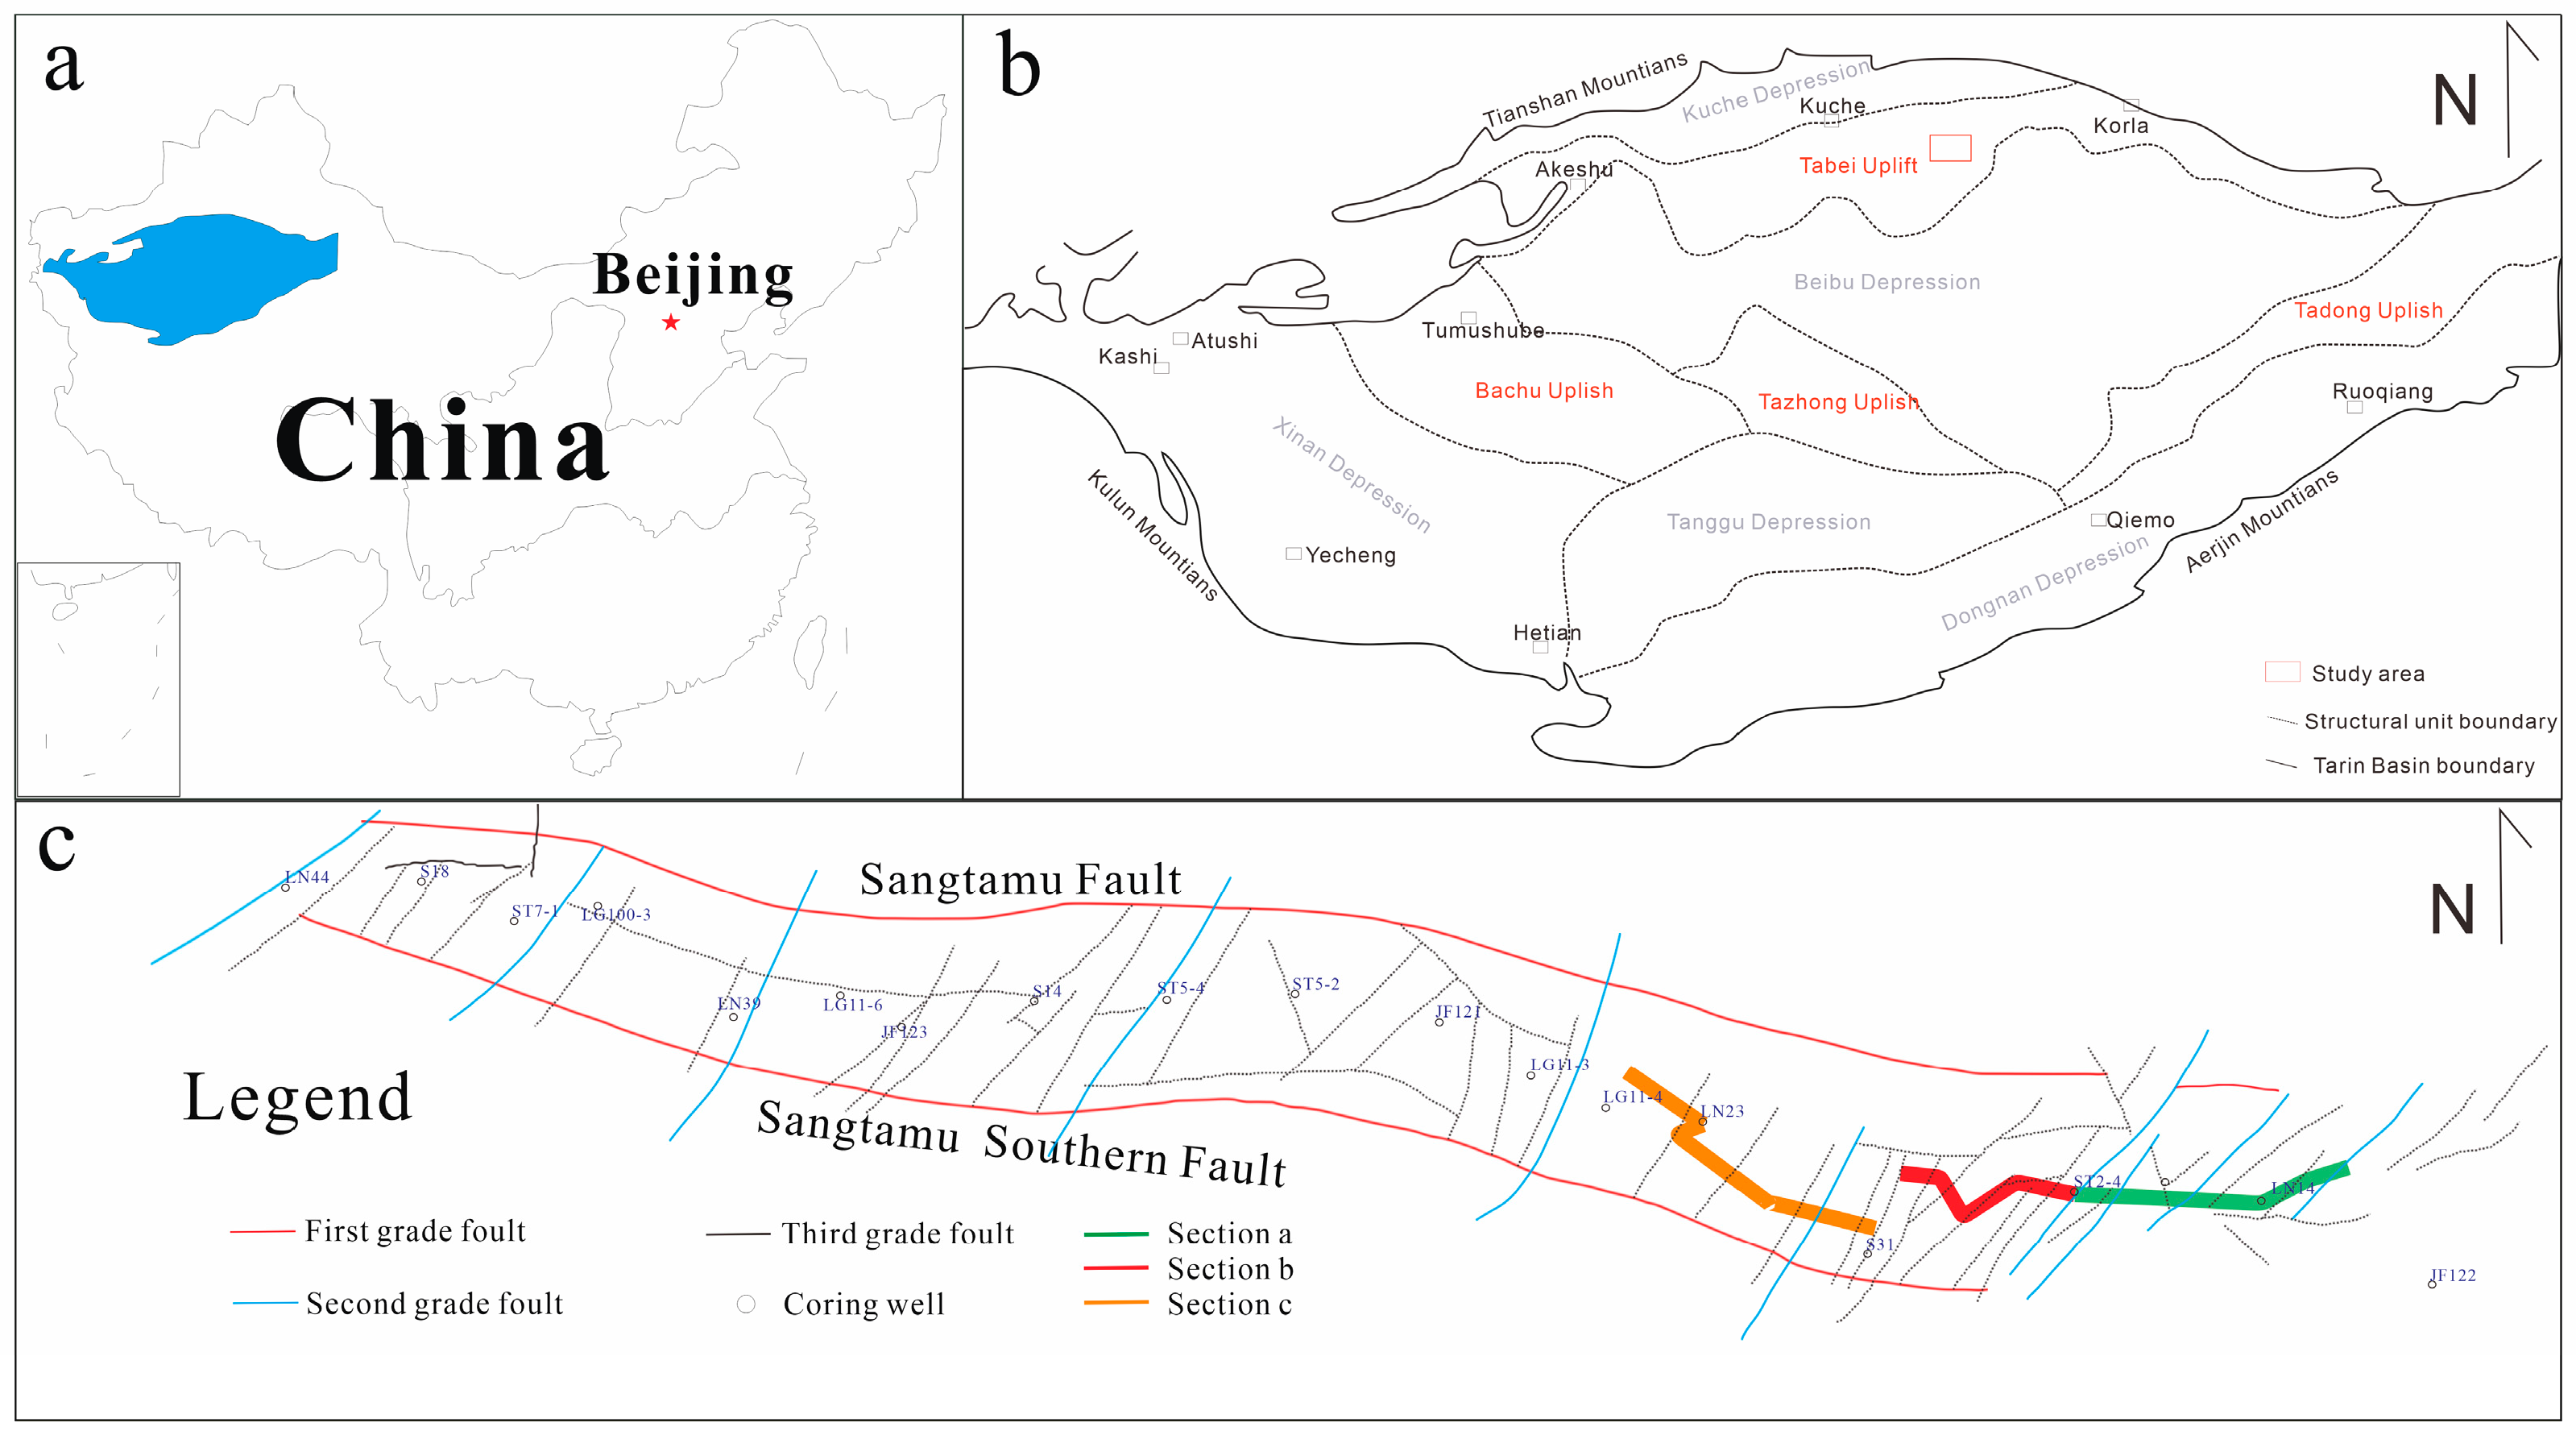
2. Geological Setting

The Tarim Basin is situated to the south of the Xinjiang Uygur Autonomous Region. The western part of the basin is elevated, while the eastern part is depressed. Deep faults in the surrounding area largely dictate the geological structure of the basin. The Tarim Basin was created through the superposition of a Paleozoic craton basin with a Cenozoic foreland basin [26]. Lunnan Buried Hill is situated in the northern portion of the Tarim Basin, with the Luntai Fault uplift to the north. It gradually transitions into the Manjiaer Sag in the south, and is flanked by two depressions in the East and West [27,28]. The Tabei uplift is a Paleozoic craton paleo-uplift. The uplift spans approximately 440–480 km in length and 80–100 km in width. As a residual paleo-uplift of the Lower Paleozoic, the Tabei uplift experienced multiple tectonic movements. The tectonic evolution process can be simply summarized, as the Caledonian nose-shaped uplift formation period, the Hercynian anticline formation period, the Indosinian Yanshan fault activity period, and the Himalayan tectonic finalization period. The Lunnan Buried Hill is situated in the northern portion of the Tabei uplift. The Lunnan Fault Horst Belt and the Sangtamu Fault Horst Belt arose due to the effects of the late Hercynian tectonic movement. As a result, the entire Lunnan Buried Hill is separated into a north-south fault horst belt and a central platform area [29,30,31].
The Sangtamu Oilfield’s regional structure lies within the Sangtamu Buried Hill Drape Anticline, the Lunnan Slope, and the Tabei Uplift. It is a lengthy and narrow anticline belt stretching for approximately 24 km in an east-west direction. The structure slopes gently toward the south, but steeply toward the north. A series of small faults intersect the anticline in a north-south direction, resulting in multiple local traps that gradually dip toward the west. Based on distributional structural characteristics, the oilfield has been separated into six production blocks (Figure 1). The stratum thickness in the Sangtamu Oilfield may exceed 6000 m. The Sangtamu Oilfield consists of drilled strata from the Paleozoic, Mesozoic, and Cenozoic periods, but lacks strata from the Permian, Devonian, and Silurian periods. Oil-bearing strata, including the Ordovician, Carboniferous, and Triassic periods, are present within the oilfield. The Triassic layer is the main target interval, with the environment of braided river delta-lacustrine. Sediments were transported from the northeast direction by the river channel, which are mainly underwater distributary channels.
The Triassic system is divided into the TI, TII, and TIII oil groups [32,33,34]. A thick sequence of light gray and gray coarse sandstone, or glutenite, is developed within the TIII oil group, interspersed with many thin mudstone inter-layers. During the sedimentary period of the TIII oil group, it was mainly braided-river delta deposition, with an abundant supply of source and a humid climate. The TIII oil group was formed by the superposition of multiple stages of channels with thick sandstone bodies. It can be further divided into five sublayers, based on the distribution of mudstone inter-layers. A set of stable dark gray mudstone was also developed above the TIII oil group, with a thickness of about 50 m, sometimes appearing as brown or brownish. The logging curve indicates that the Spontaneous Potential (SP) curve of the TIII oil group is box-shaped, exhibiting sudden changes at the top and bottom. The Natural Gamma Ray (GR) and True Formation Resistivity (RT) values in this section are lower than those in the upper and lower strata, making them distinguishable. The TIII oil group is further divided into three sand groups, TIII1, TIII2, and TIII3. The TIII1 sand group, which includes TIII1-1, TIII1-2, and TIII1-3 sublayers, is the main target stratum in this study (Figure 2).

3. Databases and Methods

The data used in this study were obtained from the PetroChina Tarim Oilfield Company, consisting of 97 exploration and production wells. By combining core samples, logging data, and production dynamics data, lithofacies classification, single well facies, and planar facies interpretations were conducted. Then, we extract sedimentary and architectural patterns from modern sediments and ancient outcrops in the similar sedimentary environments. Based on those, we carry out the accurate architectural interpretation of the Sangtamu oilfield. This method resulted in improved description and prediction for remaining oil development.
The core observation and description tasks were conducted in the core library of the Sangtamu oilfield. The core depth was corrected, based on the GR curve. A total of 16 coring wells, with a total of 200 m cores, are observed and interpreted. Lithofacies were divided into 12 types, based on rock type, sedimentary structure, and other related factors. The sedimentary environment was determined by analyzing the color of the mudstone. The sandstone bodies were divided vertically, based on lithology changes, the location of mudstone deposits, and scouring structures. Calcareous interbeds were identified using dilute hydrochloric acid, and their thickness was measured in order to calibrate the corresponding features of the logging curves.
Modern sediment analysis is a crucial method in sedimentology research. In this study, the Atchafalaya braided river delta, which is a typical modern braided river delta sedimentation system, was selected for observation. The formation and evolution processes of each level of architecture unit were interpreted, with a focus on the underwater distributary channel of the delta front. The underwater distributary channel was classified into the backbone underwater distributary channel and branch-type underwater distributary channels. This analysis can guide reservoir architecture characterization in the Sangtamu area.
Ancient sediments are exposed on the surface, allowing for intuitive observation of sedimentary features, and facilitating the study of underground reservoirs. In the Shenmu area of the Ordos Basin, we studied the superimposed pattern of channels in the Jurassic Braided River delta front. The channels intersect and overlap in space, resulting in thick and continuous distribution characteristics. Sediment types and sedimentary structures are similar to those found in the Sangtamu area, providing guidance for architecture interpretation in the Sangtamu region.

4. Results

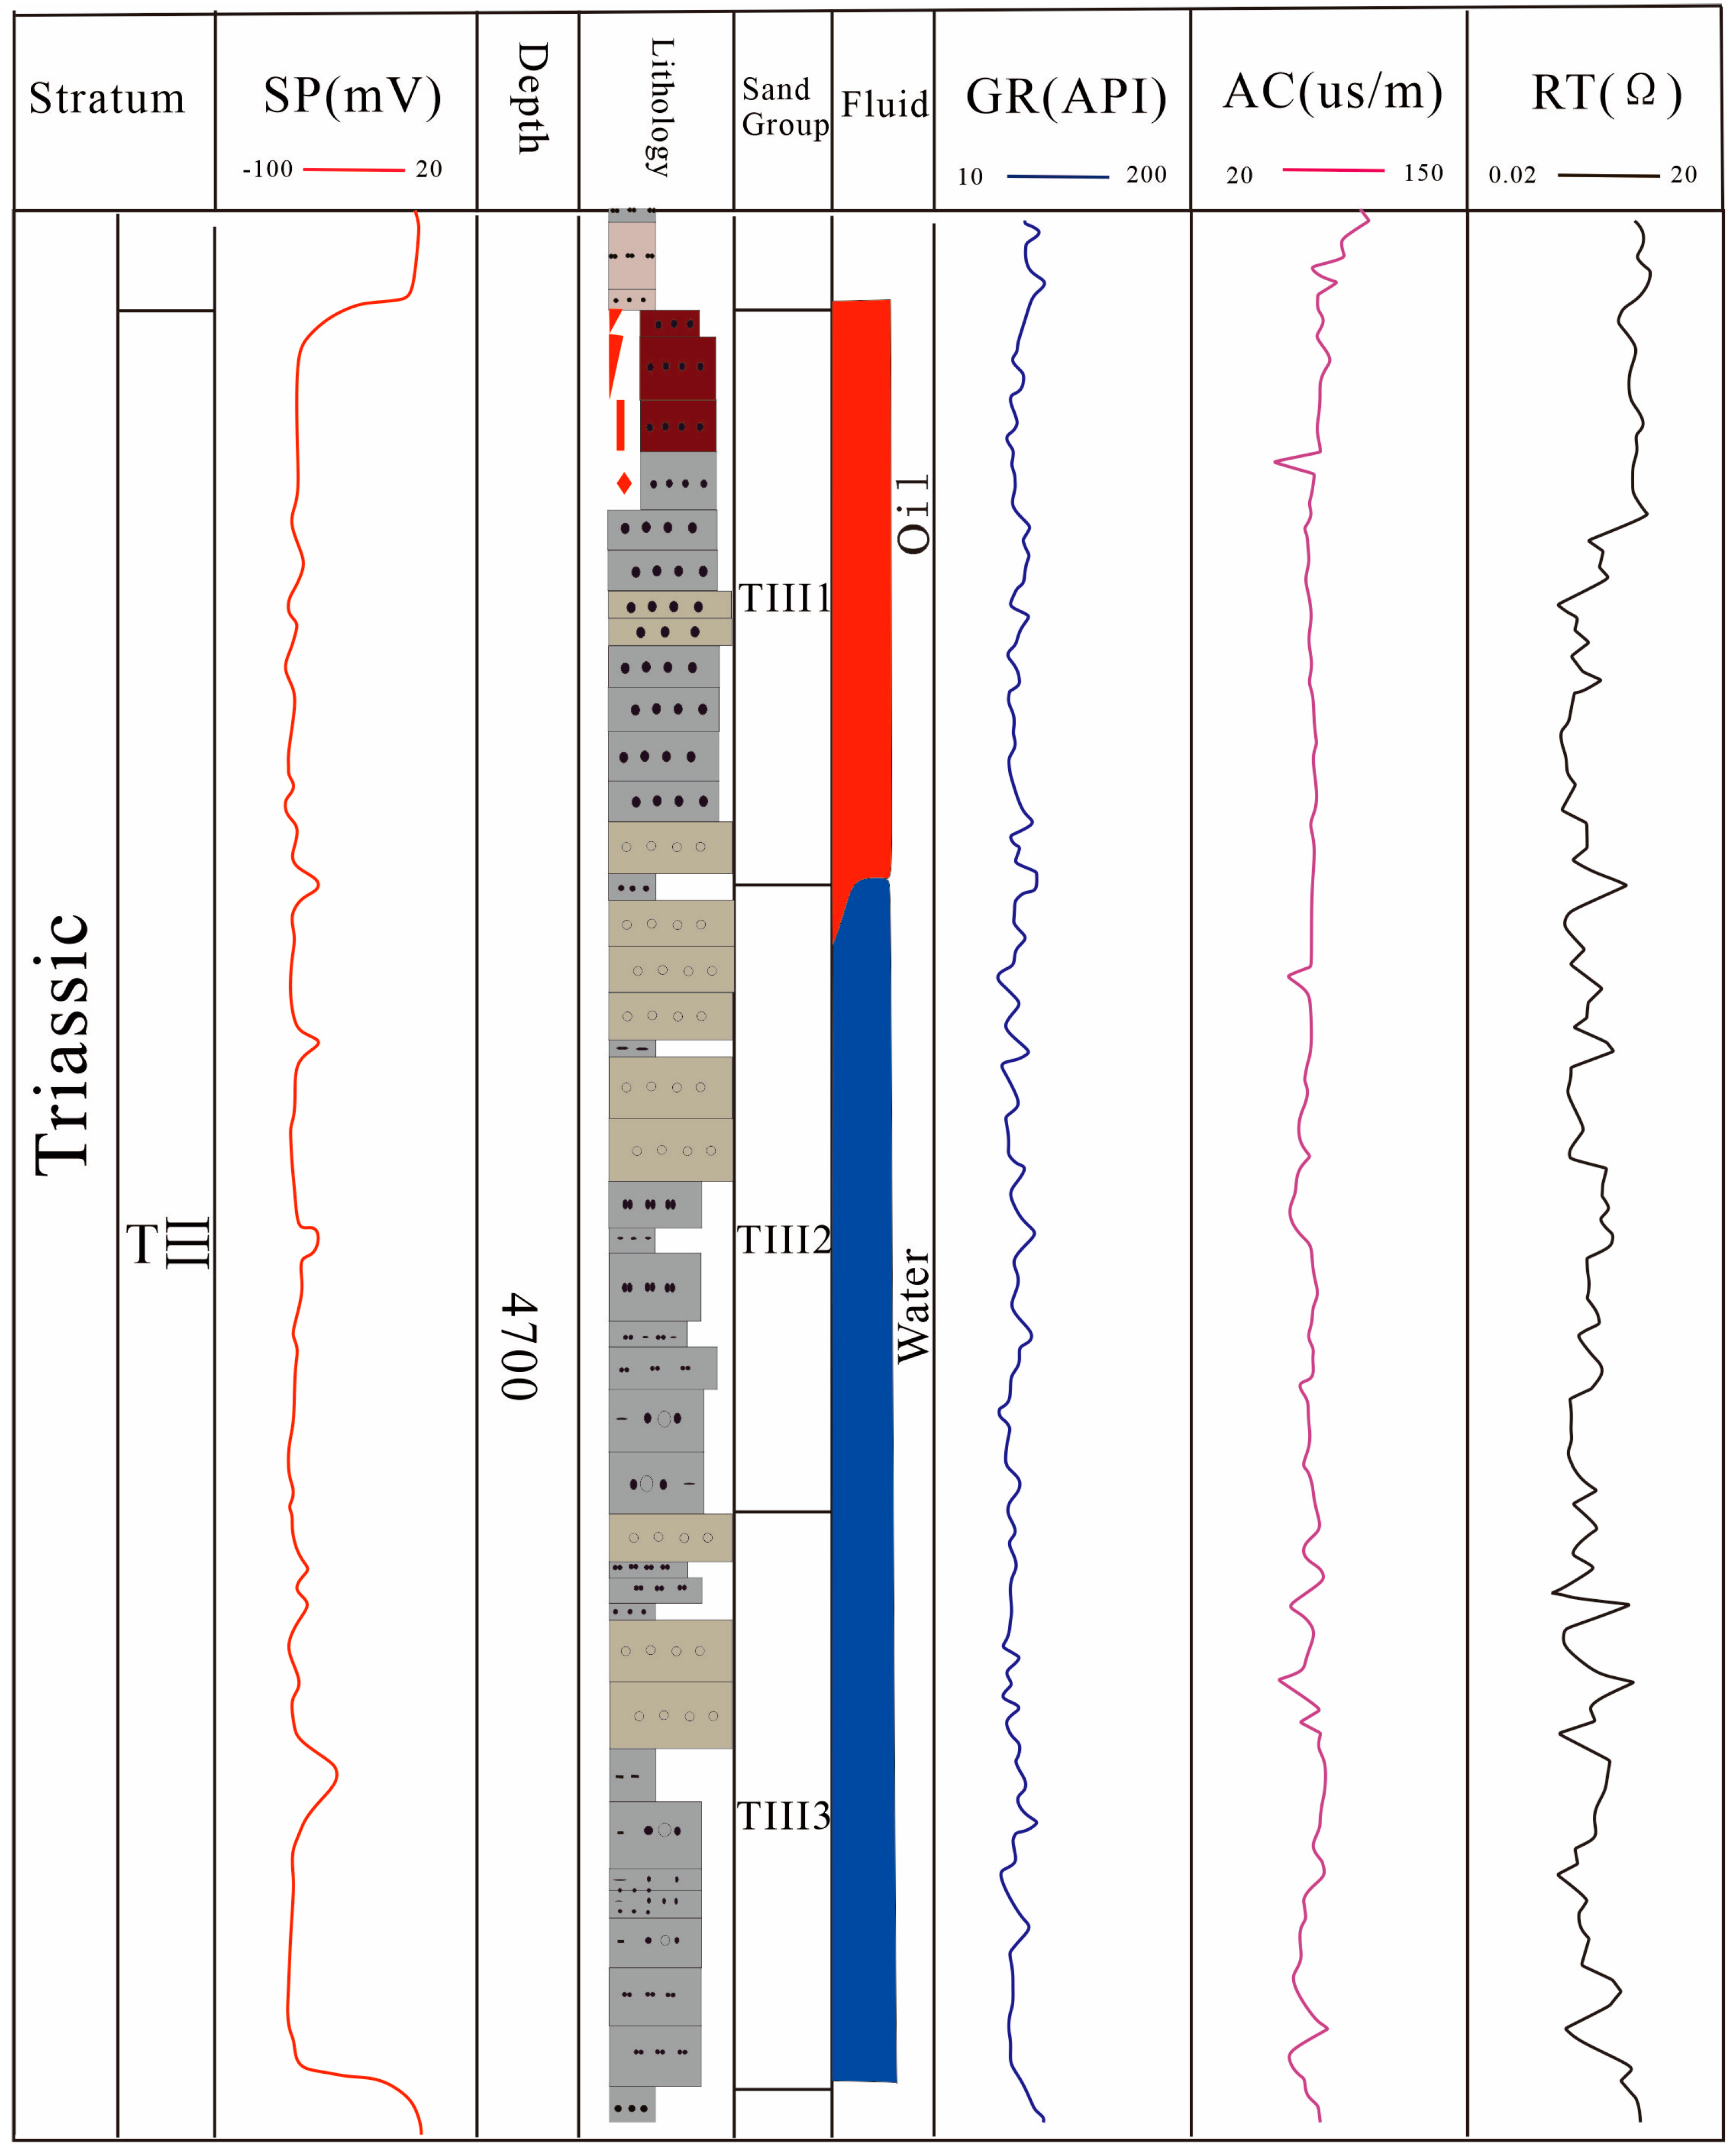
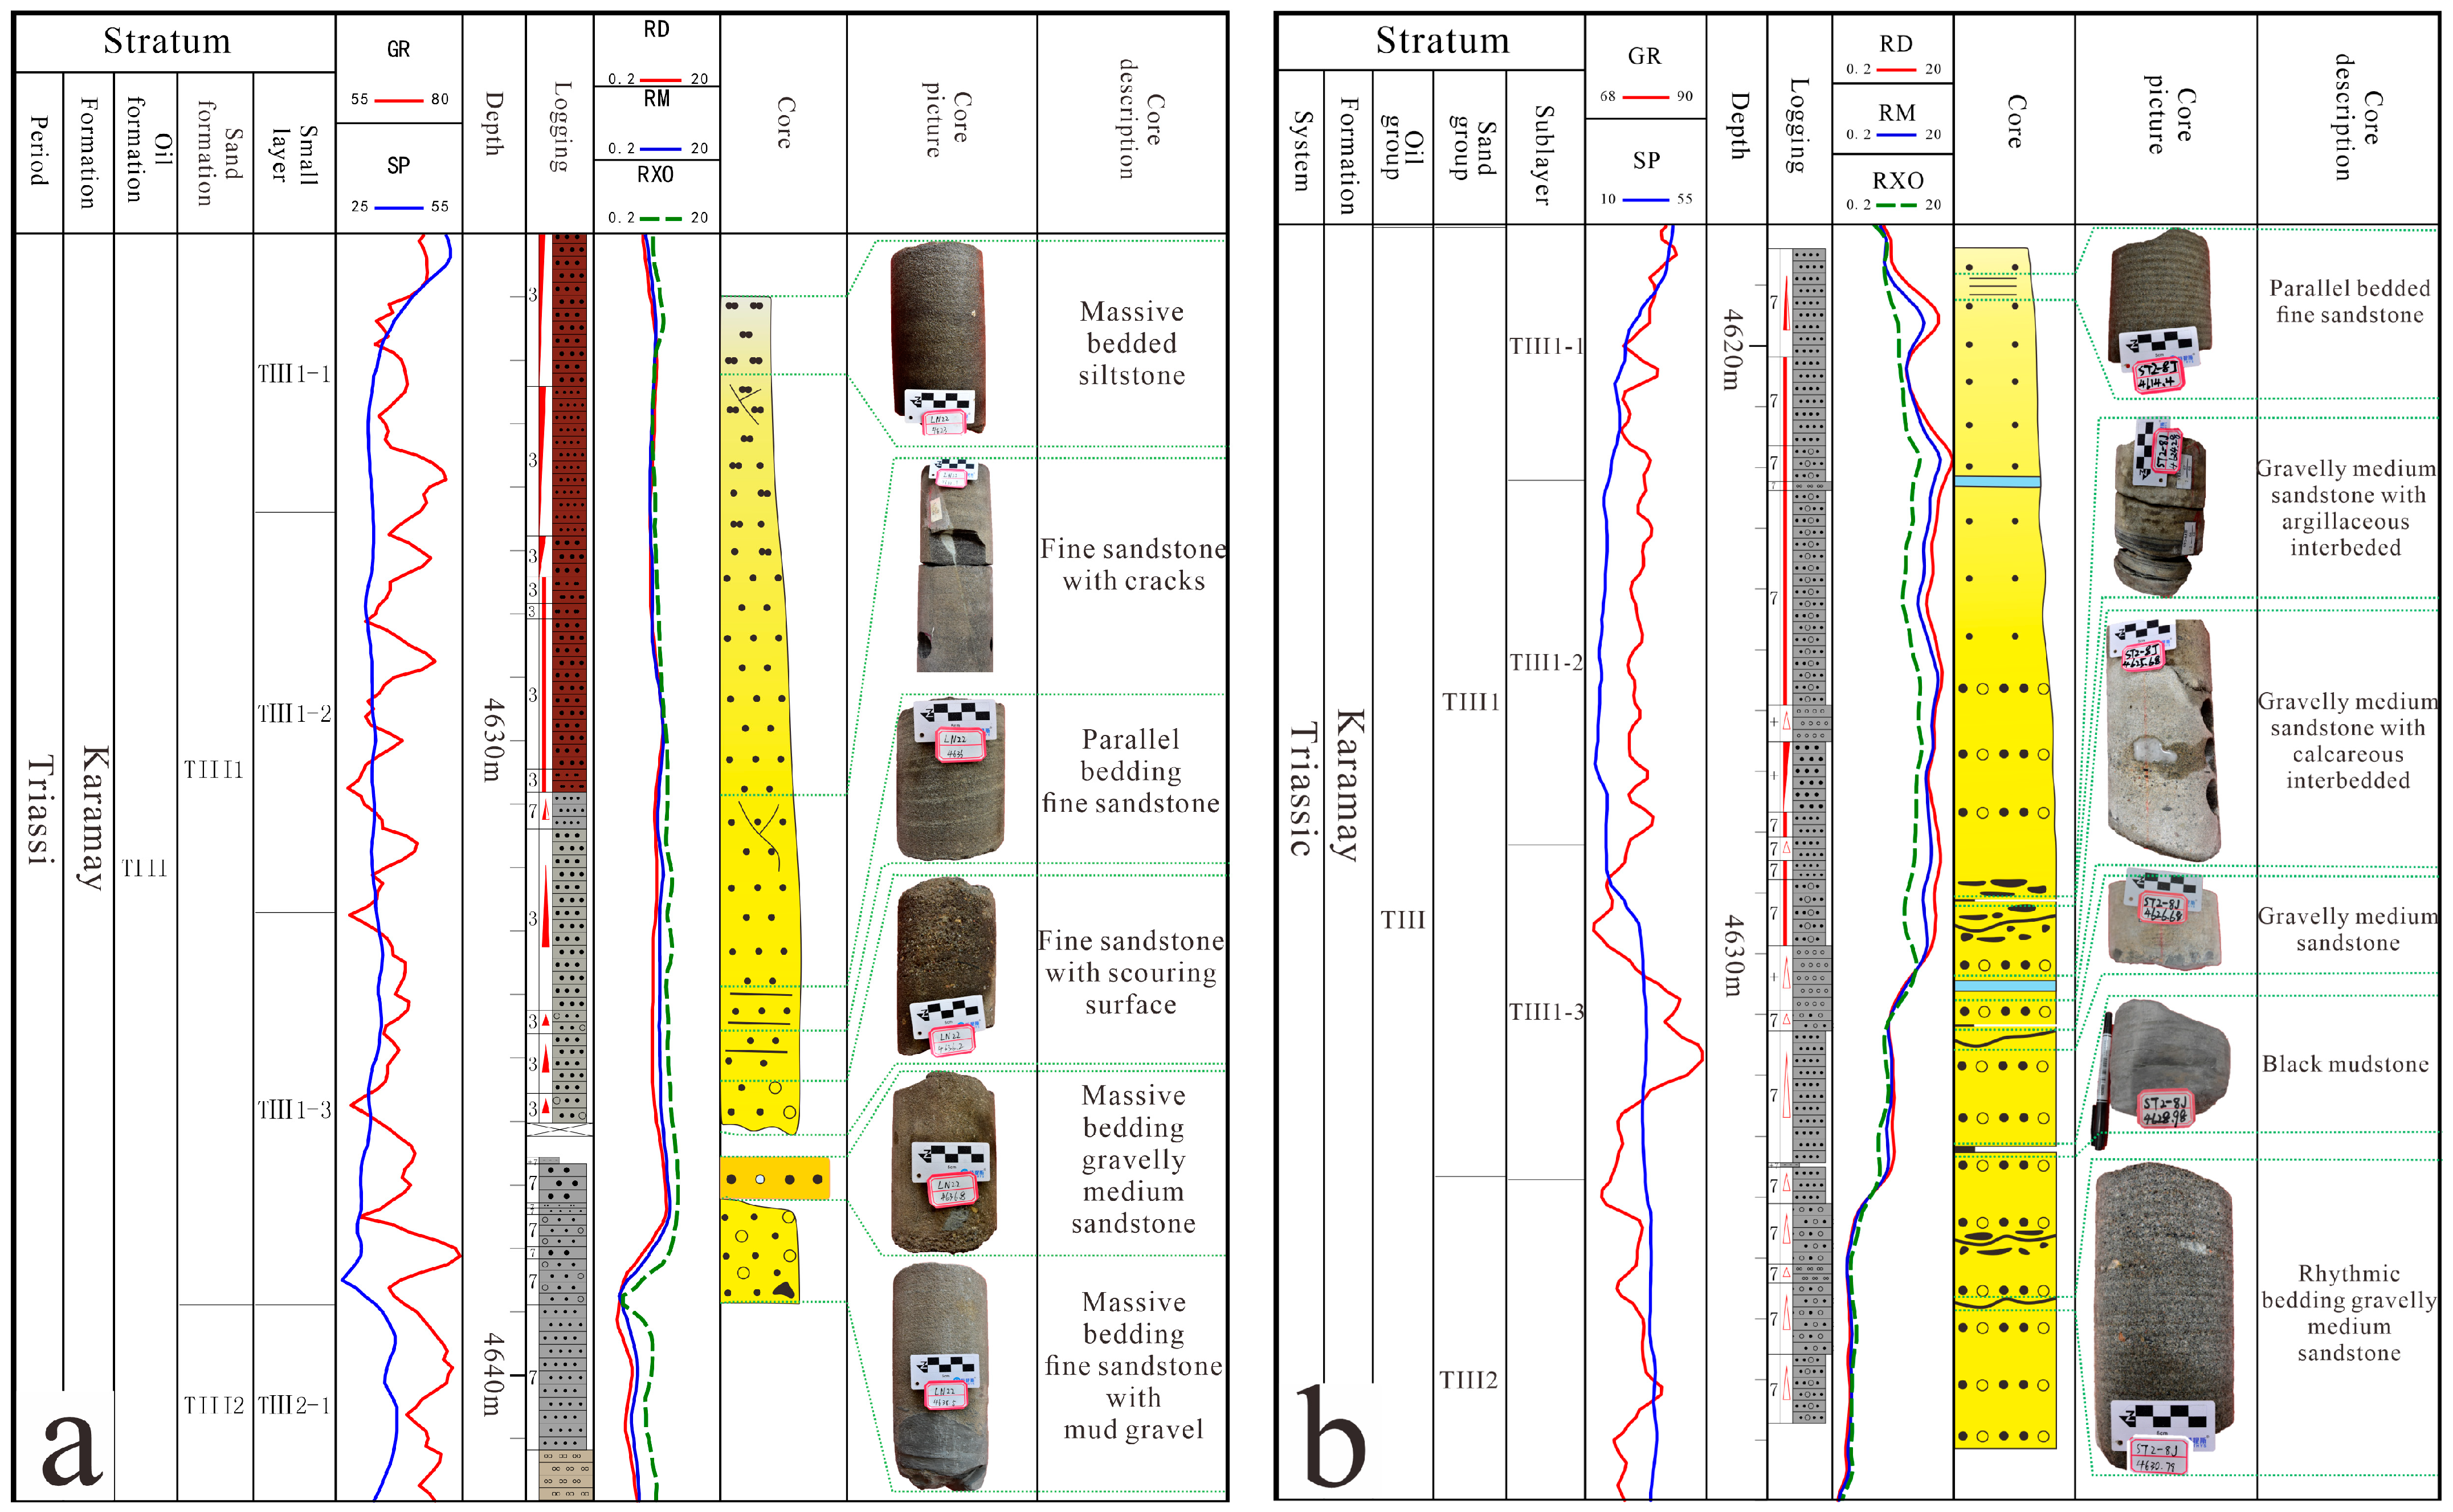
4.1. Lithofacies Division and Vertical Sequence

Lithofacies type and sequence combination are the main basis for distinguishing sedimentary architecture. In this study, 16 cored wells in the Sangtamu area were comprehensively analyzed for lithofacies. Based on factors such as color, gravel diameter, and structure that can reflect sedimentary origin and environment, lithofacies can be divided into 12 types: (1) Massive bedding gravelly medium sandstone (Figure 3a) often occurs in underwater distributary channel deposits, and reflects the sedimentary characteristics of tractive flow. The hydrodynamic force during the sedimentation period is strong. (2) Massive bedding medium sandstone with calcareous mass (Figure 3b) often appears in underwater distributary channel deposition, and reflects the characteristics of traction current deposition. The hydrodynamic force during the sedimentation period is strong. (3) Scour and filling structure mud-gravel and gravel medium sandstone (Figure 3c) are generally developed in rivers and alluvial fan environments, and belong to rapid sedimentation under strong hydrodynamic conditions. The scour surface was formed by the erosion of underlying sediments. (4) Rhythmic bedding medium sandstone (Figure 3d) generally appears in channel deposition, and is the result of rapid sedimentation of suspended sediments, mostly caused by sandy turbidity currents or gravity flow. (5) Massive bedding fine sandstone with calcareous mass (Figure 3e) generally appears in channel deposition, and reflects the sedimentary characteristics of tractive flow. The hydrodynamic force during the sedimentation period was strong and stable. (6) Parallel bedding fine sandstone (Figure 3f) often appears in underwater distributary channel deposition. The hydrodynamic force during the sedimentation period was strong and stable. (7) Plant detrital fine sandstone (Figure 3g) belongs to shallow water deposition where the hydrodynamic force during the sedimentation period was weak. (8) Scour and fill structure gravelly fine sandstone (Figure 3h) are generally developed in rivers and alluvial fan environments, and belong to rapid sedimentation under strong hydrodynamic conditions. The scour surface was formed by the erosion of underlying sediments. (9) Horizontally bedded siltstone (Figure 3i) often occurs in underwater distributary channel deposition where the hydrodynamic force during the sedimentation period was weak and stable. (10) Sand-grained bedding siltstone (Figure 3j) generally occurs in underwater distributary channel deposition, and was caused by water turbulence during the suspended sedimentary period. (11) Massive bedding mud-gravel siltstone (Figure 3k) generally appears on top of underwater distributary channel deposition. The mud-gravel is embedded in the silt caused by channel collapse. The hydrodynamic force during the sedimentation period was weak. (12) Massive bedding mudstone (Figure 3l) generally appears in reductive environments, such as deep lacustrine, marsh, and thirsty lake deposits, etc.
Based on core observations, there is a set of dark gray mudstone located under the Triassic system in the Sangtamu oil field. At the bottom of the TIII oil group, a set of gravel sandstone is present, while a set of coarse and medium sandstone is developed in the middle part. At the upper part of the TIII oil group, there is a set of fine sandstone and siltstone. A set of dark gray and gray mudstone is also located at the top. The grain size of the TIII oil group varies from coarse to fine, in tapering fashion, from bottom to top. The sandstone color is typically gray, but it darkens gradually from light yellow, to light brown, to brown, with increasing oil and gas grade.
The Triassic system in the area shows positive cycle deposits, and the sedimentary structures developed in different parts of the cycle vary. In the middle and lower parts of the cycle, the most common structures are scour surfaces and parallel bedding, followed by graded bedding, oblique bedding, cross-bedding, and block structures. At the top of the cycle, small or micro-oblique bedding, cross bedding, wavy bedding, and horizontal bedding, are mainly developed. In some sandstones, plant detrital fossils, coal seams, and bitumen, can also be observed (Figure 4).

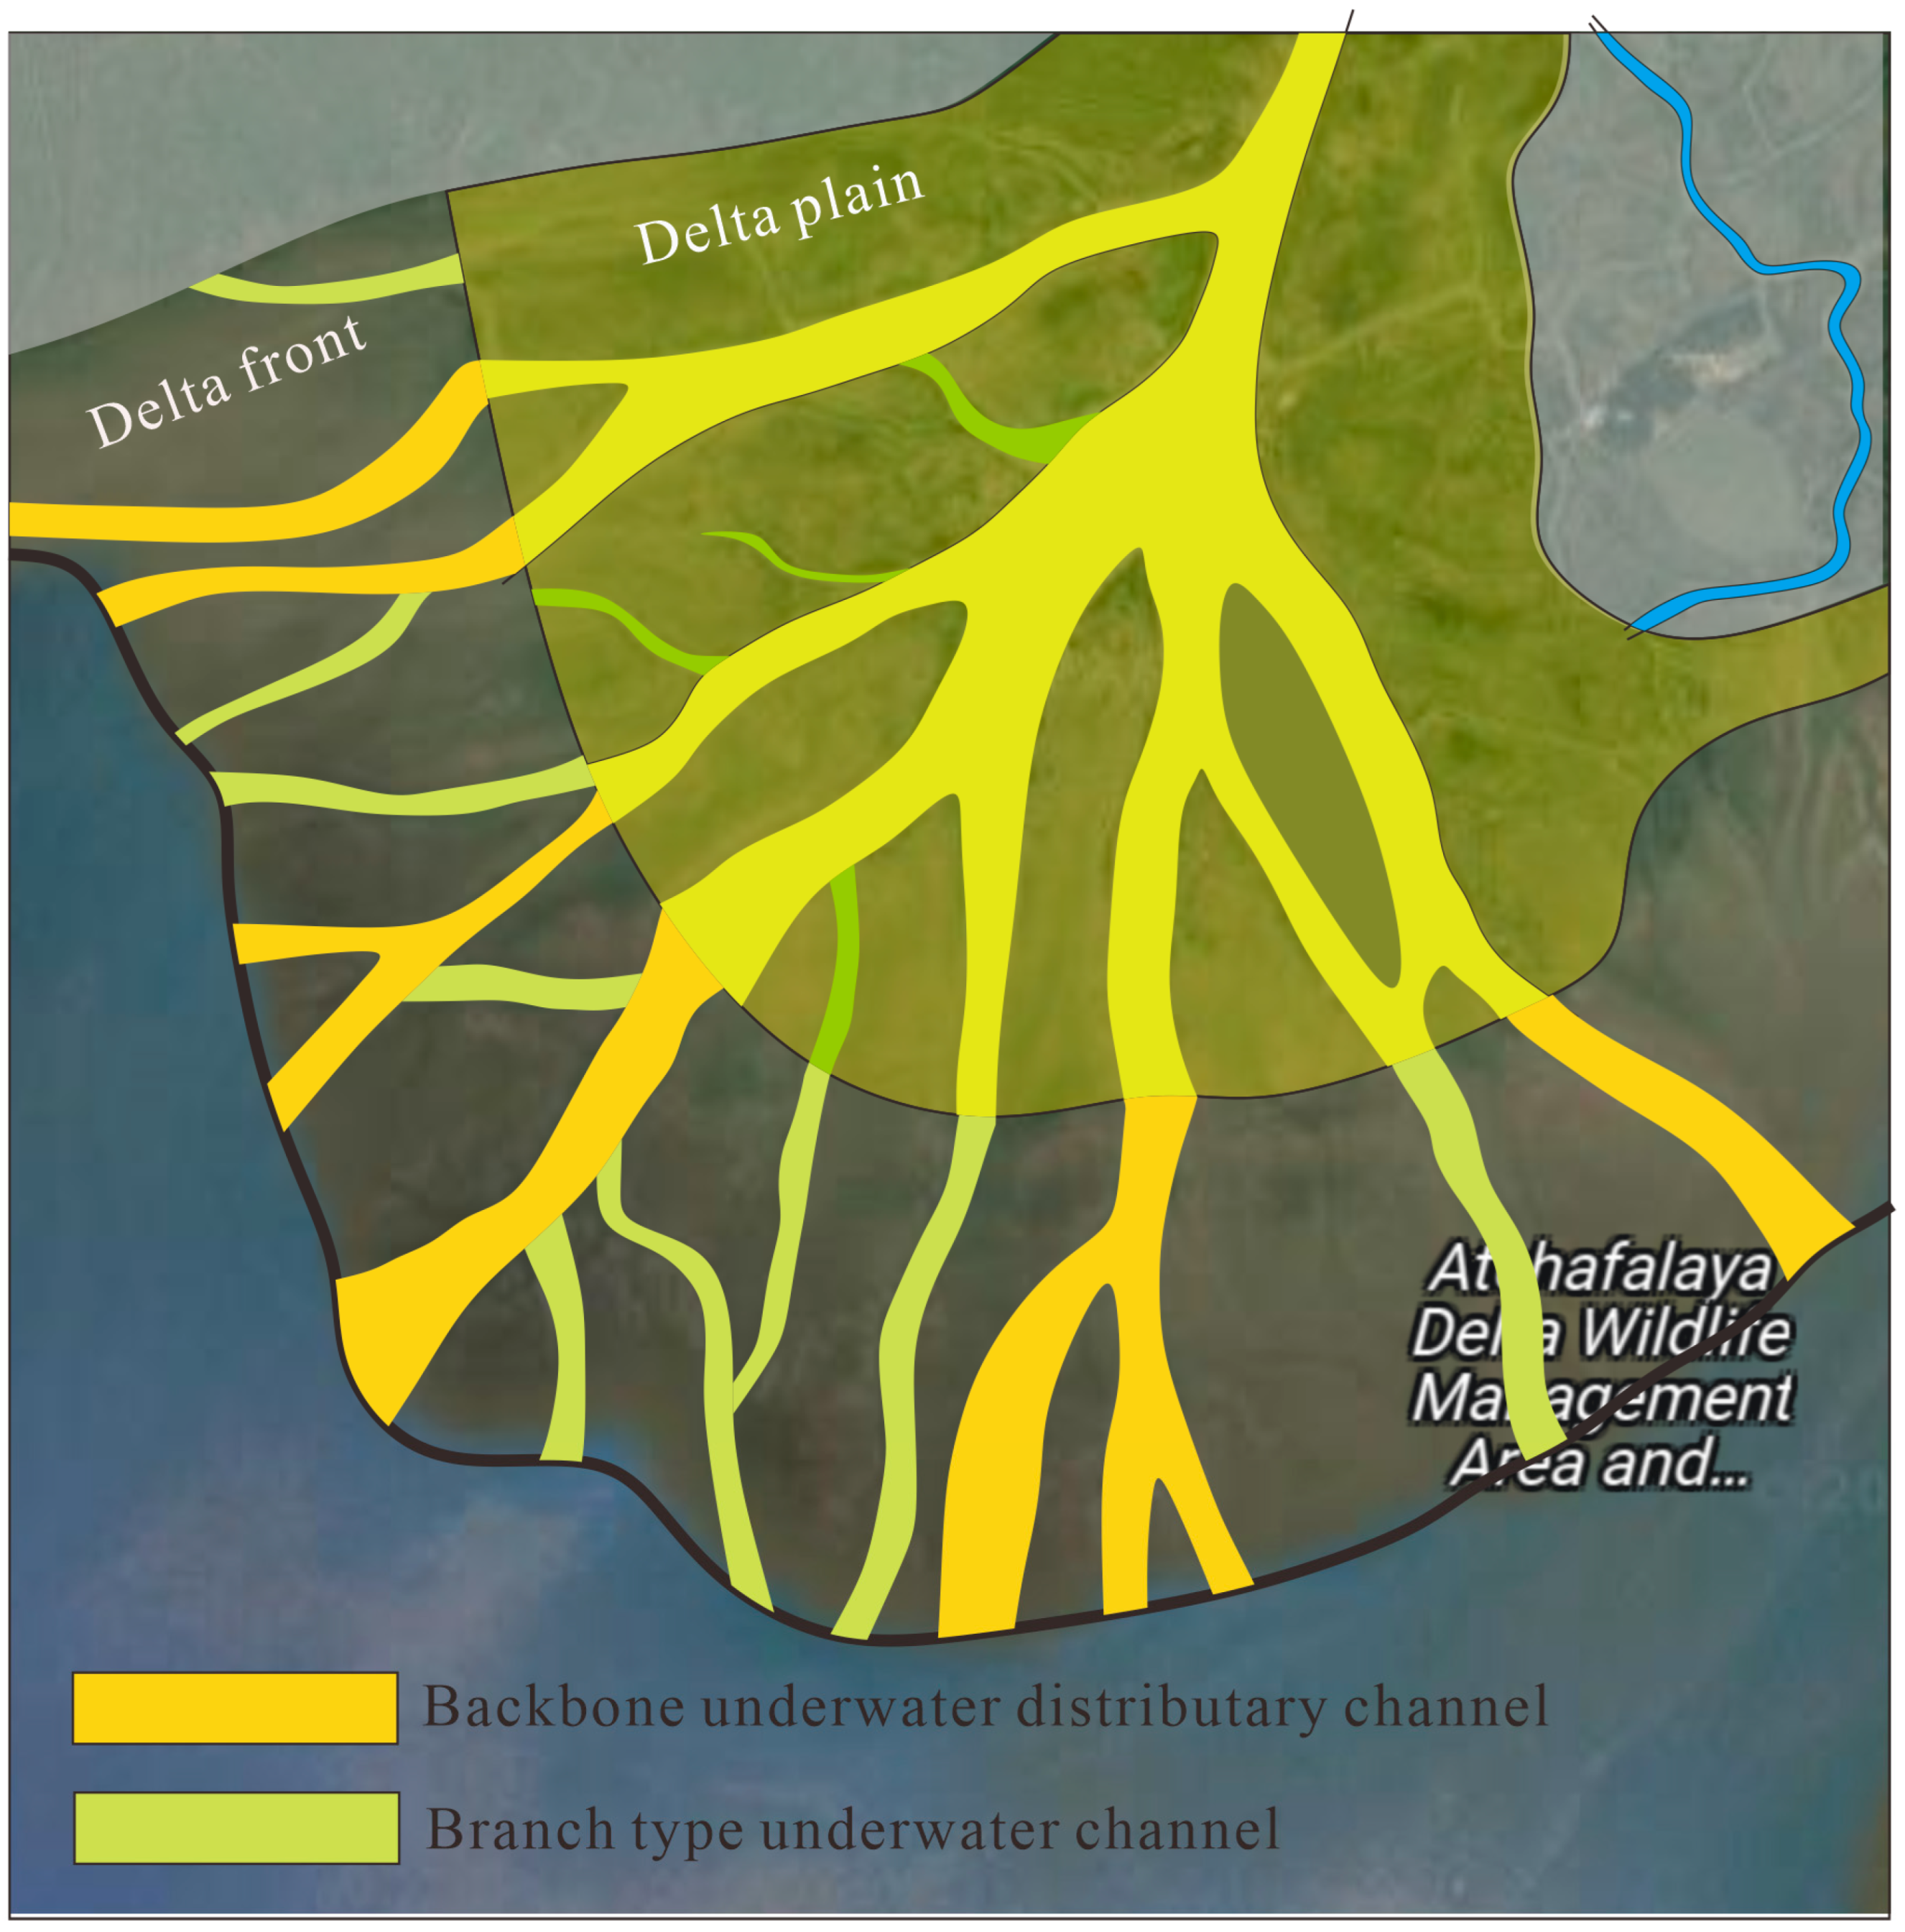
4.2. Modern Sedimentation

The interpretation of underground reservoir architecture cannot be separated from the description of modern sedimentation. This study takes a typical braided river delta as the model. The Achafalaya delta, located in the Gulf of Mexico, is a typical braided river delta deposit [35]. Previous research has extensively studied the evolution of this delta. In this study, we aimed to accurately describe the types and distributions of underwater channels in the Achafalaya delta front. Our analysis revealed two distinct types of underwater distributary channels, classified as backbone, and branch-type, underwater distributary channels.
The backbone underwater distributary channel has a width of 500–700 m, with a strong and stable hydrodynamic force. The branch-type underwater distributary channel, on the other hand, has a width of approximately 300 m (Figure 5). Some branch-type underwater channels have a short deposition time and eventually become abandoned. The sedimentary grain size in the branch-type underwater channels is generally fine.

4.3. Ancient Sedimentation

The superimposition pattern of channels in the Jurassic Braided River delta front in Shenmu area, Ordos Basin, were studied. Fine conglomerates, medium sandstones, fine sandstones, and silty mudstones were identified in the strata, with trough cross bedding, parallel bedding, and horizontal bedding being developed. All research data indicate strong hydrodynamic conditions during the sedimentary period. The outcrop shows the development of both backbone and branch type underwater distributary channels, presenting typical characteristics of flat tops and convex bottoms, with positive rhythm [36]. Among them, the single sand body of the river is large in scale, with a thickness of 3–5 m, and a width ranging from 20 to 150 m (Figure 6).

4.4. Architecture Interpretation Template

First, the shape, amplitude, smoothness, and combination characteristics of logging curves are analyzed. Second, logging curves with different characteristics are calibrated in combination with geological data, such as core analysis of coring well sections. Lastly, lithological and structural characteristics of sediments are characterized, using the logging curves in order to study sedimentary architecture. In the process of dividing sedimentary architecture, core data provides the most intuitive and accurate information. However, due to the limited availability of core data, logging data is widely used for interpreting sedimentary architecture, serving as a complement to core data.
In the Sangtamu area, the GR curve is capable of reflecting lithology with high vertical resolution, while the SP curve can reflect reservoir characteristics in the Triassic TIII-1 sand group. Therefore, the GR and SP curves are used to predict sedimentary architecture. In this study, logging facies models are classified into three types. The first type is the large box type, characterized by continuous strong hydrodynamic force and large sand body thickness, accounting for 75%. The second type is the low amplitude box type, or bell type, with obvious dentation. Its hydrodynamic force changed frequently and generally weakened, accounting for 20%. The third type is the superimposed finger type, characterized by frequent changes in hydrodynamic force and generally weakened force, accounting for 5%.
Careful study of the core, extraction of necessary data, and creation of single well phase analysis histograms, are critical in the analysis of sedimentary architecture (see Table 1).
Single well architecture interpretation was conducted for 97 wells in the Sangtamu area, based on the log architecture model, which was then combined with core data (see Figure 7). The results show that the backbone underwater distributary channel accounts for more than 60% of the sedimentary architecture, while the branch-type underwater distributary channel accounts for 30%. The remainder includes bank overflow deposits and interchannel deposits.
After completing the single well architecture phase analysis of key wells, a skeleton profile of the entire area is established from point to line. Then, well-tie sedimentary architecture is compared, in order to analyze the lateral association relationships and distribution characteristics of sedimentary architecture. In this study, six cross sedimentary architecture well correlation profiles were established in the Sangtamu area.
After considering the structural and sedimentary characteristics of the Sangtamu area, the cut-off material source mode was chosen to analyze the well-tie architecture of each fault block. On the profile, the relationship between the backbone and the branch underwater distributary channels, is characterized by “vertical tangential overlap and lateral overlap”. The backbone channel exhibits large scale and positive rhythm, with strong hydrodynamic force that gradually decreases (as shown in Figure 8).

4.5. Architecture Plane Distribution Characteristics

Based on the analysis above, we have created architecture planes for the three sublayers of the TIII1 sand group (as shown in Figure 9). Vertically, the channel scales decrease gradually due to the weakening of hydrodynamic force. The backbone underwater distributary channels are mainly developed in the TIII1-3 sublayer, exhibiting a large scale. On the other hand, the branch-type underwater distributary channels are mainly developed in the TIII1-1 sublayer, which has the smallest scale. In space, multiple channel sand bodies overlap, creating thick plate-like sandstone bodies. Furthermore, the porosity and permeability of these sandstone bodies are large enough to form a typical massive bottom water reservoir, after hydrocarbon accumulation.

5. Discussion

By applying the sedimentary architecture method, we have resolved existing production contradictions based on the production process of the last 30 years. This method can guide the prediction of the remaining oil distribution in this complex fault block reservoir. As an example, consider the Ln22 well block where well X1 started producing oil in February 1993, containing almost no natural gas. It has a nearly 2-year anhydrous oil production period, with a cumulative oil production of 5 × 10⁵ tons (as shown in Figure 10a). However, well X2, located 195 m away from well X1, produced a large amount of natural gas resources in 2014 with a gas oil ratio of 2000. The water content of well X2 increased rapidly, and the cumulative oil production was only 200 tons (as shown in Figure 10b). The difference in production performance between these two wells was not easily understood before the architecture study.
The architecture profiles of X1 and X2 are illustrated in Figure 11. Well X1 has two perforation sections, labeled as ‘a’ and ‘b’. Perforation section a was opened in March 1992, and it produced a daily oil output of 188 tons. However, after 6 years, the water content increased to 65%, leading to the blocking of perforation a, and the opening of perforation b. The daily oil production was reduced to 18 tons, and the water content continued to increase. To date, the cumulative oil production is 5 × 10⁵ tons.
Based on the results of the configuration interpretation, we found that wells X1 and X2 were drilled in different channels in the TIII1-1 sublayer. There was a 1-m-thick calcareous interlayer found between TIII1-2 and TIII1-1 in well X2, which prevented the exploitation of natural gas in the phase 1 channel of X2. It was only until June 2017, when perforations c and d were set up (as shown in Figure 11), that a large amount of natural gas was produced from well X2. However, the daily oil production was extremely low, due to the 20-year production of X1 having utilized the oil reserves of well X2. Therefore, there are many internal seepage boundaries that control the actual development effect, although it is a thick sandstone reservoir formed by overlapping multiple river channels.
Through detailed architecture interpretation, we can identify the architecture boundary within the reservoir, which can help us to analyze the movement law of oil and water, speculate on the location of remaining resources, and provide guidance for further enhanced oil recovery of the oilfield.

6. Conclusions

(1)
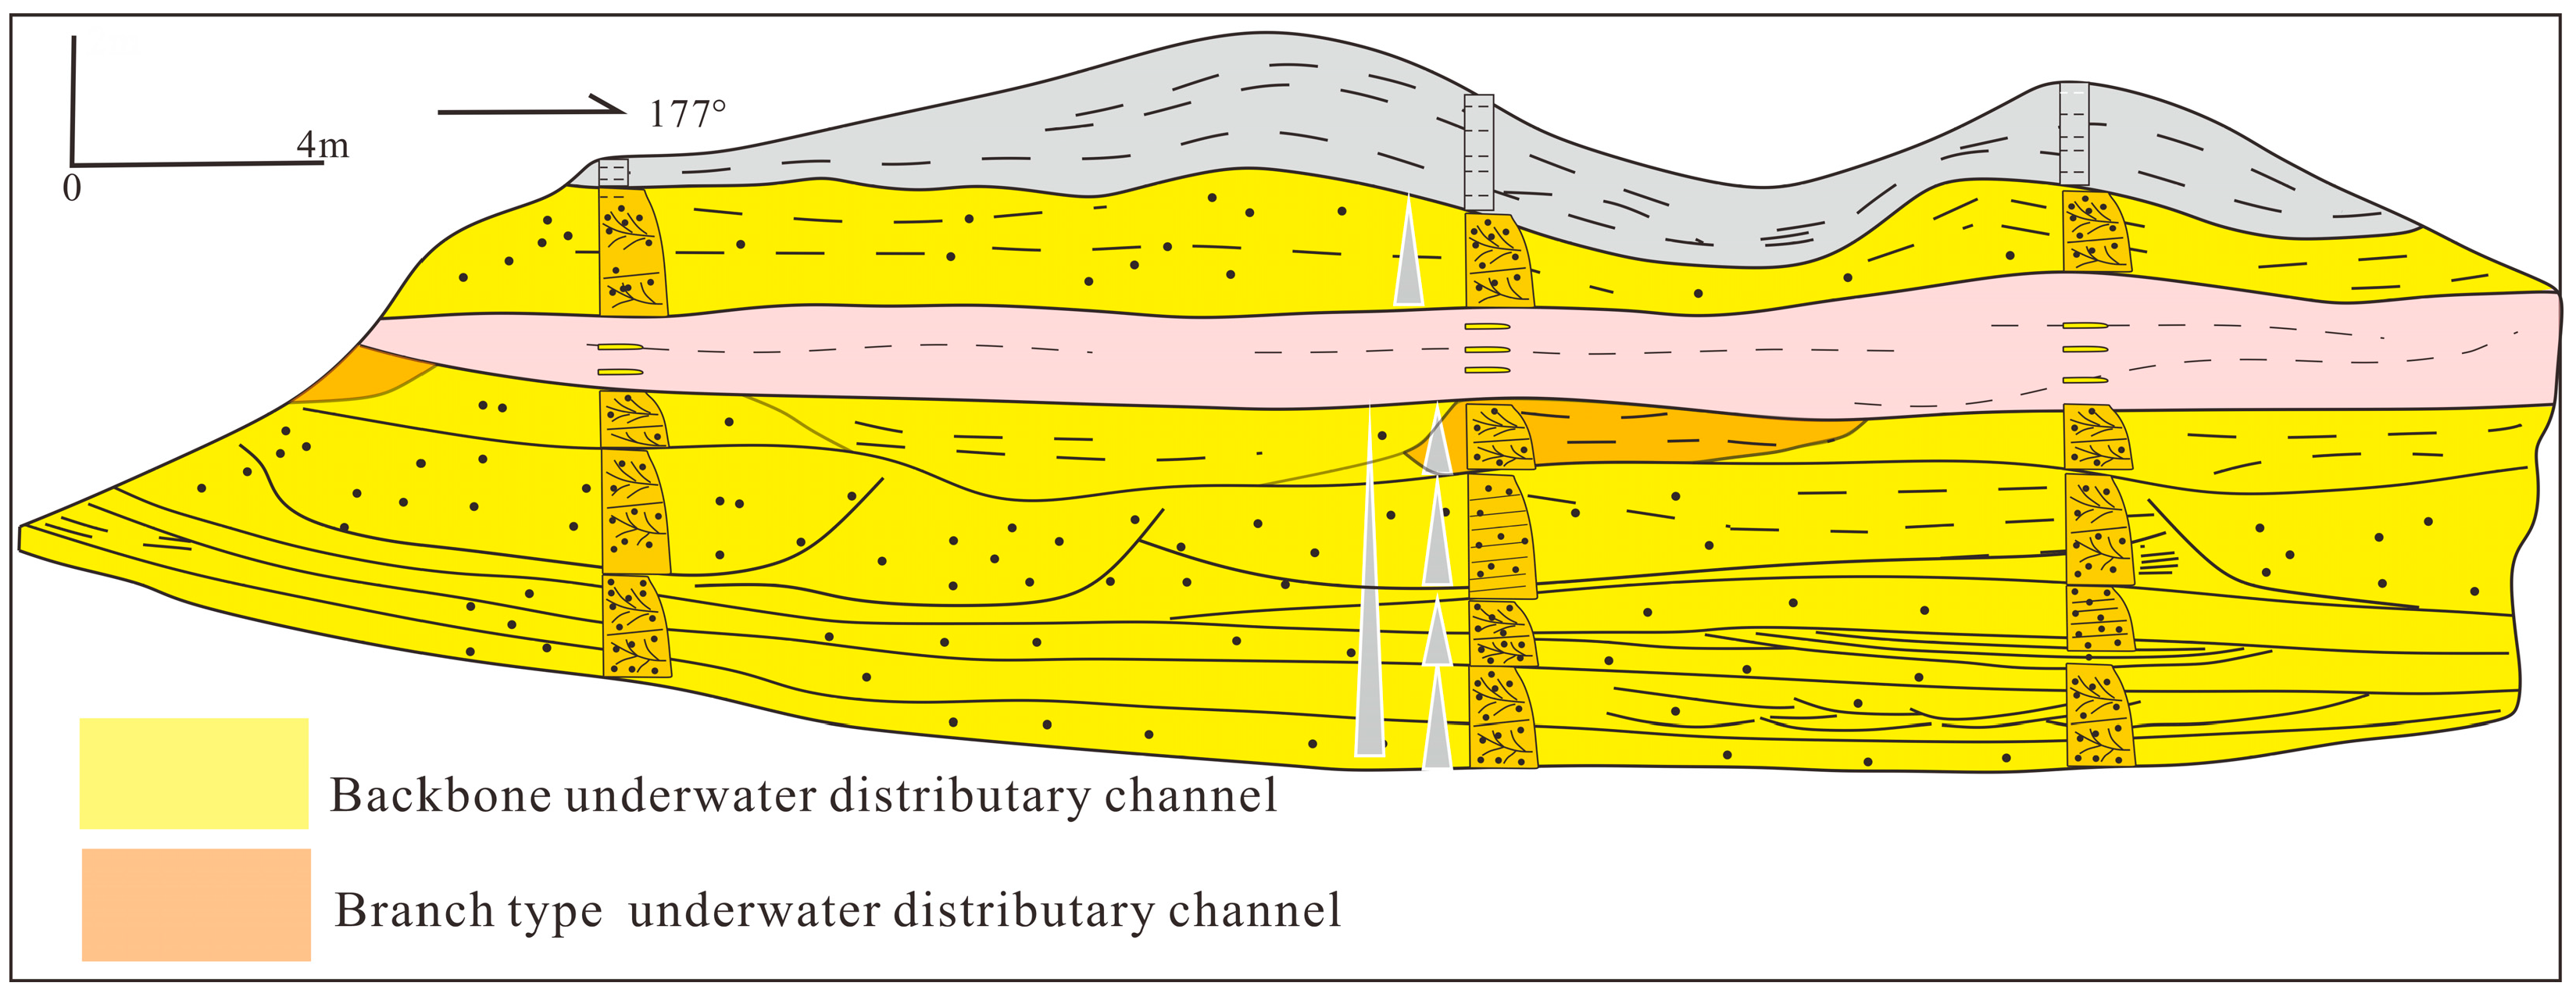
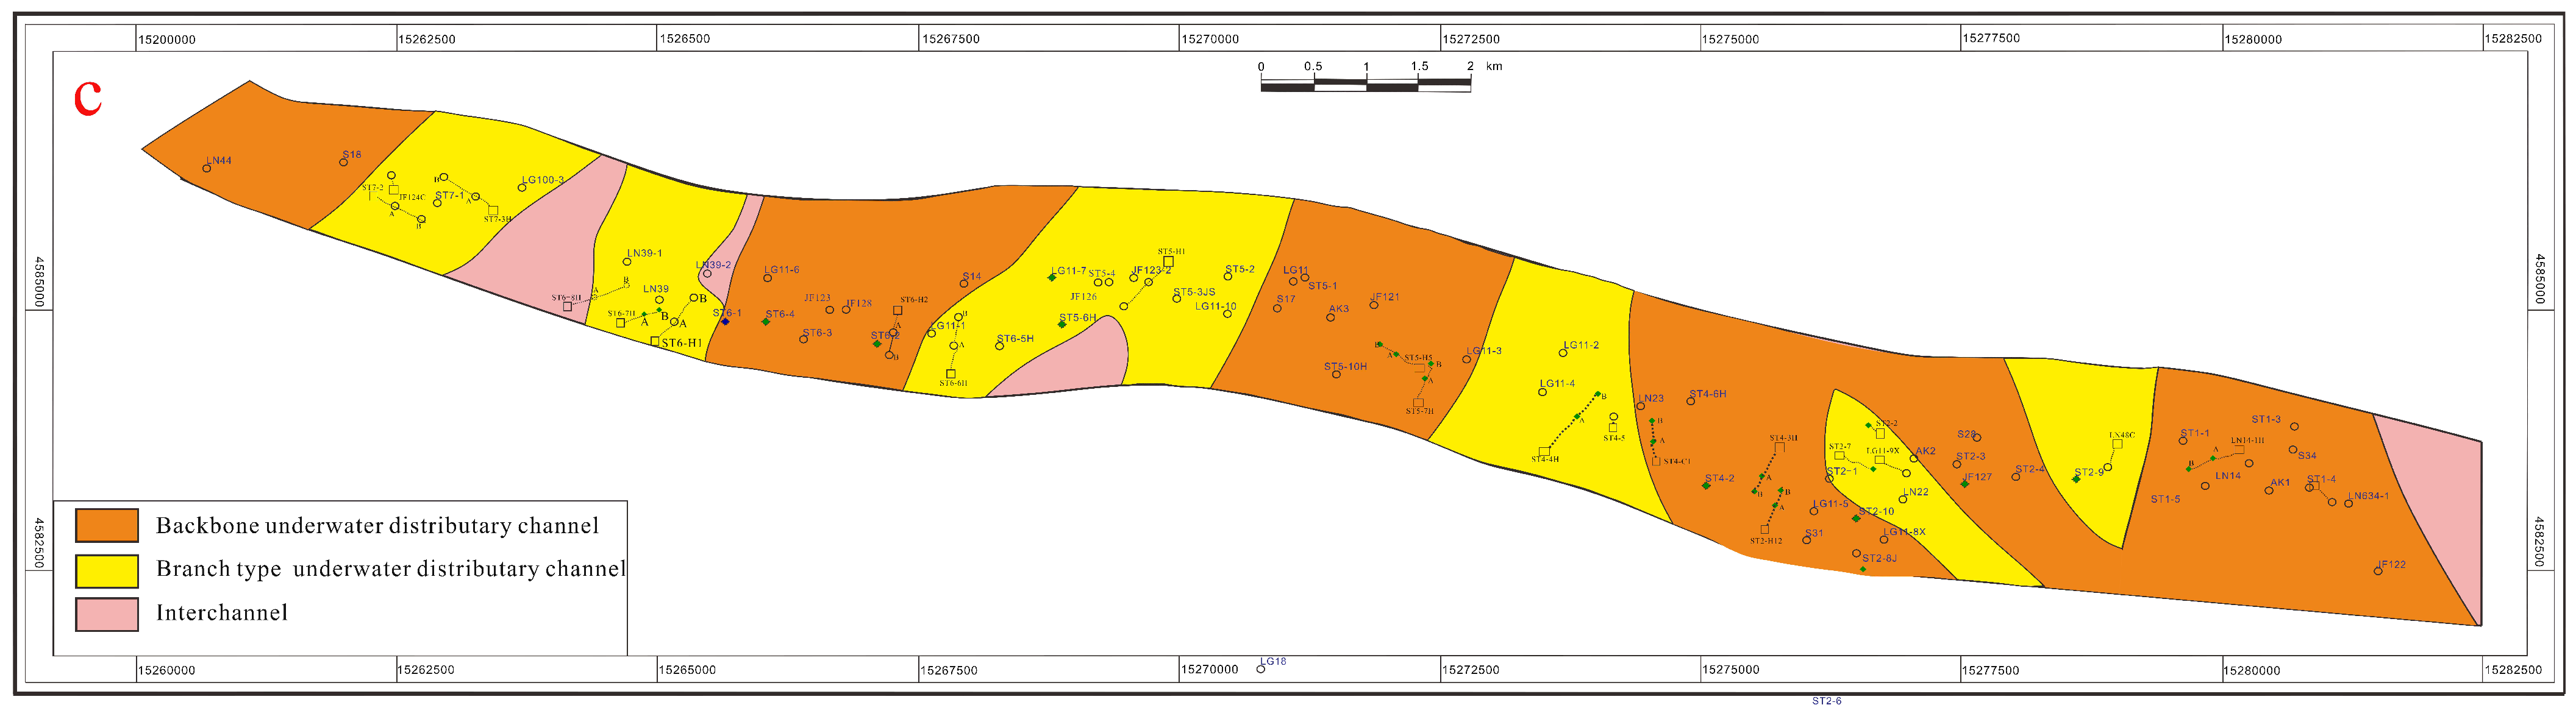
Based on the observation and description of cores in the Sangtamu area, 12 lithofacies types were identified. With the sedimentary background of a braided river delta front in mind, three architecture units were classified: backbone underwater distributary channel, branch-type underwater channel, and interchannel.
(2)
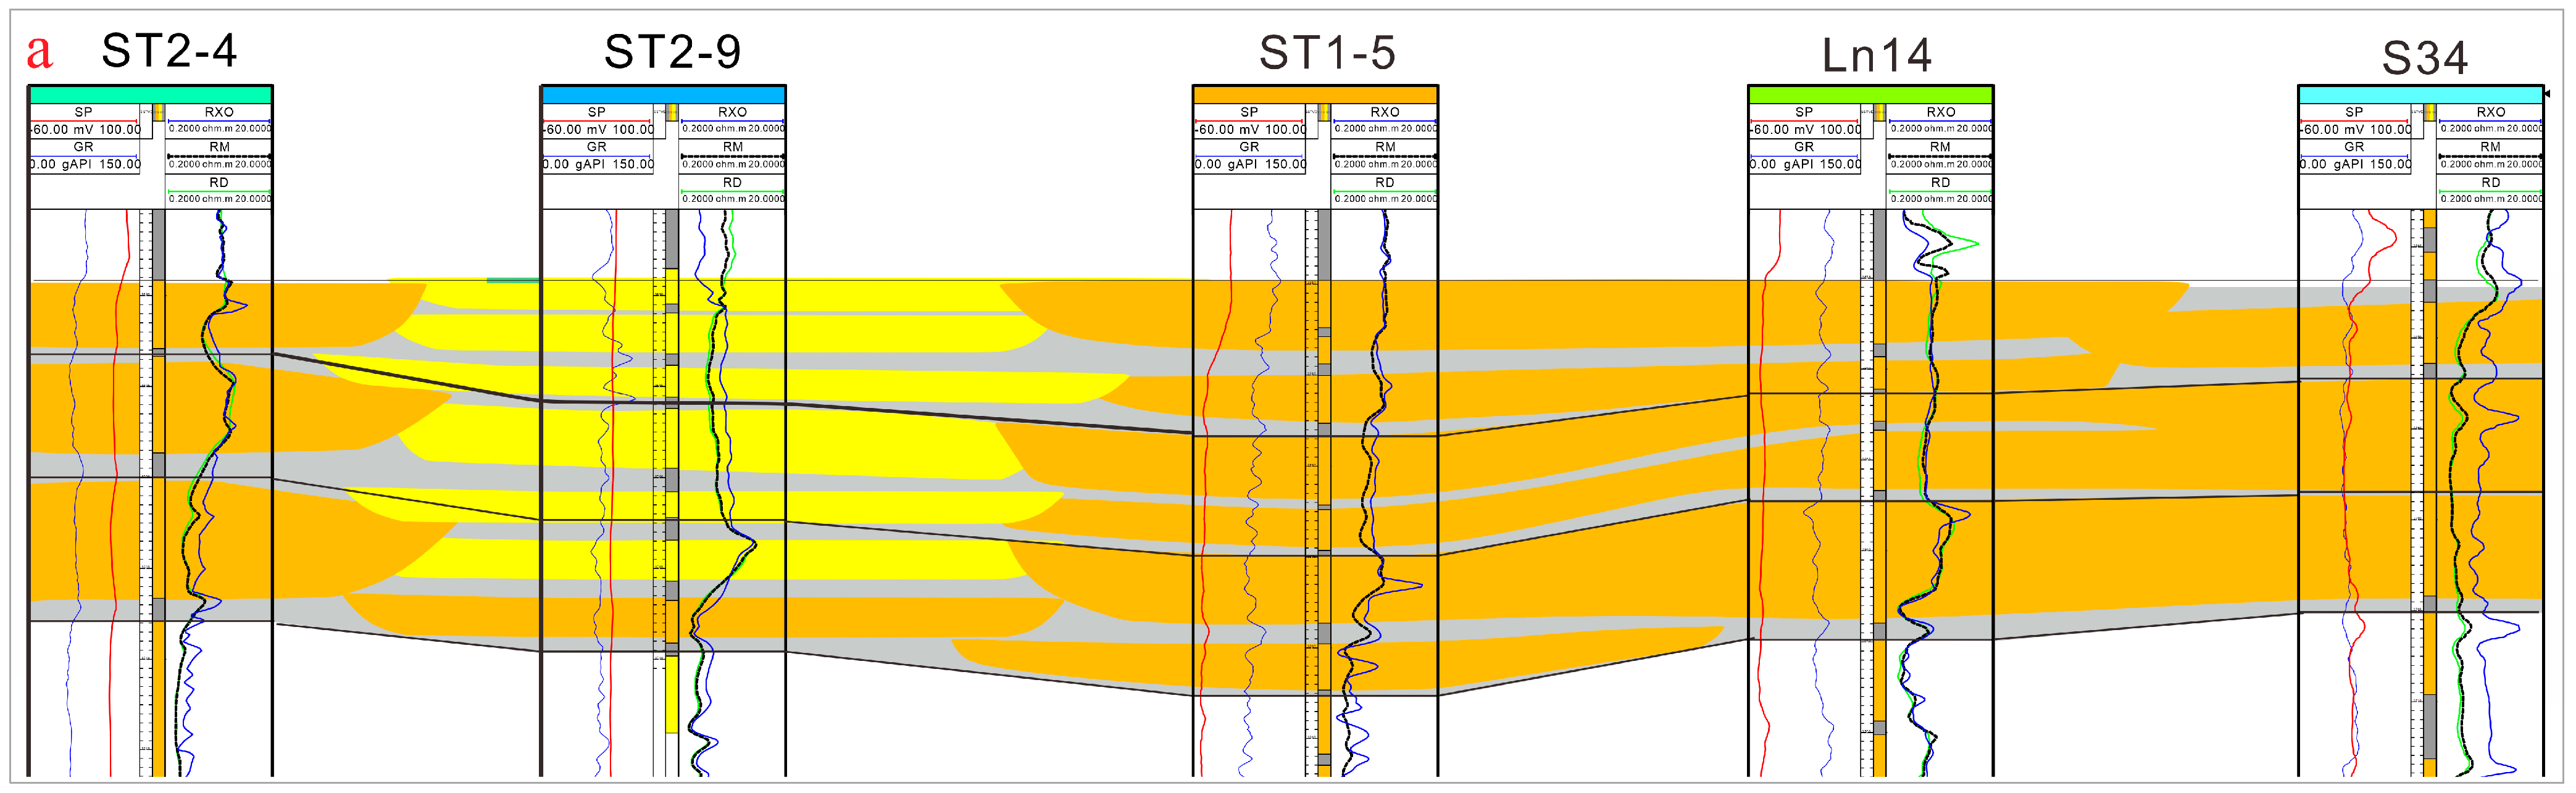
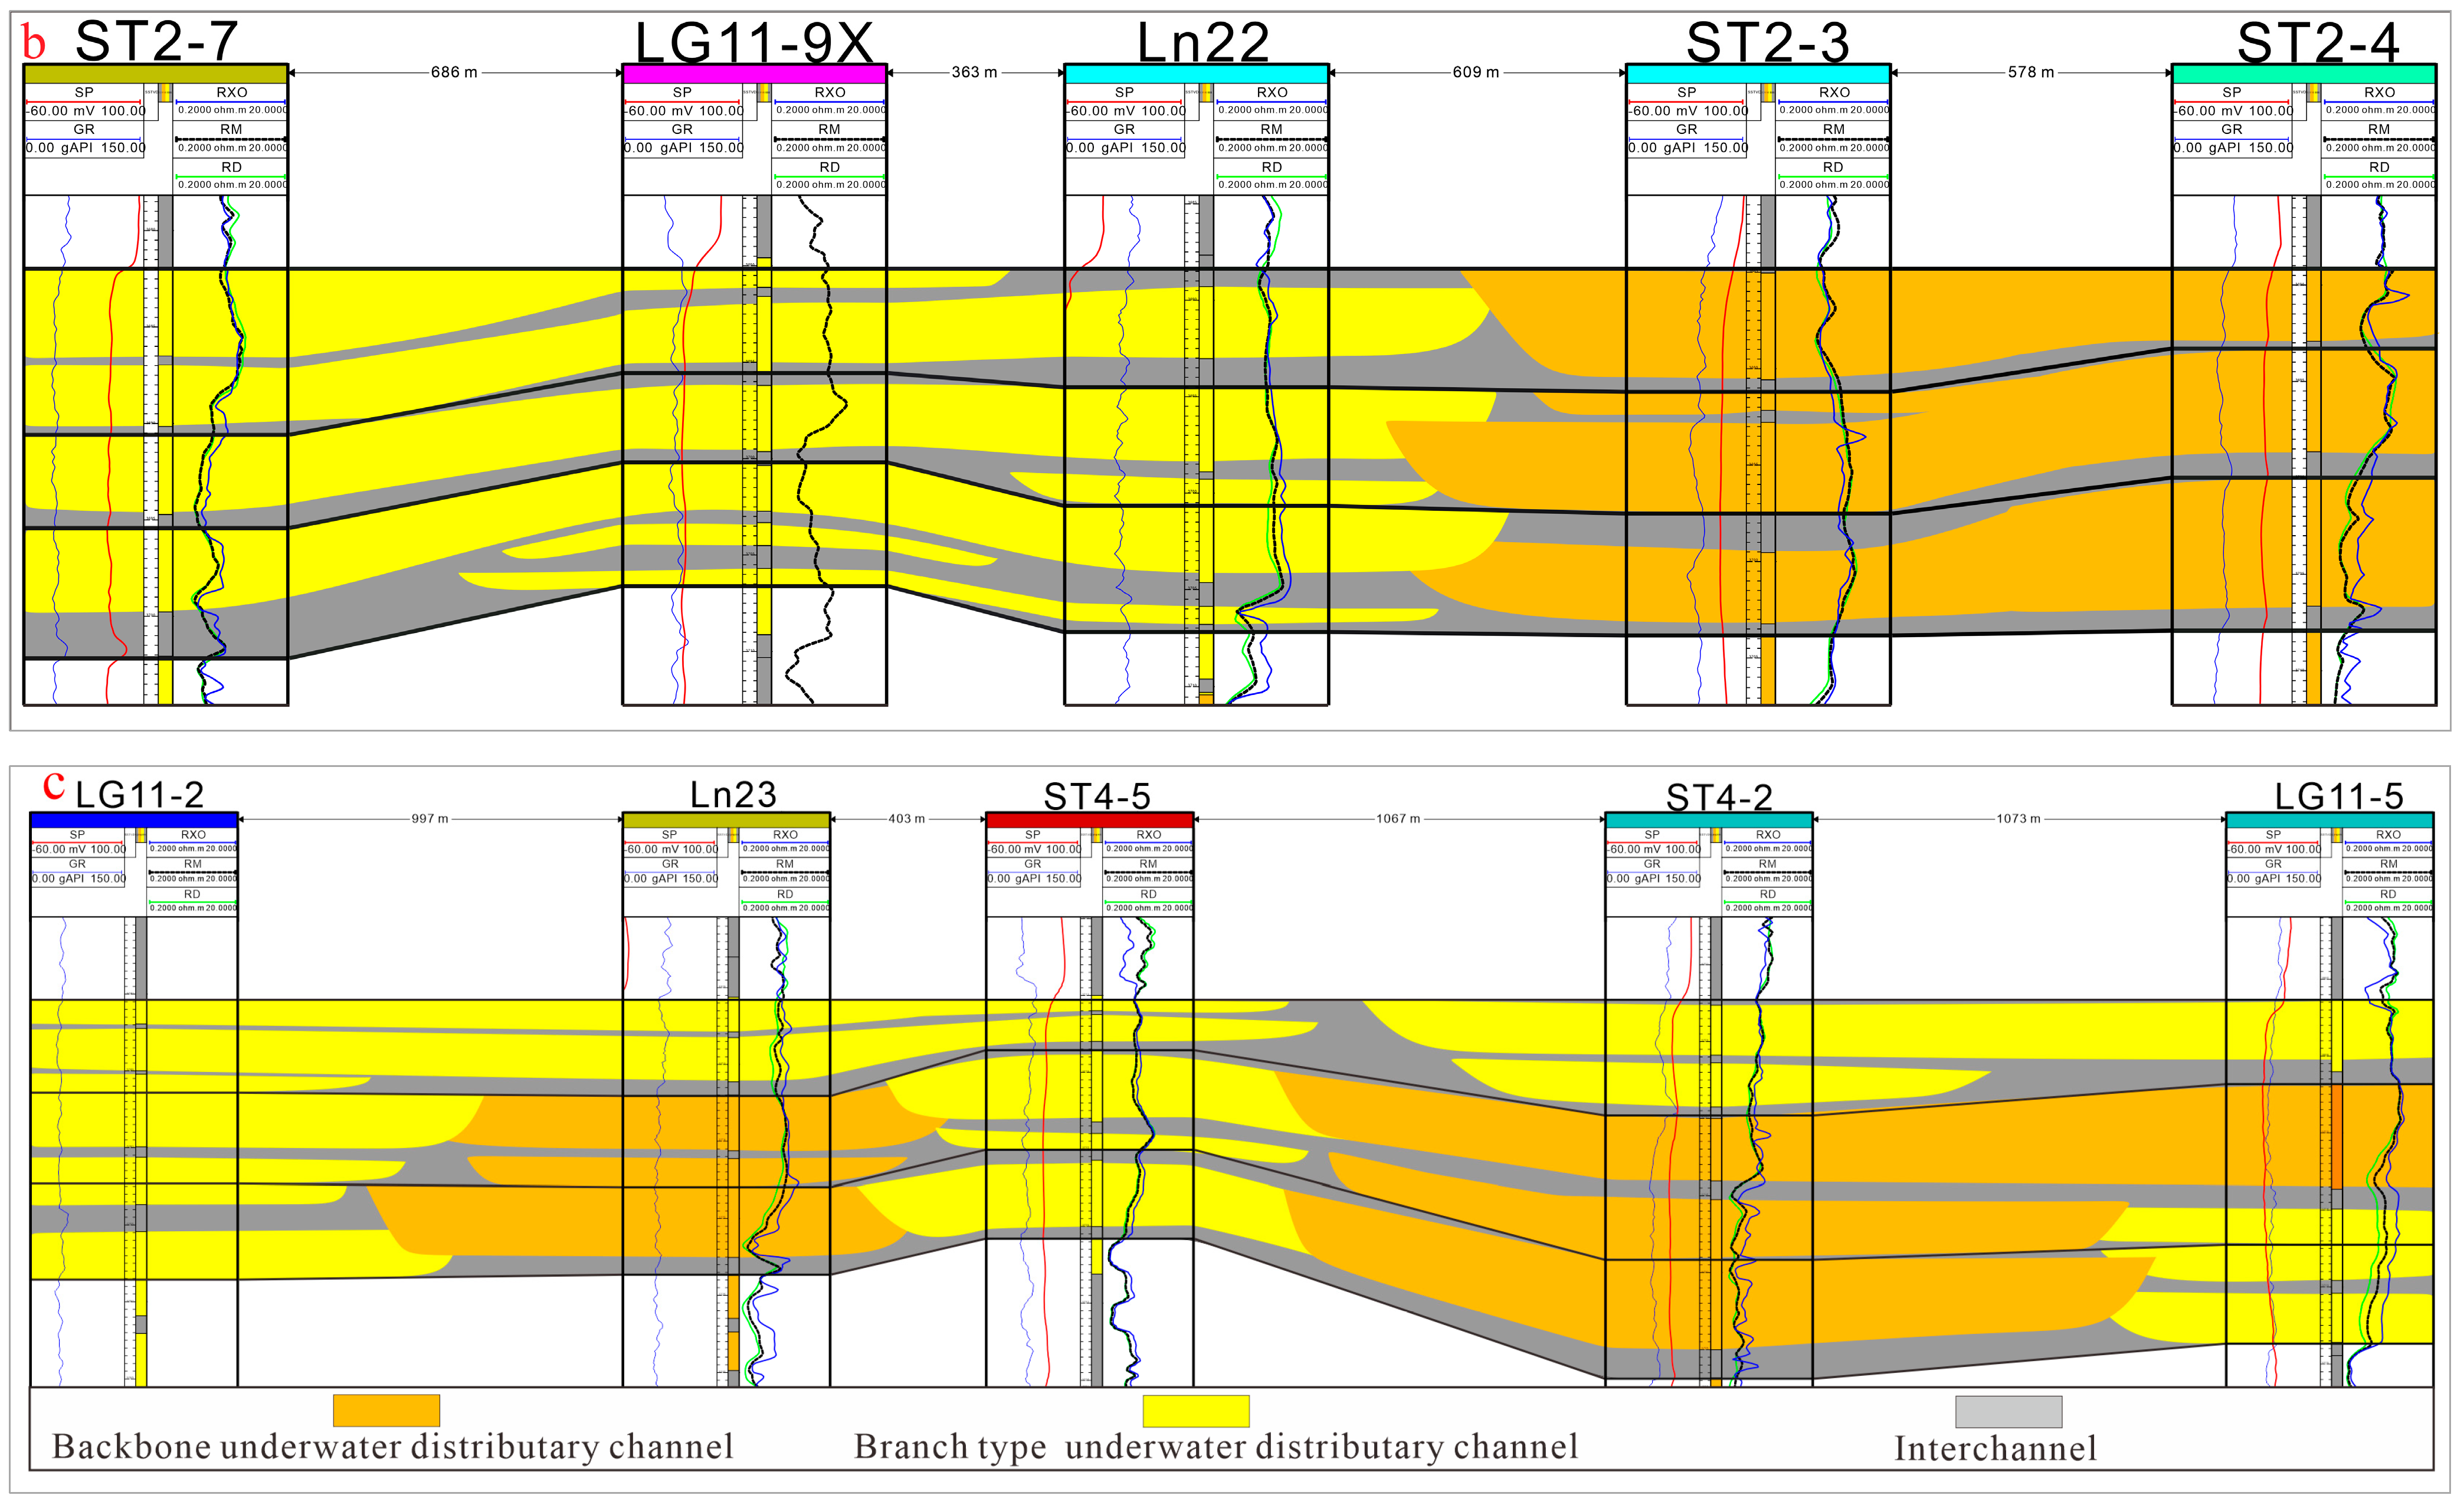
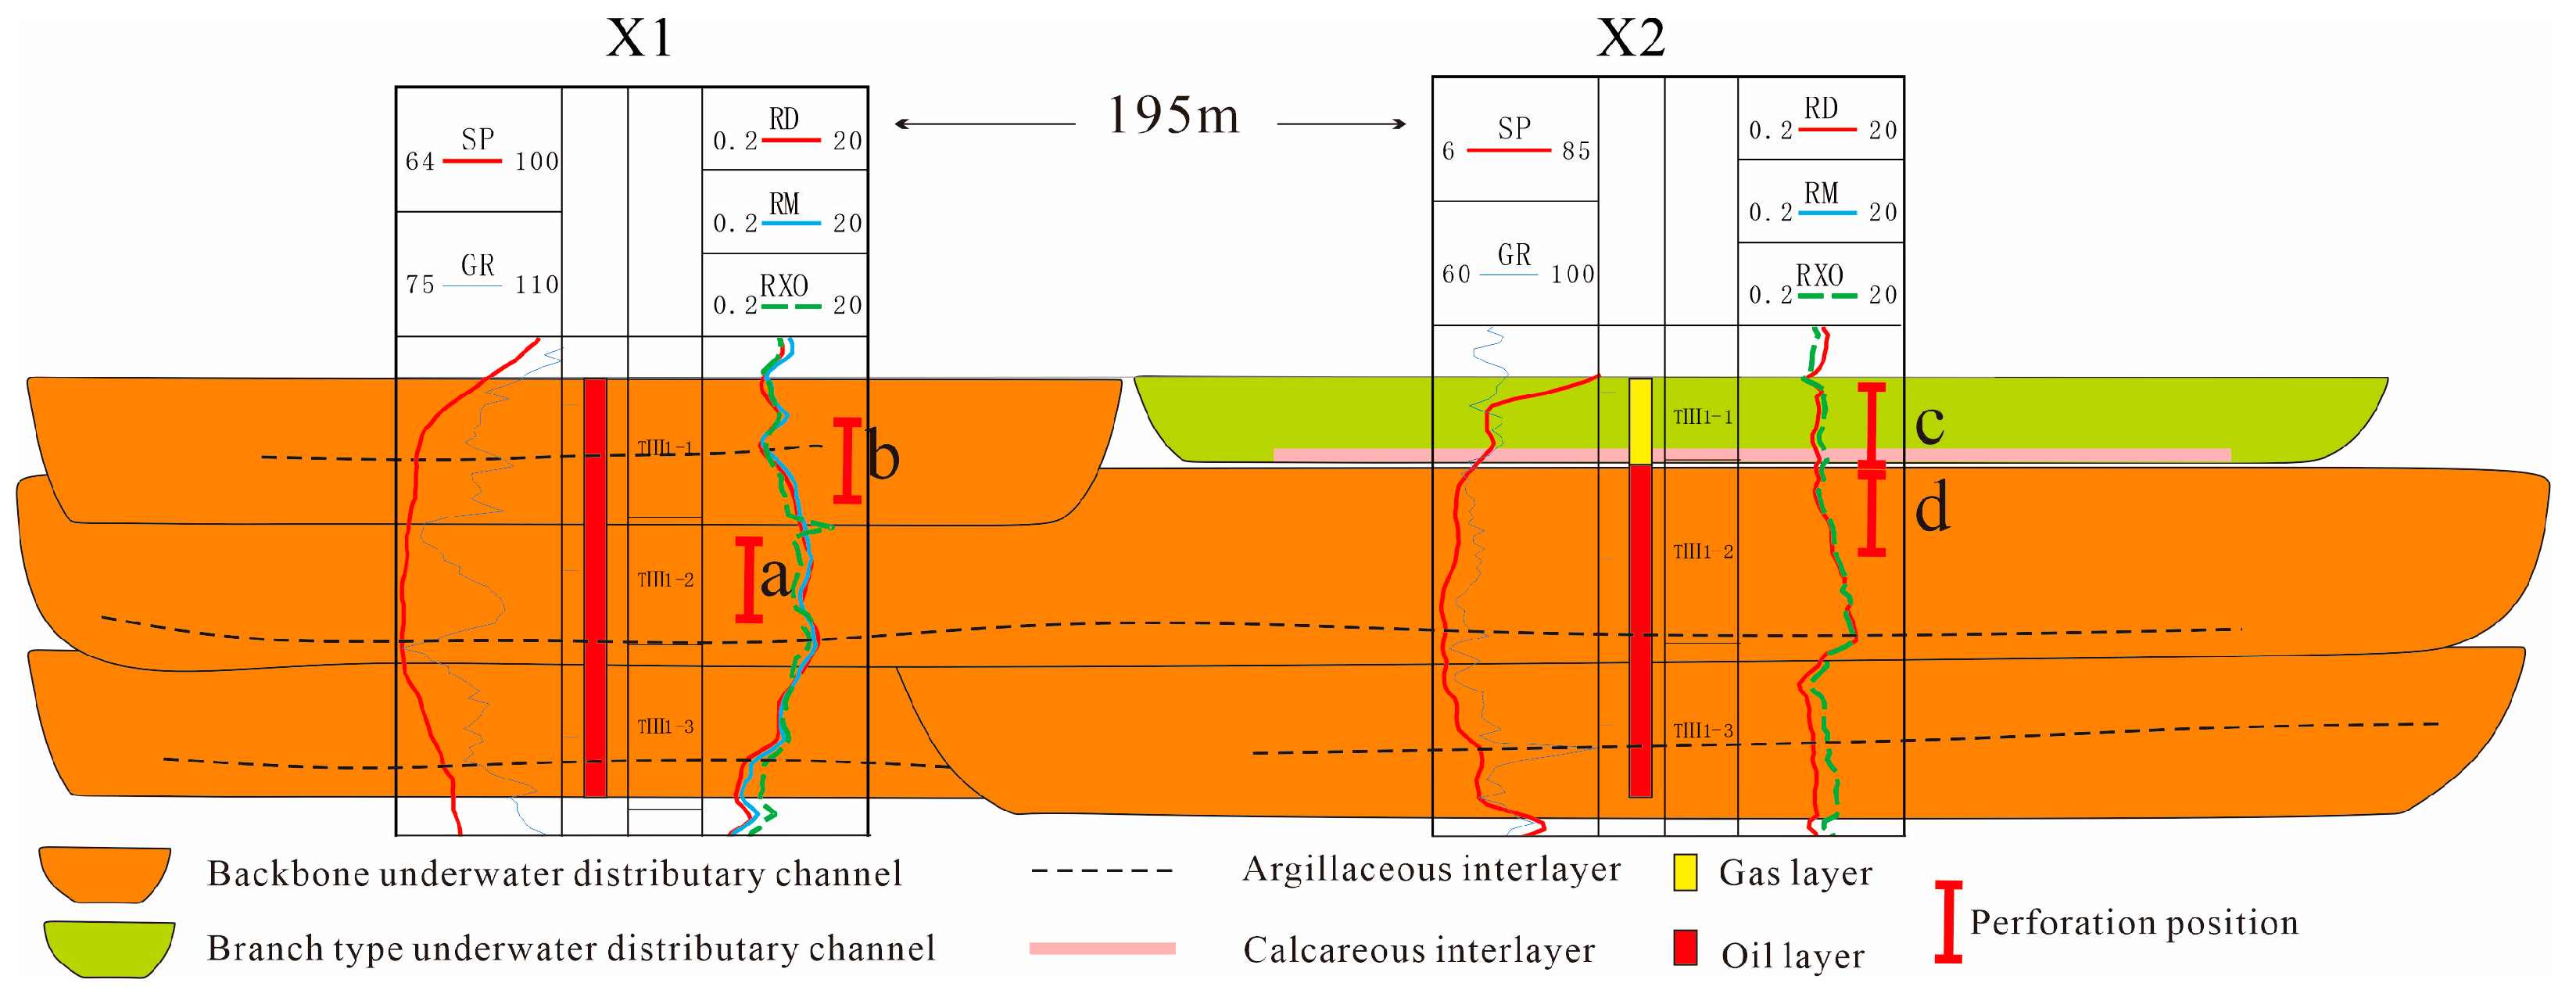
The scale of the channels gradually decreases vertically, due to the weakening of hydrodynamic forces. The backbone underwater distributary channels are mainly developed in the TIII1-3 sublayer, while the branch-type underwater distributary channels are mainly found in the TIII1-1 sublayer. Multiple channel sand bodies overlap in space, forming thick, plate-like sandstone bodies.
(3)
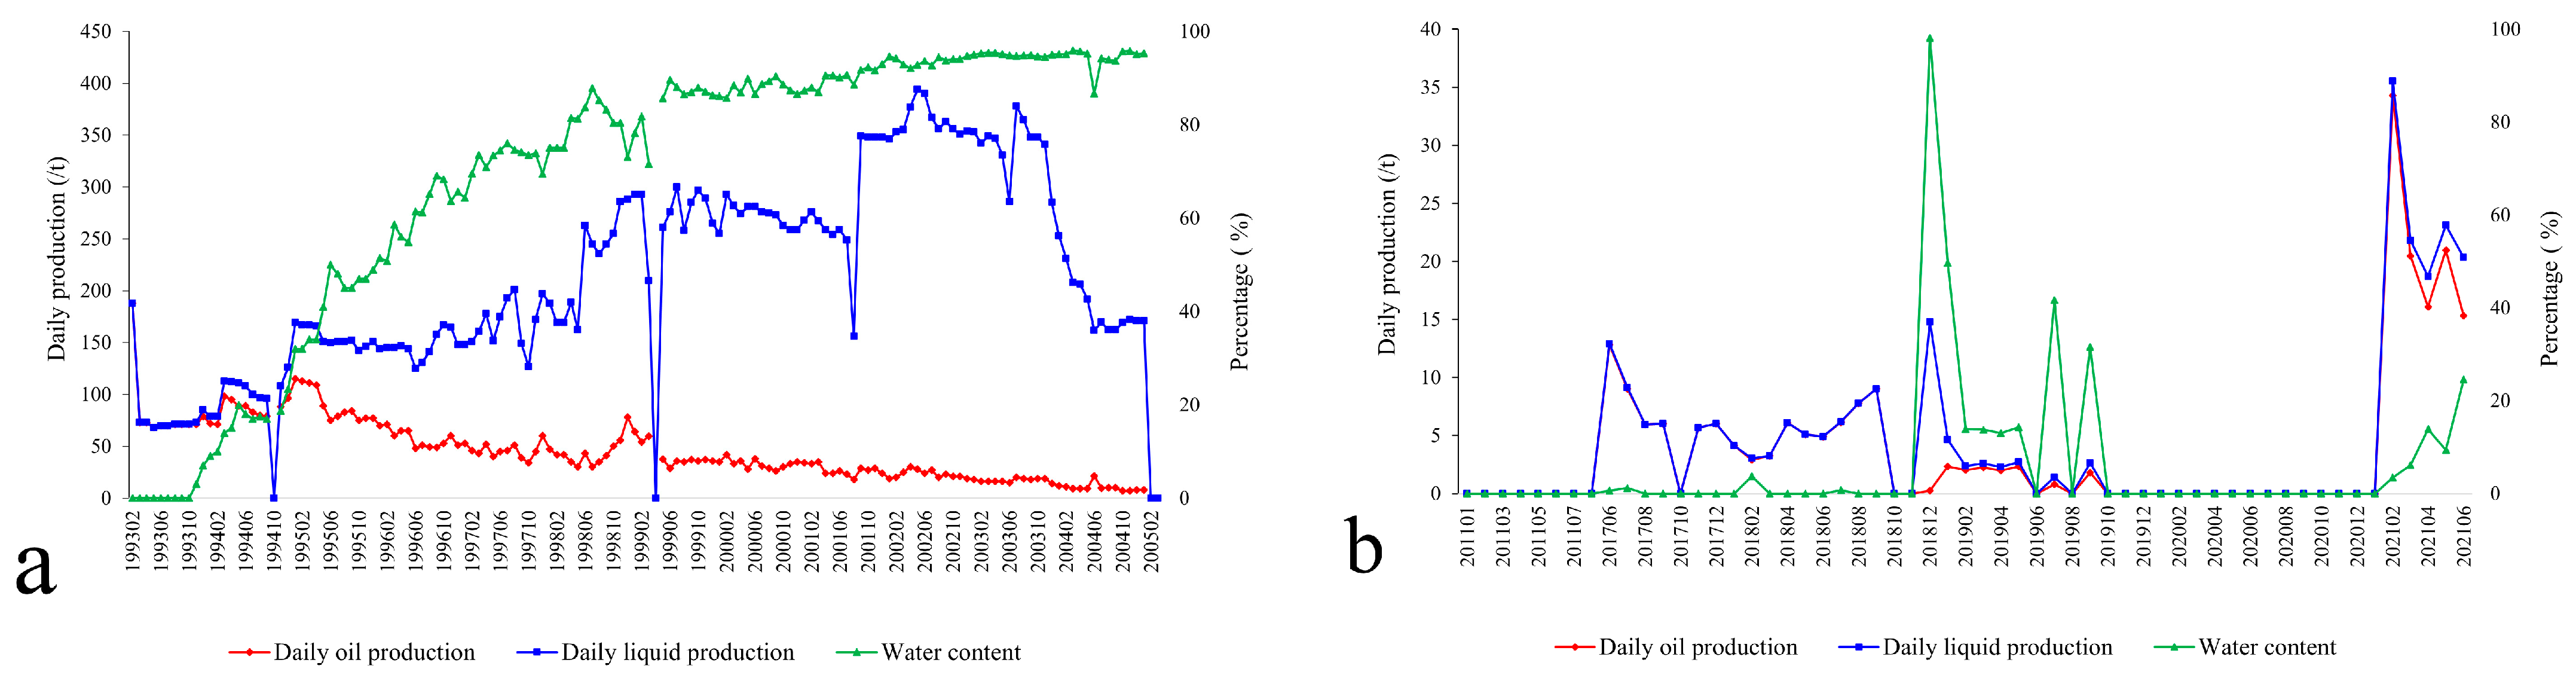
There are various seepage boundaries within thick stacked sand bodies, which control the movement of fluid, and further control the distribution of residual fluid. Through detailed configuration interpretation, that is, identifying configuration interfaces and analyzing the production performance of different wells, we can provide a reasonable prediction of the distribution of remaining oil and gas.

Author Contributions

Conceptualization, X.W. and D.L. (Dawang Liu); Methodology, C.Y., Z.Z., S.L., X.W. and D.L. (Dawang Liu); Formal analysis, D.L. (Duanchuan Lv); Resources, C.W. and C.Y.; Data curation, Z.Z.; Writing—review & editing, X.W.; Visualization, D.L. (Duanchuan Lv); Supervision, S.L.; Project administration, C.W.; Funding acquisition, Z.Z. All authors have read and agreed to the published version of the manuscript.

Funding

This work was supported by the Open Fund of Cooperative Innovation Center of Unconventional Oil and Gas, Yangtze University (Ministry of Education & Hubei Province) No. UOG2022-12, CNPC Innovation Foundation (2021DQ02-0106), and the Key Laboratory of Petroleum Resources Research, Gansu Province.

Data Availability Statement

All data can be obtained from the corresponding author.

Conflicts of Interest

The authors declare no conflict of interest.

References

  1. Du, W.; Chang, Q.; Zhang, R. Controlling factors of gas accumulation in Carboniferous Kalashayi Formation of Sangtamu area. Pet. Geol. Eng. 2017, 31, 9–12. [Google Scholar]
  2. Wang, X.; Liu, Y.; Hou, J.; Li, S.; Kang, Q.; Sun, S.; Ji, L.; Sun, J.; Ma, R. The relationship between synsedimentary fault activity and reservoir quality—A case study of the Ek1 formation in the Wang Guantun area, China. Interpretation 2020, 8, SM15–SM24. [Google Scholar] [CrossRef]
  3. Wang, X.; Yu, S.; Li, S.; Zhang, N. Two parameter optimization methods of multi-point geostatistics. J. Pet. Sci. Eng. 2022, 208, 109724. [Google Scholar] [CrossRef]
  4. Lv, G.; Li, Q.; Wang, S.; Li, X. Key techniques of reservoir engineering and injection–production process for CO2 flooding in China’s SINOPEC Shengli Oilfield. J. CO2 Util. 2015, 11, 31–40. [Google Scholar] [CrossRef]
  5. Wang, X.; Zhang, F.; Li, S.; Dou, L.; Liu, Y.; Ren, X.; Chen, D.; Zhao, W. The Architectural Surfaces Characteristics of Sandy Braided River Reservoirs, Case Study in Gudong Oil Field, China. Geofluids 2021, 2021, 8821711. [Google Scholar] [CrossRef]
  6. Goleby, B.R.; Blewett, R.S.; Fomin, T.; Fishwick, S.; Reading, A.M.; Henson, P.A.; Kennett, B.L.; Champion, D.C.; Jones, L.; Drummond, B.J.; et al. An integrated multi-scale 3D seismic model of the Archaean Yilgarn Craton, Australia. Tectonophysics 2006, 420, 75–90. [Google Scholar] [CrossRef]
  7. Jin, Z.K.; Yang, Y.X.; Shang, J.L.; Wang, L. Sandbody Architecture and Quantitative Parameters of Single Channel Sandbodies of Braided River:Cases from Outcrops of Braided River in Fukang, Liulin and Yanan Areas. Nat. Gas Geosci. 2014, 25, 311–317. [Google Scholar]
  8. Billy, J.; Robin, N.; Hein, C.J.; Certain, R.; FitzGerald, D.M. Internal architecture of mixed sand-and-gravel beach ridges: Miquelon-Langlade Barrier, NW Atlantic. Mar. Geol. 2014, 357, 53–71. [Google Scholar] [CrossRef] [Green Version]
  9. Abdel-Fattah, Z.A. Fluvial architecture of the Upper Cretaceous Nubia Sandstones: An ancient example of sandy braided rivers in central Eastern Desert, Egypt. Sediment. Geol. 2021, 420, 105923. [Google Scholar] [CrossRef]
  10. Ma, S.; Sun, Y.; Fan, G. The Method for Studying Thin Interbed Architecture of Burial Meandering Channel Sandbody. Acta Sedimentol. Sin. 2008, 26, 632–639. [Google Scholar]
  11. Wang, Y.; Chen, S. Meandering River sand body architecture and heterogeneity: A case study of Permian meandering river outcrop in Palougou, Baode, Shanxi Province. Pet. Explor. Dev. 2016, 43, 230–240. [Google Scholar] [CrossRef]
  12. Eggenhuisen, J.T.; McCaffrey, W.D.; Haughton, P.D.; Butler, R.W.; Moore, I.; Jarvie, A.; Hakes, W.G. Reconstructing large-scale remobilization of deep-water deposits and its impact on sand-body architecture from cored wells: The Lower Cretaceous Britannia Sandstone Formation, UK North Sea. Mar. Pet. Geol. 2010, 27, 1595–1615. [Google Scholar] [CrossRef]
  13. Feng, L.; Lu, Y.C.; Wellner, J.S.; Liu, J.S.; Liu, X.F.; Li, X.Q.; Zhang, J.Y. Fluvial morphology and reservoir sand-body architecture in lacustrine rift basins with axial and lateral sediment supplies: Oligocene fluvial-lacustrine succession in the Xihu sag, East China Sea Shelf Basin. Aust. J. Earth Sci. 2020, 67, 279–304. [Google Scholar] [CrossRef]
  14. Xu, Z.; Wu, S.; Zhao, L.; Zhu, J.; G, H.; Wu, J.; Zhang, T.; Li, Z. Sandbody architecture of the bar finger within shoal water delta front: Insights from the Lower Member of Minghuazhen Formation, Neogene, Bohai BZ25 Oilfield, Bohai Bay Basin, East China. Pet. Explor. Dev. 2019, 46, 133–144. [Google Scholar] [CrossRef]
  15. Yue, D.; Wu, S.; Liu, J. An accurate method for anatomizing architecture of subsurface reservoir in point bar of meandering river. Acta Pet. Sin. 2007, 28, 99–103. [Google Scholar] [CrossRef]
  16. Yin, S.L.; Wu, Y.X.; Zhu, B.Y.; Cheng, L.L.; Zhao, J.W.; Chen, W.C. Reservoir Superposed Pattern Characterization of well-Logging and Seismic Data Calibration with Meandering Channels: A Case Study of Jurassic Toutunhe Formation in Fudong No.5 Well Area, Eastern Junggar Basin. Earth Sci. 2022, 47, 4060–4074. [Google Scholar] [CrossRef]
  17. Qin, X.F.; Qi, R.; Li, W.; Chen, X.M. Braided channel architecture analysis and semi-quantitative seismic prediction for channel bars in P1x1 of the Hangjinqi area, Ordos basin, China. Geophys. Prospect. Pet. 2022, 58, 572–579. [Google Scholar]
  18. Santos, R.D.; Bastos, A.C.; Quaresma, V. Sedimentological signatures of river-shelf processes in a wave-dominated delta front. J. S. Am. Earth Sci. 2022, 115, 103761. [Google Scholar] [CrossRef]
  19. Zhu, G.; Zhang, Z.; Zhou, X.; Li, T.; Han, J.; Sun, C. The complexity, secondary geochemical process, genetic mechanism and distribution prediction of deep marine oil and gas in the Tarim Basin, China. Earth-Sci. Rev. 2019, 198, 102930. [Google Scholar] [CrossRef]
  20. Hou, M.; Zhuang, G.; Ellwood, B.B.; Liu, X.L.; Wu, M. Enhanced precipitation in the Gulf of Mexico during the Eocene-Oligocene transition driven by interhemispherical temperature asymmetry. GSA Bull. 2022, 134, 2335–2344. [Google Scholar] [CrossRef]
  21. Chen, J.; Ma, K.; Pang, X.; Yang, H. Secondary migration of hydrocarbons in Ordovician carbonate reservoirs in the Lunnan area, Tarim Basin. J. Pet. Sci. Eng. 2020, 188, 106962. [Google Scholar] [CrossRef]
  22. Lv, D.; Wang, R.; Xixin, W.; Wang, C.; Zhu, Z.; Wang, K.; Hong, L.; Wu, X.; Sheng, J. Seepage Characterization Based on Sandstone Particle Motion Pattern: A Case Study of the TIII Reservoir in the Sangtamu Oilfield. Geofluids 2022, 2022, 2084431. [Google Scholar] [CrossRef]
  23. Wang, X.; Hou, J.; Li, S.; Dou, L.; Song, S.; Kang, Q.; Wang, D. Insight into the nanoscale pore structure of organic-rich shales in the Bakken Formation, USA. J. Pet. Sci. Eng. 2020, 191, 107182. [Google Scholar] [CrossRef]
  24. Wu, M.; Zhuang, G.; Hou, M.; Liu, Z. Expanded lacustrine sedimentation in the Qaidam Basin on the northern Tibetan Plateau: Manifestation of climatic wetting during the Oligocene icehouse. Earth Planet. Sci. Lett. 2021, 565, 116935. [Google Scholar] [CrossRef]
  25. He, J.; Han, J.; Pan, W. Hydrocarbon accumulation mechanism in the giant buried hill of Ordovician in Lunnan paleohigh of Tarim Basin. Acta Pet. Sin. 2007, 28, 44–48. [Google Scholar] [CrossRef]
  26. Neil, E.A.; Houseman, G.A. Geodynamics of the Tarim Basin and the Tian Shan in central Asia. Tectonics 1997, 16, 571–584. [Google Scholar] [CrossRef]
  27. He, D.; Jia, C.; Liu, S.; Pan, W.; Wang, S. Dynamics for multistage pool formation of Lunnan low uplift in Tarim Basin. Chin. Sci. Bull. 2002, 47, 128–138. [Google Scholar] [CrossRef]
  28. Zhuang, G.; Zhang, Y.G.; Hourigan, J.; Ritts, B.; Hren, M.; Hou, M.; Wu, M.; Kim, B. Microbial and geochronologic constraints on the Neogene paleotopography of northern Tibetan Plateau. Geophys. Res. Lett. 2019, 46, 1312–1319. [Google Scholar] [CrossRef]
  29. Zhu, G.; Zhang, S.; Su, J.; Zhang, B.; Yang, H.; Zhu, Y.; Gu, L. Alteration and multi-stage accumulation of oil and gas in the Ordovician of the Tabei Uplift, Tarim Basin, NW China: Implications for genetic origin of the diverse hydrocarbons. Mar. Pet. Geol. 2013, 46, 234–250. [Google Scholar] [CrossRef]
  30. Wu, M.; Zhuang, G.; Hou, M.; Miao, Y. Ecologic shift and aridiffcation in the northern Tibetan Plateau revealed by leaf wax n-alkane δ2H and δ13C records. Palaeogeogr. Palaeoclimatol. Palaeoecol. 2019, 514, 464–473. [Google Scholar] [CrossRef]
  31. Wang, X.; Zhou, X.; Li, S.; Zhang, N.; Ji, L.; Lu, H. Mechanism Study of Hydrocarbon Differential Distribution Controlled by the Activity of Growing Faults in Faulted Basins: Case Study of Paleogene in the Wang Guantun Area, Bohai Bay Basin, China. Lithosphere 2022, 2021, 7115985. [Google Scholar] [CrossRef]
  32. Liu, Y. Research on Sedimentary Facies of Triassic Reservoirs in Lunnan and Its Peripheral Areas, Tarim Basin. Master’s Thesis, China University of Petroleum (East China), Dongying, China, 2019. [Google Scholar]
  33. Kang, Q.; Hou, J.; Liu, L.; Hou, M.; Liu, Y. Quantitative Prediction of Braided Sandbodies Based on Probability Fusion and Multi-Point Geostatistics. Energies 2023, 16, 2796. [Google Scholar] [CrossRef]
  34. Hou, M.; Xiao, Y.; Lei, Z.; Yang, Z.; Lou, Y.; Liu, Y. Machine Learning Algorithms for Lithofacies Classiffcation of the Gulong Shale from the Songliao Basin, China. Energies 2023, 16, 2581. [Google Scholar] [CrossRef]
  35. Van Heerden, I.L.; Roberts, H.H. Facies development of Atchafalaya Delta, Louisiana: A modern bayhead delta. AAPG Bull. 1988, 72, 439–453. [Google Scholar] [CrossRef]
  36. Qiu, L.; Yang, B.; Zheng, S. Lake level effect on main sandbodies of delta front: A case study from outcrops of the Jurassic Yan’an Formation in Shenmu area, Ordos Basin. J. Paleogeogr. 2016, 18, 939–950. [Google Scholar]
Figure 1. Geographic location distribution of the Sangtamu oilfield. (a) Geographical location of Tarim Basin; (b) Structural Map of Tarim Basin; (c) Wells location of Sangtamu oilfield.
Energies 16 03454 g001
Figure 2. Comprehensive stratigraphic column of the Sangtamu oilfield.
Energies 16 03454 g002
Figure 3. Core pictures of TIII1 sand group in Sangtamu Oilfield. (a) Well LN22, 4636.8 m; (b) Well JF121, 4675.7 m; (c) Well LN39, 4728.1 m; (d) Well LN44, 4774.4 m; (e) Well LN23, 4653.2 m; (f) Well JF124, 4748.5 m; (g) Well LN14, 4615.5 m; (h) Well LN39, 4718.8 m; (i) Well JF122, 4643.3 m; (j) Well JF121, 4663.2 m; (k) Well JF121, 4680.1 m; (l) Well JF124, 4750 m.
Energies 16 03454 g003
Figure 4. The vertical sequence in Sangtamu area ((a) well LN22; (b) well ST2-8J).
Energies 16 03454 g004
Figure 5. Sedimentary architecture model of Achafalaya Braided River delta.
Energies 16 03454 g005
Figure 6. Architecture model of underwater distributary channel of braided river delta front in Shenmu area, Ordos Basin, China.
Energies 16 03454 g006
Figure 7. Single well architecture interpretation in the Sangtamu oilfield ((a) well LN22, (b) well ST2-8J).
Energies 16 03454 g007
Figure 8. Profile of well-tie architecture in the Sangtamu oilfield (profile position shown in Figure 1c) ((a) section a; (b) section b; (c) section c).
Energies 16 03454 g008aEnergies 16 03454 g008b
Figure 9. Architecture plan of TIII1 in the Sangtamu Oilfield. (a) TIII1-1; (b) TIII1-2; (c) TIII1-3.
Energies 16 03454 g009aEnergies 16 03454 g009bEnergies 16 03454 g009c
Figure 10. Production curve of wells X1 and X2 in the Sangtamu oilfield. (a) Wel X1. (b) Well X2.
Energies 16 03454 g010
Figure 11. Architecture profile of wells X1 and X2 in the Sangtamu oilfield: a, b, c and d refer to the perforation position.
Energies 16 03454 g011
Table 1. Logging architecture model of TIII in the Sangtamu oilfield.
ArchitectureParticle Size and SortingSedimentary StructureTypical Logging Curve
Backbone underwater distributary channelMedium coarse sand, containing gravel, sub round, medium sortingTrough cross bedding, parallel bedding, massive bedding, large scour filling structureEnergies 16 03454 i001
Branch type underwater distributary channelMedium fine sand, sub round, medium sortingSmall plate cross bedding, trough cross beddingEnergies 16 03454 i002
InterchannelSilt, argillaceous, well sortedHorizontal bedding, homogeneous beddingEnergies 16 03454 i003
Disclaimer/Publisher’s Note: The statements, opinions and data contained in all publications are solely those of the individual author(s) and contributor(s) and not of MDPI and/or the editor(s). MDPI and/or the editor(s) disclaim responsibility for any injury to people or property resulting from any ideas, methods, instructions or products referred to in the content.

