Article

Advanced Exergoeconomic Assessment of CO2 Emissions, Geo-Fluid and Electricity in Dual Loop Geothermal Power Plant

by
Onur Vahip Güler
1,
Emine Yağız Gürbüz
1,
Aleksandar G. Georgiev
2,* and
Ali Keçebaş
1
1
Department of Energy Systems Engineering, Muğla Sıtkı Koçman University, 48000 Muğla, Turkey
2
Department of General Engineering, University of Telecommunications and Posts, 1 Akad. Stefan Mladenov Str., 1700 Sofia, Bulgaria
*
Author to whom correspondence should be addressed.
Energies 2023, 16(8), 3466; https://doi.org/10.3390/en16083466
Submission received: 16 March 2023 / Revised: 3 April 2023 / Accepted: 13 April 2023 / Published: 15 April 2023
(This article belongs to the Special Issue Shallow Geothermal Energy 2023)

Abstract

:
Binary geothermal power plants (GPPs) are mostly encountered in geothermal fields with medium and low temperatures. The design and operation of dual binary GPPs can be difficult due to the geothermal fluid properties. This affects their performance and feasibility. Thermoeconomics are essential elements for the design and operation of the GPPs. In this study, advanced exergoeconomic analysis is applied to a true dual binary GPP (as a case study) to further evaluate it from performance and economic perspectives. In analysis, the specific exergy cost (SPECO) method is used. Then, some specific indicators are presented to evaluate the performance and economics of the GPP. Thus, technical and economic solutions have been developed in the design and operation stages through the analysis. The results of the study indicated that the total operating cost of 1218 USD/h could be reduced to 186 USD/h by improving the operating conditions. This corresponds to an 85% decrease. The cost per electricity generated, cost per geothermal energy input, and cost per CO2 emission of the GPP are determined as 0.049 USD/kWh, 5.3 USD/GJ, and 0.13 USD/kg, respectively. As a result, while the savings potential of the GPP is 15%, it can result in a 15% reduction in CO2 emission cost.

1. Introduction

Today, the design of efficient energy conversion systems and non-design technology development demands force energy engineers to carry out more research and development. Especially in countries with geothermal energy, it is extremely important to develop more accurate and systematic approaches to develop geothermal power plants (GPPs), due to the harmful effects of fossil-based systems on the environment, their ability to meet global demands in response to increasing energy needs, and their complex designs. The most suitable GPP in low- and medium-temperature geothermal areas (temperature lower than 150 °C) is the binary GPP, using both geothermal fluid and working fluid (pentane, 134a, etc.). Nowadays, GPPs have emerged as a promising development due to their simple layout (organic Rankine cycle, ORC), higher efficiency, and packed equipment size to generate electricity from sources at low temperatures [1]. On the one hand, evaluation of GPPs, which has attracted a lot of attention in the world, is extremely important before production from the thermodynamic and economic point of view during the project design phase. On the other hand, in existing power plants (PPs), these analyses directly affect the performance of the PP, ease of operation, and costs, and, therefore, the amount of electricity produced.
Considering both high efficiency and low cost, the design of binary GPPs is a constant challenge for engineers. Because of the increased energy need and environmental influences, it has become critical to enhance more definite and systematic approaches to improve the design and off-design of systems. In all binary GPP projects, thermodynamic analysis has proven to be a meaningful and accurate method [1,2].
Thermodynamic analysis, which primarily expresses the conservation of energy principle, concerns the first law of thermodynamics. Thermodynamic losses in a system are not completely determined, and it is difficult to evaluate them with energy analysis. However, exergy analysis can identify the location, magnitude, and effects of irreversibilities present in the system [2]. This concept has also been extended to an approach commonly known today as exergoeconomic analysis (ExEcon). ExEcon analysis combines the concept of exergy with economic principles to describe the flow of investment and operating costs in a thermodynamic system. Over the years, such traditional exergy-based analyses (TradEx) have been comprehensively addressed and applied to GPPs. Many authors examined the thermodynamic and economic performance of GPPs based on the analysis of TradEx (e.g., [3,4,5]) and TradExEcon (e.g., [6,7,8,9]).
Binary GPP can play an important role in the future decarbonization of the energy sector and, therefore, the global energy system. Moreover, due the results associated with the energy sector and highly efficient GPP systems in significantly reducing greenhouse gas emissions, their adoption need to be encouraged. Such a goal can be accomplished by applying advanced exergy (AdvEx) analysis methods [10]. In fact, unlike TradEx analysis methods, the application of AdvEx analysis methods can illuminate the real thermodynamic strengthening potential of the system under study and the interactions between its components. Thus, the exergy destruction of the system and its components is formed from the endogenous part caused by a component itself, the exogenous part which is the effect of another component on a component, and the preventable and inevitable parts that occur due to the limited technical and economic conditions [11]. However, this method is built on the TradEx analysis method. In the literature, there are many studies in which AdvEx analysis applied to GPPs, e.g., [1,2,12,13]. The quantity and quality of the studies including AdvEx analysis for GPPs is a situation that justifies its wide acceptance and the level of interest.
Advanced exergoeconomic (AdvExEcon) analysis provides what is possible in the traditional exergoeconomic (TradExEcon) method as well as destructions in one component due to its interactions with other components, beyond the real characterization of lost exergy and associated costs that can be avoided by optimization efforts [14]. The focus of the study focuses on the AdvExEcon method. Therefore, this method can only be used after applying the TradEx, TradEcon, TradExEcon, and AdvEx methods to any energy conversion system. Most of the researchers applied the AdvExEcon analysis to many energy conversion systems. Tsatsaronis and Park [15] claimed that of the AdvExEcon analysis of a thermal system exergy destruction and investment cost of components must be divided into avoidable and unavoidable sections. Therefore, it was much easier to perform AdvExEcon analysis of the components and this situation allowed the system to develop in the right way. Wei et al. [16] analyzed the avoidable exergy destruction and investment cost of a distillation system. To determine the cost of exergy destruction and investment, inevitable values under minimum theoretical conditions were used. As a result of the analysis, they found different exergy saving potential values for the components in the system. AdvExEcon analysis applied to the system proved that more accurate values are obtained compared to the TradExEcon analysis. Vuckovic et al. [17] applied AdvExEcon analysis for an industrial facility. The cost, maintenance, and operating costs for the components found in the facility were based on a 4000-hour period per year. As a result of the analysis, a different improvement potential was determined for each component. Although the improvement potential of 7.66% for the steam boiler was low as a percentage, it had a value of 983.84 kW. Likewise, although circulation pumps had the potential for an improvement of more than 70%, it had been found to be a small value of 1.46 kW as an absolute value (Circulation Pump 1). Manesh et al. [18] examined a cogeneration system in the Iranian LNG plant, with a new procedure using both TradEx and AdvEx analysis. This method is based on the development of the R-curve concept of estimating costs, environmental impacts, exogenous economic, and environmental parameters. Petrakopoulou et al. [19] applied an AdvExEcon analysis to a complex combined cycle PP capable of capturing CO2. The PP included a chemical cycle combustion unit selected as one of the most promising oxy-combustion technologies that make the CO2 capture process easier in terms of efficiency, economic feasibility, and environmental footprint. The biggest avoidable costs representing the improvement potential were the components that make up the main gas turbine system. The most decisive components, based on total avoidable cost, were the reactor, expander, and compressor. Keçebaş and Hepbaşlı [20] carried out TradExEcon and AdvExEcon analyses of the geothermal district heating system (GDHS) in Afyon, Turkey. The authors used data collected under real operating conditions. When performing the analysis, they evaluated each component by linking endogenous/exogenous and available/unavailable segments to exergy destruction and investment costs. While the TradExEcon analysis was found to be 5.53%, the AdvExEcon analysis was obtained as 9.49%. Tan and Keçebaş [21] made a similar study of Sarayköy GDHS in Aydın, Turkey, to define its improvement potential, interactions between system components, and energy savings and potential, and they used ExEcon analysis. Açıkkalp et al. [22] applied the AdvExEcon analysis of a natural gas PP in the Eskişehir industrial zone. The exergy efficiency of the PP with a total installed power of 55 MW was 0.402, the total exergy destruction was found to be 78.242 MW, and the unit exergy cost was 25.660 USD/GJ. By performing the AdvEx and AdvExEcon analyses of the PP, it is seen that the combustion chamber and high-pressure steam turbine also had economic advance potential. Açıkkalp et al. [23] used an improved life cycle integrated economic analysis of a building heating system, and, thus, recent AdvEx criteria were proposed. Using this analysis and suggested indexes, the heating systems consultants provided the opportunity to examine any heating system in more depth. Liu et al. [24] carried out a comprehensive study with the AdvExEcon analysis of the supercritical CO2 recompression Brayton cycle. The turbine is the equipment with the highest improvement priority due to the maximum value of avoidable operating costs. Oyekale et al. [25] applied AdvExEcon analysis to a hybrid solar–biomass ORC cogeneration plant. They changed the costing approach to the auxiliary exergy in the analysis to reflect the effects of current energy quality in the study. Modified utility costing increased by approximately 17%, and the avoidable–intrinsic irreversibility cost ratios of the turbine and condenser for the hybrid plant decreased by 73%, respectively, compared to the TradExEcon approach. Wang et al. [26] performed the AdvExEcon analysis to assess the components of the cascade absorption heat transformer system and their exergy destruction-related costs. The results showed that only 21% of the exergy destruction rate could be prevented by improvement and investment cost, and 80% of the proportions were from the components themselves.
When we carefully screened the literature, although the existing studies mentioned above are applied, there is no AdvExEcon analysis study applied to GPPs. As emphasized by the above studies, many studies have been carried out, especially on traditional exergy and exergetic analyses, evaluating the thermodynamic and economic performances of a dual, air-cooled, and ORC GPP. However, to the best of the authors’ knowledge, the advanced exergoeconomic (AdvExEcon) evaluations have been applied mostly apply to energy conversion systems other than GPPs, according to the special exergy cost method. The design and operation of dual binary GPPs is dependent on the geothermal resource conditions. Therefore, the temperature, pressure, flow, and state of the geothermal fluid can differentiate the design of the GPPs. Thus, engineers are faced with design options, such as (i) the use of a recuperator to reduce condenser cooling load, (ii) the use of geothermal fluid steam, and (iii) the use of high- and low-pressure line turbines connected to the generator on the same shaft. These options make dual binary GPP more complex and costly. While binary GPPs compete in raw materials, technology, and know-how, the same is not the case with costs. For this reason, the AdvExEcon method has been applied to a real dual binary GPP, and it aims to fill the gap in the literature related to the AdvExEcon analysis applied to a dual binary GPP (Sinem GPP in Turkey is used as a case study). Here, the interactions between one other and the potential or improvement for the dual binary GPP and its components is evaluated from a thermodynamic and economic point of view. This study can guide design studies of GPPs with future improvement suggestions and operation–maintenance projections.
In the second part, the Sinem GPP is introduced thermodynamically, while in the third part, the proposed analysis methods to evaluate the thermodynamic and economic performances of the GPP and its equipment are mentioned. In the next section, the results of all analyses are provided comparatively from a thermodynamic and economic point of view. Finally, the performance to improvement of the system and components, the interaction between components, and directions and potentials for energy saving are discussed for some indicators.

2. Methodology

2.1. Description of the Plant

In this study, a real operated binary geothermal power plant (GPP; Sinem GPP), shown schematically in Figure 1, was chosen to perform the analysis of the advanced exergoeconomic (AdvExEcon) effects. The power plant is in Germencik/Aydin province in Turkey and can be operated at low temperatures (between 90 °C and 150 °C) with 24 MW installed power. As seen in Figure 1, due to the use of low-temperature geothermal fluid in the plant, a geothermal fluid (brine) and a refrigerant fluid are used, and it is, as such, called “binary”. The most important difference between the binary cycle and other cycles is that it can generate electricity at poor temperatures. However, a double pressure cycle is used to reduce thermodynamic losses caused by geothermal fluid in the evaporators. Therefore, binary GPPs have been designed in which two interconnected organic Rankine cycles (ORCs) (double pressure) are fed from a single geothermal fluid. Furthermore, turbines in two interconnected ORCs are connected to the generator through a single shaft. In addition to these, an air-cooled condenser was used in the GPP. The mentioned features of the Sinem GPP plotted in Figure 1 make it a complex system. Hence, for such a system and its components, the cost is a key issue. Actual operational data, i.e., temperatures, pressures, and volumetric flow rates of the Sinem GPP, were collected by the Central Supervisory Control and Data Acquisition (SCADA) program in 2020. In this context, average data was used throughout 2020 for the advanced exergoeconomic (AdvExEcon) analysis.
Yearly average data are indexed in Table 1 according to the line/state numbers stated in Figure 1. In the reference (dead) state condition, the temperature and pressure are assumed to be 18 °C and 1 atm, respectively. In the plant, the artesian geothermal fluid obtained from the production wells is separated into two phases as steam (saturated steam) and brine (saturated liquid) from the vertical separator at the wellhead (not shown in Figure 1). When Figure 1 and Table 1 are examined, the steam state at 165 °C temperature and 8.33 kg/s flow rate (line 1′) and the liquid state at 165 °C and 445 kg/s (line 1) are obtained for 1040 kPa high pressure from the separators. The liquid geothermal fluid is initially pressed into the VAP 1 in the high-pressure line, thereby heating n-pentane. The geothermal fluid, whose duty is completed, reaches the VAP 2 in the low-pressure line at 136 °C and 730 kPa (line 2), and n-pentane is again heated. In addition, steam geothermal fluid is supplied to VAP 2. After VAP 2 (line 3), to preheat n-pentane, the liquid geothermal fluid is sent to the preheaters (PRE-HEs 1 and 2) (lines 4 and 5). Some of the rotten steam is stored as NCG (line 10) and the rest is re-injected into the reinjection well by condensing at 85 °C and 590 kPa (line 9).
The n-pentane emerging from VAP 1 in the high-pressure line at 137 °C and 1261 kPa (line 12) is sprayed into TURB 1. Then, the n-pentane exiting TURB 1 at 82 °C and 150 kPa is sent to RECUP (line 13). In the high-pressure line, RECUP is used to reduce the supercooling load of CON 1. Then, the n-pentane follows CON 1 (lines 14 and 15), PU 1 (lines 15 and 16), RECUP (lines 16 and 17), and PRE-HE 1 (lines 17 and 11). Finally, it completes its cycle with VAP 1. In the low-pressure line, the cycle of n-pentane continues in the same way, except for RECUP. As can be seen in Figure 1, TURBs 1 and 2 in the high- and low-pressure lines, respectively, are connected to a generator (GEN) on the same shaft. In addition, air is used to cool the n-pentane in both condensers (CONs 1 and 2). According to the uncertainty analysis method defined by Holman [27], total uncertainties for the data collected, such as pressure, temperature, and volumetric flow rate, are 2.04% (kPa), 0.88% (K), and 3.25% (m3/s), respectively. Thus, the total uncertainty for exergy efficiency is 3.27%.

2.2. Advanced Exergetic (AdvEx) Analysis

Advanced exergy (AdvEx) analysis can be used to examine the interactions between system equipment, the actual improvement potentials, and the energy savings aspects and potentials on the thermodynamic performance for any energy conversion system [15,28,29,30,31]. The AdvEx system is carried out at the component level, not at all levels, i.e., only according to component exergy destruction amounts. In this study, the AdvEx should be performed primarily in the Sinem GPP for advanced exergoeconomic (AdvExEcon) analysis. By using the real, theoretical, and unavoidable conditions listed in Table 2, the exergy destruction of 13 components for the Sinem GPP has been broken down into endogenous/exogenous and unavoidable/avoidable parts. Thus, the exergy destruction resources of endogenous/exogenous parts and potential (unavoidable/avoidable) parts in system components can be determined.
The theoretical operation in Table 2 and the thermodynamic cycles method in Kelly et al. [31] are utilized to calculate the endogenous exergy destruction of system components E ˙ D , k E N . Theoretical and hybrid properties were created to determine the endogenous exergy destruction with the method of thermodynamic cycles. For theoretical conditions, each component should fulfill the requirements of E ˙ D , k = 0 m i n . In terms of the system features, the theoretical properties were considered, as PUs and TURBs are both assumed to be isentropic. The inlet and outlet temperature difference between the VAPs, PRE-HEs, CONs, and RECUP as a heat exchanger is assumed to be Δ T = 0 [32]. For hybrid properties, while all components of the system worked under ideal conditions, the kth component whose calculation was made while working was operated under real conditions in Table 1. Thus, the exergy destruction within the kth component represents its endogenous exergy destruction. The exogenous exergy destruction E ˙ D , k E X can be calculated by subtracting the amount of destruction from the intrinsic exergy destruction amount of the kth component operating under real conditions, as in the following Equation (1):
E ˙ D , k E X = E ˙ D , k R E ˙ D , k E N
Unavoidable exergy destruction E ˙ D , k U N can be determined by considering each isolated component as separated from the system and by assuming optimal operating conditions. The inevitable assumptions made to simulate conditions are listed in Table 2, depending on the decision-maker, and this is performed arbitrarily to some extent [15,28]. Thus, the unavoidable amount of exergy destruction for the kth component is calculated as shown below [33]:
E ˙ D , k U N = E ˙ P , k R E D E ˙ P k U N
After the inevitable amount of exergy destruction is determined, the amount of avoidable exergy destruction amount is determined by subtracting the amount of exergy destruction of the kth component operating under real conditions from the amount of avoidable exergy destruction. Equation (3) is as follows:
E ˙ D , k A V = E ˙ D , k R E ˙ D , k U N
Separated parts of the exergy destruction amount can be further separated again, so the interaction and improvement potentials between components can be made more understandable. Thus, the enhanced decomposed parts listed below are obtained as follows [14,34]:
E ˙ D , k U N , E N = E ˙ P , k E N E D E ˙ P k U N
E ˙ D , k U N , E X = E ˙ D , k U N E ˙ D , k U N , E N
E ˙ D , k A V , E N = E ˙ D , k E N E ˙ D , k U N , E N
E ˙ D , k A V , E X = E ˙ D , k E X E ˙ D , k U N , E X
where E ˙ D , k U N , E N and E ˙ D , k U N , E X are the avoidable and inevitable parts of the inevitable exergy breakdown, while E ˙ D , k A V , E N and E ˙ D , k A V , E X are the avoidable and inevitable parts of the avoidable exergy destruction.

2.3. Advanced Exergoeconomic (AdvExEcon) Analysis

Total operating cost C ˙ t o t , k for the system and its components in a traditional economic (TradEcon) analysis is given as follows:
C ˙ t o t , k = C ˙ D , k + Z ˙ k
In exergoeconomic analysis, an AdvEx analysis, which is similar to splitting exergy destruction, can be broken into parts, such as by splitting total operating costs (exergy destruction-related cost— C ˙ D , k and investment cost— Z ˙ k ) into endogenous/exogenous [35,36] and avoidable/unavoidable parts [15,28].
While, all other components work theoretically, and the kth component works with its real state, only within the kth component is the endogenous part of exergy destruction-related C ˙ D , k E N and investment Z ˙ k E N costs incurred. The system exergy efficiency of the overall system remains constant in all estimates [37,38]. As such, the following can be observed:
C ˙ D , k E N = C F , k R E ˙ D , k E N
Z ˙ k E N = E ˙ P , k E N Z ˙ E ˙ P k R
The exogenous part of the exergy destruction-related ( C ˙ D , k E N ) and investment ( Z ˙ k E N ) costs is verified by subtracting the endogenous cost from the real cost. Their formulas are given below:
C ˙ D , k E X = C ˙ D , k R C ˙ D , k E N
Z ˙ k E X = Z ˙ k R Z ˙ k E N
The inevitable part is obtained under extremely inefficient conditions. In practical applications, Z ˙ E ˙ P k U N , a set of thermodynamic parameters for the kth component leading to a highly inefficient solution, is determined by choosing and estimating the investment cost arbitrarily for this solution [15,28]. Thus, exergy destruction-related ( C ˙ D , k U N ) and investment Z ˙ k U N costs are inevitable parts determined by the following expressions, respectively:
C ˙ D , k U N = C F , k R E ˙ D , k U N
Z ˙ k U N = E ˙ P , k R Z ˙ E ˙ P k U N
Once the inevitable exergy destruction-related and investment costs are determined, it can be calculated in available parts, as follows:
C ˙ D , k A V = C ˙ D , k R C ˙ D , k U N
Z ˙ k A V = Z ˙ k R Z ˙ k U N
To explain the kth component more, the potential for economic improvement is associated with the avoidable and unavoidable exergy destruction and investment costs that are endogenous, and it is decomposed once again into exogenous sections. The sections, separated further below, are presented, respectively:
C ˙ D , k U N , E N = C F , k R E ˙ D , k U N , E N
Z ˙ k U N , E N = E ˙ P , k E N Z ˙ E ˙ P k U N
C ˙ D , k U N , E X = C ˙ D , k U N C ˙ D , k U N , E N
Z ˙ k U N , E X = Z ˙ k U N Z ˙ k U N , E N
C ˙ D , k A V , E N = C ˙ D , k E N C ˙ D , k U N , E N
Z ˙ k A V , E N = Z ˙ k E N Z ˙ k U N , E X
C ˙ D , k A V , E X = C ˙ D , k E X C ˙ D , k U N , E X
Z ˙ k A V , E X = Z ˙ k E X Z ˙ k U N , E X
Some markers are needed to evaluate the AdvExEcon analysis. For the TradExEcon and AdvExEcon analysis, in this study, the performance indicators of the system are listed in Table 3.

3. Results

In this study, the findings of the TradEx and AdvEx analyses for GPP are summarized from exergy and economic perspectives. First, the TradEx analysis is performed by using data collected from the GPP. Studies on these analyses can be found extensively in the literature [1,2,12,13]. By combining the theoretical, unavoidable, and unavoidable cost conditions with the results of the TradEx-based analysis, AdvEx-based analyses are performed. Thus, from the exergetic and economic point of view of the GPP and components, interaction and improvement potential can be evaluated. The results obtained are given under the headings as follows.

3.1. Results of the TradEx-Based Analyses

The findings of the TradEx-based analyses made for the GPP are listed in Table 4. The results of the exergy analysis are shown in the first four columns of Table 4. As seen in the table, the exergy efficiency of the whole system is determined as 39.1%. Exergy input of 53.8 MW is 29.5% strength exergy loss, and 31.3% strength is the amount of exergy destruction. Therefore, there is an exergy production of 21 MW against 39.1% exergy efficiency. The highest exergy destruction amount is in CON 2 for approximately 2.49 MW. It is followed by VAP 2 with 2.26 MW and CON 1 with 1.98 MW, respectively. Exergy efficiencies are also low, as can be seen from Table 2. The mentioned equipment is considered as improvement-prior equipment. Especially in Level I, the equipment with the highest exergy destruction is CON 1, while in Level II it is CON 2. The exergy efficiencies of TURBs 1 and 2 in Levels I and II are calculated as 93.5% and 83.3%, respectively. When compared to Level I, the total exergy destruction amount of the Level II equipment is more than 2.6 MW. The reason for this is the low temperature of the geothermal fluid in Level II. However, adding geothermal fluid steam to Level II is not effective. The TradEx method is insufficient in terms of the interaction between the components and the technology levels of the equipment as the cause of the exergy destruction.
In the last five columns of Table 4, the results of the TradExEcon analysis are given. The findings here are determined by the specific exergy costing (SPECO) method presented by Lazzaretto and Tsatsaronis [39]. As can be seen from the table, the whole system has an exeroeconomic factor of 58.1%. In other words, 58.1% of the total operating cost of 1218.38 USD/h is the capital investment cost. The remaining percentage of the cost is related to component exergy destruction. Both costs are considered to be effective in system performance. Furthermore, the unit fuel exergy cost of 8.4 USD/GJ turns into a unit product exergy cost with a difference of 1.32 USD/GJ. As seen in Table 4, while the cost of unit exergy of geothermal fluid is 1.2 USD/GJ, the cost of total component exergy destruction is calculated as being approximately 510.6 USD/h. Exergy total cost related to the loss of the system is 480 USD/h, while the cost of electricity production of the GPP is 6.76 USD/GJ. Among the components from Table 4, the highest exergy destruction cost is in CON 2 with 65.9 USD/h. It is followed by CON 1 with 60.5 USD/h, PU 1 with 46.9 USD/h, and PU 2 with 46.6 USD/h. The highest capital investment cost is the condenser (CONs 1 and 2) with 130.1 USD/h. It is followed by turbines (TURBs 1 and 2) with 119.5 USD/h, VAP 2 with 19.9 USD/h, and VAP 1 with 18.6 USD/h. Equipment investment costs are higher within the total operating cost for all of the equipment except PU 2, PU 1, VAP 2, and RECUP. The total operating cost of PRE-HE 1, PRE-HE 2, and VAP 1 is low. Therefore, the contribution of this equipment to the total operating cost of the plant is insignificant. The exergy destruction cost of all components remains below the capital investment cost. However, there is not much difference between them. The investment operating costs of the components must be taken into account as well as the component exergy destruction costs.

3.2. Results of the AdvEx-Based Analyses

After the AdvEx-based analyses from the thermodynamic and economic points of view, AdvEx-based analyses are divided into two parts, with exergy and exergoeconomic analyses as a continuation of one other. First of all, exergy analysis is performed and then, related to the results of this analysis, exergoeconomic analysis is carried out. Therefore, the methodology given in Section 2.2 for the AdvEx analysis is applied to a GPP and its components. Then, the methodology in Section 2.3 is used for the GPP’s AdvExEcon analysis. The obtained results are presented below.

3.2.1. Results of the AdvEx Analysis

Table 5 lists the results of the AdvEx analysis applied to a GPP and its components. As seen in columns 2 and 3 of Table 5, the total exergy destruction of 16.9 MW is from 72% endogenous and 28% exogenous sources. This means that the interaction between components is weak. In addition to that, the majority of exergy destruction of all components except pumps is endogenous, which means it arises from the components themselves. The highest endogenous exergy destruction amount belongs to CON 2 with 1.65 MW. It is followed by VAP 2 with 1.61 MW, CON 1 with 1.55 MW, and TURB 2 with 1.24 MW. Furthermore, for CON 1, TURB 2, and VAP 2, the difference in endogenous and exogenous exergy destruction is very wide. Specifically, CON 1 is a component selected as having a low capacity. With its use over time, the polluting and blinding effect of geothermal water reduces the efficiency of the condenser. Hence, the endogenous exergy destruction is wider. The pumps (PUs 1 and 2) are negatively affected due to the pressure drop in the condensate. In TURB 2, partly due to low turbine efficiency, inlet and outlet temperature differences, leaks and pressure drops, the endogenous part is higher, with 1.24 MW compared to the exogenous. The endogenous exergy destruction of VAP 2 in Level II is more than that of VAP 1 in Level I. The reason for this is that the temperature of the geothermal fluid coming out of VAP 1 is very low. Compared to Level I, the total endogenous exergy destruction in Level II is 1.12 MW more than in Level I. Importance can be given to improving the components in Level II.
A further decomposition process is applied to evaluate the interaction and improvement potential between components in the plant. Thus, the endogenous and exogenous parts of the inevitable exergy destruction are listed in columns 6 and 7 of Table 5. From this table, 75% of the 9.3 MW total unpreventable exergy destruction is endogenous and 25% is exogenous. Except for turbines, vaporizers, and recuperators, the outer part of the inevitable exergy destruction of all components is higher than the inner part. The highest exogenous inevitable exergy destruction amount belongs to the pumps (PUs 2 and 1 of 1.1 MW and 1 MW, respectively). The total exogenous inevitable exergy destruction in Level II is 1.16 MW more than in Level I. Consequently, it is better to focus on the preventable part of the next decomposition process rather than this part of it.
The most positive evaluation part of the AdvEx analysis is the preventable part. In columns 8 and 9 of Table 5, the endogenous and exogenous parts of the exergy destruction that can be avoided are given. It can be understood from the table that 68% of the 7.6 MW total preventable exergy destruction is endogenous and 32% is exogenous. In other words, 5.18 MW of exergy destruction caused by the components themselves can be eliminated with technological improvements.
As seen in Table 5, endogenous exergy destruction of all components, except pumps, is prevented. The highest preventable endogenous exergy destruction amount belongs to CON 2 with 1.54 MW. It is followed by CON 1 with 1.43 MW, VAP 1 with 0.7 MW, and VAP 2 with 0.67 MW. The amounts of preventable endogenous exergy destruction are 2.6 MW and 3.2 MW, respectively, on Levels I and II. Therefore, the endogenous exergy destruction of the components in Level II is more preventable. As a result, the components with the highest to lowest improvement potential are listed as CON 2, CON 1, VAP 1, and VAP 2. As can be seen in the last column of Table 5, the modified exergy efficiency of the whole system is approximately 50%. Once the interaction and improvement potential between system components is determined, technological improvements can be better understood. Thus, this analysis provides more useful information to engineers and operators.

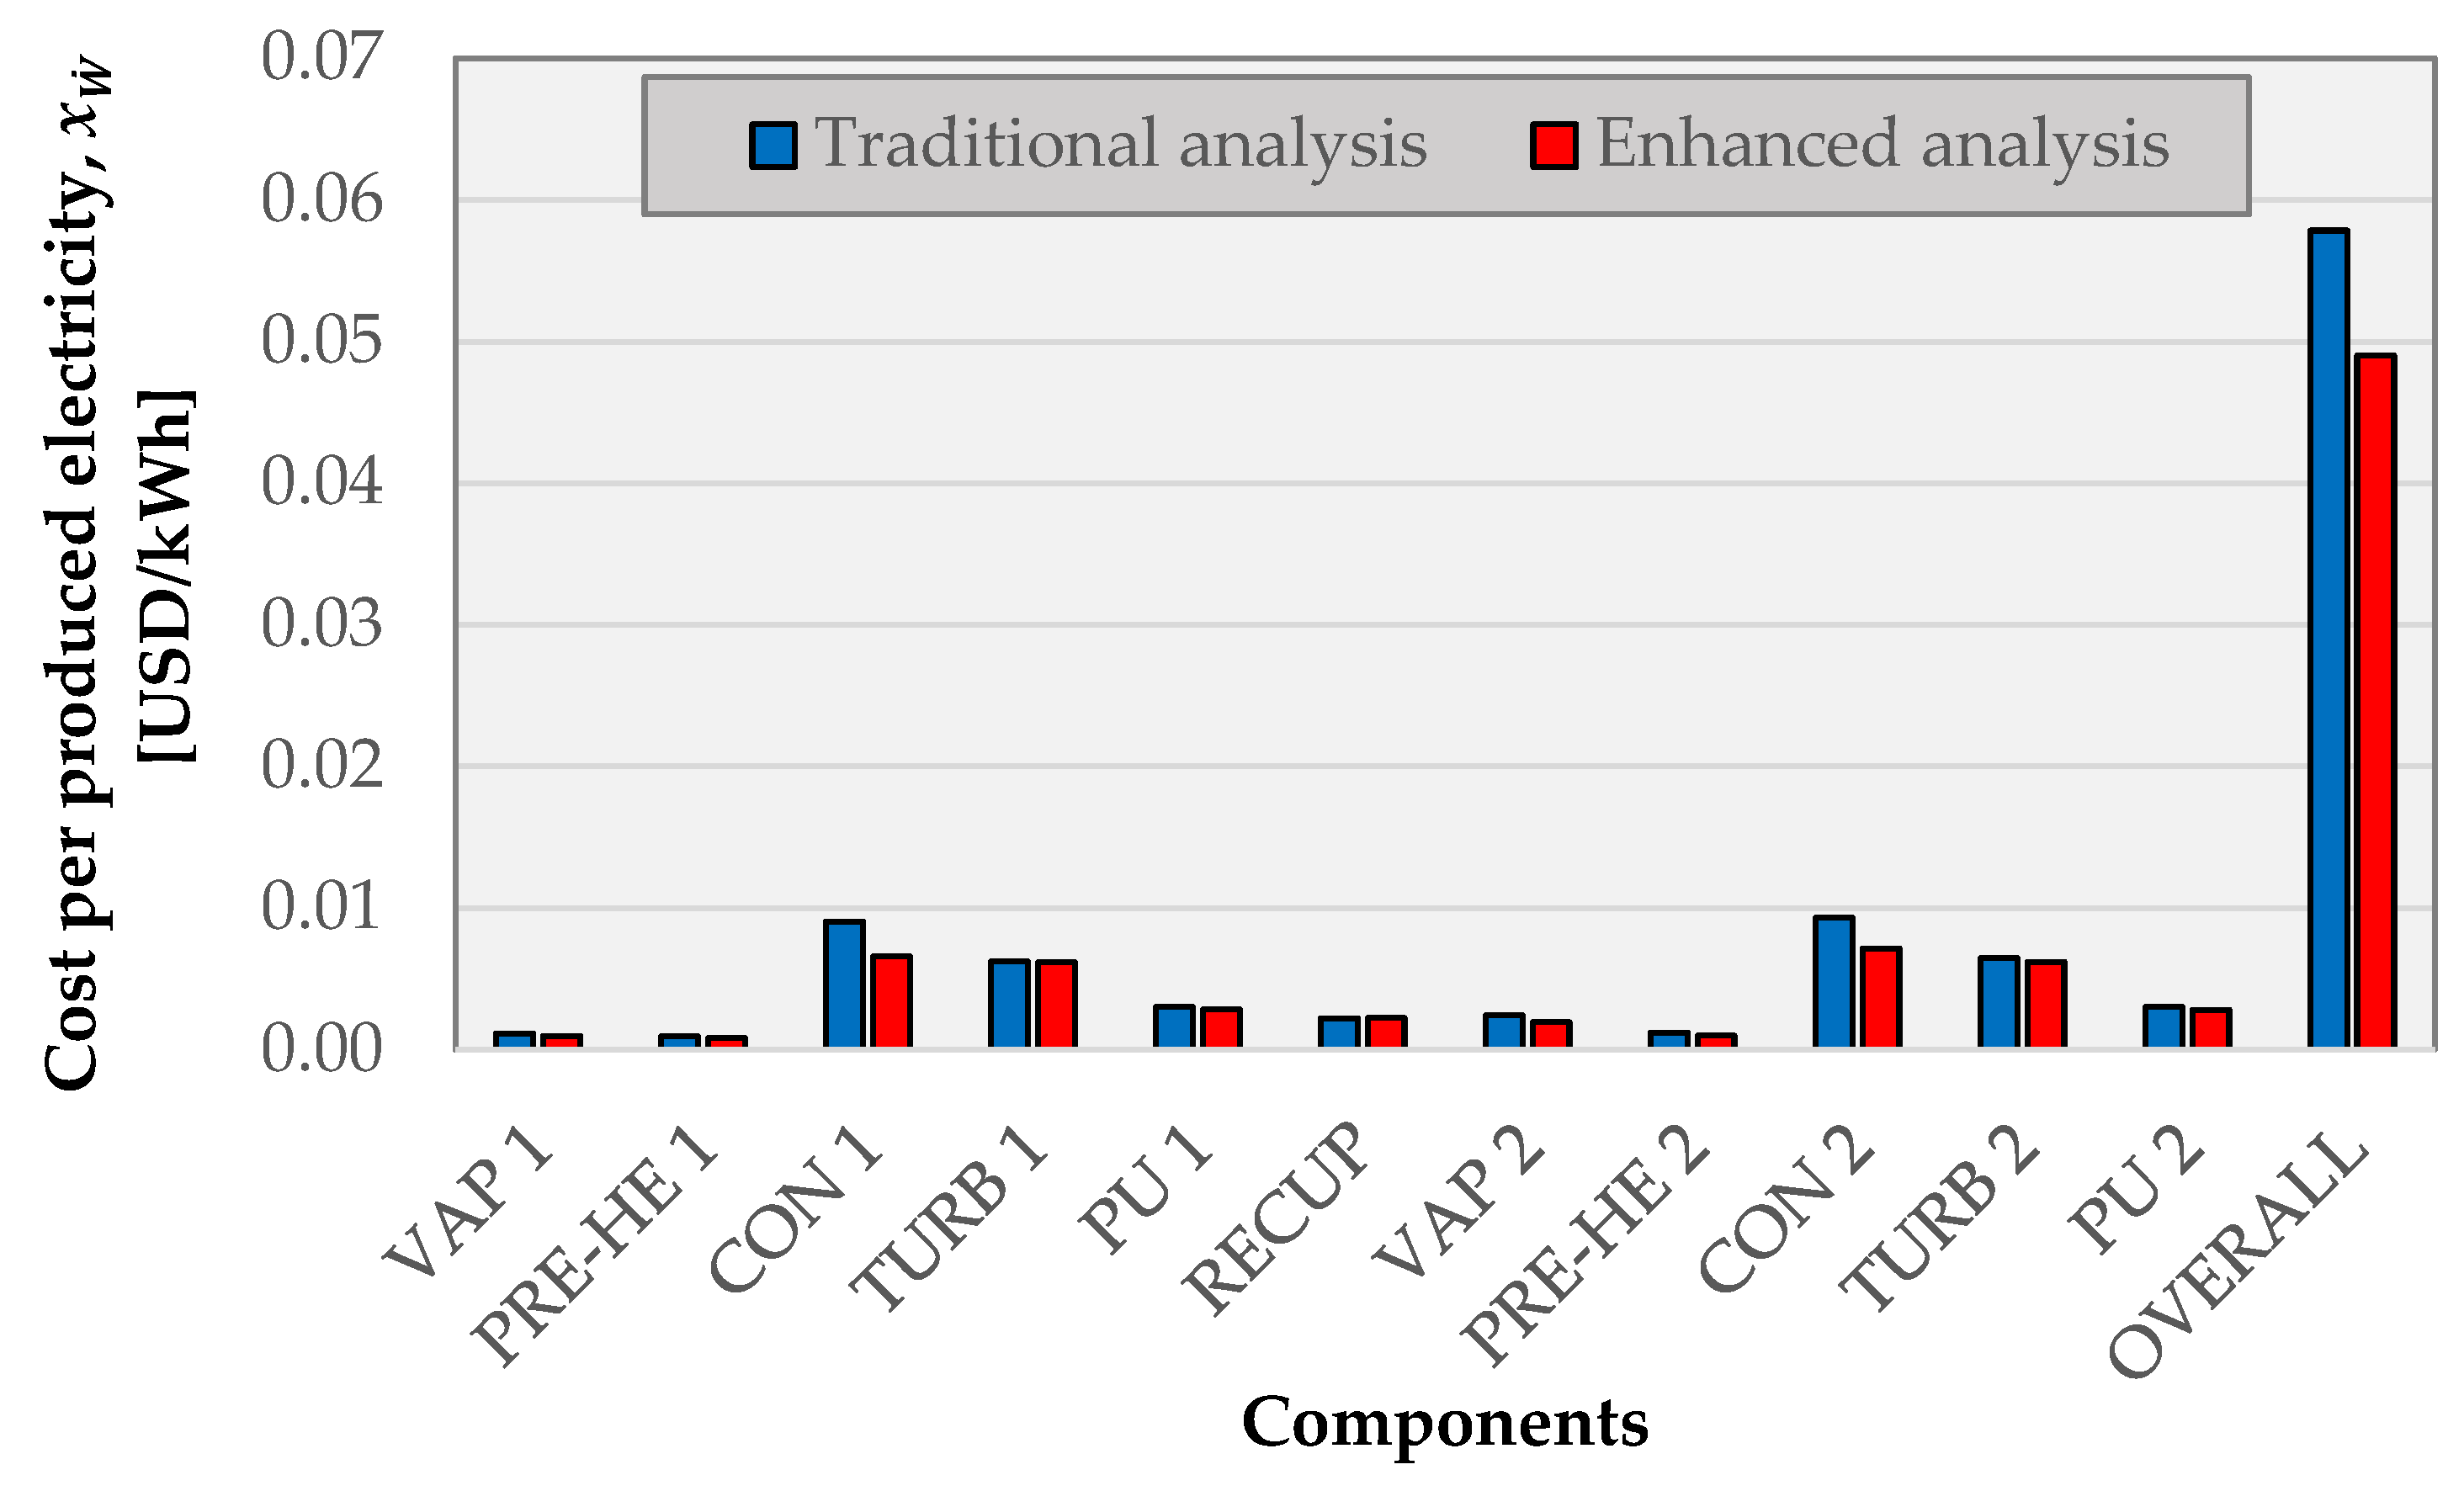
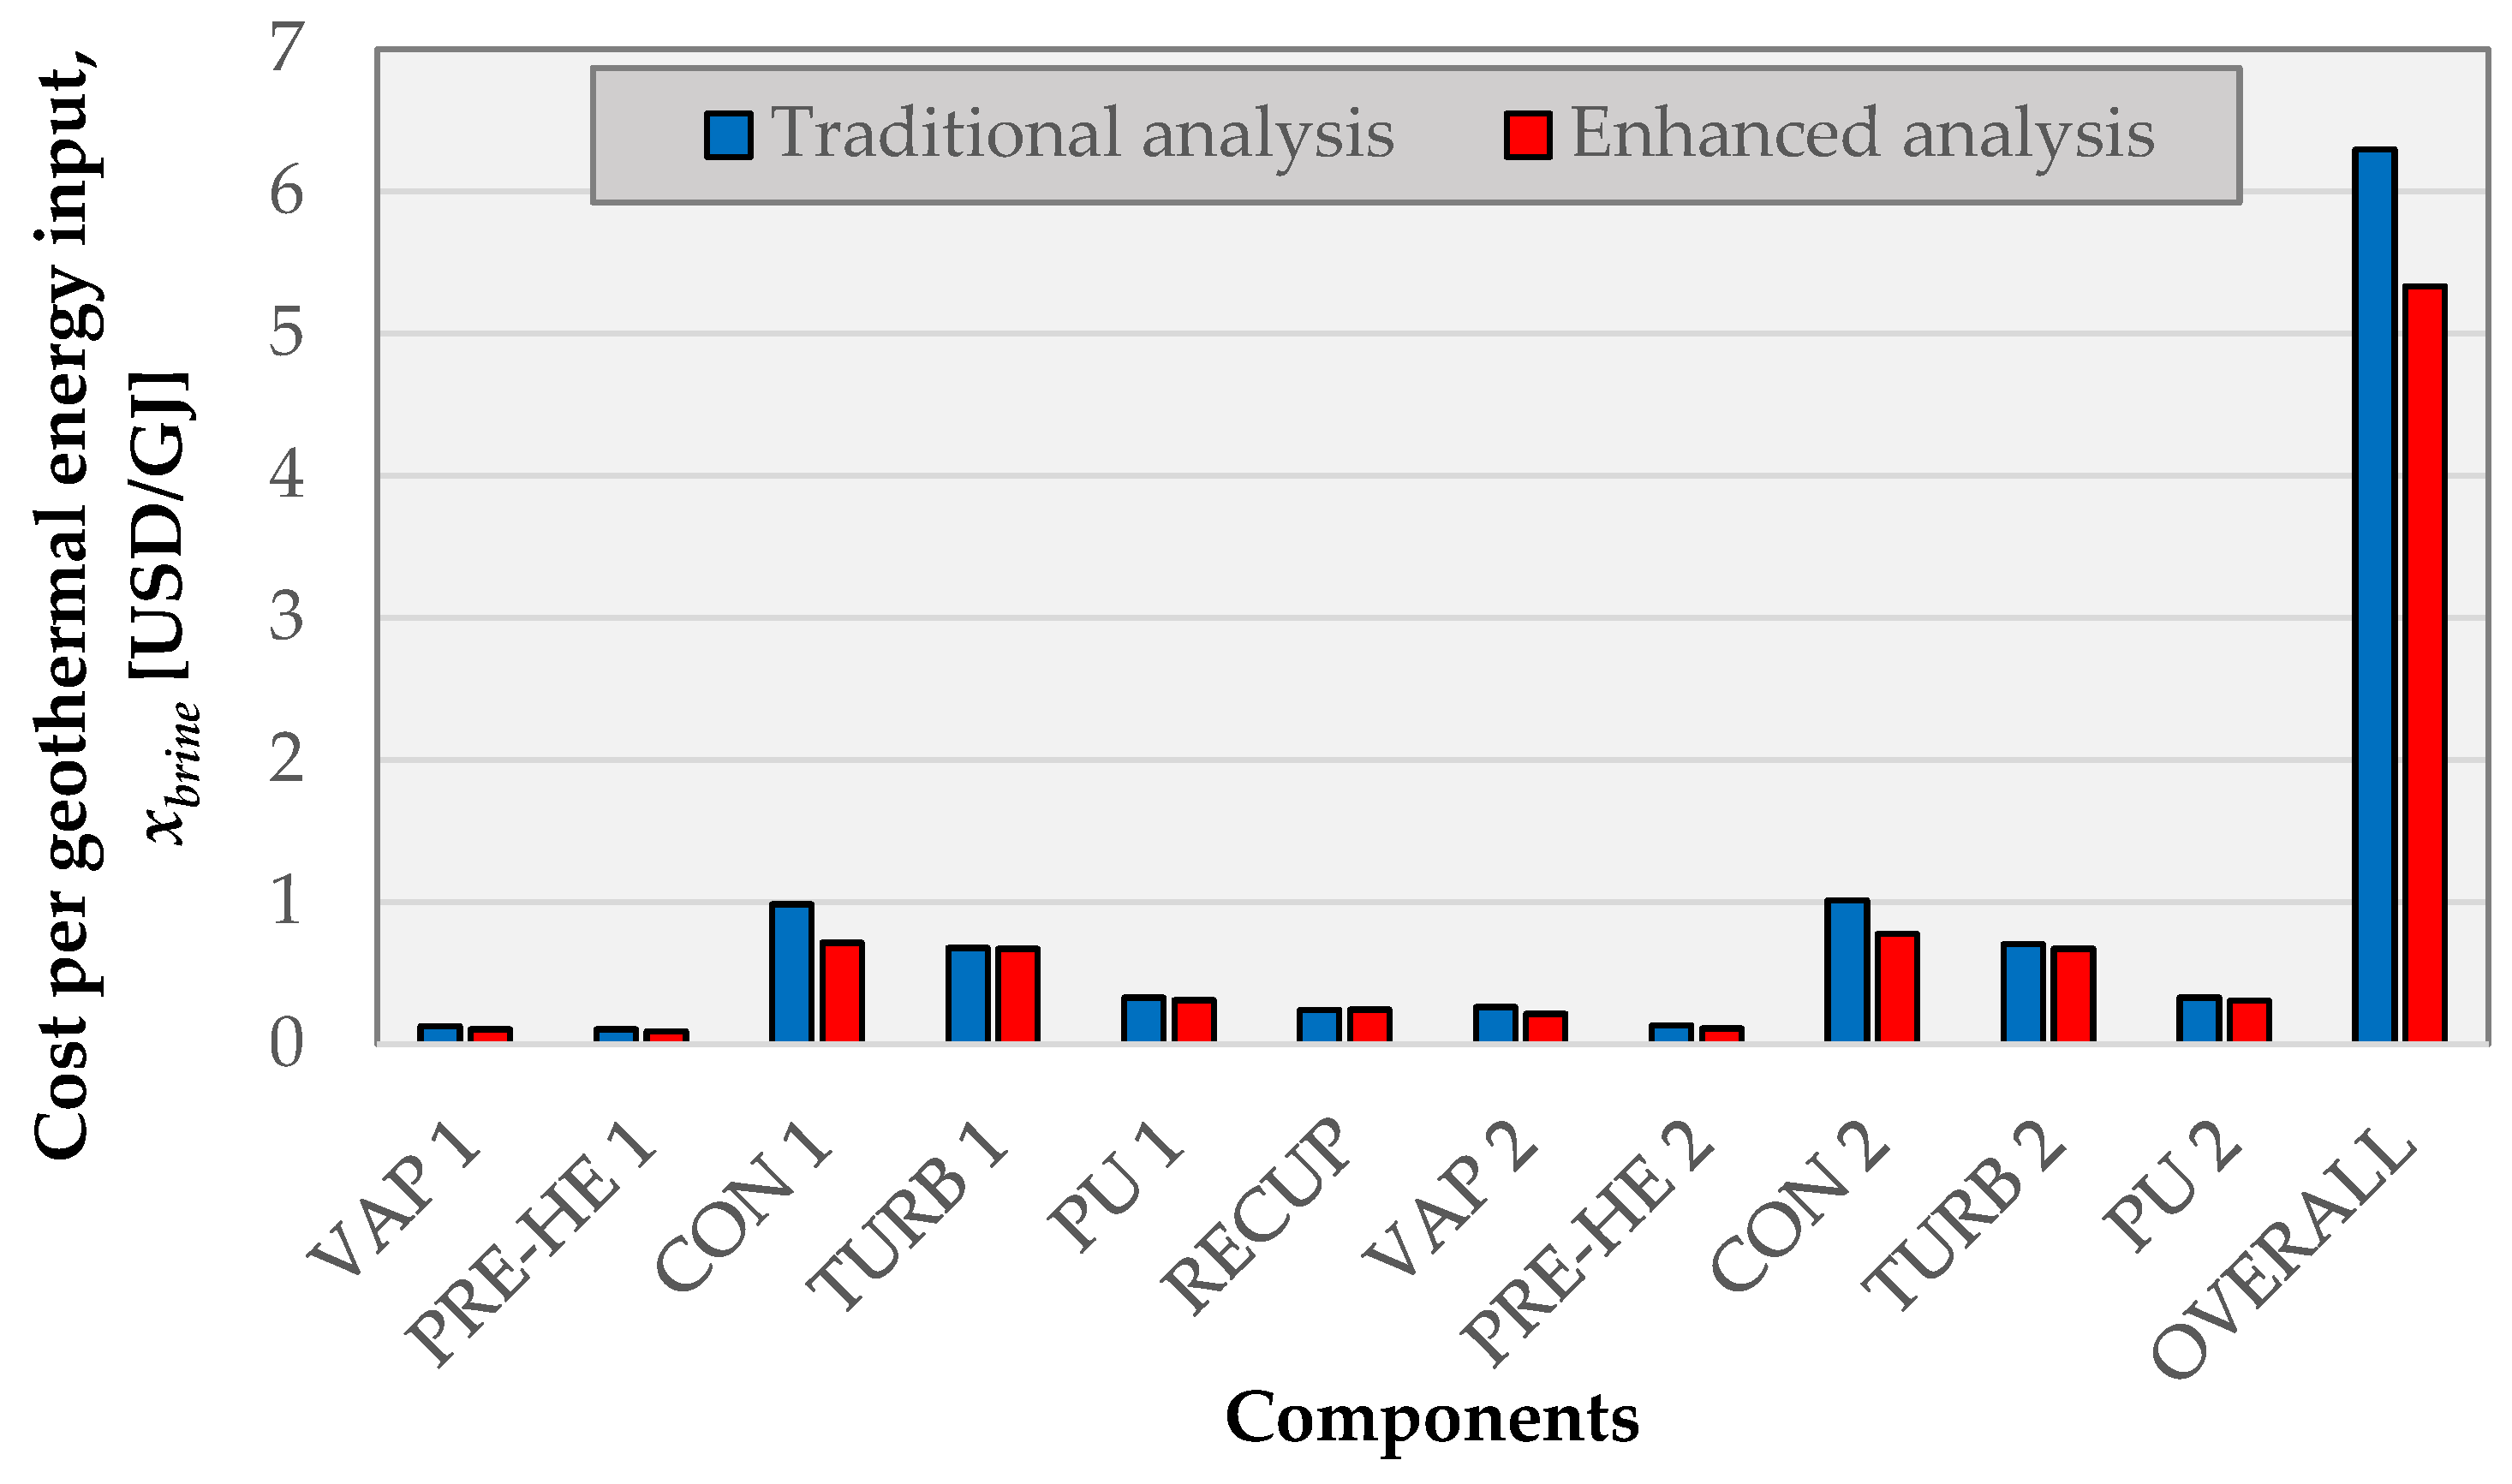
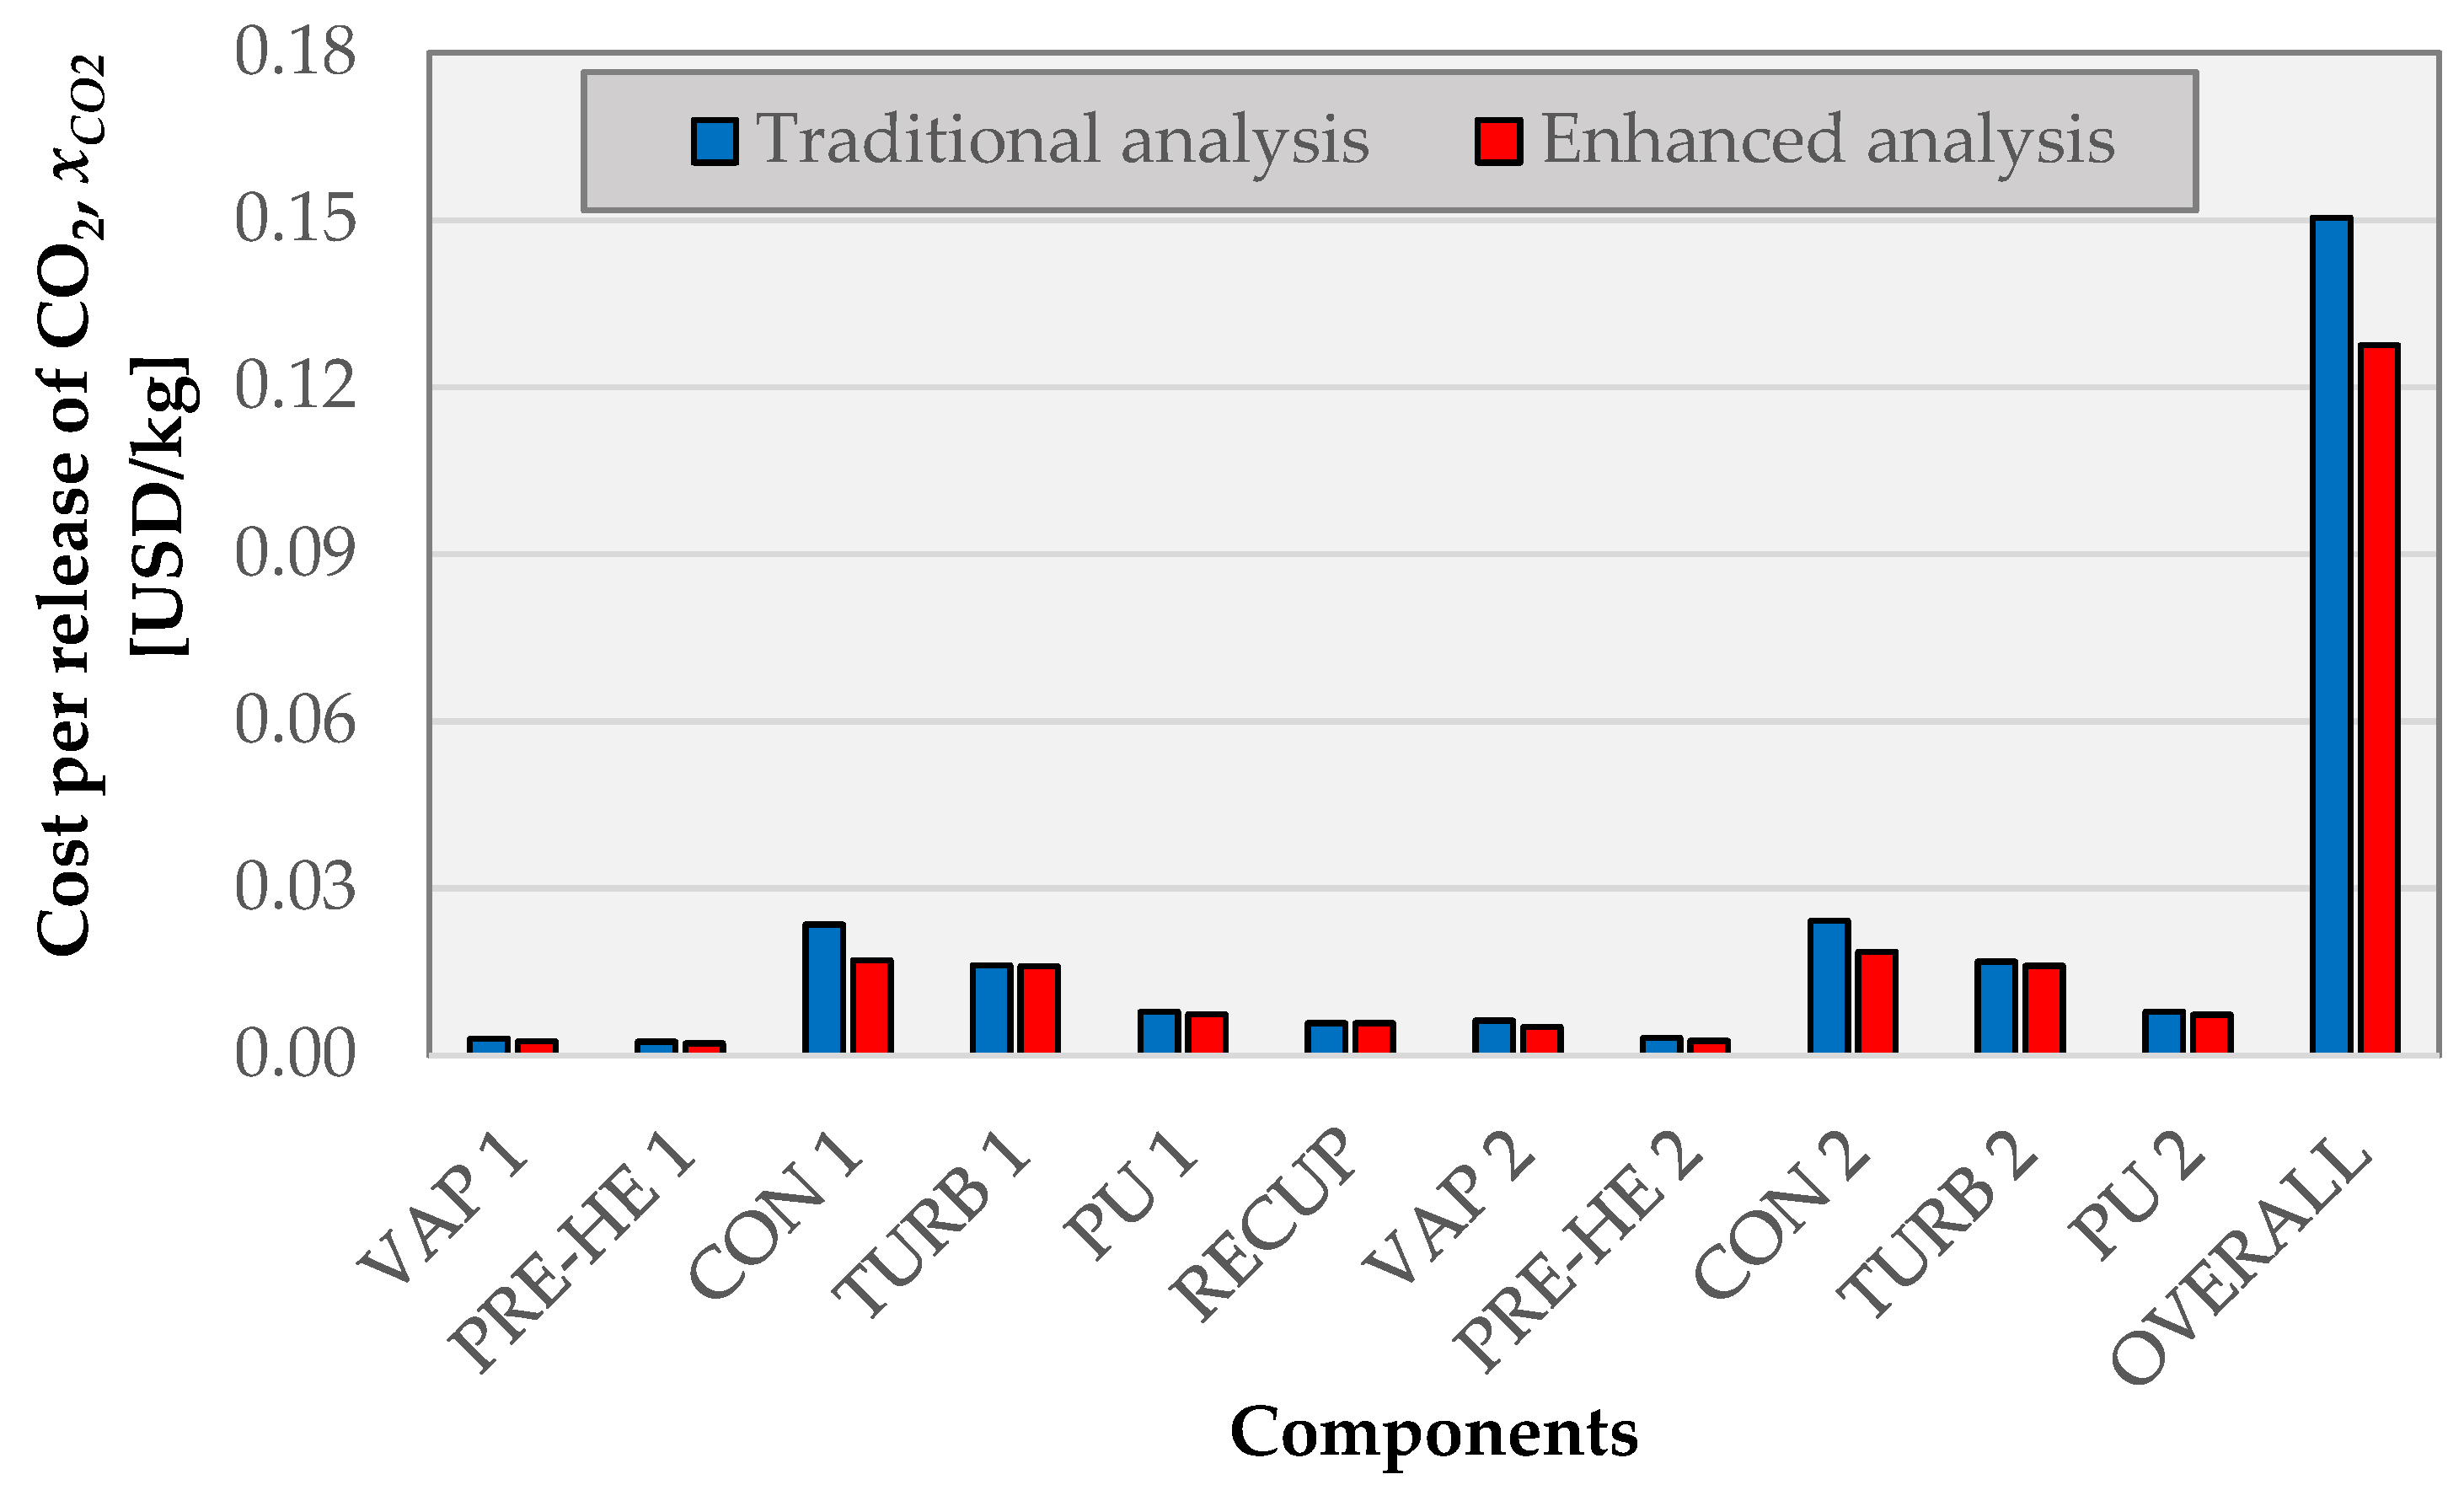
3.2.2. Results of the AdvExEcon Analysis

The conclusions of the TradExEcon analysis showed that both the cost related to exergy destruction and the cost related to capital investment should be taken into account. Therefore, the results of the AdvExEcon analysis for the cost associated with exergy destruction are given in Table 6. In the third and fourth columns of Table 6, 72% of the total exergy destruction cost of 510.6 USD/h is the endogenous part caused by the components themselves. The remaining 28% is exogenous. Therefore, the interaction between components can be considered to be weak. As seen in the table, the cost of endogenous exergy destruction is higher than the cost of exogenous exergy destruction in all equipment, except for pumps. Pumps are affected by the operation of other GPP components. Thus, exergy destruction in other components is reduced to reduce the exergy destruction costs of the pump. It may be suggested to replace existing components with more efficient or new technological ones to decrease exergy destruction costs. The highest endogenous exergy destruction cost is CON 1 with 47.5 USD/h. It is followed by CON 2 with 43.6 USD/h, VAP 2 with 20.2 USD/h, and PU 1 with 18.4 USD/h. Furthermore, the difference between endogenous and exogenous exergy destruction costs for this equipment is wide. The endogenous exergy destruction cost is higher due to reasons, such as the selection of condensers with low capacity at the beginning and then the polluting and blinding effect of the cooling water inside, which reduces the efficiency of the condenser. In this case, the pumps are more affected by pressure drops due to contamination and blinding in the condensers. Therefore, exogenous exergy destruction costs are higher than endogenous costs.
As seen in the fifth and sixth columns of Table 6, the inevitable and preventable parts of the total exergy destruction cost are 281 USD/h and 220 USD/h, respectively. The value of the inevitable part is greater than the preventable part. Therefore, it has the potential to keep the plant and its components at a low level of efficiency. Except for condensers, preheaters, and VAP 1, the inevitable exergy destruction costs of all equipment are higher than the preventable exergy destruction costs. As can be understood from the table, CON 2 has the highest value with a preventable exergy destruction cost of about 51.1 USD/h. It is followed by CON 1 with 44.2 USD/h, PU 2 with 11.2 USD/h, and PU 1 with 7.5 USD/h. Therefore, these components have the highest improvement potential. The highest unpreventable exergy destruction costs are in the PUs (PUs 1 and 2 with 39.3 USD/h and 354 USD/h, respectively). The inevitable exergy destruction costs are higher than the avoidable exergy destruction costs of the main equipment TURBs 1 and 2 in the GPP. This means that these turbines require maintenance or replacement costs.
The values of the endogenous and exogenous parts of the components within the unpreventable exergy destruction cost are given in columns 7 and 8 of Table 6. Here, 75% of the total inevitable exergy demolition cost of 281 USD/h is endogenous and 25% is exogenous. The highest inevitable exogenous exergy destruction cost is PU 2 at 27.8 USD/h. After that, it is PU 1 at 24.5 USD/h, CON 1 at 12.5 USD/h, and VAP 2 at 12 USD/h, respectively. In columns 9 and 10 of Table 6, the component exergy destruction cost of the preventable endogenous part is presented. All components except the pumps and RECUP from the table are preventable, and the preventable intrinsic exergy destruction costs are higher than the inner part. A total of 68% of the total preventable exergy demolition cost of 229.6 USD/h is endogenous and 32% is exogenous, which means that the system can be improved. The component with the highest preventable intrinsic exergy destruction cost is CON 1 with 43.7 USD/h. It is followed by CON 2 at 40.7 USD/h, VAP 2 at 8.5 USD/h, and PRE-HE at 4.1 USD/h.
In the third and fourth columns of Table 7, the data that belongs to the endogenous and exogenous parts of the component capital investment costs are listed. As seen in Table 7, 95% of the total capital investment cost of 707.8 USD/h is the part resulting from the components themselves. In other words, it can be considered that the investment cost arising from the components themselves is high. This shows that the interaction between the equipment does not affect investment costs. The highest endogenous investment cost belongs to CON 1. Its value is 114.9 USD/h, and it is followed by CON 2 with 114.9 USD/h, TURB 2 with 110.3 USD/h, and TURB 1 with 109.4 USD/h. As can be seen in columns 5 and 6 of Table 7, the preventable investment costs of all components are higher than the preventable investment costs. The investment cost values for the PP have high development potential. The equipment with the highest preventable investment cost is CON 1 with 36.1 USD/h. Next comes CON 2 with 33.1 USD/h, TURB 1 with 19.78 USD/h, and TURB 2 with 19.75 USD/h.
The values of the endogenous and exogenous parts of the component capital investment costs are given in columns 7 and 8 of Table 7. As seen in the table, the total capital investment cost is the part resulting from the components themselves. In the last two columns of Table 7, the endogenous and exogenous parts of the component capital investment costs are presented. It can be understood from the table that 31% of the 93.2 USD/h total capital investment cost is endogenous and 69% is exogenous. This means that the system can be improved. The component with the highest preventable endogenous capital investment cost is CON 1 with 8.5 USD/h. It is followed by CON 2 at 4.2 USD/h, TURB 2 at 2.4 USD/h, and RECUP at 1.5 USD/h. An improvement has to be made regarding the condensers themselves. For this, the material of the equipment can be changed and maintained, and less costly production methods can also be used.

4. Discussion

The AdvExEcon analysis is performed according to the AdvEx analysis analogy. The AdvEx analysis showed that the amount of preventable exergy destruction caused by the components was high for the maximum exergy efficiency of the plant. The evaluation of this situation in terms of cost can be made with the AdvExEcon method. Therefore, in this analysis, total operating costs show the components that should have their improvement prioritized to increase the overall cost efficiency of the plant. This exergy is determined by adding the destruction cost to the capital investment cost. The change in the total operating costs of the plant and its components in terms of TradExEcon and AdvExEcon analyses is shown in Figure 2. As seen in Figure 2, the total operating cost is 1218 USD/h for traditional analysis, while its value is 186 USD/h for further analysis. Thus, an 85% reduction in total operating costs can be achieved. It can also be seen from the figure that with the AdvEx analysis of all components, the total operating costs are reduced. In the context of Table 6 and Table 7, the components are preventable costs, as their endogenous exergy destruction costs are much higher than their preventable endogenous capital investment costs.
Figure 3 shows the relative cost difference for the plant and its components for the TradExEcon and AdvExEcon analyses. The relative cost difference (rk) is related to the increase in cost per unit exergy between fuel and product. As seen in Figure 3, while the rk value of the PP is 16% in the TradExEcon analysis, its value is 28% in the further analysis. The cost increase is provided between fuel and production with AdvExEcon analysis. However, this situation occurs by decreasing the rk value in the components. According to the TradExEcon analysis, the rk values of the pumps (754% and 1083% for PUs 1 and 2, respectively) are very high compared to the other equipment. For AdvExEcon analysis, their values are reduced to 39% and 56%, respectively. It shows that the exergy in these components should be improved by reducing the cost of demolition. After these components comes TURB 2 with rk values of 164%, followed by VAP 2 with 99%. However, with further analysis, the rk values are 7% for TURB 2 and 11% for VAP 2. For AdvExEcon analysis, the highest rk values among the components belong to PU 2 with 56%. It is followed by CON 2 with 50%, PU 1 with 39%, and CON 1 with 37%.
The exergoeconomic factor (fk) relates to the ratio of capital investment cost to total operating cost. In Figure 4, the variation in the exergoeconomic factor for the system and components for both analyses is given. As seen in Figure 3, the exergoeconomic factor in Figure 4 takes low values in contrast to the high values of the relative cost difference. This ensures the efficiency of the component by reducing the cost of exergy destruction. The fk value of the plant is calculated as 58% for the TradExEcon analysis and 16% for the further analysis. The capital investment cost of the PP is considered to be higher than the cost of exergy destruction. In the AdvExEcon analysis, the fk value decreases with the preventable part of the exergy destruction cost caused by the components. Therefore, if the efficiency of the equipment is increased, it is understood that the decrease in the investment cost is justified. As seen in Figure 4, the highest exergoeconomic factor in the TradExEcon analysis is TURB 1 with 92%. It is followed by TURB 2 with 88%, VAP 1 with 77%, PRE-HE 1 with 73%, and CON 1 with 68%. With the AdvExEcon analysis, the exergoeconomic factor of all components falls below 50%. Therefore, the exergy destruction costs of the components become important. The largest exergoeconomic factor decrease occurs in PRE-HE 1, CON 2, and PRE-HE 2. Investment cost ratios within the total operating cost of all equipment are reduced.
Cost performance trend (e), which is defined as the ratio of fuel exergy cost to production exergy cost, is presented in Figure 5 for both analyses. While the value of e is 0.45 times in the TradExEcon analysis, its value is 0.37 times in the enhanced exergy analysis. This result is due to a reduction in the fuel exergy cost. As shown in Figure 5, the “e” values of all components increase with further analysis. For the equipment with the highest e value, TURB 2 has a value of 2.2 times in the TradExEcon analysis, while its value in the AdvExEcon analysis decreases to 2 times. The biggest difference occurs in the pumps. Due to the high exergy destruction cost in the context of Figure 4, the change in the exergy destruction cost ratio (yk) is presented in Figure 6 for the system and components. The load of the whole system is calculated as 407% for the TradExEcon analysis and 125% for the AdvExEcon analysis. The exergy destruction cost in the total fuel exergy cost is reduced. A similar situation occurs within the components. As seen in Figure 6, condensers (CONs 2 and 1) and pumps (PUs 1 and 2) are the components that will make the highest contribution to the cost performance of the system. While the load value of PU 2 is 37% for the traditional analysis, it is 3% for the enhanced analysis. This contribution is obvious here.
When comparing the results of both methods, Figure 7 shows the change (Xw) in the total operating cost per total electricity generation for the plant and its components. As seen in Figure 7, the total Xw value of the system is 0.058 USD/kWh and 0.049 USD/kWh for the TradExEcon and AdvExEcon analyses, respectively. With the application of the AdvExEcon analysis, there is a 15% reduction in the total operating cost of the PP. This is a result of the preventable portion of exergy demolition costs arising from the components.
For the condensers (CONs 2 and 1) with the highest total operating costs in Figure 2, the Xw values of the TradExEcon analysis in Figure 7 are equivalent to 0.009 USD/kWh. With the AdvExEcon analysis, these values are reduced to 0.007 USD/kWh. Again, the biggest difference in Xw for both analyses is in CONs 2 and 1. From here, it is clear that condensers are the most important contributor to the PP of the system. The change in cost (Xbrine) per energy of the geothermal fluid entering the PP is given in Figure 8. As seen in Figure 8, the Xbrine value of the system is 6.3 USD/GJ for the TradExEcon analysis. With the use of the AdvExEcon analysis, its value becomes 5.3 USD/GJ with a 15% decrease. It can be noted that a graphic similar to Figure 7 is created in Figure 8 and Figure 9. This is because the total operating cost is at a fixed value in all three ways.
Figure 9 shows the change in cost per CO2 emission of the plant and components for the TradExEcon and AdvExEcon analyses. As seen in Figure 9, according to the TradExEcon analysis, the CO2 emission cost of the system is 0.15 USD/kg. This value can be reduced to about 0.13 USD/kg according to the AdvExEcon analysis. Considering that the cost rate per release of CO2 is a direct function of the output mass flow rate of the CO2, as the exergy destruction of the VAP 2 decreases, the cost rate per release of CO2 decreases. If the plant can be operated under operating conditions decided for the AdvEx-based analysis, the CO2 emission cost can be reduced by 15%. In particular, the condensers’ contribution to the CO2 emission cost of the plant is very high. From the economic and environmental point of view, it is concluded that condensers have priority for improvement.
The savings potential (pk) for the system and components with the AdvEx-based analysis is presented in Figure 10. While the pk value of the system is 31% for exergy analysis, its value is determined as 15% for exergy analysis. The proportion of the preventable endogenous part in the total exergy breakdown of the components is higher than the ratio of the preventable endogenous part to the total operating cost. Therefore, it would be more advantageous to reduce the exergy destruction amounts of the components rather than their capital investment costs. In other words, it focuses on methods to enhance the performance of the components. As an example, the savings potential of CON 1 for exergy and exergy economics can be understood from the fact that they are 72% and 27%, respectively. As seen in Figure 10, performance improvement for CON 1, CON 2, VAP 1, PRE-HE 1, and PRE-HE 2 components indicates that they are priority components. In another aspect, it is important to reduce the total operating costs of the CON 1, CON 2, VAP 2, VAP 1, and PRE-HE 2 components.

5. Conclusions

This article particularly focuses on the interaction between the components and potential for improvement of a real dual binary GPP system. In general, the design and operation of dual binary GPPs presents quite a challenge. Namely, using a single recuperator, sending steam to a single vaporizer, and connecting turbines (with different pressures) and a generator on the same shaft are some of these challenges depending on the characteristics of the geothermal resource. Thus, the performance and feasibility of such a GPP are affected. During the work, two perspectives, namely thermodynamic and economic, were discussed in detail for a real, operational GPP (the Sinem GPP located in Turkey) through further analyses. The economic analysis was carried out with the specific exergy cost (SPECO) method. Firstly, the advanced exergy (AdvEx) analysis was used for the system, and then the AdvExEcon analysis associated with it was used. The averages of the data collected throughout 2020 were used in the analyses. The important conclusions obtained in the study can be summarized as follows:
  • While the exergy efficiency of the system for the TradEx analysis is 39.1%, as a result of the improvements with the AdvEx analysis, the exergy efficiency of the system reaches 50%.
  • Exergy destruction in the GPP can be improved to 7.6 MW with some technological improvements, and the components with the highest exergy destructions in the GPP equipment are CON 2, CON 1, VAP 1, and VAP 2.
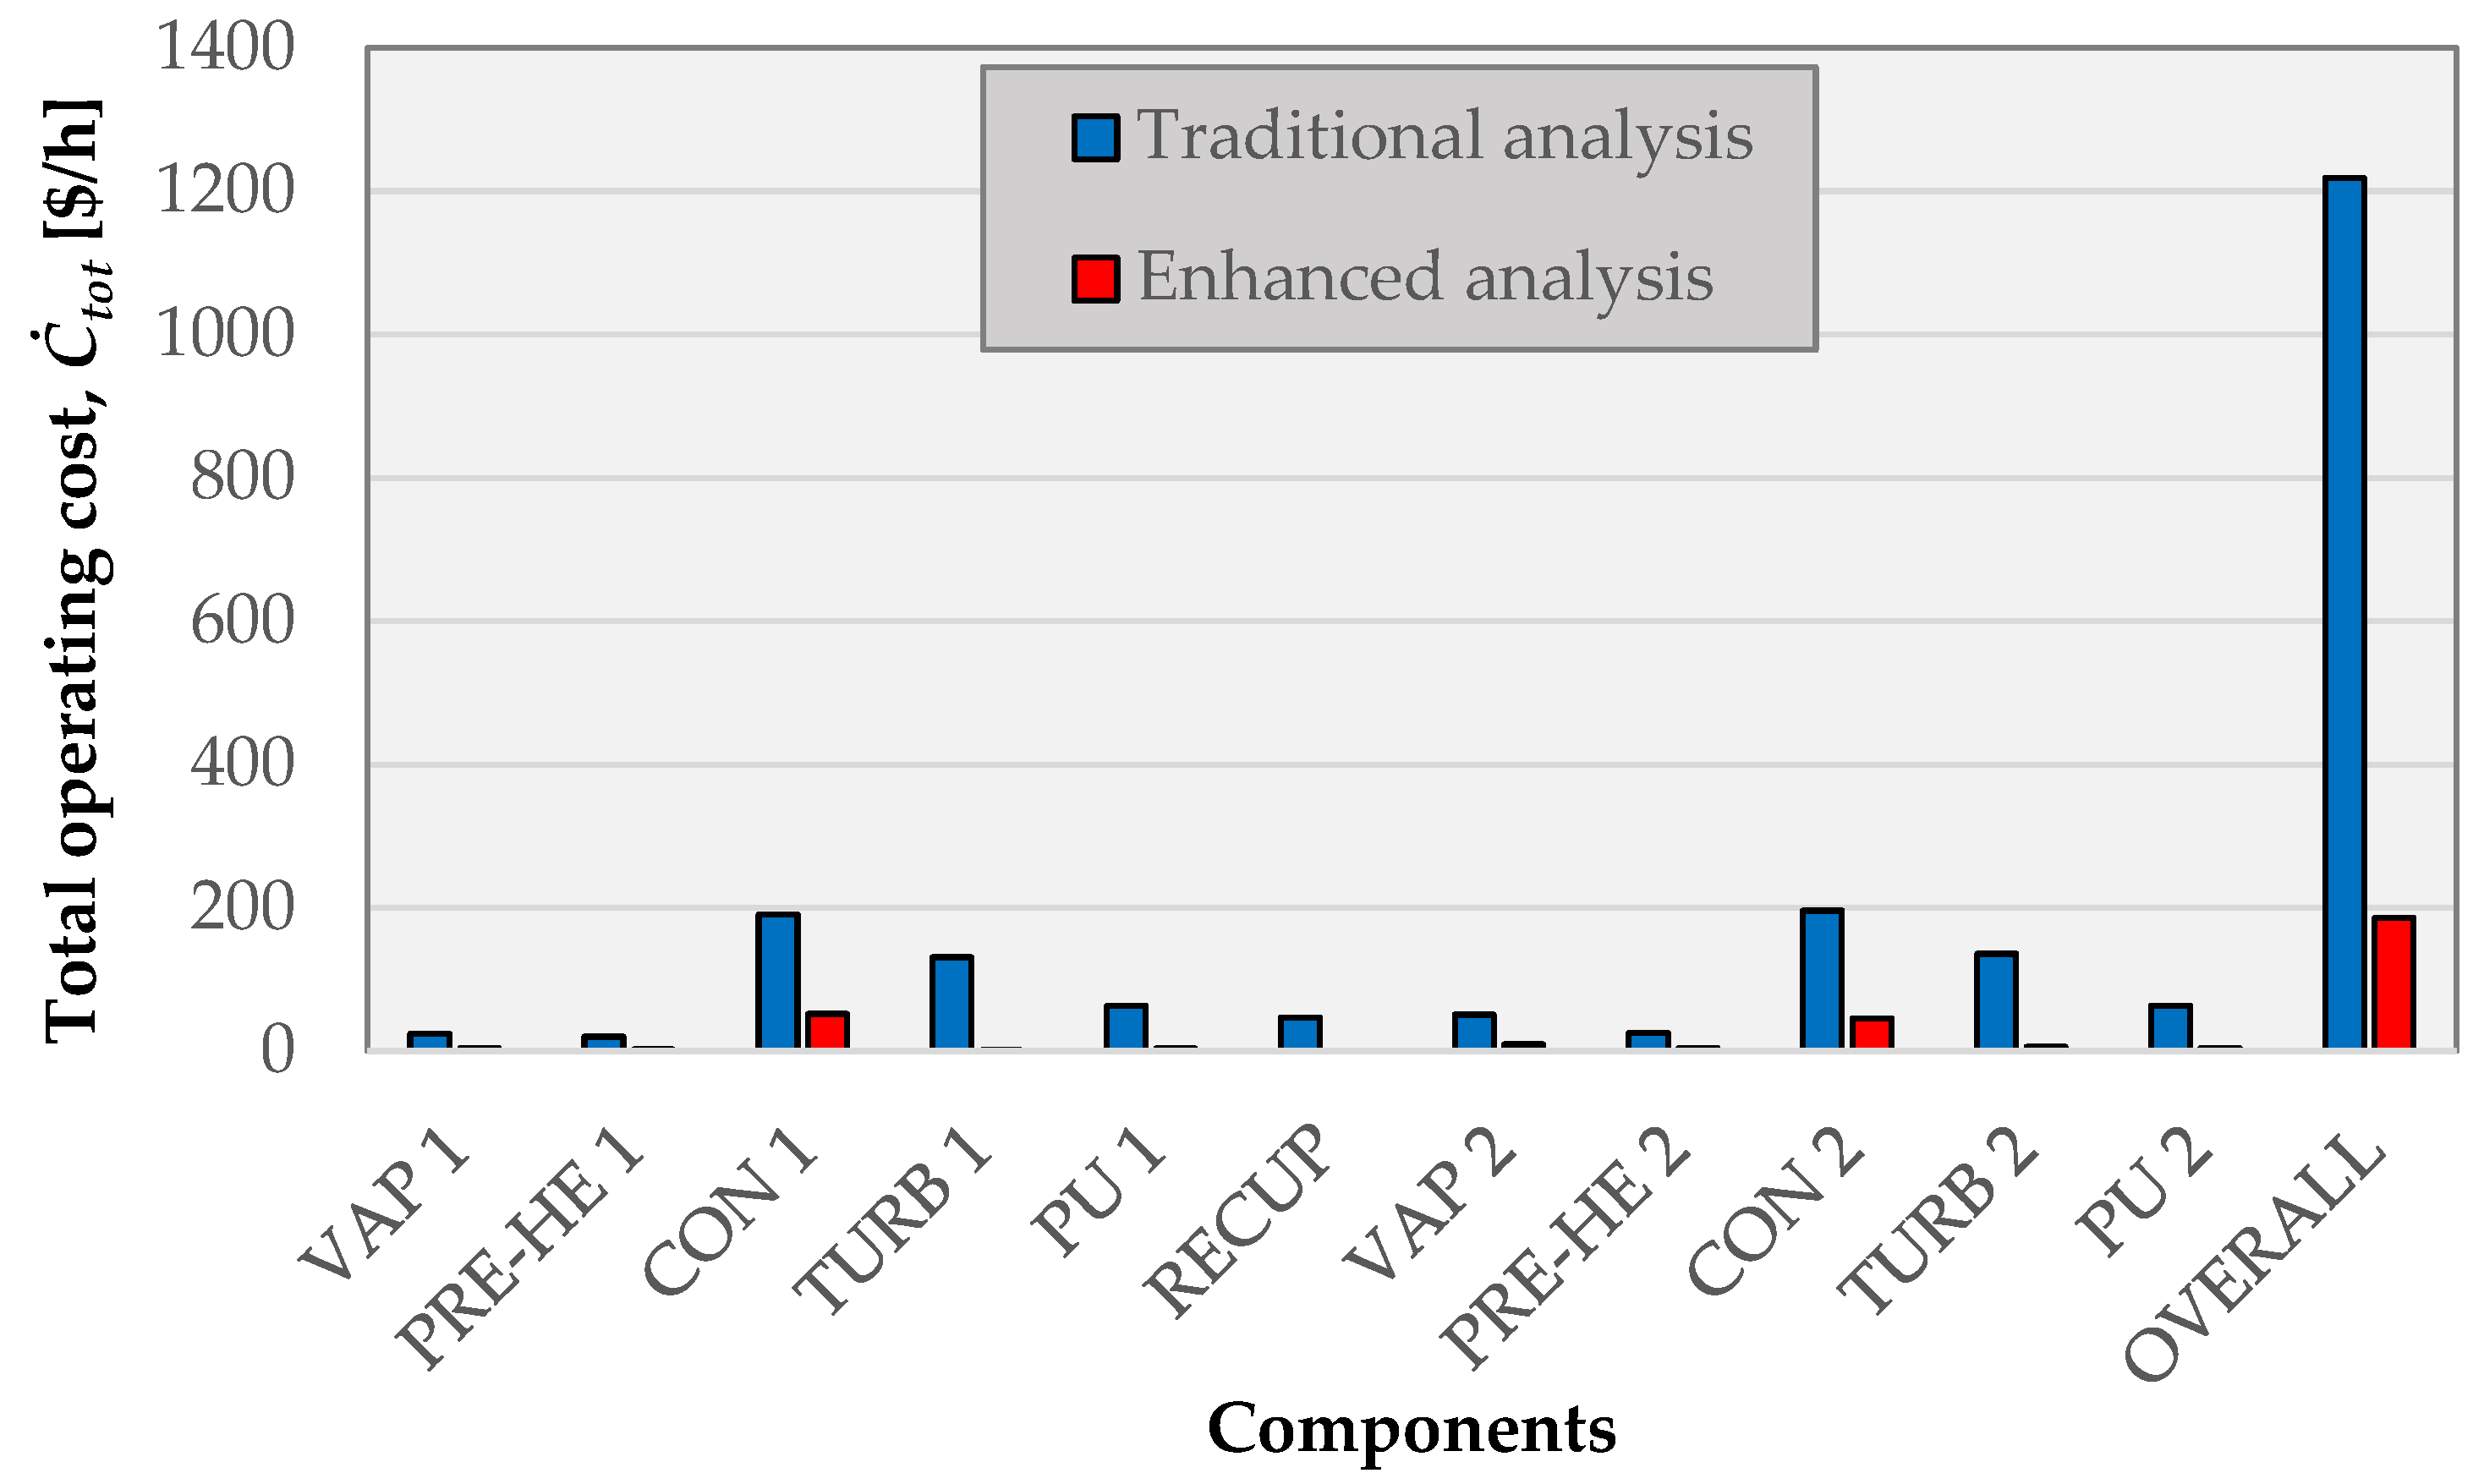
  • While the total operating cost is 1218 USD/h for the TradExEcon analysis, with a decrease of 85% as a result of improvements with the AdvExEcon analysis, it becomes 186 USD/h.
  • As a result of the application of the cost performance trend (e), which is the ratio of the fuel exergy cost to the production exergy cost in the AdvExEcon analysis, the fuel exergy cost was reduced, and this value was reduced from 0.45 to 0.37 times.
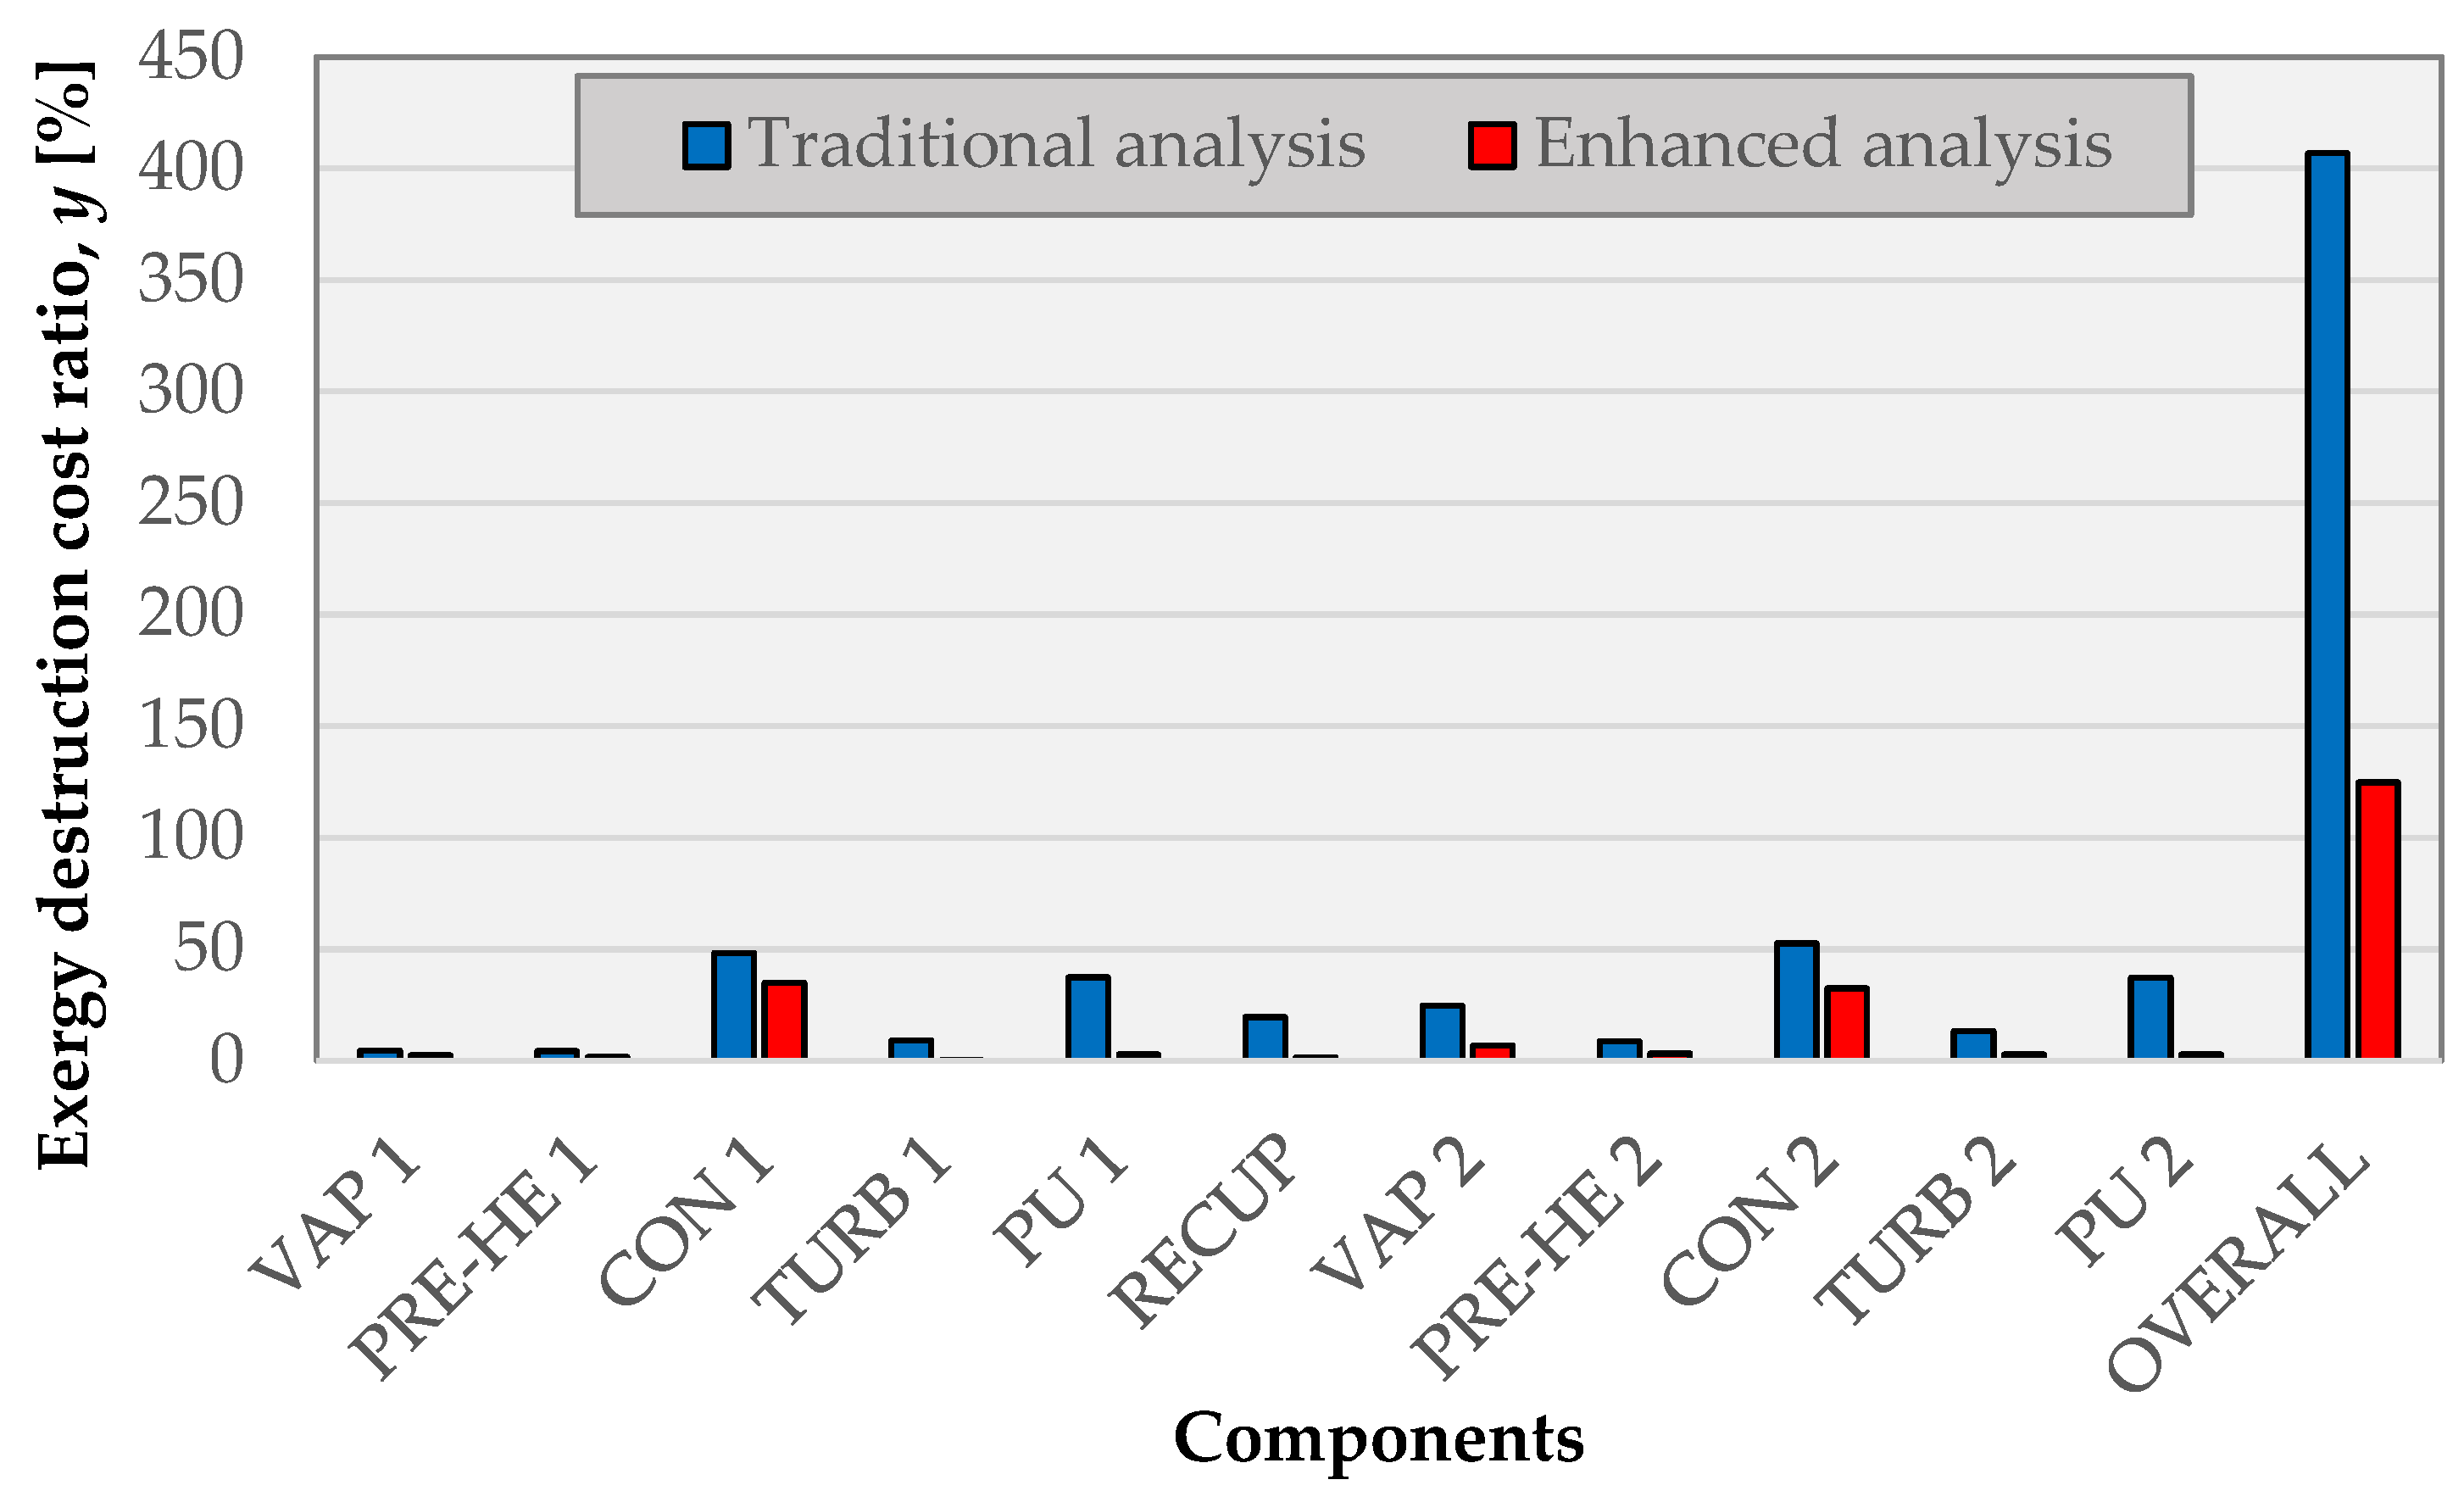
  • The exergy destruction cost ratio (yk) was reduced from 407% with the TradExEcon analysis to 125% with the AdvExEcon analysis. Specifically, the value of PU 2 has been reduced from 37% to 3%.
  • It has been observed that there is a 15% decrease in total operating cost per total electricity generation (Xw), cost per energy of the geothermal fluid entering the GPP (Xbrine), and CO2 emission cost values of the plant and its components with the application of the AdvExEcon analysis to the plant, compared to the TradExEcon analysis.

Author Contributions

Conceptualization, O.V.G.; methodology, A.G.G. and A.K.; validation, O.V.G. and E.Y.G.; formal analysis, A.K.; investigation, O.V.G.; writing—original draft preparation, O.V.G. and E.Y.G.; writing—review and editing, O.V.G., E.Y.G., A.G.G. and A.K.; visualization, A.K.; supervision, A.K. All authors have read and agreed to the published version of the manuscript.

Funding

This research received no external funding.

Data Availability Statement

Not applicable.

Acknowledgments

The authors would like to thank the Sinem Geothermal Energy Production Inc., Turkey, for the support they provided for the present work.

Conflicts of Interest

The authors declare no conflict of interest.

Nomenclature

CCost per exergy unit, USD/GJ
ĊCost rate associated with exergy, USD/h
ECost performance trend (traditional analysis), fold
ĖCost performance trend (enhanced analysis), fold
ĖExergy rate, kJ/s or kW
FExergoeconomic factor (traditional analysis), %
Exergoeconomic factor (enhanced analysis), %
Mass flow rate, kg/s
Total cost-savings potential, %
RRelative cost difference (traditional analysis), %
Relative cost difference (enhanced analysis), %
PPressure, kPa
TTemperature, °C or K
Cost per produced electricity (enhanced analysis), USD/kWh
brineCost per geothermal energy input (enhanced analysis), USD/GJ
CO2Cost per release of CO2 (enhanced analysis), USD/kg
YExergy destruction cost ratio (traditional analysis), %
Exergy destruction cost ratio (enhanced analysis), %
ŻCost rate associated with capital investment, USD/h
Greek symbols
εExergy/exergetic or second law efficiency, %
ηEnergy/energetic or first law efficiency, %
Subscripts
DDestruction
FFuel
isIsentropic
kComponent
LLoss
mechMechanical
PProduct
totTotal/overall
0Reference state
Superscripts
AVAvoidable
ENEndogenous
EXExogenous
RReal
UNunavoidable
Abbreviations
AdExAdvanced exergy analysis
AdExEconAdvanced exergoeconomic analysis
CONCondenser
GENGenerator
GDHSGeothermal district heating system
GPPGeothermal power plant
NCGNoncondensing gas
ORCOrganic Rankine cycle
PPPower plant
PRE-HEPreheater
PUPump
RECUPRecuperator
SCADASupervisory control and data acquisition
TradExTraditional exergy analysis
TradExEconTraditional exergoeconomic analysis
TURBTurbine
VAPVaporizer

References

  1. Gökgedik, H.; Yürüsoy, Y.; Keçebaş, A. Improvement potential of a real geothermal power plant using enhanced exergy analysis. Energy 2016, 112, 254–263. [Google Scholar] [CrossRef]
  2. Özkaraca, O.; Keçebaş, A.; Demircan, C. Comparative thermodynamic evaluation of a geothermal power plant by using the enhanced exergy and artificial bee colony methods. Energy 2018, 156, 169–180. [Google Scholar] [CrossRef]
  3. Kanoğlu, M.; Bolattürk, A. Performance and parametric investigation of a binary geothermal power plant by exergy. Renew. Energy 2008, 33, 2366–2374. [Google Scholar] [CrossRef]
  4. Koroneos, C.; Polyzakis, A.; Xydis, G.; Stylos, N.; Nanaki, E. Exergy analysis for a proposed binary geothermal power plant in Nisyros Island, Greece. Geothermics 2017, 70, 38–46. [Google Scholar] [CrossRef] [Green Version]
  5. Altun, A.F.; Kılıç, M. Thermodynamic performance evaluation of a geothermal ORC power plant. Renew. Energy 2020, 148, 261–274. [Google Scholar] [CrossRef]
  6. Yılmaz, C. Thermoeconomic cost analysis and comparison of methodologies for Dora II binary geothermal power plant. Geothermics 2018, 75, 48–57. [Google Scholar] [CrossRef]
  7. Bina, S.M.; Jalilinasrabady, S.; Fujii, H. Exergoeconomic analysis and optimization of single and double flash cycles for Sabalan geothermal power plant. Geothermics 2017, 72, 74–82. [Google Scholar] [CrossRef]
  8. Kahraman, M.; Olcay, A.B.; Sorgüven, E. Thermodynamic and thermoeconomic analysis of a 21 MW binary type air-cooled geothermal power plant and determination of the effect of ambient temperature variation on the plant performance. Energy Convers. Manag. 2019, 192, 308–320. [Google Scholar] [CrossRef]
  9. Yılmaz, C.; Koyuncu, İ. Thermoeconomic modeling and artificial neural network optimization of Afyon geothermal power plant. Renew. Energy 2021, 163, 1166–1181. [Google Scholar] [CrossRef]
  10. Morosuk, T.; Tsatsaronis, G. Enhanced exergetic evaluation of refrigeration machines using different working fluids. Energy 2009, 34, 2248–2258. [Google Scholar] [CrossRef]
  11. Morosuk, T.; Tsatsaronis, G. Enhanced exergy-based methods used to understand and improve energy-conversion systems. Energy 2019, 169, 238–246. [Google Scholar] [CrossRef]
  12. Keçebaş, A.; Gökgedik, H. Thermodynamic evaluation of a geothermal power plant for enhanced exergy analysis. Energy 2015, 88, 746–755. [Google Scholar] [CrossRef]
  13. Nami, H.; Nemati, A.; Fard, F.J. Conventional and enhanced exergy analyses of a geothermal driven dual fluid organic Rankine cycle (ORC). Appl. Therm. Eng. 2017, 122, 59–70. [Google Scholar] [CrossRef]
  14. Tsatsaronis, G.; Morosuk, T. A general exergy-based method for combining a cost analysis with an environmental impact analysis. Part I—Theoretical development. In Proceedings of the ASME IMECE, Boston, MA, USA, 31 October–6 November 2008; pp. 453–462. [Google Scholar]
  15. Tsatsaronis, G.; Park, M. On avoidable and unavoidable exergy destructions and investment costs in thermal systems. Energy Convers. Manag. 2002, 43, 1259–1270. [Google Scholar] [CrossRef]
  16. Wei, Z.; Zhang, B.; Wu, S.; Chen, Q.; Tsatsaronis, G. Energy-use analysis and evaluation of distillation systems through avoidable exergy destruction and investment costs. Energy 2012, 42, 424–433. [Google Scholar] [CrossRef]
  17. Vuckovic, G.D.; Vukic, M.V.; Stojiljkovic, M.M.; Vuckovic, D.D. Avoidable and unavoidable exergy destruction and exergoeconomic evaluation of the thermal processes in a real industrial plant. Therm. Sci. 2012, 16, 433–446. [Google Scholar] [CrossRef]
  18. Manesh, M.H.K.; Navida, P.; Marigorta, A.M.B.; Amidpour, M.; Hamedi, M.H. New procedure for optimal design and evaluation of cogeneration system based on enhanced exergoeconomic and exergoenvironmental analyses. Energy 2013, 59, 314–333. [Google Scholar] [CrossRef]
  19. Petrakopoulou, F.; Tsatsaronis, G.; Morosuk, T. Evaluation of a power plant with chemical looping combustion using an enhanced exergoeconomic analysis. Sustain. Energy Technol. Assess. 2013, 3, 9–16. [Google Scholar]
  20. Keçebaş, A.; Hepbaşlı, A. Conventional and enhanced exergoeconomic analyses of geothermal district heating systems. Energy Build. 2014, 69, 434–441. [Google Scholar] [CrossRef]
  21. Tan, M.; Keçebaş, A. Thermodynamic and economic evaluations of a geothermal district heating system using enhanced exergy-based methods. Energy Convers. Manag. 2014, 77, 504–513. [Google Scholar] [CrossRef]
  22. Açıkkalp, E.; Aras, H.; Hepbaşlı, A. Enhanced exergoeconomic analysis of an electricity-generating facility that operates with natural gas. Energy Convers. Manag. 2014, 78, 452–460. [Google Scholar] [CrossRef]
  23. Açıkkalp, E.; Hepbaşlı, A.; Yücer, C.T.; Karakoç, T.H. Enhanced life cycle integrated exergoeconomic analysis of building heating systems: An application and proposing new indices. J. Clean. Prod. 2018, 195, 851–860. [Google Scholar] [CrossRef]
  24. Liu, Z.; Liu, Z.; Cao, X.; Luo, T.; Yang, X. Enhanced exergoeconomic evaluation on supercritical carbon dioxide recompression Brayton cycle. J. Clean. Prod. 2020, 256, 120537. [Google Scholar] [CrossRef]
  25. Oyekale, J.; Petrollese, M.; Cau, G. Modified auxiliary exergy costing in enhanced exergoeconomic analysis applied to a hybrid solar-biomass organic Rankine cycle plant. Appl. Energy 2020, 268, 114888. [Google Scholar] [CrossRef]
  26. Wang, Y.; Liu, Y.; Liu, X.; Zhang, W.; Cui, P.; Yu, M.; Liu, Z.; Zhu, Z.; Yang, S. Enhanced exergy and exergoeconomic analyses of a cascade absorption heat transformer for the recovery of low grade waste heat. Energy Convers. Manag. 2020, 205, 112392. [Google Scholar] [CrossRef]
  27. Holman, J.P. Experimental Methods for Engineers, 8th ed.; McGraw Hill Inc.: New York, NY, USA, 2011. [Google Scholar]
  28. Cziesla, F.; Tsatsaronis, G.; Gao, Z. Avoidable thermodynamic inefficiencies and cost in an externally fired combined cycle power plant. Energy 2006, 31, 1472–1489. [Google Scholar] [CrossRef]
  29. Tsatsaronis, G.; Kelly, S.; Morosuk, T. Endogenous and exogenous exergy destruction in thermal systems. In Proceedings of the ASME International Mechanical Engineering Congress and Exposition, Chicago, IL, USA, 5–10 November 2006. [Google Scholar]
  30. Morosuk, T.; Tsatsaronis, G. How to calculate the parts of exergy destruction in an enhanced exergetic analysis? In Proceedings of the 21st International Conference on Efficiency, Costs, Optimization, Simulation and Environmental Impact of Energy Systems, Cracow-Gliwice, Poland, 24–27 June 2008. [Google Scholar]
  31. Kelly, S.; Tsatsaronis, G.; Morosuk, T. Enhanced exergetic analysis: Approaches for splitting the exergy destruction into endogenous and exogenous parts. Energy 2009, 34, 384–391. [Google Scholar] [CrossRef]
  32. Ghasemiasl, R.; Javadi, M.A.; Nezamabadi, M.; Sharifpur, M. Exergetic and economic optimization of a solar-based cogeneration system applicable for desalination and power production. J. Therm. Anal. Calorim. 2021, 145, 993–1003. [Google Scholar] [CrossRef]
  33. Petrakopoulou, F.; Tsatsaronis, G.; Morosuk, T.; Carassai, A. Conventional and enhanced exergetic analyses applied to a combined cycle power plant. Energy 2012, 41, 146–152. [Google Scholar] [CrossRef]
  34. Tsatsaronis, G.; Morosuk, T. A general exergy-based method for combining a cost analysis with an environmental impact analysis. Part II—Application to a cogeneration system. In Proceedings of the ASME International Mechanical Engineering Congress and Exposition, Boston, MA, USA, 31 October–6 November 2008; pp. 463–469. [Google Scholar]
  35. Tsatsaronis, G.; Morosuk, T. Enhanced exergoeconomic evaluation and its application to compression refrigeration machines. In Proceedings of the ASME International Mechanical Engineering Congress and Exposition, Seattle, WA, USA, 11–15 November 2007. [Google Scholar]
  36. Petrakopoulou, F.; Tsatsaronis, G.; Morosuk, T.; Carassai, A. Enhanced exergoeconomic analysis applied to a complex energy conversion system. In Proceedings of the ASME International Mechanical Engineering Congress and Exposition, Vancouver, BC, Canada, 12–18 November 2010. [Google Scholar]
  37. Kelly, S. Energy Systems Improvement Based on Endogenous and Exogenous Exergy Destruction. Ph.D. Thesis, Technische Universitat Berlin, Berlin, Germany, 2008. [Google Scholar]
  38. Petrakopoulou, F. Comparative Evaluation of Power Plants with CO2 Capture: Thermodynamic, Economic and Environmental Performance. Ph.D. Thesis, Technische Universitat Berlin, Berlin, Germany, 2010. [Google Scholar]
  39. Lazzaretto, A.; Tsatsaronis, G. SPECO: A systematic and general methodology for calculating efficiencies and costs in thermal systems. Energy 2006, 31, 1257–1289. [Google Scholar] [CrossRef]
Figure 1. Schematic diagram of the Sinem GPP in Turkey.
Energies 16 03466 g001
Figure 2. Change in total operating cost for the components for both analyses.
Energies 16 03466 g002
Figure 3. Change in relative cost difference for the components for both analyses.
Energies 16 03466 g003
Figure 4. Change in exergoeconomic factor for the components for both analyses.
Energies 16 03466 g004
Figure 5. Change in cost performance trend for the components for both analyses.
Energies 16 03466 g005
Figure 6. Change in exergy destruction cost ratio for the components for both analyses.
Energies 16 03466 g006
Figure 7. Change in cost per produced electricity for the components for both analyses.
Energies 16 03466 g007
Figure 8. Change in cost per geothermal energy input for the components for both analyses.
Energies 16 03466 g008
Figure 9. Change in cost per release of CO2 for the components for both analyses.
Energies 16 03466 g009
Figure 10. Change in saving potential for the system and its components with the AdvEx-based analysis.
Energies 16 03466 g010
Table 1. The thermodynamics variables at different steam points for the Sinem GPP.
Steam, jFluid TypeTj (°C)Pj (kPa)j (kg/s)Ėj (kW)
0Dead state18101.325--
1Brine164104044552,693
1′Brine—steam16510405.83699
1′NCG16510402.50380
2Brine13673044536,010
3Brine11069044522,589
4Brine110690222.5011,295
5Brine110690222.5011,295
6Brine89590222.507021
7Brine81570222.505616
8Brine8559044512,447
9Brine1076900.8340
10Brine—steam1076905.25253
10NCG1076902.25257
11n-pentane10512611604776
12n-pentane137126116020,142
13n-pentane821501607237
14n-pentane601501606193
15n-pentane31150160123
16n-pentane371261160520
17n-pentane5512611601141
18n-pentane1066871695018
19n-pentane10968716916,512
20n-pentane691191695713
21n-pentane33119169157
22n-pentane39687169431
23Air1810120000
24Air1910620008048
25Air1810120000
26Air1910620008048
Table 2. The parameters utilized for the AdvExEcon analysis of the Sinem GPP.
ComponentsUnavoidable ConditionsIdeal ConditionsParameters Used in Determining
Unavoidable costs
ComponentsUnavoidable ConditionsIdeal ConditionsParameters Used in Determining
Unavoidable Costs
LEVEL ILEVEL II
VAP 1ΔTpinch = 6 K
ΔPmin = 10 kPa
ΔTmin = 0 K
ΔPmin = 0 kPa
ΔTmin = 15 K
ΔPmin = ΔPreal
VAP 2ΔTpinch = 5 K
ΔPmin = 10 kPa
ΔTmin = 0 K
ΔPmin = 0 kPa
ΔTmin = 15 K
ΔPmin = ΔPreal
PRE-HE 1ΔTpinch = 43 K
ΔPmin = 10 kPa
ΔTpinch = 0 K
ΔPmin = 0 kPa
ΔTmin = 15 K
ΔPmin = ΔPreal
PRE-HE 2ΔTpinch = 5 K
ΔPmin = 10 kPa
ΔTpinch = 0 K
ΔPmin = 0 kPa
ΔTmin = 15 K
ΔPmin = ΔPreal
CON 1ΔTpinch = 3 K
ΔPmin = 10 kPa
ΔTpinch = 0 K
ΔPmin = 0 kPa
ΔTmin = 15 K
ΔPmin = ΔPreal
CON 2ΔTpinch = 3 K
ΔPmin = 10 kPa
ΔTpinch = 0 K
ΔPmin = 0 kPa
ΔTmin = 15 K
ΔPmin = ΔPreal
TURB 1ηis = 93%
ηmech = 100%
ηis = 100%
ηmech = 100%
75% of Z ˙ T U R B   1 TURB 2ηis = 93%
ηmech = 100%
ηis = 100%
ηmech = 100%
75% of Z ˙ T U R B   2
PU 1ηis = 82%
ηmech = 100%
ηis = 100%
ηmech = 100%
75% of Z ˙ P U   1 PU 2ηis = 77%
ηmech = 100%
ηis = 100%
ηmech = 100%
75% of Z ˙ P U   2
RECUPΔTpinch = 5 K
ΔPmin = 10 kPa
ΔTpinch = 0 K
ΔPmin = 0 kPa
ΔTmin = 15 K
ΔPmin = ΔPreal
Table 3. The performance markers of the system for the TradExEcon and AdvExEcon analyses.
EvaluatorsTradExEcon AnalysisAdvExEcon Analysis
Total operating cost (USD/h) C ˙ t o t , k = Y Z ˙ k + C ˙ D , k C ˙ t o t , k A V , E N = Z ˙ k A V , E N + C ˙ D , k A V , E N
Relative cost difference (%) r k = c P , k c F , k c F , k r ˙ k = Z ˙ k A V , E N + C ˙ D , k A V , E N c F , k × E ˙ x P , k A V , E N
Exergoeconomic factor (%) f k = Z ˙ k Z ˙ k + C ˙ D , k = Z ˙ k C ˙ t o t , k f ˙ k = Z ˙ k A V , E N Z ˙ k A V , E N + C ˙ D , k A V , E N = Z ˙ k A V , E N C ˙ t o t , k A V , E N
Cost performance trend (fold) e k = C ˙ P , k C ˙ F , k e ˙ k = C ˙ P , k C ˙ F , k C ˙ t o t , k U N C ˙ t o t , k A V , E X
Exergy destruction cost ratio (%) y k = C ˙ D , k C ˙ F , t o t y ˙ k = C ˙ D , k A V , E N C ˙ F , t o t
Total cost-savings potential (%)- p ˙ k = C ˙ t o t , k A V , E N C ˙ t o t , k
Cost per produced electricity (USD/kWh) x W ˙ = C ˙ t o t , k W ˙ n e t x ˙ W ˙ = C ˙ t o t , k U N + C ˙ t o t , k A V , E X W ˙ n e t
Cost per geothermal energy input (USD/GJ) x b r i n e = C ˙ t o t , k Q ˙ i n , b r i n e x ˙ b r i n e = C ˙ t o t , k U N + C ˙ t o t , k A V , E X Q ˙ i n , b r i n e
Cost per release of CO2 (USD/kg) x C O 2 = C ˙ t o t , k m ˙ o u t , C O 2 x ˙ C O 2 = C ˙ t o t , k U N + C ˙ t o t , k A V , E X m ˙ o u t , C O 2
Table 4. The outlined findings of the TradEx and TradExEcon analyses for all the components in the Sinem GPP.
ComponentsTradEx Analysis Results TradExEcon Analysis Results
ĖF,k
(kW)
ĖP,k
(kW)
ĖD,k
(kW)
εk
(%)
cF,k
(USD/GJ)
cP,k
(USD/GJ)
ĊD,k
(USD/h)
Żk
(USD/h)
Ċtot,k
(USD/h)
fk
(%)
LEVEL I
VAP 116,682.3815,365.761316.6192.111.201.815.6918.6024.2976.58
PRE-HE 14273.643634.71638.9385.052.383.905.4714.4519.9272.55
CON 16069.494094.421975.0667.468.503.7560.45130.06190.5168.27
TURB 112,908.3412,066.15842.1993.483.756.7611.36119.46130.8291.32
PU 12323.60397.531926.0417.116.7657.8246.8516.5563.4026.10
RECUP1041.22621.05420.1759.6516.193.7524.4922.1246.6147.46
LEVEL II
VAP 213,950.3411494.182456.1682.393.480.0230.8019.8850.6839.23
PRE-HE 25678.414586.551091.8680.772.764.2910.8614.4525.3157.10
CON 25553.703062.962490.7555.157.352.5665.94130.06196.0066.36
TURB 210,801.989000.321801.6583.322.566.7616.59119.46136.0587.80
PU 22192.20274.951917.2612.546.7679.9846.6416.5563.1926.19
OVERALL
SYSTEM
53,771.7321,028.5616,876.6939.118.409.73510.55707.831218.3858.10
ĖL,tot = 15,866.48 kW and ĊL,tot = 479.99 USD/h for the overall system.
Table 5. The AdvEx analysis findings for all the components of the Sinem GPP.
Component, k E ˙ x D , k E N (kW) E ˙ x D , k E X (kW) E ˙ x D , k A V (kW) E ˙ x D , k U N (kW) E ˙ x D , k U N E ˙ x D , k A V ε m o d i f i e d , k (%)
E ˙ x D , k U N , E N (kW) E ˙ x D , k U N , E X (kW) E ˙ x D , k A V , E N (kW) E ˙ x D , k A V , E X (kW)
LEVEL I
VAP 1844.42472.191095.44221.17141.4379.75703.01392.4295.62
PRE-HE 1353.34285.59359.98278.95102.94176.01250.40109.5893.55
CON 11551.15423.911442.77532.29122.75409.541428.4014.3774.14
TURB 1692.86149.3343.32798.87657.17141.7035.707.6399.71
PU 1757.581168.46309.511616.53609.721006.81147.86161.6572.89
RECUP224.25195.9268.06352.11256.9695.1552.3715.6992.22
LEVEL II
VAP 21614.73841.43708.131748.03940.63807.40674.1034.0394.46
PRE-HE 2576.79515.07641.86450.00167.56282.44394.81247.0592.07
CON 21647.90842.851928.88561.87109.20452.661538.69390.1966.56
TURB 21243.81557.84563.161238.49855.01383.49388.80174.3595.86
PU 2457.051460.21460.831456.43316.051140.38141.00319.8366.10
OVERALL SYSTEM12105.424772.097585.919291.606929.242362.395176.212409.7349.98
Table 6. The findings of the AdvExEcon analysis for the exergy destruction cost rates of all the components.
Component, k C ˙ D , k (USD/h) C ˙ D , k E N (USD/h) C ˙ D , k E X (USD/h) C ˙ D , k U N (USD/h) C ˙ D , k A V (USD/h) C ˙ D , k U N C ˙ D , k A V
C ˙ D , k U N , E N (USD/h) C ˙ D , k U N , E X (USD/h) C ˙ D , k A V , E N (USD/h) C ˙ D , k A V , E X (USD/h)
LEVEL I
VAP 15.6903.6482.040.964.730.610.343.041.70
PRE-HE 15.4703.0272.442.393.080.881.512.150.93
CON 160.45047.46512.9816.2944.163.7612.5343.710.45
TURB 111.3609.3542.0110.780.588.871.910.480.09
PU 146.85018.43628.4139.347.5114.8424.503.603.91
RECUP24.49013.07011.4220.523.9714.985.55−1.915.87
LEVEL II
VAP 230.80020.22910.5721.908.9011.7810.128.450.46
PRE-HE 210.8605.7315.134.476.391.662.814.072.32
CON 265.94043.60322.3414.8751.072.8911.9840.7110.36
TURB 216.59011.4635.1311.415.187.883.533.581.59
PU 246.64011.12335.5235.4411.207.6927.753.437.76
OVERALL
SYSTEM
510.550366.068144.48280.98229.57209.5471.44156.5373.04
Table 7. Results of the AdvExEcon analysis for the investment cost rates of all the components.
Component, k Z ˙ D , k (USD/h) Z ˙ D , k E N (USD/h) Z ˙ D , k E X (USD/h) Z ˙ D , k U N (USD/h) Z ˙ D , k A V (USD/h) Z ˙ D , k U N Z ˙ D , k A V
Z ˙ D , k U N , E N (USD/h) Z ˙ D , k U N , E X (USD/h) Z ˙ D , k A V , E N (USD/h) Z ˙ D , k A V , E X (USD/h)
LEVEL I
VAP 118.60017.9980.60216.3462.25416.892−0.5471.1061.148
PRE-HE 114.45013.7080.74212.6161.83413.298−0.6830.4101.424
CON 1130.060114.90915.15194.00036.060106.393−12.3948.51627.544
TURB 1119.460109.43310.02799.67919.781108.813−9.1330.62119.160
PU 116.55016.4410.10916.1330.41716.241−0.1070.2000.216
RECUP22.12019.7742.34616.3265.79418.263−1.9371.5114.283
LEVEL II
VAP 219.88017.9981.88215.3624.51816.969−1.6061.0293.489
PRE-HE 214.45013.4600.99012.4372.01313.352−0.9150.1081.905
CON 2130.060114.69515.36596.93833.122109.925−12.9864.77028.352
TURB 2119.460110.3229.13899.70619.754107.965−8.2592.35717.397
PU 216.55015.3821.16813.7402.81014.783−1.0430.5992.211
OVERALL
SYSTEM
707.830674.41133.419614.59593.235645.049−30.45429.36263.873
Disclaimer/Publisher’s Note: The statements, opinions and data contained in all publications are solely those of the individual author(s) and contributor(s) and not of MDPI and/or the editor(s). MDPI and/or the editor(s) disclaim responsibility for any injury to people or property resulting from any ideas, methods, instructions or products referred to in the content.

