Article

Dual Sagnac Interferometer Distributed Optical Fiber Localization Method Based on Hilbert–Huang Transform

1
College of Electronic Information Engineering, Hebei University, Baoding 071002, China
2
Key Laboratory of Opto-Electronic Information Technology, Ministry of Education, Tianjin University, Tianjin 300072, China
3
State Grid Shanxi Electric Power Corporation, Taiyuan 032100, China
4
Science and Technology Department, Hebei University, Baoding 071002, China
*
Author to whom correspondence should be addressed.
These authors contributed equally to this work.
Energies 2023, 16(8), 3494; https://doi.org/10.3390/en16083494
Submission received: 28 January 2023 / Revised: 12 March 2023 / Accepted: 12 April 2023 / Published: 17 April 2023

Abstract

:
In order to solve the problem that the dual Mach Zehnder (M-Z) interferometer system is easily affected by external environmental noise, a data signal-processing scheme based on Hilbert–Huang transform (HHT) is proposed to achieve high-precision location with distributed optical fibers. The polarization compensation module has a built-in dual Sagnac interferometer system which is used to stabilize the polarization state of the Sagnac interferometer. The eigenmode function is obtained by empirical mode decomposition of the received two optical signals, and then the Hilbert spectrum is obtained by superimposing the Hilbert transform, so that the high-similarity curve caused by the vibration signal can be clearly and intuitively extracted. The optical signal information can be calculated based on the cross-correlation and delay estimation algorithm to accurately obtain the vibration position information. The experimental results show that the positioning accuracy can reach ±11 m, with a sensing fiber length of 15 km and a sampling rate of 10 MHz. It is proven that the distributed optical fiber sensing technology based on the dual Sagnac interferometer system has high practical application value.

1. Introduction

The high-voltage cable is one of the most important pieces of equipment for carrying out large-capacity and long-distance transmission. The precise location of partial discharge (PD) sources in power cables is of great significance to ensure the stable operation of the power grid. Considering their limiting factors of sensing distance, spatial resolution, and measurement speed, the performance improvement of four main types of Brillouin distributed optical fiber sensing technologies has been analyzed [1]. The improvement of initial localization accuracy can be achieved by the designed rapid localization method of abnormal nodes in a distributed optical fiber sensor network [2,3]. It is proposed that the position of ultrasonic emission source detected by an optical fiber sensing probe can be evaluated based on the arrival time of the partial discharge signal detected by the optical fiber sensing system [4,5], which was creatively applied inside an oil-immersed 35 kV transformer through high integration with the winding wire [6,7]. A Brillouin optical correlation domain analysis method based on a distributed fiber optic sensor system shows high resolution and the capability of continuously monitoring a whole or specified section within 2 km range [8,9]. The hybrid Michelson–Sagnak interferometer is designed to improve the accuracy when approaching the midpoint of the Sagnak ring [10]. Several optical fiber sensors were bonded to the pipe surface with the same interval, forming a sensor array, and a hoop strain nephogram was created to show the insulation level and insulation defect location [11,12,13]. There is an ultra-long distributed fiber vibration sensing system using unidirectional forward transmission of a continuous-wave signal, and coherent detection with digital signal processing was proposed. This demonstrates the localization of single-point and multi-point vibrations with measurement errors of less than ±100 m and ±200 m, respectively, over a 500 km sensing range [14,15]. A distributed fiber optic sensor based on dual-Michelson interferometers for disturbance localization and pattern recognition is proposed for multi-intrusion monitoring. When the total transmission distance of the system is 100 km, the locating deviations are less than ±35 m, and the correct rate of four pattern recognitions is higher than 97% [16,17]. The distributed optical fiber sensing equipment was used to measure the normal zone propagation and hot spot location of a sample cable bathing in liquid nitrogen, and the quench propagation characteristics of the cable can be accurately expressed [18]. A combination of three different algorithms for polarization–diversity receiving in a phase-sensitive optical time-domain reflectometry (phi-OTDR) system is established [19,20]. A high recognition rate for different types of damaged bags is obtained for the proposed system, and the recognition accuracy is more than 90% [21]; the pipeline safety early warning systems, based on distributed optical fiber sensors, are used to recognize and locate third-party events that may damage long-distance energy transportation pipelines [22].
A new smooth threshold function is constructed to improve the accuracy of the lightning strike location in a distributed optical fiber network problem [23], and the phase-sensitive optical time domain reflectometer is researched on partial discharge in a cable joint [24]. Then, the distributed fiber optic acoustic sensors are used to locate artificial intrusion event signals at two different sites, and these signals are identified by the ratio of long and short windows [25]. A wind vibration monitoring device for transmission lines based on multi-parameter distributed optical fiber sensing is proposed. It shows that the wind vibration of each section along the transmission line and the changes in the internal stress of the line can be simultaneously monitored. The positioning accuracy within 60 km is ±50 m [26]. A data signal-processing scheme based on Hilbert–Huang transform has been proposed for realizing high-precision distributed optical fiber vibration localization detection. With a sensing fiber length of 2 km and a sampling rate of 10 MHz, the positioning accuracy is less than 10 m [27]. Solar daylighting systems based on low cost thermoplastic optical fiber cables are an essential and practicable option for saving energy [28]. A distributed optical fiber disturbance sensing system based on a double Sagnac interferometer is used in an optical fiber loop of 1.3 km [29]. It is proven that the wavelength division multiplexing sensor has the potential to realize positioning in a single optical cable [30]. A data-processing algorithm without filtering is proposed for the distributed optical fiber sensor based on Sagnac interferometer, and the measurement accuracy of 24 m is achieved for the SMF sensing optical fiber of 25.4 km [31]. It is verified that the single and multiple interference points can be located by the trained model based on deep learning technology [32]. It can be seen that there is no effective experimental method for monitoring the insulation state of long-distance interference signal. The precise localization of interference signal with optical fiber sensing needs further research and experimental verification.
In this paper, a data signal-processing scheme based on the Hilbert–Huang transform is proposed to realize high-precision distributed optical fiber vibration location detection. The polarization compensation module is added in the system to analyze the stability of the polarization state of the Sagnac interferometer. A time-delay estimation algorithm is proposed to obtain the ultrasonic vibration position of disturbance signal by constructing two time-delay signals. The position detection is carried out to verify the positioning accuracy of vibration position and the effectiveness of the cross-correlation data algorithm. An effective monitoring method is provided for the operation status of long-distance disturbance signal.

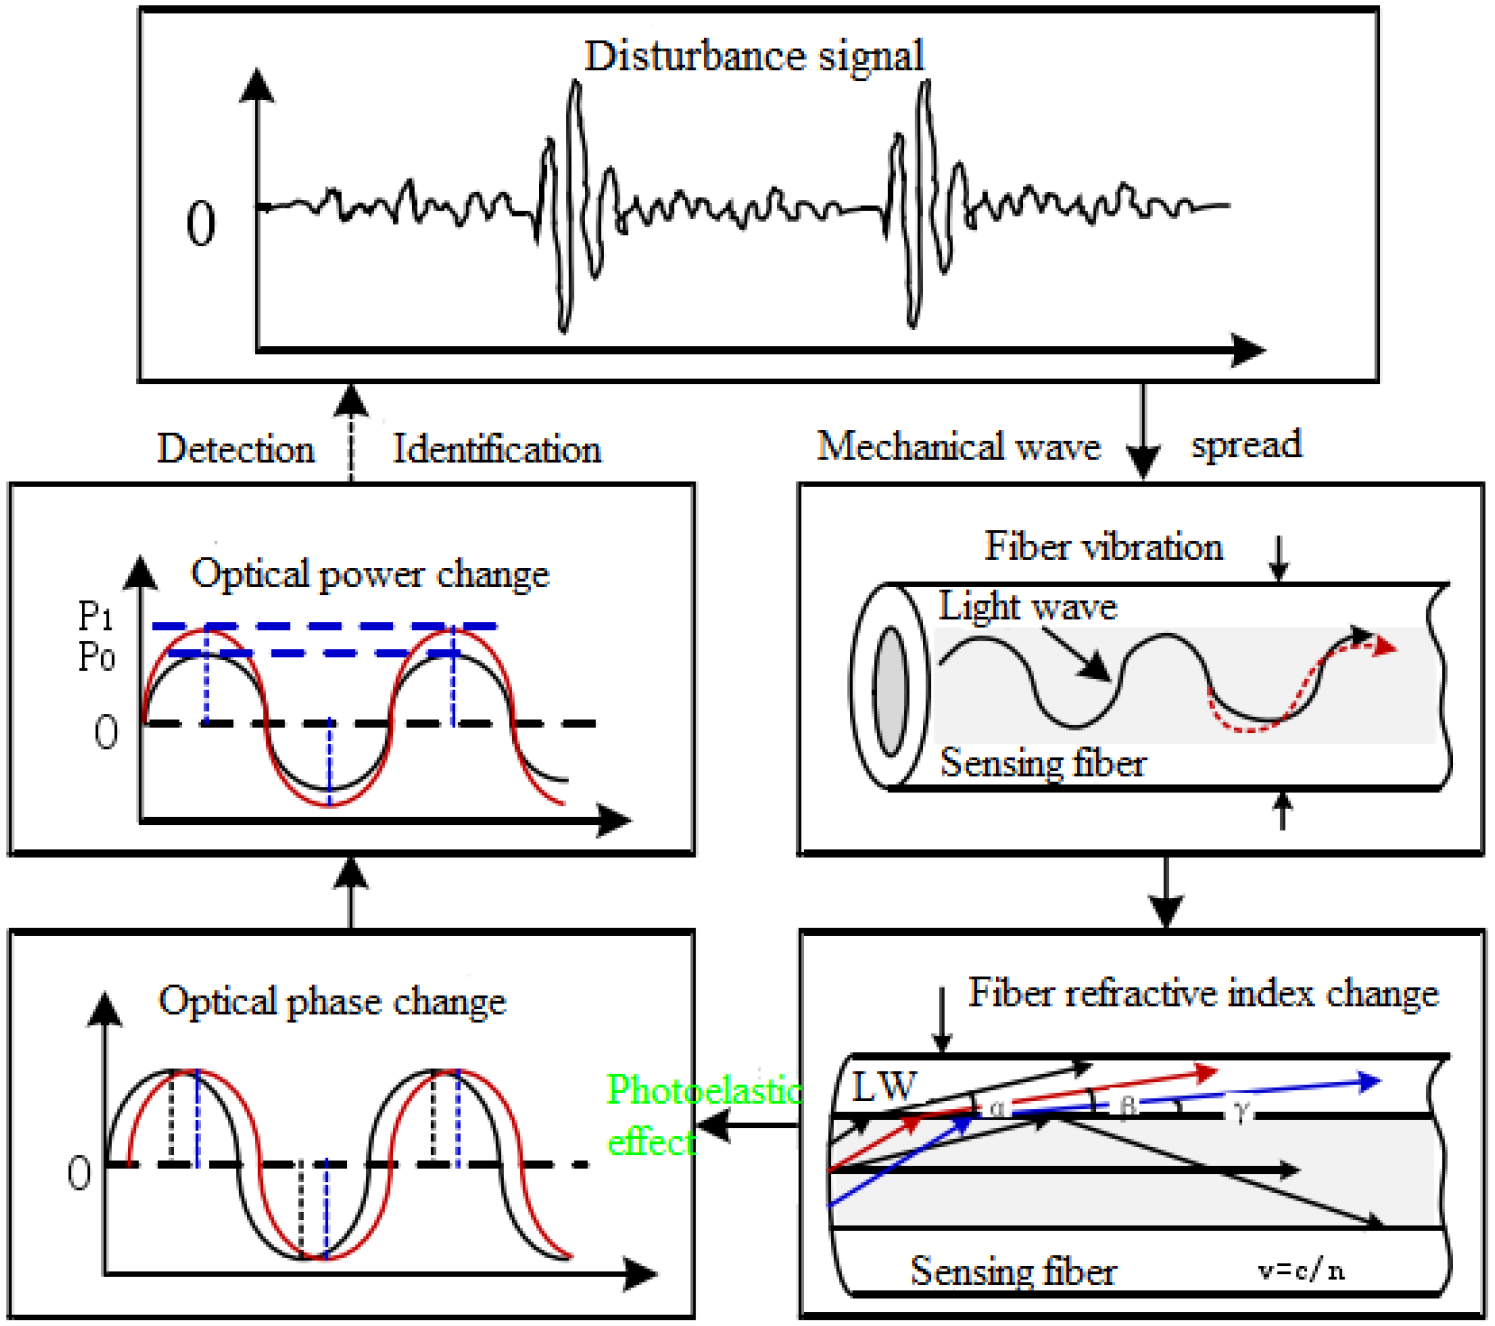
2. Analysis of Optical Fiber Sensing the Interference Signal

2.1. Optical Fiber Sensor Positioning Detection Analysis

The detection principle of the interference signal is shown in Figure 1. The “perception” and “transmission” of the interference signal can be realized by the optical fiber. When the vibration and shock signal of the interference signal occur, the information is transmitted to the signal-processing center through the optical fiber loop. The mechanical vibration of the optical fiber will be caused by the ultrasonic signal from the partial discharge, while the refractive index of the optical fiber will be changed. The phase of the light in the fiber changes because of the photoelastic effect, which in turn causes a change in the power of the light. The condition for interference is that the frequency and vibration direction of the two beams are equivalent, and the phase difference between them is constant. The time-varying interference at the non-central position acting on the system can be located by Sagnac interferometer. The Sagnac interferometer is laid parallel to the cable connector; when partial discharge occurs on the cable connector, a vibration pulse with a wide spectrum will be generated on the sensing optical fiber. The point of partial discharge can be accurately determined according to the zero point on the frequency response of the interference system. The optical interference is received by two photodetectors, and the optical signal is converted into electrical signal, which is sampled by the acquisition card and sent to the computer for processing.

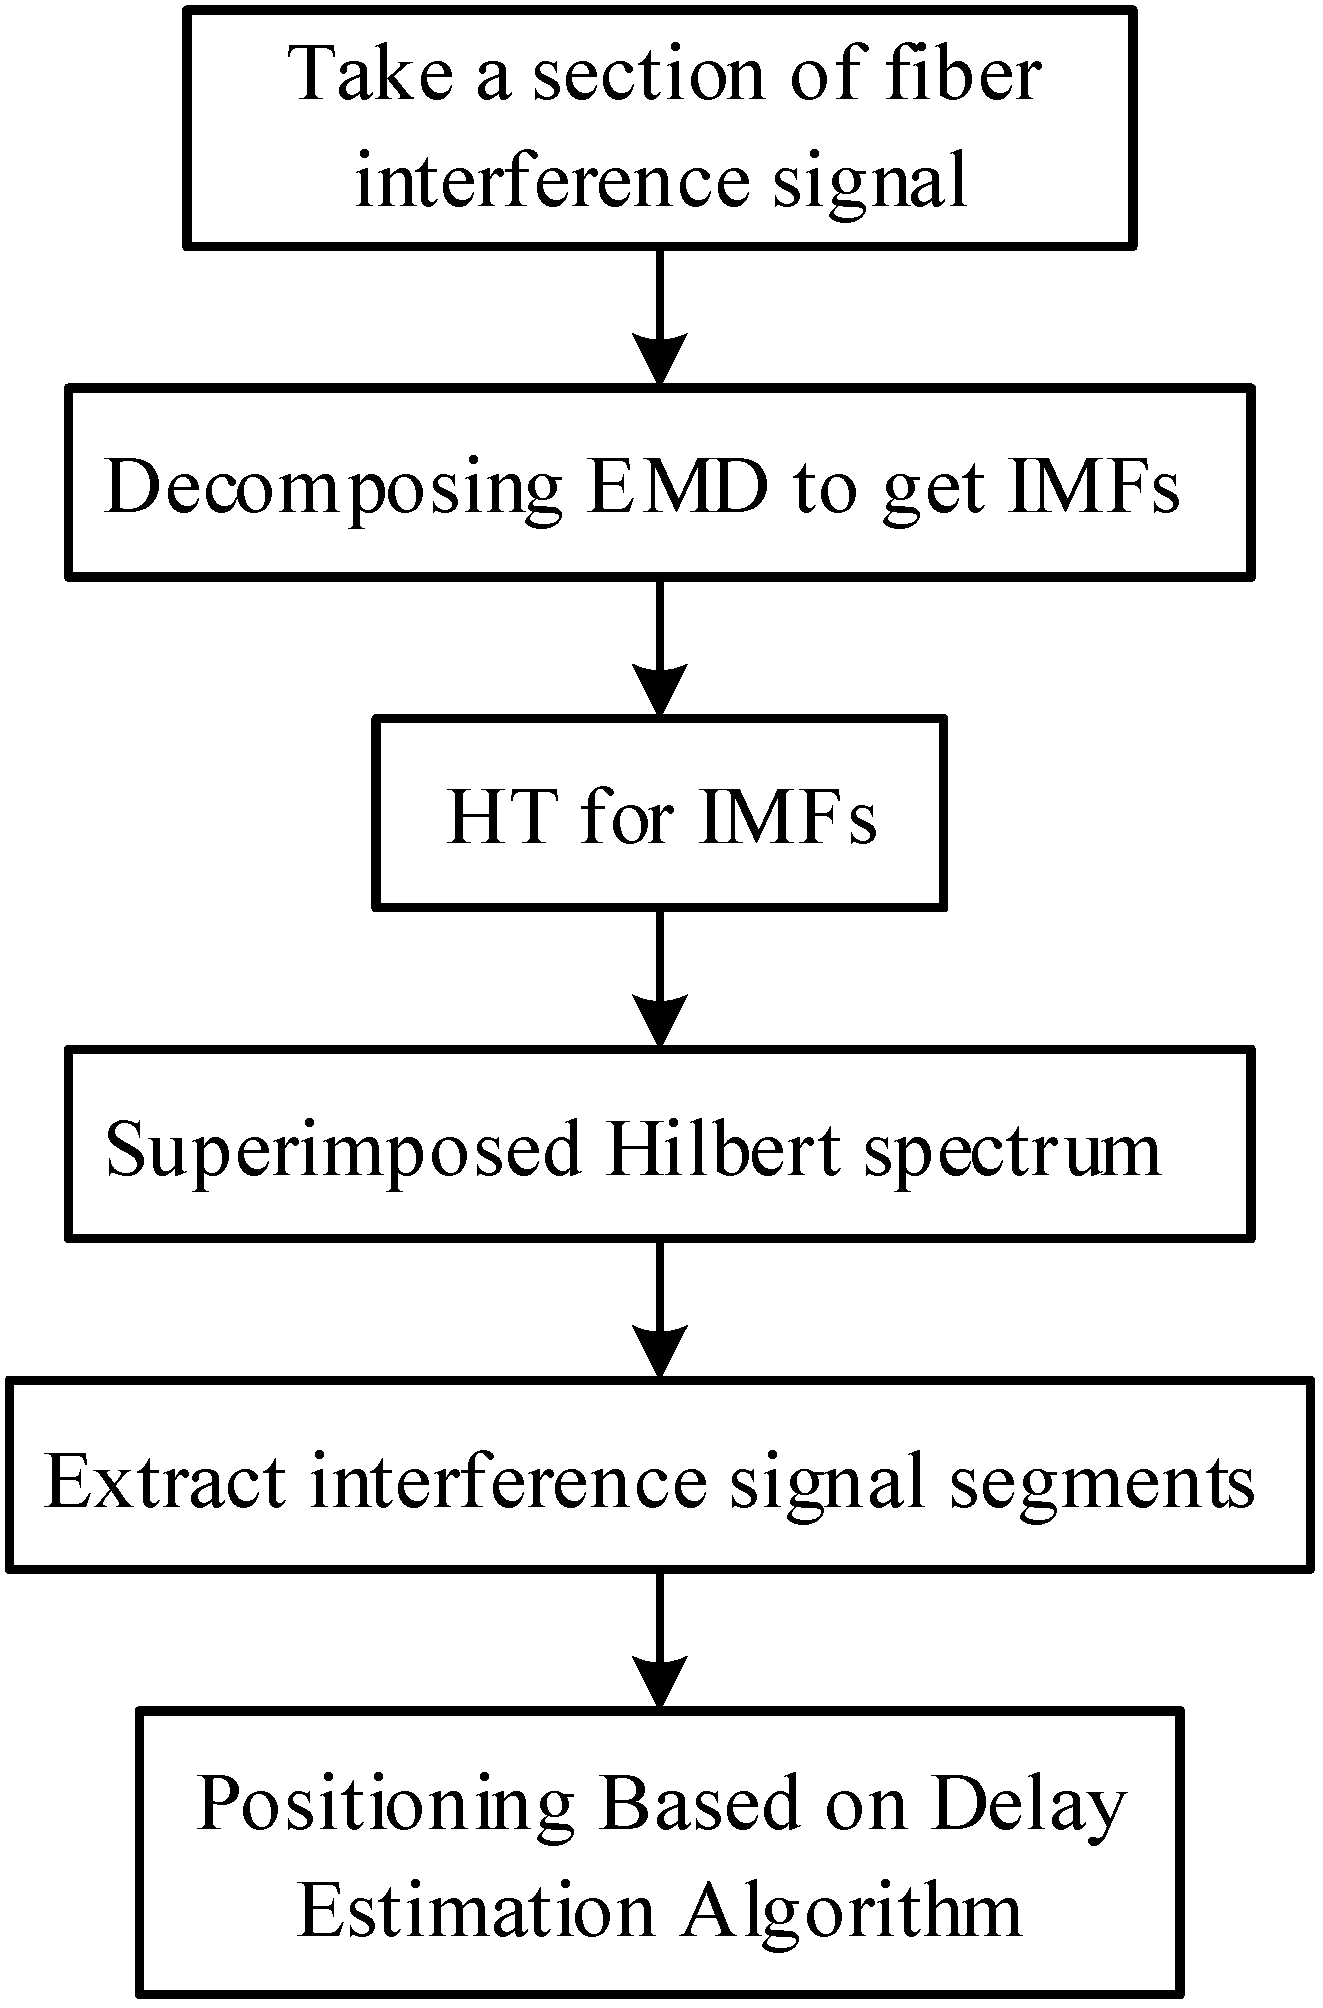
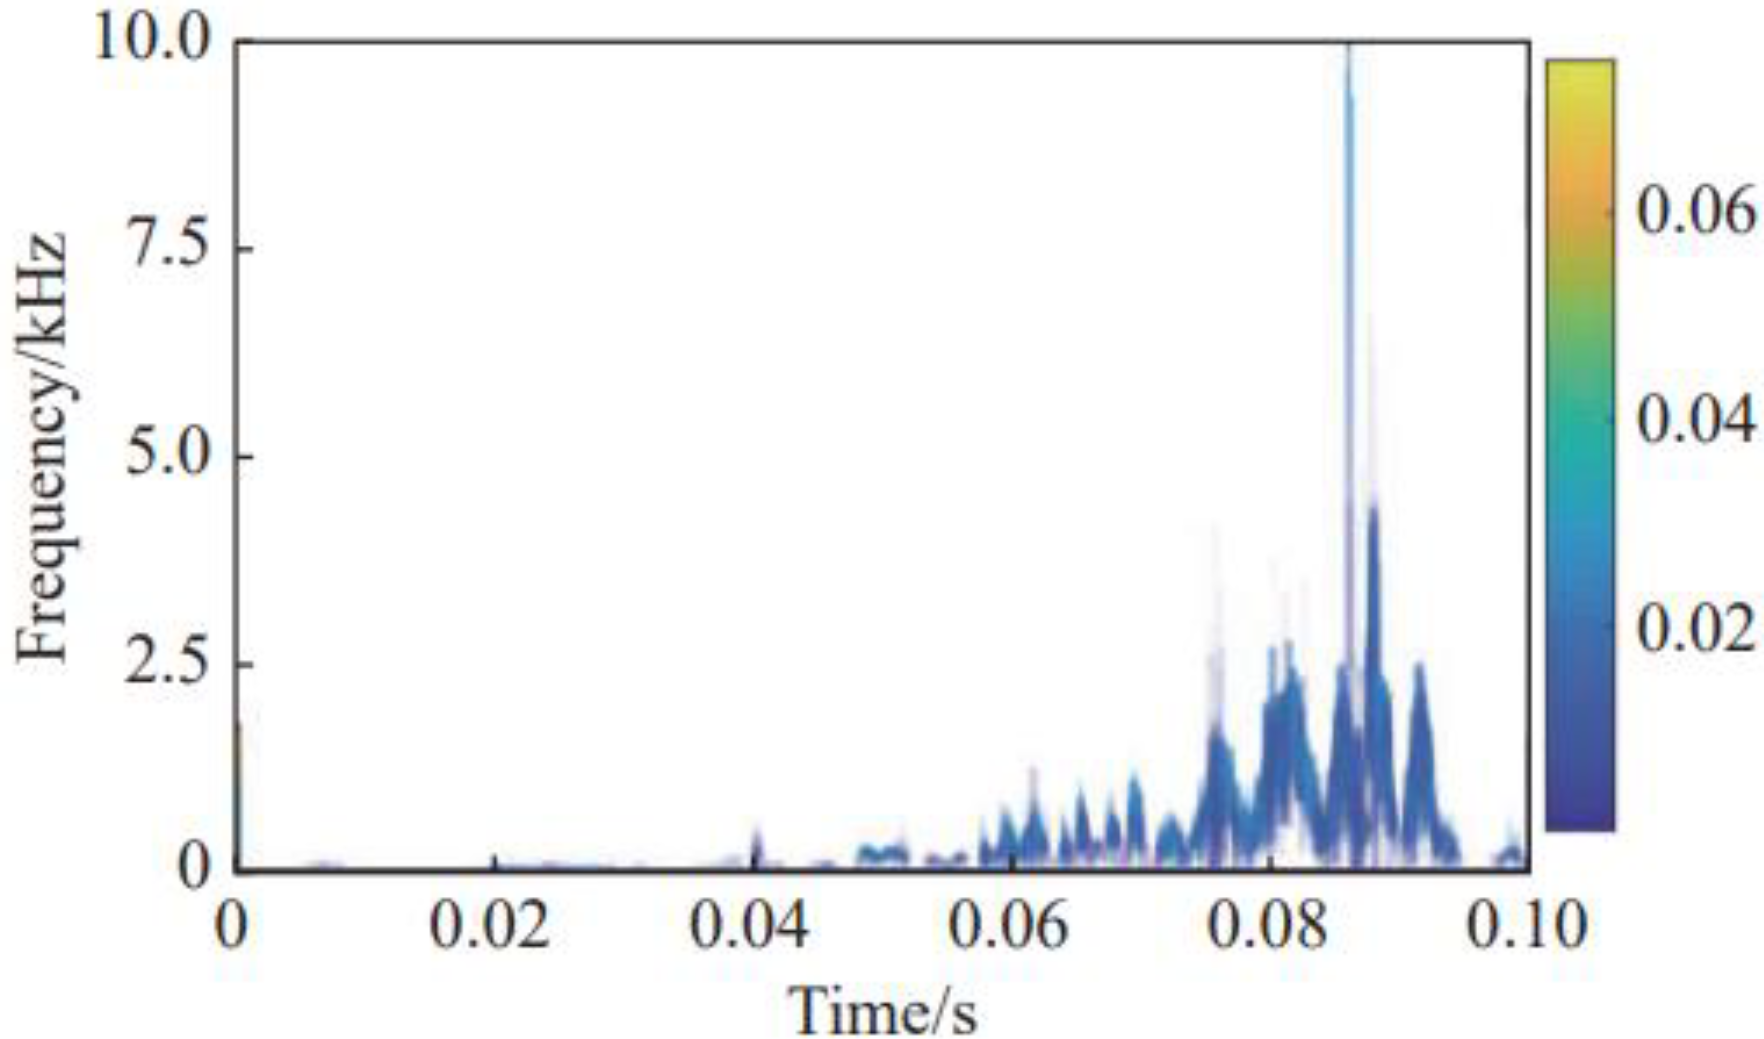
2.2. Hilbert–Huang Transform Algorithm

A vibration location method based on the Hilbert–Huang Transform (HHT) with dual M-Z distributed optical fiber sensors is proposed. The instantaneous high-frequency information can be accurately judged based on the HHT method so as to improve the accuracy of cross-correlation calculation and reduce the deviation of dual M-Z sensing system.
The Hilbert–Huang transform includes empirical mode decomposition (EMD) and Hilbert spectrum analysis (HSA). The basic idea of EMD is to convert a wave with irregular frequency changes into multiple single frequency waves and residual waves. The maximum value point of an original signal x ( t ) is fit with the Hermite difference method three times in order to obtain the upper envelope and the lower envelope. The average value of the upper and lower envelopes is denoted as pl. The difference between the original signal and the mean envelope is written as m(t).
When m(t) has negative local maxima and positive local minima, it can be continually decomposed according to the above operations, so that the original signal x(t) is decomposed into n intrinsic mode functions I(k) (intrinsic mode function, IMF) and the aftermath r(t), which can be expressed as
x ( t ) = k = 1 n I ( k ) + r ( t )
The IMF satisfies the following two conditions: (1) the number of signal extreme points is equal to or different from the number of zero points; (2) the local mean of the upper envelope defined by the maximum value and the lower envelope defined by the minimum value is zero.
The Hilbert transform y(t) of the signal x(t) is expressed as
y ( t ) = H x ( t ) = 1 π p x τ t τ d τ
where p represents the principal value of Cauchy, and the analytical signal is
z ( t ) = x ( t ) + i y ( t ) = a ( t ) exp ( i θ ( t ) )
where a(t) is the instantaneous amplitude, and θ(t) is the instantaneous phase.
a ( t ) = x 2 ( t ) + y 2 ( t ) θ ( t ) = arctan y ( t ) x ( t )
The instantaneous frequency function of the signal is obtained by the derivation of the phase function.
f ( t ) = 1 2 π d θ ( t ) d t
After Hilbert transform all IMFs, there is the following:
H ( f , t ) = x ( t ) = Re k = 1 n a k ( t ) exp ( i 2 π f k ( t ) d t )
The aftermath r(t) is ignored in this Equation. H(f,t) is the time and frequency varying signal amplitude. The Hilbert spectrum is defined as
h ( f ) = 0 T H ( f , t ) d t
where T is the sampling length, and h(f) reflects the change in the amplitude of the signal with the frequency in the entire frequency segment.

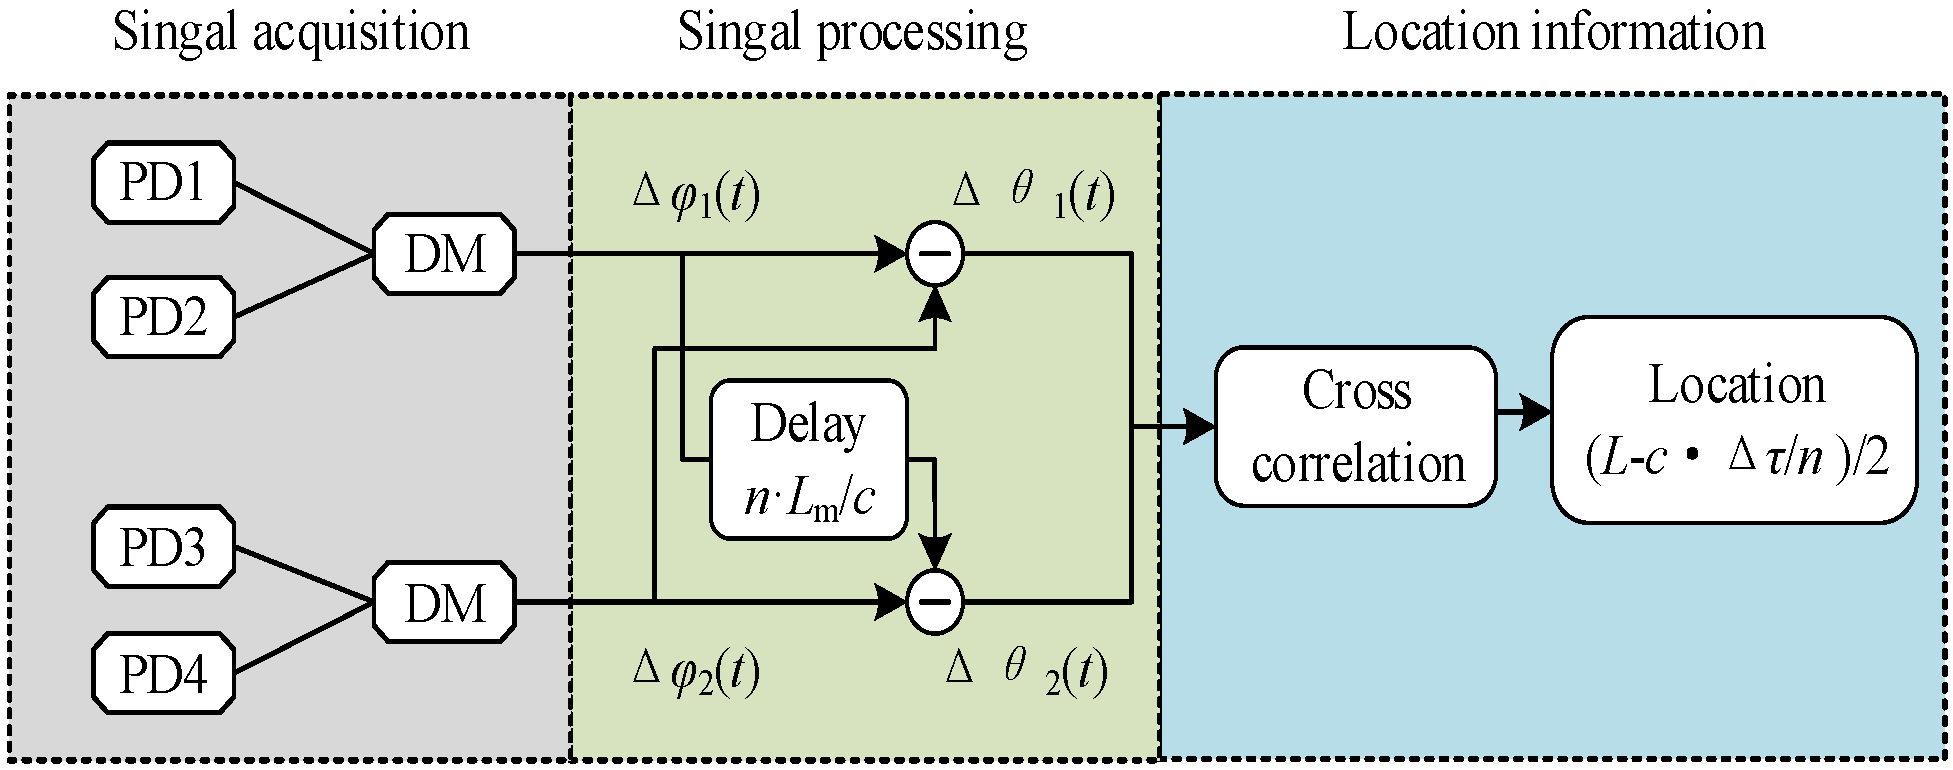
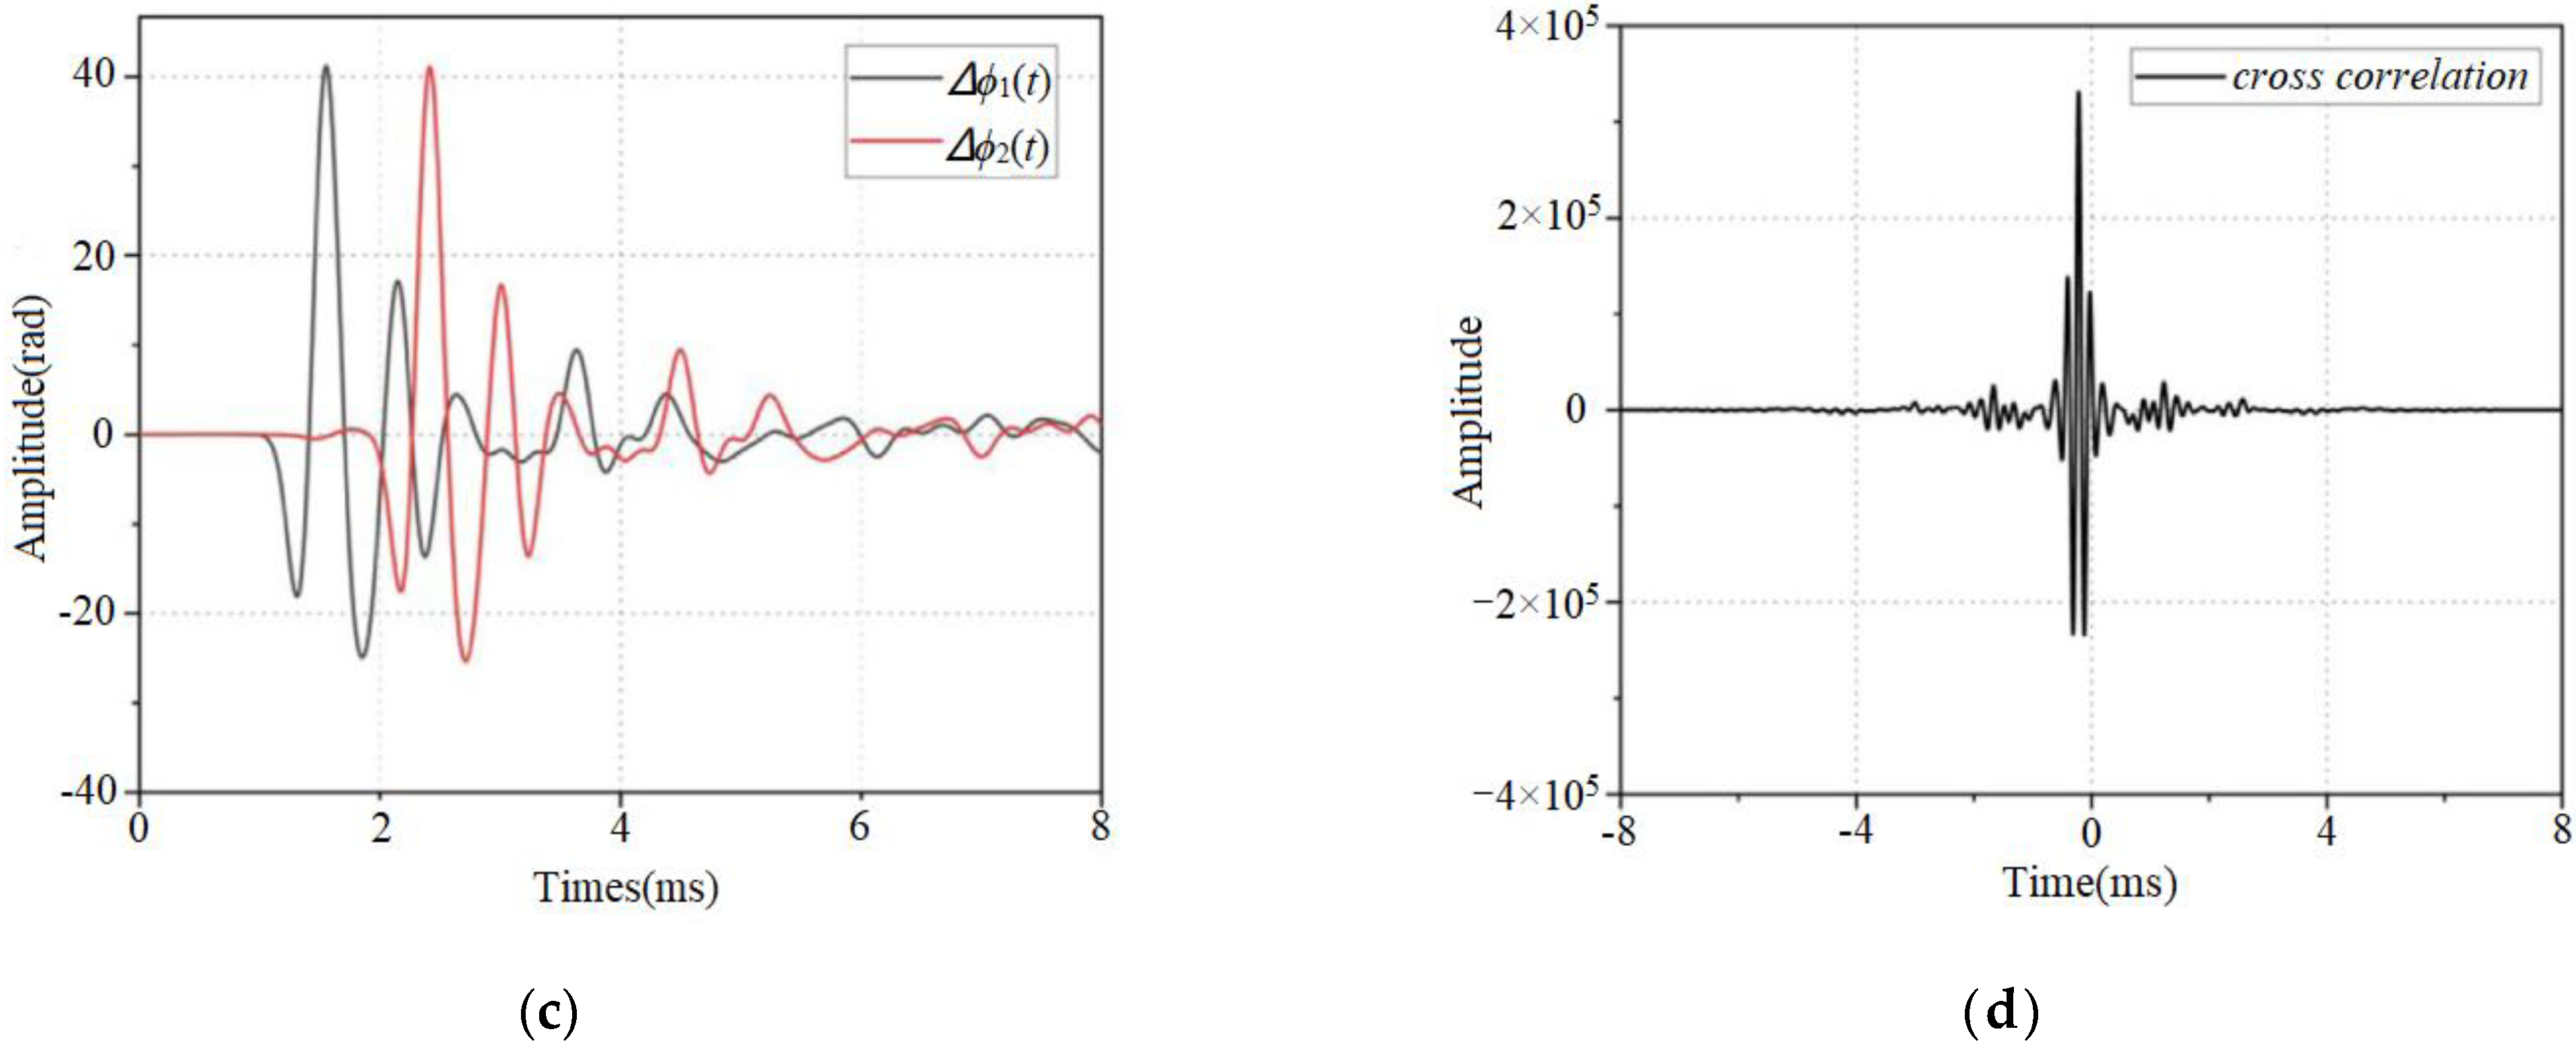
2.3. Delay Estimation Algorithm

Since the vibration signals detected by the two detectors are generated by the same vibration source, the two signals have high correlation. The time delay can be obtained by cross-correlation operation of the two signals, and then the disturbance position can be obtained.
When an interference signal occurs at a given position (such as Figure 1), the signal detected by the detector can be expressed as
I P D 1 t = 2 A 1 2 1 + cos Δ φ 1 t + φ 1
I P D 2 t = 2 A 2 2 1 + cos Δ φ 2 t + φ 2
I P D 3 t = 2 A 3 2 1 + cos Δ φ 1 t + φ 3
I P D 4 t = 2 A 4 2 1 + cos Δ φ 2 t + φ 4
where A 1 , A 2 , A 3 , A 4 are the light intensity amplitudes. Δ φ 1 t and Δ φ 2 t are phase differences which are caused by interference signal. φ 1 , φ 2 , φ 3 , φ 4 are the initial phase differences of the coupler. The distance between the interference signal and the 3 × 3 coupler in the clockwise direction is denoted as Ld, the length of the TDF is Lm, and the length of the Sagnac interferometer is L. The phase differences λ1 and λ2 of the wavelengths can be represented by the following equations:
Δ φ 1 t = φ t n L d c φ t n L L d c
Δ φ 2 t = φ t n L d c φ t n L + L m L d c
Equation (12) minus Equation (13) is recorded as Δ θ 1 t . It is assumed that Δ φ 1 t n L m c to subtract Equation (6), which is denoted as Δ θ 2 t .
Δ θ 1 t = φ t n L + L m L d c φ t n L L d c
Δ θ 2 t = Δ φ 1 t n L m c Δ φ 2 t = φ t n L m + L d c φ t n L d c
When t is taken as tn(L − 2Ld)/c, which is substituted into Equation (16).
Δ φ 1 t n L 2 L d c n L m c Δ φ 2 t n L 2 L d c = φ t n L + L m L d c φ t n L L d c
It can be seen that the right sides of Equations (14) and (16) are equal.
Figure 2 shows the flow of the delay estimation algorithm. Δ φ 1 t and Δ φ 2 t are the phase difference between the partial discharge light waves λ1 and λ2. The length Lm of the delay fiber is known, so a value of Δ φ 1 t n L m c can be obtained. It can be seen that Δ φ 1 t n L m c Δ φ 2 t and Δ φ 1 t Δ φ 2 t are the same in the time domain, except that there is a time delay. The time delay can be obtained as Δ τ = n L 2 L d / c by cross-correlating both of the above. Therefore, the vibration position Ld can be calculated by the following equation:
L d = L c Δ τ / n 2

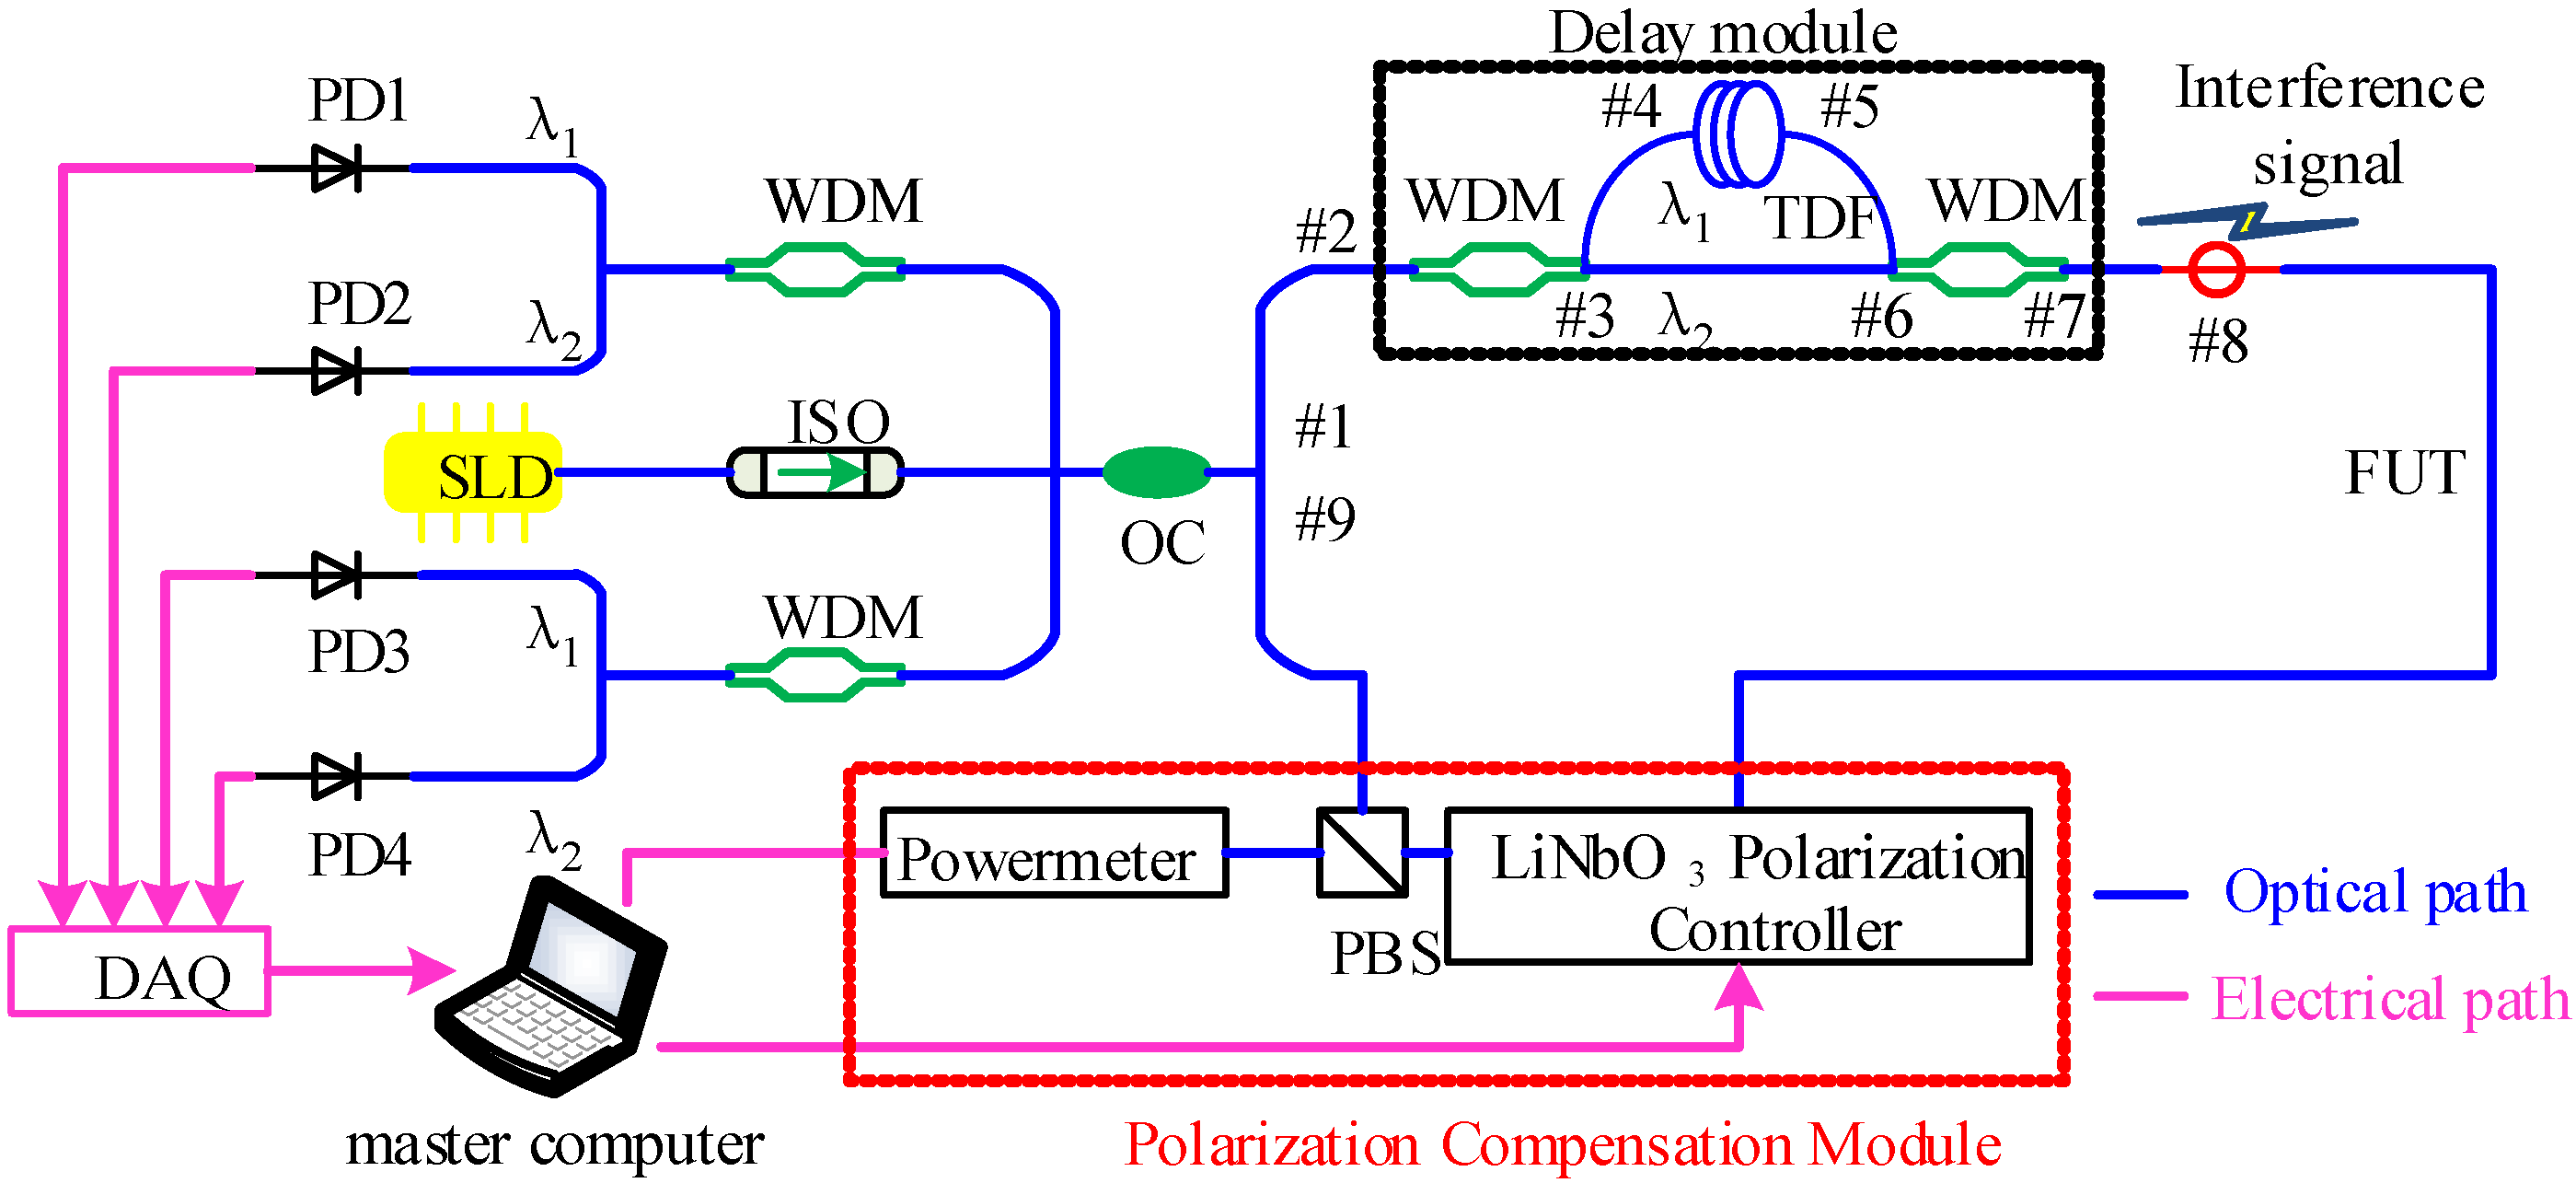
3. Polarization Stability Analysis of Sagnac Interferometer

The polarization state of the interference light will be changed when the ultrasonic signal is discharged in the sensing fiber. It is unable to locate the interference signal accurately in the optical fiber sensing system which is caused by the polarization attenuation. The polarization compensation (PC) module is installed in the optical fiber sensing detection system to compensate for the polarization state change caused by the ultrasonic signal, which is shown in Figure 3. The polarization state of the interference light in the sensing fiber is controlled based on the rotating polarization controller, and the real-time perception of the polarization state can be realized.
The wavelength λ1 and the wavelength λ2 are formed at OC. SLD: super bright light emitting diode; ISO: isolator; OC: 3 × 3 optical coupler; WDM: wavelength division multiplexer; TDF: time delay fiber; PBS: polarization beam splitter; PD1-PD4: photodetector; DAQ: data acquisition.
The wiring diagram of the dual Sagnac interferometer sensor is shown in Figure 3. The system consists of a sensing part and signal-processing part. A superluminescent diode (SLD) is used as the light source in this optical fiber sensing detection system, and its coherence length is several tens of micrometers. An optical isolator (ISO) is used to prevent reflected light from entering the light source and prevent it from interfering with the working state. A 3 × 3 optocoupler (OC) is used with a ratio of 1:1:1. The function of the wavelength division multiplexer (WDM) is to split or combine light. The delay fiber (TDF) is used to ensure that the phase changes of the two interferometers under the same interference are different. The polarization compensation module (PCM) compensates for changes in the polarization state in the fiber and prevents polarization fading. There, passive homodyne phase demodulation is realized without loading wave signal modulation in the fiber, based on the 3 × 3 OC closed Sagnac loop. PD1, PD2, PD3 and PD4 are used to detect the interference signal. The function of the data acquisition card (DAQ) is to convert the analog signal into a digital signal and transmit the data to the computer for data processing.
The fiber-optic sensing detection system includes two Sagnac interferometers. The number “#1, #2, #3…” is the connection node between each photoelectric device. The clockwise (CW) propagation path for fiber optic sensing is as follows:
(1) #1 → #2 → #3 → #4 → #5 → #6 → #7→ #8 → #9
(2) #1 → #2 → #3 → #6 → #7 → #8 → #9
The counterclockwise (CCW) propagation path of fiber optic sensing is as follows:
(3) #9→ #8 → #7 → #6 → #5 → #4 → #3 → #2 → #1
(4) #9 → #8 → #7 → #6 → #3 → #2 → #1
The role of a polarizing beam splitter (PBS) is to split light into two orthogonal single polarizations. The light emitted by port A is received by the optical powermeter. The light from port B is transmitted through the sensing fiber. The polarization state of optical fiber sensor through real-time compensation of signal processing is controlled by the polarization control module. When the ultrasonic signal is detected by the sensing optical fiber, the polarization of the light in the optical fiber and the optical power received from the power meter will be changed. An optical power meter is connected to the LiNbO3 polarization controller through a computer. The LiNbO3 polarized light controller is adjusted according to the change in the power value, and the refractive index of LiNbO3 is changed by changing the applied voltage of the polarization controller, thus changing the phase of the transmitted light so that the optical path is restored to the state before the interference of the partial discharge signal. Finally, the purpose of feedback control is achieved, and the control of the polarization state of the optical fiber sensor is realized.
In order to verify the accuracy of the proposed location algorithm, an experimental device is built according to Figure 3. The total length of the loop in which the Sagnac interferometer is 15 km, and the length of the TDF is 2 km. The maximum sensing distance of the optical fiber sensing system is 15 km, which is considering the influence of scattering noise and the limitation of detector sensitivity. The power of the SLD light source is 10 MW, its center wavelength is 1550 nm, and the wavelength range is 1520 nm–1580 nm. The transmission band range of the wavelength division multiplexer is 1525 nm–1543 nm, and the reflection band range is 1543 nm–1565 nm. A standard Corning SMF-28 single-film fiber was used as the sensing fiber. The A/D conversion circuit is designed based on the 32-bit data acquisition board, and the data sampling rate can reach 500 k/s. In this paper, LabVIEW is used to realize the acquisition and processing of ultrasonic signal. The performance of optical fiber interference localization based on a dual silicon sensor is analyzed. A piezoelectric transducer (PZT) was installed in the clockwise direction of the sensing fiber, located at a distance of 13 km from the 3 × 3 coupler. The experimental results are shown in Figure 4.
The effectiveness of the proposed algorithm is verified by PZT experiments. Vibration interference is conducted on the optical fiber to test the actual positioning ability of the system. When the amplitude, direction and duration of the vibration interference signal applied to the optical fiber are different, the vibration frequency generated is complex, and most frequencies are concentrated below 500 Hz. The phase differences Δ ϕ 1 ( t ) and Δ ϕ 1 ( t ) caused by interference signals are detected by the distributed optical fiber sensing system. The cross-correlation between Δ ϕ 1 ( t ) and Δ ϕ 2 ( t ) is calculated to be Δ ϕ = 0.5376 ms, the Ld is 13.049 km, and the deviation is 10 m. Increasing the sampling points per unit time, the location accuracy of the optical fiber sensing system for detecting interference signal can be improved. This is because the detection signal contains more effective information, and the stability of the cross-correlation peak value can be supported effectively by more cross-correlation data points.

4. Localization of Distributed Optical Fiber Disturbance for Interference Signal

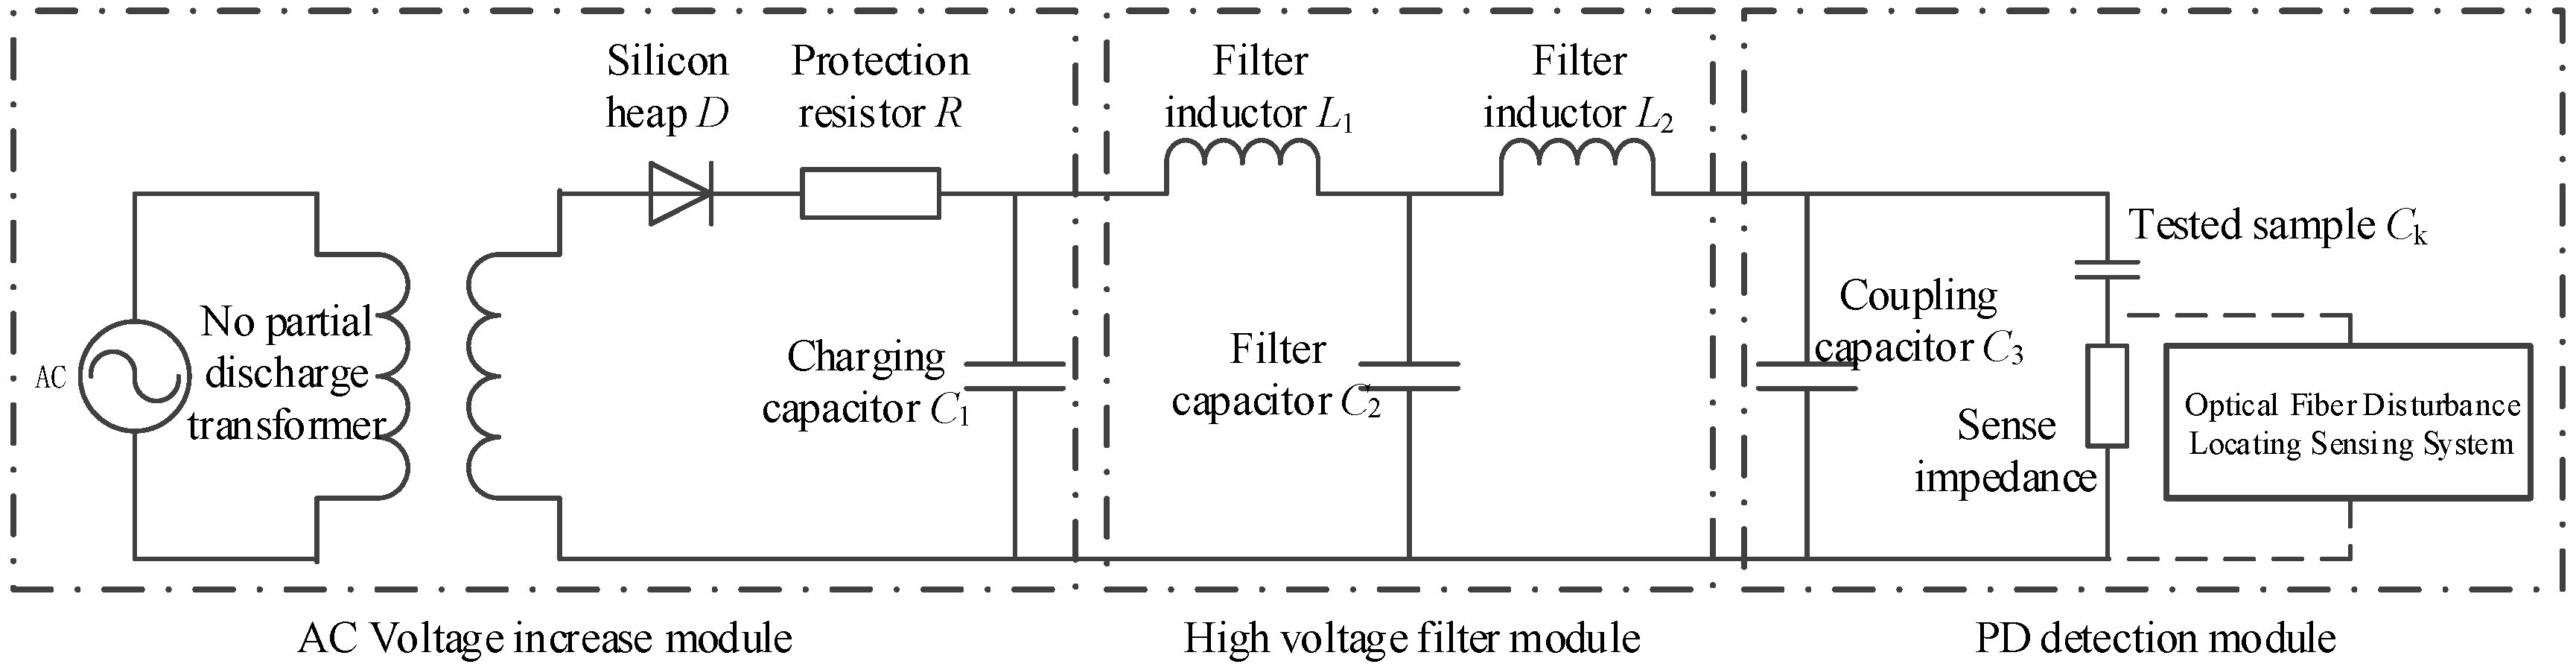
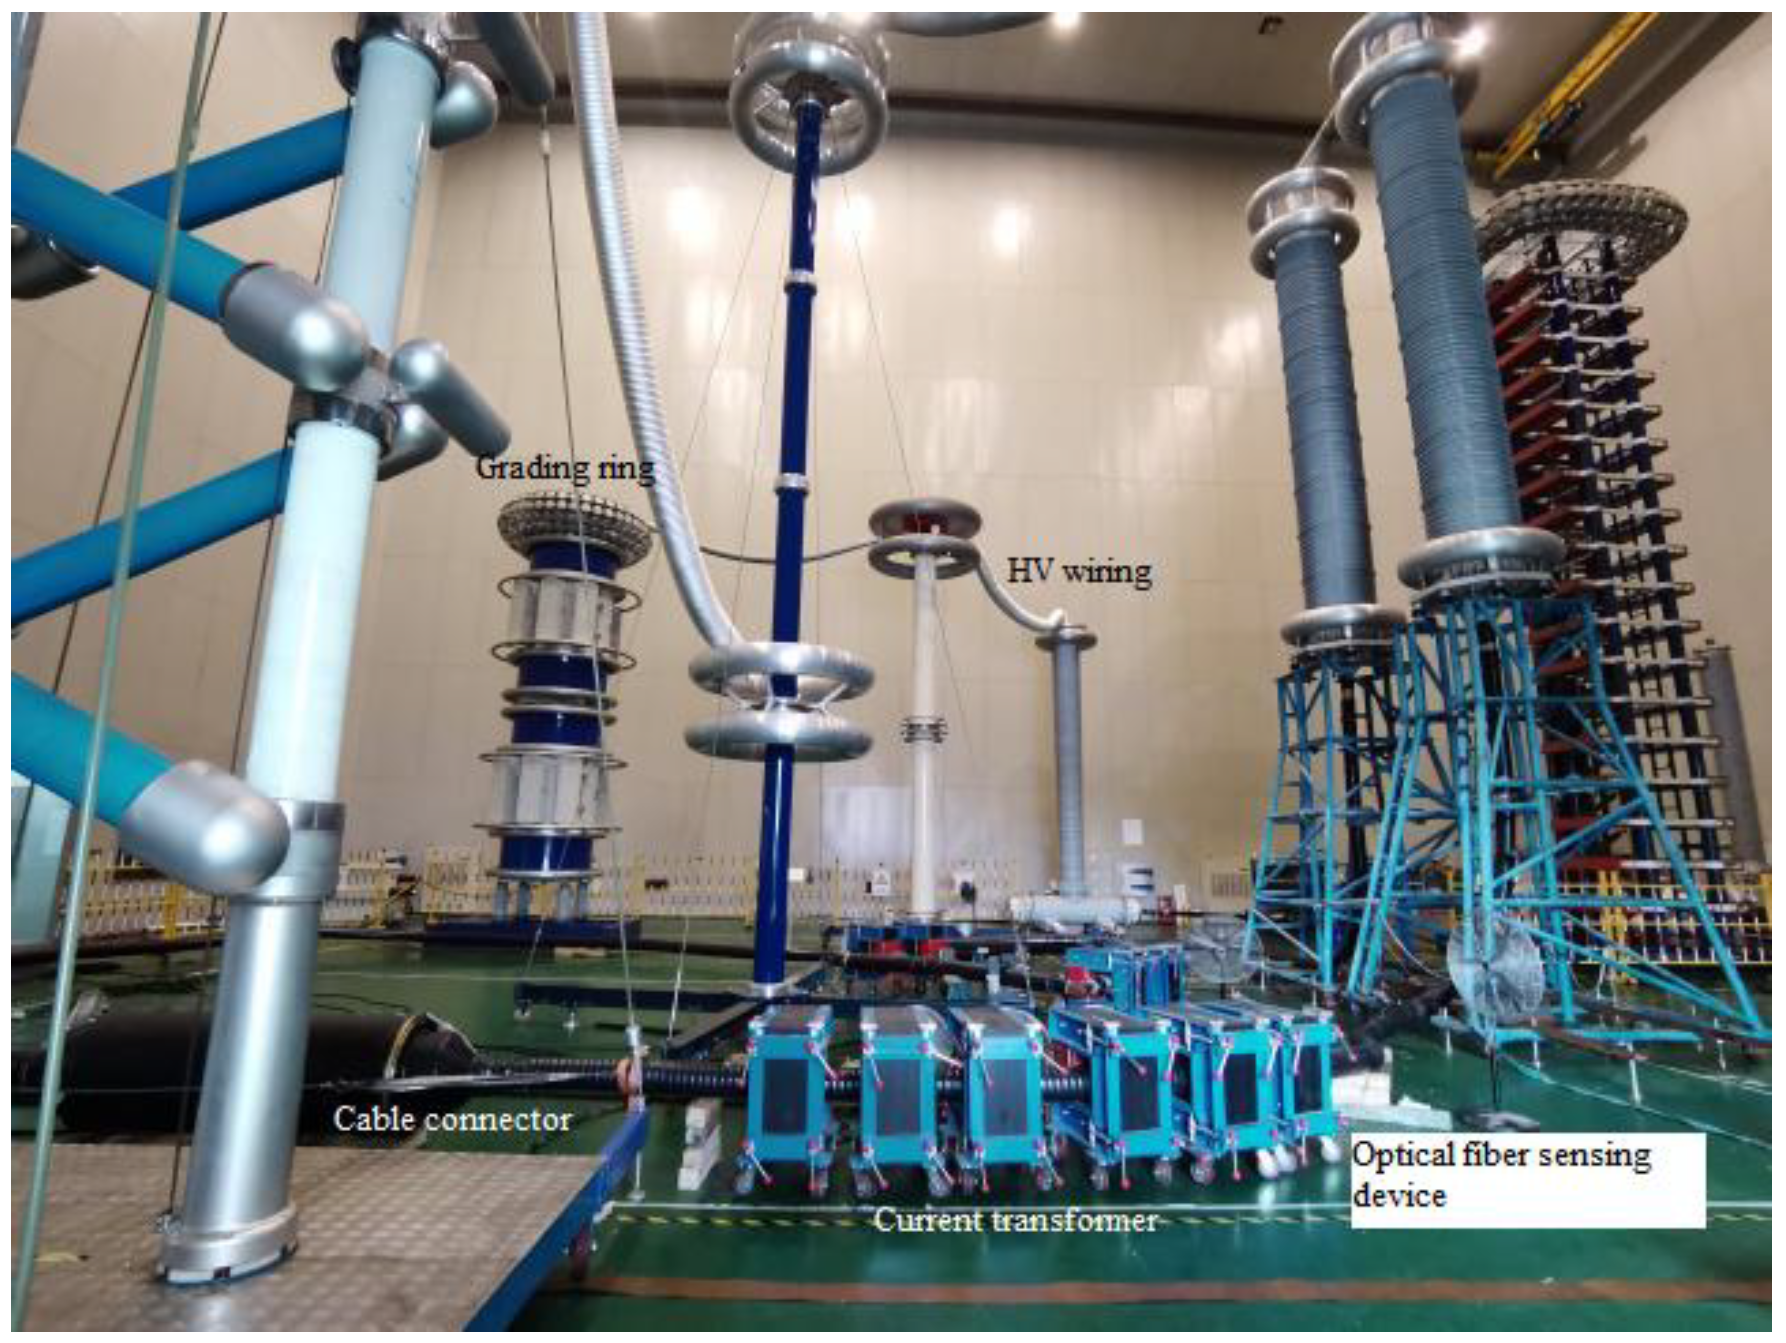
4.1. Partial Discharge Test of Optical Fiber Sensing Cable Joint

A partial discharge test circuit is constructed using a 220 kV XLPE cable, as shown in Figure 5. It verifies the feasibility of the optical fiber sensing system to detect the ultrasonic signal of partial discharge of XLPE cable. The first part is an AC boost module which generates AC high voltage. The second part is the high-voltage filter module which is used to filter the interference signal in the test circuit. The third part is the partial discharge detection module, including a distributed optical fiber positioning sensor system. The cross-section of the XLPE cable is 300 mm2, and the rated voltage is 220 kV. The cable’s partial discharge test wiring based on an optical fiber sensing system is shown in Figure 6.
The partial discharges of long-distance high-voltage cables are detected by the optical fiber sensing system based on dual Sagnac interferometers, and this verifies the accuracy of the distributed positioning detection. The cable insulation defects are arranged at 0 km, 1 km, 3 km, 5 km, 6 km, 8 km, 10 km, 11 km, 13 km, and 15 km, and interference signals are imposed on the sensing fiber. The stability of the optical fiber sensing system is proven for detecting partial discharge of long-distance cable ultrasonic signal localization.

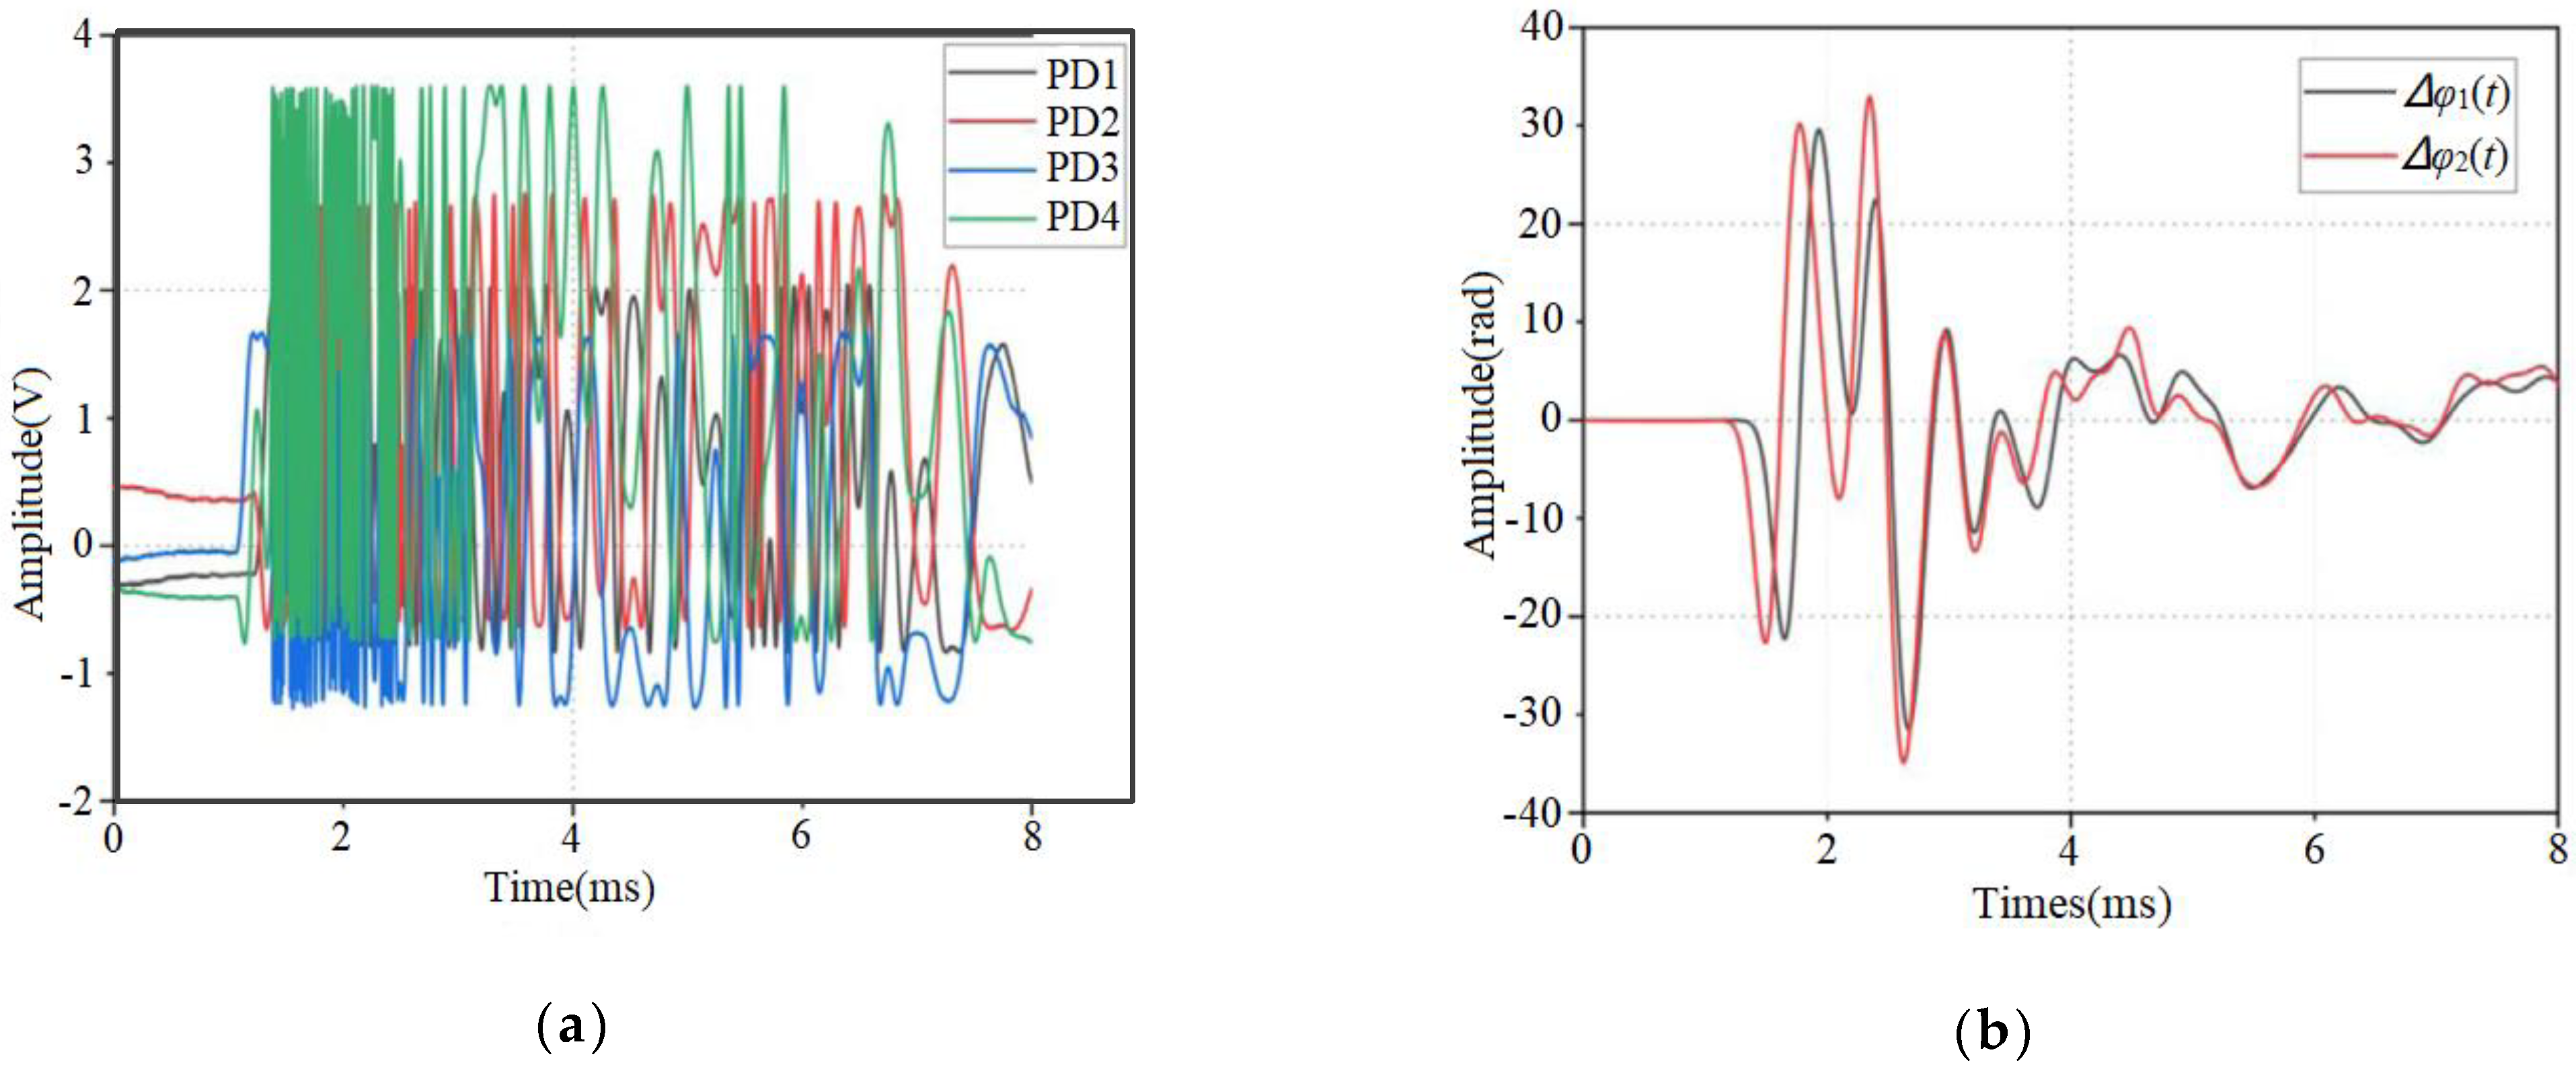
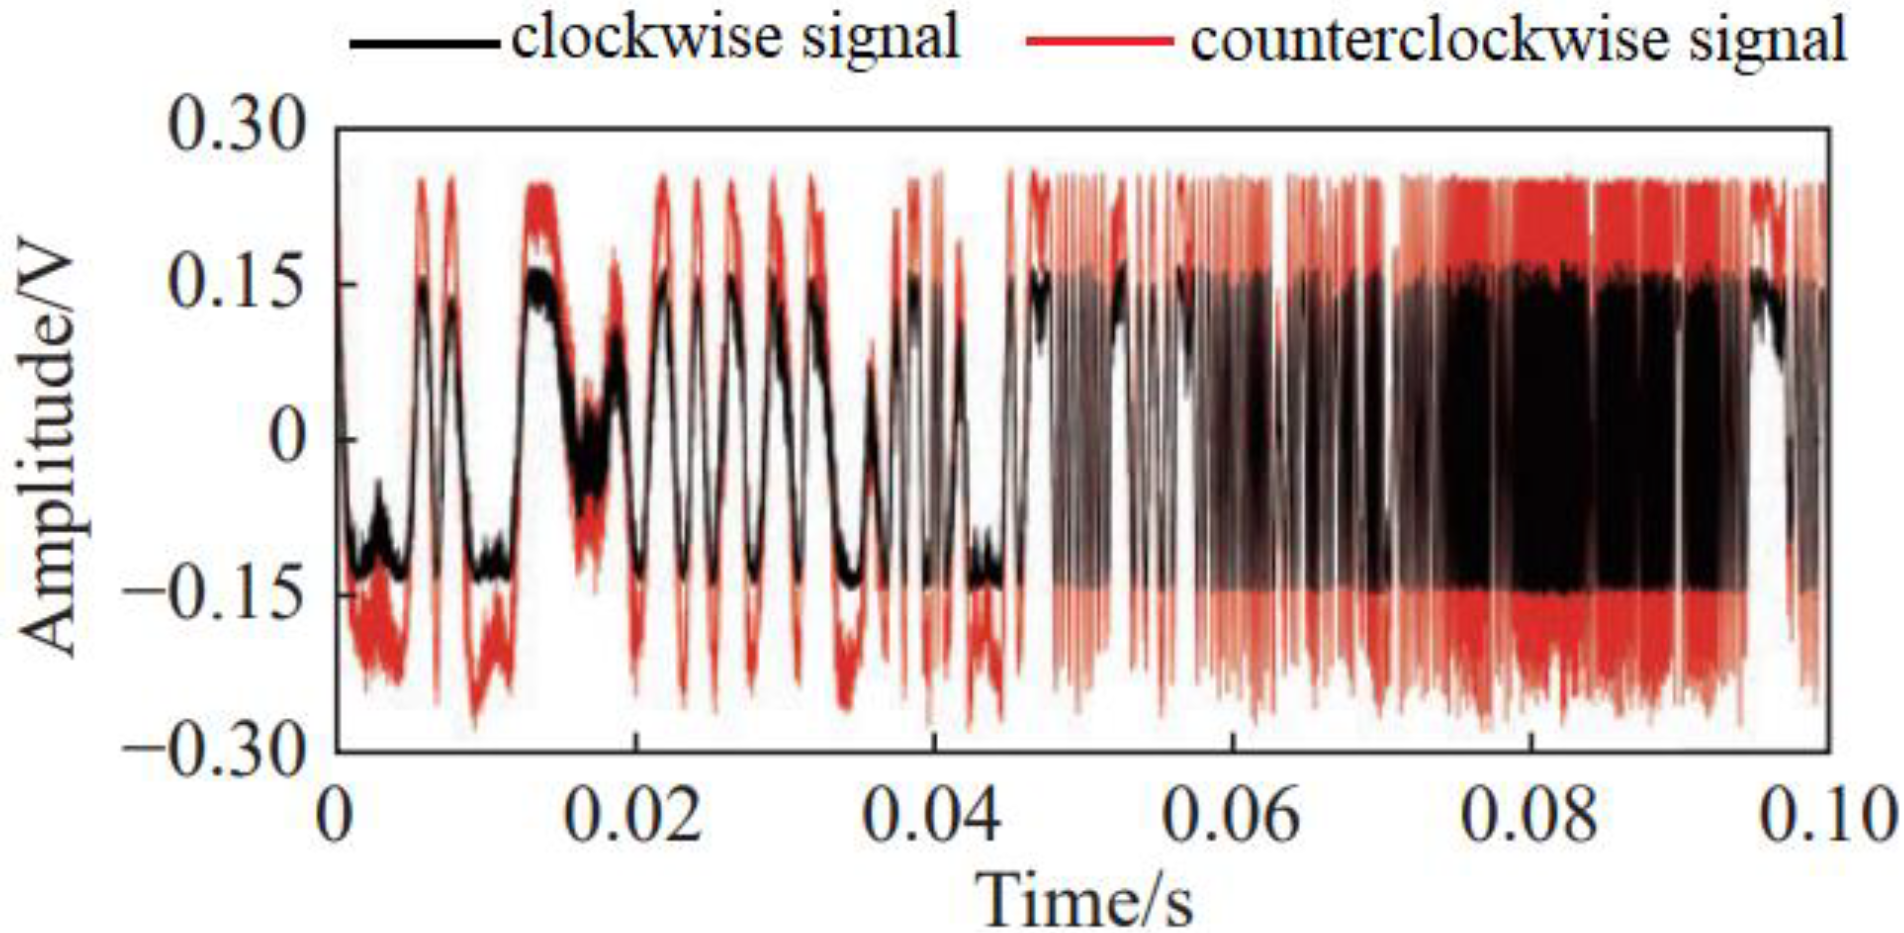
4.2. Signal Acquisition and Processing

The collected signals are shown in Figure 7. It can be seen that the two signals have strong correlation, because the two signals reflect the vibration of the same vibration source. The time delay of the two related signals can be obtained based on the time delay estimation algorithm.
The flow of the signal-processing method is shown in Figure 8, and the specific operation steps are as follows:
(1) The original signal is decomposed into multiple intrinsic mode functions based on Equation (1). EMD is performed on the vibrating fiber signal according to the piecewise third-order Hermite difference polynomial to obtain the IMF, and ten is selected as the number of decomposition layers, as shown in Figure 9, in which the decomposition of 5 layers is given.
(2) Based on Equations (2)–(5), the Hilbert transform is performed on each layer of IMFs obtained by decomposition, and the result reflects the instantaneous frequency of the original signal.
(3) Based on Equations (6) and (7), the Hilbert transform results of all IMFs are superimposed to obtain the Hilbert spectrum, which clearly and intuitively reflects the frequency change of the original signal, as shown in Figure 9.
(4) The signal segment of the original signal is extracted according to the peak position of the Hilbert spectrum, and the data of 0.01 s near the highest peak is taken for delay estimation operation and positioning operation to obtain the vibration position information. It can be seen from Figure 10 that the frequency at the 880,000th sampling point is the highest, and the regional signal at the 800,000~900,000th sampling point is selected as the effective signal of vibration.

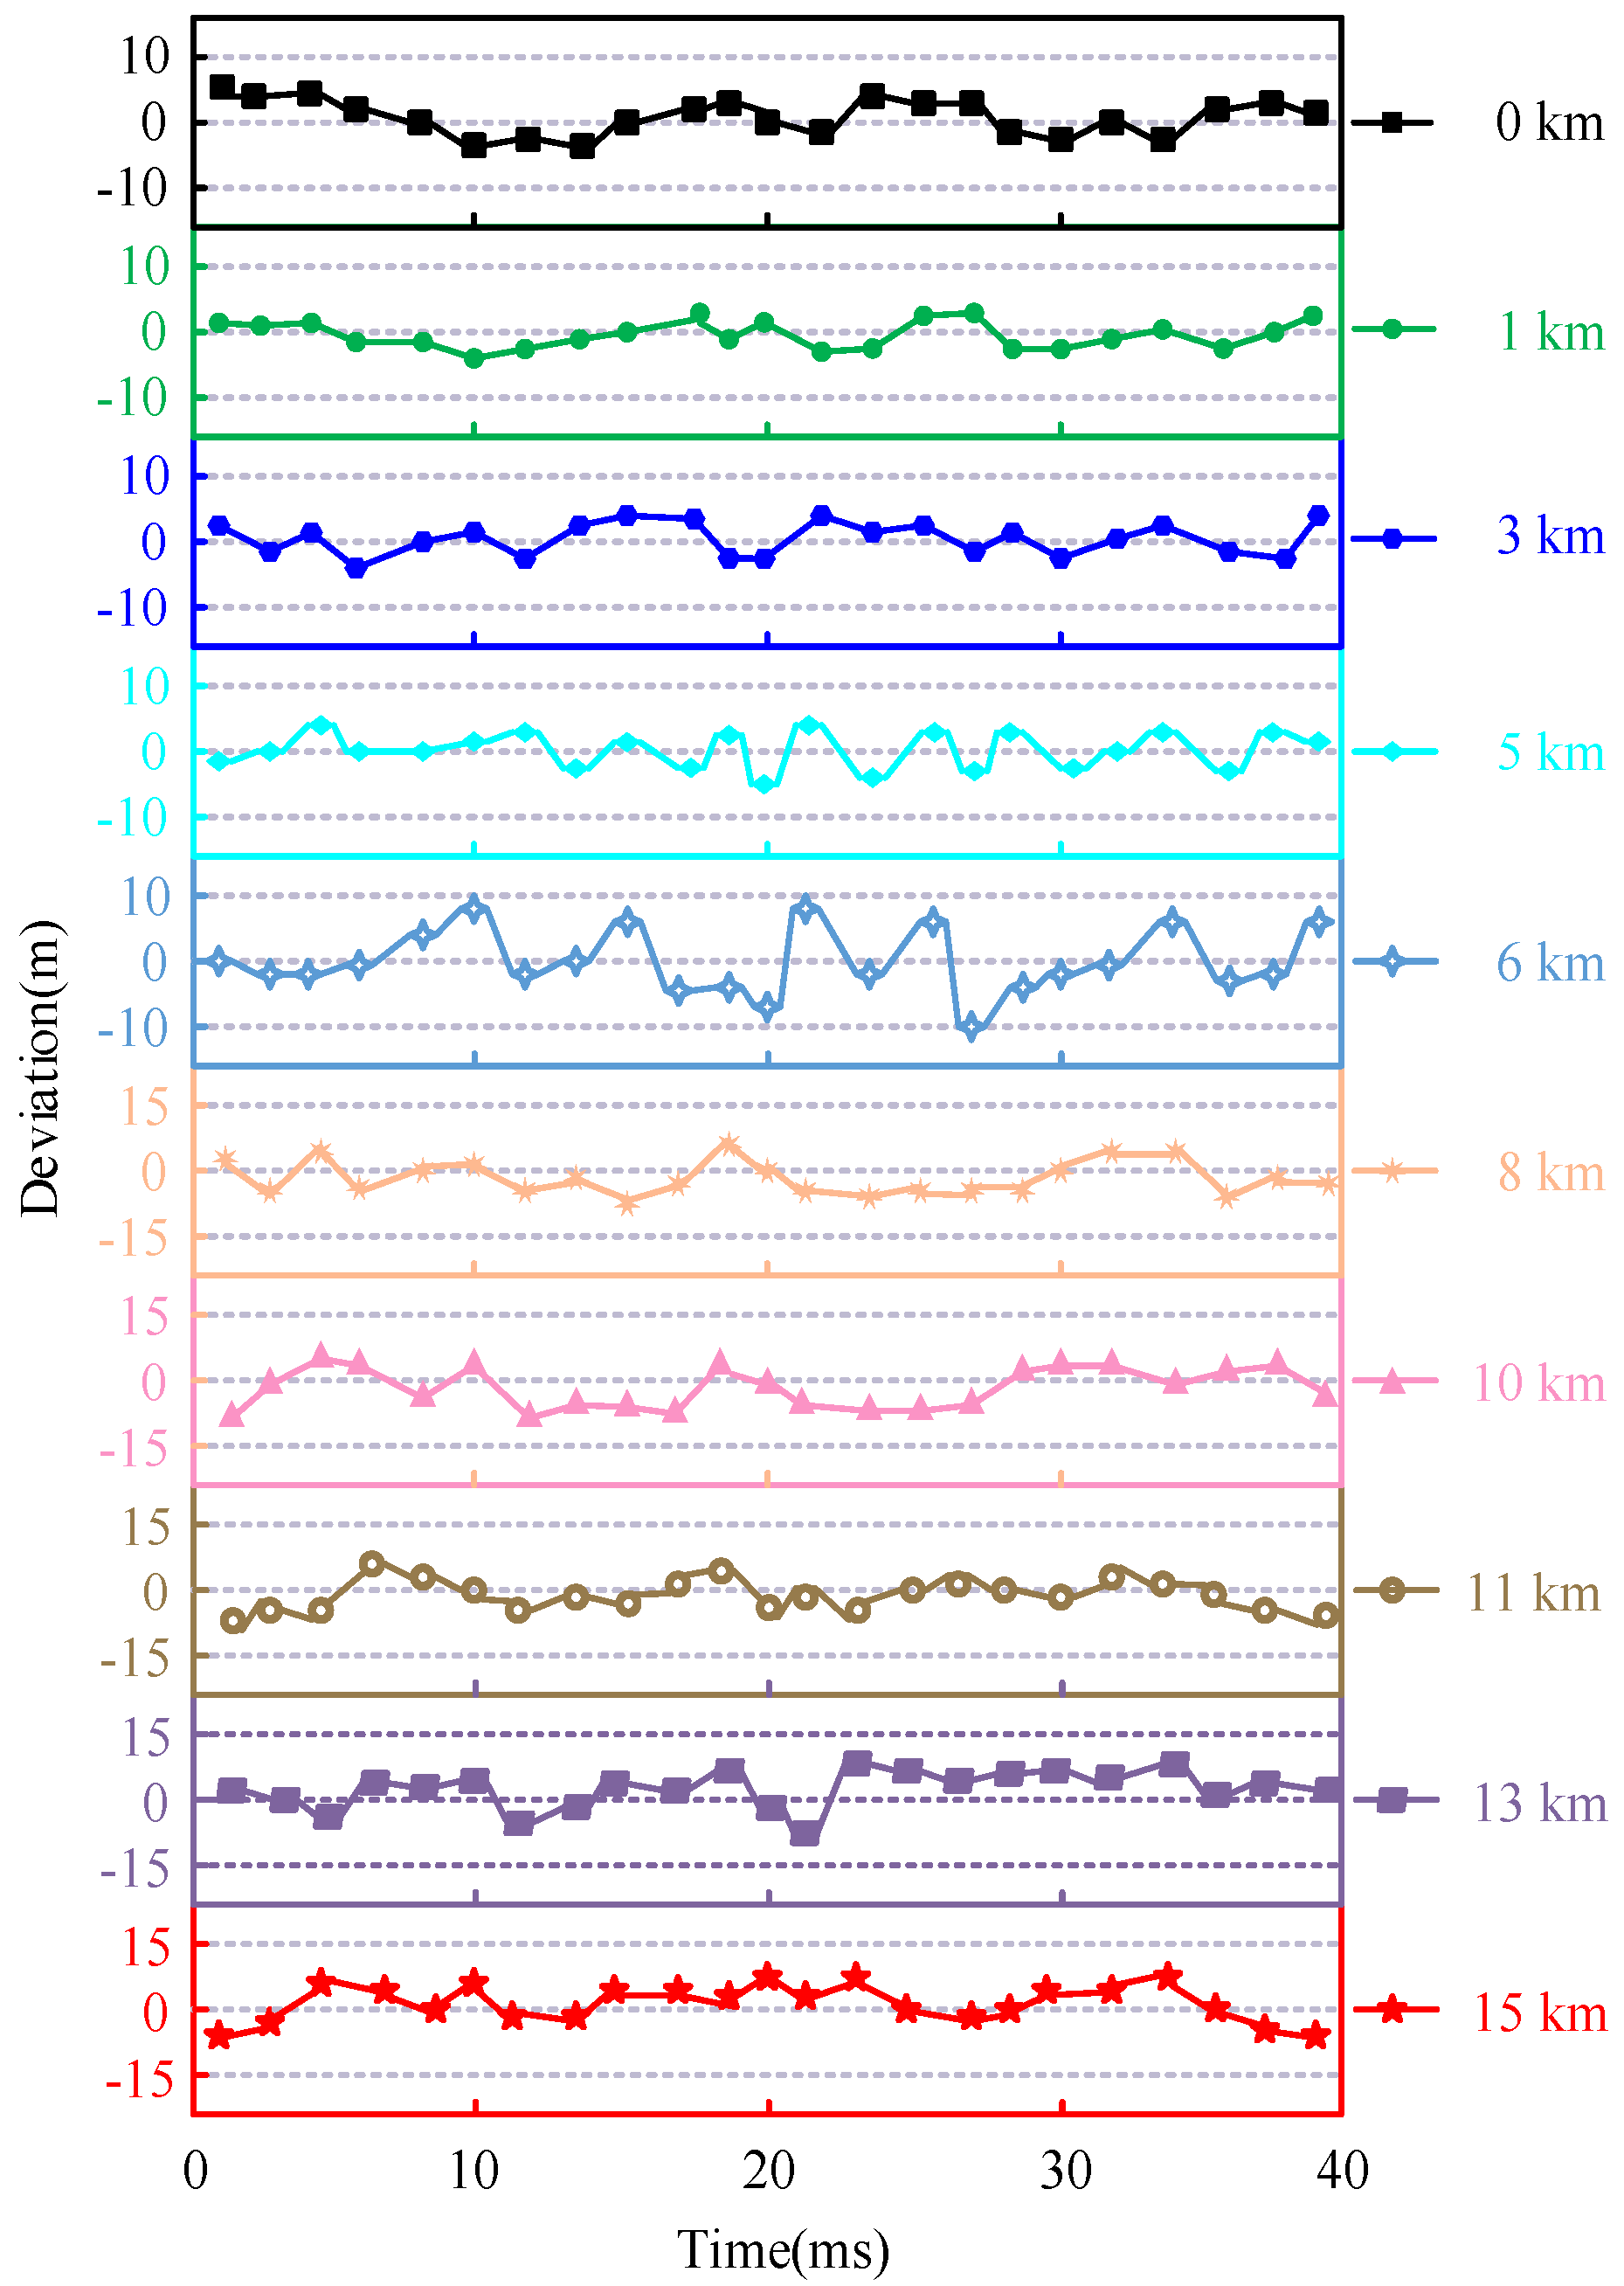
4.3. Optical Fiber Sensing and Localization of Interference Signal

The long-distance interference signals are detected by the optical fiber sensing system based on dual Sagnac interferometers, and this verifies the accuracy of the distributed location detection.
The delay module and polarization compensation module of Figure 3 are connected through a fiber under test (FUT) to ensure electrical isolation. The FUT is a single-mode optical fiber with a total length of 828 m, in which a bend-insensitive single-mode optical fiber with a length of 66 m is spliced as a sensing section. This length of optical fiber only has a core and coating structure which is wound at a specific position on the outer surface.
A bend-insensitive optical fiber with a length of about 4.12 m is wound around these marked points for ultrasonic signal sensing. A 10 m long optical fiber is used to separate each two adjacent fiber optic rings, and sound insulation treatment is performed between optical fiber and the tested interference signal. This separation is conducive to locating the ultrasonic detection signal so that it is protected from ultrasonic waves upon the adjacent fiber optic rings’ influence on the signal.
The interference signal defects are arranged at 0 km, 1 km, 3 km, 5 km, 6 km, 8 km, 10 km, 11 km, 13 km, and 15 km, and interference signals are imposed on the sensing fiber. The test results are shown in Figure 11.
It can be seen from Figure 11 that the maximum positioning deviation occurs at 13 km, and the maximum positioning deviation is 11 m. Other locations are concentrated around 10 m. The positioning deviation at 15 km is 9 m, which shows that the polarization control module in the optical fiber detection system plays an effective role. The stability of the optical fiber sensing system for detecting partial discharge ultrasonic signal localization is proven by all the detection data.

5. Conclusions

A fiber optic sensor positioning system with a polarization compensation module has been established. The polarization compensation module is designed to compensate for the change of polarization state in the sensing fiber. A data signal-processing scheme based on Hilbert–Huang transform (HHT) is proposed. The optical signal information can be calculated based on the cross-correlation and delay estimation algorithm to accurately obtain the vibration position information. The location deviation test is carried out for the optical fiber sensing system loaded with interference signals of different amplitudes. It is detected in different positions of optical fiber sensor long-distance location system. The experimental results show that the optical fiber sensing system based on the proposed time delay estimation algorithm and polarization compensation module can achieve precise location with a 15 km long-distance interference signal, and the location deviation is less than ±11 m. It is verified that the insulation state of optical fiber sensing at long distance is a feasible monitoring method, and its excellent engineering application potential for long-distance signal transmission is explored.

Author Contributions

Conceptualization, Z.L. (Zhiheng Liu); methodology, Y.W.; software, J.C.; Funding acquisition, Z.L. (Zhibin Liu); formal analysis, P.H.; data curation, Z.Z.; writing—original draft preparation, X.L.; project administration, J.Y. All authors have read and agreed to the published version of the manuscript.

Funding

This research was funded by The S&T Program of Hebei, grant number 216Z2103G; the Foundation of President of Hebei University, grant number XZJJ201908; the Special Project of basic Research in Baoding City, grant number 2172P001; Hebei University “One Province One University” Special Fund, grant number 801260201232.

Data Availability Statement

Not applicable.

Conflicts of Interest

The authors declare no conflict of interest.

References

  1. Hu, X.X.; Wang, Y.H.; Zhao, L.; Zhang, Q.; Zhang, M.; Zhang, J.; Qiao, L.; Wang, T.; Gao, S. Research Progress in Brillouin Optical Correlation Domain Analysis Technology. Chin. J. Laser 2021, 48, 0100001. [Google Scholar]
  2. Long, R. Fast localization mothod for abnormal nodes in distributed optical fiber sensor networks. Laser J. 2021, 42, 85–89. [Google Scholar]
  3. Ma, Y.; Zhang, Y.; Cheng, Y.; Zhang, Y.; Gao, X.; Shan, K. A Case Study of Field Thermal Response Test and Laboratory Test Based on Distributed Optical Fiber Temperature Sensor. Energies 2022, 15, 8101. [Google Scholar] [CrossRef]
  4. Liu, Z.L.; Wang, Y.Q.; Chen, X.; Meng, X.K. An optical fiber sensing method for partial discharge in the HVDC cable system. Int. J. Electr. Power Energy Syst. 2021, 128, 106749. [Google Scholar] [CrossRef]
  5. Bua-Nunez, I.; Posada-Roman, J.E.; Garcia-Souto, J.A. Multichannel Detection of Acoustic Emissions and Localization of the Source with External and Internal Sensors for Partial Discharge Monitoring of Power Transformers. Energies 2021, 14, 7873. [Google Scholar] [CrossRef]
  6. Liu, Y.; Li, X.; Li, H.; Wang, J.; Fan, X. Experimental and Numerical Investigation of the Internal Temperature of an Oil-Immersed Power Transformer with DOFS. Appl. Sci. 2020, 10, 5718. [Google Scholar] [CrossRef]
  7. Luo, K.; Wang, B.; Guo, N.; Yu, K.; Yu, C.; Lu, C. Enhancing SNR by Anisotropic Diffusion for Brillouin Distributed Optical Fiber Sensors. J. Lightwave Technol. 2020, 38, 5844–5852. [Google Scholar] [CrossRef]
  8. Chae, D.H.; Lee, S.J.; Lee, J.-W. Evaluation on the Applicability of Monitoring for Urban Railway Structure Using Brillouin Optical Correlation Domain Analysis Based Distributed Optical Fiber Sensor. J. Korean Geo-Environ. Soc. 2018, 19, 13–19. [Google Scholar]
  9. Ma, Y.; Song, Y.; Song, Q.; Xiao, Q.; Jia, B. MI-SI Based Distributed Optical Fiber Sensor for No-Blind Zone Location and Pattern Recognition. J. Lightwave Technol. 2022, 40, 3022–3030. [Google Scholar] [CrossRef]
  10. Chen, K.; Yue, Y.; Tang, Y.J. Research on Temperature Monitoring Method of Cable on 10 kV Railway Power Transmission Lines Based on Distributed Temperature Sensor. Energies 2021, 14, 3705. [Google Scholar] [CrossRef]
  11. Leal-Junior, A.G.; Ribeiro, D.; Leticia, M.A.; Silveira, M. Wearable and Fully-Portable Smart Garment for Mechanical Perturbation Detection With Nanoparticles Optical Fibers. IEEE Sens. J. 2021, 21, 2995–3003. [Google Scholar] [CrossRef]
  12. Zhao, Y.; Wang, Q.; Ling, Z.W. Experimental Analysis and Leakage Location Detection of Tap Water Pipe Based on Distributed Optical Fiber with Selective Average Threshold. Laser Optoelectron. Prog. 2019, 56, 030602. [Google Scholar] [CrossRef]
  13. Ren, L.; Jiang, T.; Jia, Z.-G.; Li, D.-S.; Yuan, C.-L.; Li, H.-N. Pipeline corrosion and leakage monitoring based on the distributed optical fiber sensing technology. Measurement 2018, 122, 57–65. [Google Scholar] [CrossRef]
  14. Zhan, Y.; Song, Z.; Sun, Z.; Yu, M.; Guo, A.; Feng, C.; Zhong, J. A distributed optical fiber sensor system for intrusion detection and location based on the phase-sensitive OTDR with remote pump EDFA. Optik 2021, 225, 165020. [Google Scholar] [CrossRef]
  15. Mustafa, S.; Sekiya, H.; Morichika, S.; Maeda, I.; Takaba, S.; Hamajima, A. Monitoring internal strains in asphalt pavements under static loads using embedded distributed optical fibers. Opt. Fiber Technol. 2022, 68, 102829. [Google Scholar] [CrossRef]
  16. Lai, X.; Yu, H.; Ma, Y.; Lin, R.; Song, Q.; Jia, B. Disturbance location and pattern recognition of a distributed optical fiber sensor based on dual-Michelson interferometers. Appl. Opt. 2022, 61, 241–248. [Google Scholar] [CrossRef] [PubMed]
  17. Chen, B.; Li, J.; Hu, Y.; Ma, H.; Wang, T.; Zhou, C.; Liu, H. Distributed optical fiber sensor for investigation of normal zone propagation and hot spot location in REBCO cables. Fusion Eng. Des. 2020, 156, 111569. [Google Scholar] [CrossRef]
  18. Gu, F.; Li, Y.; Song, Y.; Chen, J.; Zhang, J.; Zhang, M. Performance comparison of combining algorithms for polarization-diversity receiving in phase-sensitive OTDR. Opt. Commun. 2019, 435, 140–144. [Google Scholar] [CrossRef]
  19. Qiao, J.; Yin, X.; Wang, Y.; Xu, W.; Tan, L. A multi-terminal traveling wave fault location method for active distribution network based on residual clustering. Int. J. Electr. Power Energy Syst. 2021, 131, 107070. [Google Scholar] [CrossRef]
  20. Liu, X.; Li, J.; Shi, B.; Ding, G.; Dong, F.; Zhang, Z. Intelligent detection technology for leakage bag of baghouse based on distributed optical fiber sensor. Opt. Fiber Technol. 2019, 52, 101947. [Google Scholar] [CrossRef]
  21. Yang, Y.Y.; Zhang, H.F.; Li, Y. Long-Distance Pipeline Safety Early Warning: A Distributed Optical Fiber Sensing Semi-Supervised Learning Method. IEEE Sens. J. 2021, 21, 19453–19461. [Google Scholar] [CrossRef]
  22. Zhang, H.; Yuan, Z.X.; Li, X.Y.; Qin, J. Improved Wavelet Threshold De-noising Method for Distributed Optical Fiber Lightning Location. Electr. Power Constr. 2021, 42, 75–82. [Google Scholar]
  23. Chen, H.; Xu, Y.; Qian, S.; Chen, C.; Guo, J.; Su, L. Distributed Fiber-Optic Ultrasonic Sensor Applied in Detection of Discharging Fault of Power Cable Joint. Acta Opt. Sin. 2021, 41, 22–30. [Google Scholar]
  24. Zhang, W.; Wu, Q.Y.; Zhang, Z.X.; Tian, Y.J.; Yang, Y.; Xu, X.H.; Ma, J.; Li, J. Application of distributed optical fiber pipeline monitoring technology in long-distance water conveyance project. Water Wastewater Eng. 2022, 58, 124–129. [Google Scholar]
  25. Yang, F.; Tang, X.L.; Yin, W.K.; Gong, X.; Hu, Y.; Yuan, Q.; Ke, W. Analysis of transmission line wind vibration monitoring based on a multi parameter distributed optical fiber sensor. Power Syst. Prot. Control. 2022, 50, 169–177. [Google Scholar]
  26. Yang, W.C.; Qin, Z.G.; Liu, Z.J.; Xu, Y.P.; Li, Z.; Qu, S.; Cong, Z.H.; Wang, Z.Q. A Hilbert-Huang transform method for vibration localization based on a dual Mach-Zehnder distributed optical fiber sensor. Chin. Opt. 2021, 14, 1410–1416. [Google Scholar]
  27. Zazoum, B.; El Hassan, M.; Jendoubi, A. Solar optical fiber daylighting system with an IR filter: Experimental and modeling studies. Energy Rep. 2020, 6, 903–908. [Google Scholar] [CrossRef]
  28. Al-Amayreh, M.I.; Alahmer, A.; Jendoubi, A. A novel parabolic solar dish design for a hybrid solar lighting-thermal applications. Energy Rep. 2020, 6, 1136–1143. [Google Scholar] [CrossRef]
  29. Teng, F.; Yi, D.; Hong, X.; Li, X. Distributed fiber optics disturbance sensor using a dual-Sagnac interferometer. Opt. Lett. 2019, 44, 5101–5103. [Google Scholar] [CrossRef]
  30. Choban, T.V.; Zhirnov, A.A.; Stepanov, K.V.; Koshelev, K.I.; Chernutsky, A.O.; Pnev, A.B.; Karasik, V.E. A Distributed Acoustic Sensor Based on Dual-Sagnac Interferometer with Counter Loops. In Proceedings of the 2021 Photonics & Electromagnetics Research Symposium (PIERS), Hangzhou, China, 21–25 November 2021; pp. 2922–2928. [Google Scholar]
  31. Zhirnov, A.A.; Choban, T.V.; Stepanov, K.V.; Koshelev, K.I.; Chernutsky, A.O.; Pnev, A.B.; Karasik, V.E. Distributed Acoustic Sensor Using a Double Sagnac Interferometer Based on Wavelength Division Multiplexing. Sensors 2022, 22, 2772. [Google Scholar] [CrossRef]
  32. Wu, J.; Zhuo, R.; Wan, S.; Xiong, X.; Xu, X.; Liu, B.; Liu, J.; Shi, J.; Sun, J.; He, X.; et al. Intrusion location technology of Sagnac distributed fiber optical sensing system based on deep learning. IEEE Sens. J. 2021, 21, 13327–13334. [Google Scholar] [CrossRef]
Figure 1. Principle block diagram of Sagnac optical fiber sensing detection.
Energies 16 03494 g001
Figure 2. Block diagram of the delay estimation algorithm.
Energies 16 03494 g002
Figure 3. Optical fiber sensing system for detecting interference signal.
Energies 16 03494 g003
Figure 4. Calculation results of time delay estimation algorithm with interference signal. (a) The signals detected by PDs. (b) The phase difference signal Δ φ 1 t and Δ φ 2 t . (c) The delayed signal Δ ϕ 1 t and Δ ϕ 2 t (d) The cross-correlation of Δ ϕ 1 t and Δ ϕ 2 t .
Energies 16 03494 g004aEnergies 16 03494 g004b
Figure 5. Schematic diagram of partial discharge detection wiring of an XLPE cable.
Energies 16 03494 g005
Figure 6. Wiring diagram for partial discharge testing of optical fiber sensing cable.
Energies 16 03494 g006
Figure 7. Time domain diagram of interference signal.
Energies 16 03494 g007
Figure 8. Flow chart of positioning calculation method.
Energies 16 03494 g008
Figure 9. EMD decomposition diagram of interference signal.
Energies 16 03494 g009
Figure 10. Hilbert spectrum of interference signal.
Energies 16 03494 g010
Figure 11. Positioning deviation curve of different positions.
Energies 16 03494 g011
Disclaimer/Publisher’s Note: The statements, opinions and data contained in all publications are solely those of the individual author(s) and contributor(s) and not of MDPI and/or the editor(s). MDPI and/or the editor(s) disclaim responsibility for any injury to people or property resulting from any ideas, methods, instructions or products referred to in the content.

