Abstract
Pyrolysis is one of the most popular methods for the thermal conversion of biomass-derived materials, which can be applied to produce valuable products such as biochar, bio-oil, and pyrolysis gas. However, this does not change the need for more precise data on the products obtained from such processes under different conditions, using different types of reactors or types of biomass material. Pyrolysis products can have a high energy value and have been extensively studied. In the presented research, three potential energy feedstocks from waste biomass, wheat cereal straw (CS), tobacco waste (TW), and furniture waste (FW) were comprehensively evaluated in terms of product yields, as well as the chemical composition of the volatile products of the pyrolysis process using the pyrolysis–gas chromatography–mass spectrometry technique and the chemical distribution of the products obtained under fixed-bed pyrolysis conditions. The obtained results were compared to data from the literature, which provided thorough information on the pyrolysis of biomass materials in diverse systems. The research identified the primary elements of the liquid fraction, such as N-compounds, furans, phenols, benzene, PAHs, aldehyde-ketone-alcohol, and organic acids, which were the main constituents of the liquid fraction, and the concentration of non-condensable components of gaseous products. The research discussed in this article provides a comprehensive approach to the thermal conversion of biomass materials, which, depending on their origin, processing conditions, and methodologies, can be utilised for more than only energy production.
1. Introduction
Biomass can be used as a renewable feedstock to produce bioenergy and can be utilized in the production of syngas, bio-oil, and biochar, which have numerous applications [1,2,3,4,5]. The role of biomass in pyrolysis processes to produce biofuels [6] is essential to achieving future sustainable energy development goals. This process is a thermochemical conversion process, which must be improved before biofuel production [7]. Owing to bio-oil’s ability to be converted into fuels, chemicals, and energy, it is considered a renewable resource [8].
Several investigations have shown that bio-oil contains a wide variety of chemical compound groups, such as phenolics, acids, alkaloids, aldehydes, alcohols, ketones, and ethers [9,10]. A solid product of pyrolysis is biochar, which is a substance rich in carbon, possesses a porous structure, and exhibits a high calorific value. Therefore, it can potentially be utilized in the energy industry as either an adsorbent or catalyst [11].
The production of first-generation biofuels from energy crops is not encouraged due to its rivalry with the food industry [1,12]. However, the concept of biomass also includes second-generation sources such as waste biomass feedstocks, waste oils, and vegetable oils [1,12]. Pyrolysis–gas chromatography–mass spectrometry (Py-GC/MS) is one of the most common methods for swift screening and determination of bio-oil composition because of its versatility and the minimal amount of feed required. Recent studies have summarisd the rapid analysis of pyrolysis products [5,13,14,15,16,17,18,19,20,21,22]. This technique has been applied to many different types of microalgae [13,14], corn cob, wheat straw, rice husk [17], rice straw [16,17] tobacco waste [18], pinewood, switchgrass–pine residues [20], date pits, coffee waste, catalysts [19], cow dung [21], teff husk [22], eucalyptus, mentha, and palmarosa biomass [5].
Understanding the parameters influencing both the quantitative and qualitative parameters of the pyrolysis products obtained from various materials belonging to the waste biomass group makes it possible to provide the necessary data, e.g., in the construction of predictive models [23,24,25,26,27]. Therefore, research into such raw materials is still necessary to gain better insight into the potential applications of thermal conversion methods in the valorisation of waste biomass. The presented research compared three different types of waste biomass for their viability as a renewable energy resource.
In this study, three types of waste biomass were selected, wheat cereal straw (CS), tobacco waste (TW), and furniture waste (FW), due to their wide availability and their potential for use as alternative sources for the production of chemical compounds or as substrates for further synthesis and biofuel production [28,29,30,31,32].
Straw was chosen because it has been identified as one of the best possible biomass feedstocks in Europe [33], and it has the potential to play a significant role in advanced biofuels in the future. There is little competition from other land uses, resulting in relatively low matching land use change effects. The use of straw is regarded as an environmentally beneficial and socially acceptable choice of feedstock for bioenergy provision. Nonetheless, there are a number of questions regarding the actual potential of agricultural leftovers such as straw for the sustainable production of bioenergy. Tobacco waste was the second feedstock chosen for these investigations because tobacco is a major cash crop in the global market, with an annual production of more than 4 million tonnes [34], approximately 20% of which was converted into tobacco waste during cigarette production, including tobacco stems and shredded leaves [35]. A greater understanding of tobacco’s pyrolytic characteristics is critical for influencing the design of tobacco products and offering a more efficient use of tobacco waste.
According to the United States Environmental Protection Agency (USEPA), the output of wood waste, such as waste furniture boards (WFBs), reached 18.0 million tonnes in 2018, and around 12.1 million tonnes were disposed of in landfills [30]. This large waste volume could be ascribed to the strong demand for new furniture as well as the unfavourable method of waste disposal (e.g., landfill) currently in use. Furthermore, when businesses shift or close, leftover furniture may be disposed of as waste, increasing the waste volume [36]. Because of its nature, Furniture Waste (FW) is difficult to transfer, recycle, and sell; it contains toxic ingredients such as waxes, binders, paints, flame retardants, and coatings, which are difficult to dispose of securely, resulting in environmental consequences [37].
In order to ensure that the results could be compared to those of previous studies, the tests were done at a constant temperature of 600 °C. Some of the results such as bio-oil and pyrolysis gas that yield from pyrolysis of this biomass in several different temperature conditions (Table 1) were studied before, which allowed researchers to gather information about them in the literature and compare them with obtained results.

Table 1.
Impact of pyrolysis process parameters on high-value products from waste biomass feedstocks.
The obtained experimental results confirmed the yields reported in the literature and provided additional insights into the importance of the following: the composition of the different fractions, examination of the liquid and gas fractions, and the distribution of their components based on the kind of biomass. According to our investigations, it was confirmed which primary components (that vary depending on the material) were present in the liquid products. This study helps a number of industrial and agricultural sectors identify opportunities for the utilisation of biomass waste through the use of pyrolysis methods, and for future investors interested in the thermal conversion of biomass waste, it provides relevant data and information on how the various parameters of the products resulting from the pyrolysis process may change depending on the type of material and the way in which it is treated (fast pyrolysis or slow pyrolysis in a stationary/fixed bed).
Understanding the bio-oil content in biomass wastes provides vital information to create prediction models. Hence, investigations on such feedstocks are still necessary to gain greater insight into the potential applications for valorisation. In order to determine the ideal pyrolytic operating parameters for wheat cereal straw (CS), tobacco waste (TW), and furniture waste (FW), we examined the properties of the products produced at a constant temperature of 600 °C using a fixed-bed reactor by Py-GC-MS. The presented research compared three different types of waste biomass for their viability as a renewable energy resource. We provided a comprehensive approach via the comparison of the results of batch pyrolysis and microscale pyrolysis utilizing Py-GC-MS technology. The study employed three essential types of biomass materials CS, TW, and FW. Additional insights into the importance of the following were obtained: the composition of the different fractions, examination of the liquid and gas fractions, and the distribution of their components based on the kind of biomass. This study assists the numerous industrial and agricultural sectors regarding the appropriate disposal of waste biomass feedstocks.
2. Materials and Methods
2.1. Materials
All collected samples, including cereal straw (CS), tobacco waste (TW) (specifically stems), and furniture waste (FW), were acquired from a company located in the Krakow district of Poland. FW consisted of scraps of various fragments of medium-density fibreboard (MDF). The studied samples were prepared according to the ISO 14780:2017 standard, inter alia, by being ground by a Retsch SM 100 mill (Retsch, Haan, Germany) to a particle size of below 1 mm. The samples were in the form of a fine, light brown, or brown powder.
2.2. Proximate and Ultimate Analysis
Ash, fixed carbon, volatile matter, and moisture content (proximate analysis) were measured sequentially in all biomass samples (CS, TW, and FW) as well as in the biochar obtained from the stationary bed pyrolysis operations. These parameters were analysed by the TGA801 thermal gravimetric analyser. Similar to proximate analysis, in all solid samples, the concentrations of carbon (Cta), oxygen (Ota), hydrogen (Hta), sulphur (Sta), and nitrogen (Na) were determined using a Vario Macro Cube elemental analyser (Elementar, Langenselbold, Germany) (where t—total, e.g., total carbon, and a—in the analytical state, i.e., the sample after crushing, drying, and sieving—ready for analysis). The samples were analysed according to the methods used for this type of material and a detailed description can be found in previously published work [18,38,39,40,41].
2.3. Gas Chromatography (GC) Analysis
Before GC analysis of bio-oils obtained during the pyrolysis process, in all bio-oil samples, the water content was determined by the Karl Fischer titration method. Then, using the Thermo-Scientific Trace GC Ultra gas chromatograph (Agilent Technologies, Inc., Santa Clara, CA, USA), the organic content such as VOCs, NHx compounds, carboxylic acids, aldehydes, ketones, furans, and phenols are all examples of these. Polycyclic aromatic hydrocarbons (PAHs) and aromatic hydrocarbons (AHCs), such as benzene, toluene, styrene, and xylenes, were analysed. For GC analysis the ZB-Waxplus capillary columns measuring 60 m × 0.32 mm × 0.25 µm were used at a flow rate of 2 mL/min with helium as the carrier gas. After 5 min preheating at 50 °C, the boiler temperature was increased by 10 °C per min until it reached 220 °C (with a run time of 38 min). A split/splitless dispensing system (1:25) was used at 220 °C. After chromatographic analysis, all liquid samples were vaporized at 65 °C and 0.1 atm of pressure to yield a constant mass of tar.
For the chromatographic analysis of gaseous samples obtained after carrying out processes, a CP 3800 was used, which was equipped with two detectors: a flame ionization detector (FID) and a thermal conductivity detector (TCD). The gaseous products, which consist of hydrogen (H2), carbon monoxide (CO), carbon dioxide (CO2), methane (CH4), ethane (C2H6), etc., were studied both qualitatively and quantitatively. Energy calculations were made in accordance with the National Standard EN ISO 6976:2016. A more detailed description of the analyses carried out as described in the earlier studies is referenced [18].
2.4. Pyrolysis Gas Chromatography-Mass Spectrometry (Py-GC-MS)
Analysis of the biomass feedstocks (CS, TW, and FW) was achieved using a CDS 5200 (CDS Analytical, Oxford, PA, USA). At the beginning of each test, the sample (around 1.00 mg) was placed in a quartz tube, and both ends were sealed with quartz wool. The GC oven temperature was raised from 45 to 275 °C at a rate of 5 °C/min, and the thermal decomposition temperature was set at 600 °C. The generated sample vapours from the tube were fed into the column at a rate of 1.91 mL/min and 27.3 kPa pressure, while the remaining volume was evacuated. This was accomplished using a capillary column temperature controller and MS at 70 eV on a PerkinElmer Clarus GC/MS (PerkinElmer, Waltham, MA, USA). A Zebron™ ZB-5MS, GC capillary column 30 m × 0.25 mm × 0.25 µm (Zebron, Newport Beach, CA, USA) was used, where its stationary phase was composed of 5% diphenyl and 95% dimethylpolysiloxane. The mass spectrometer was checked for accuracy using the following settings: 45–300 m/z scan speed, 10−5 Pa, 250 °C ion source heater, and 300 °C interface heater. The obtained chromatograms and spectra were analysed using PerkinElmer TurboMass 6.0 software, and the NIST17.0 database, which was used after the runs were completed [18].
2.5. Fixed-Bed Pyrolysis
The test stand (Figure 1) consists of a steel retort placed in a two-zone electric resistance furnace, in which approximately 100 g of the test sample is placed each time. In addition to the steel retort and resistance furnace, the stand also consists of a set of glass scrubbers, two of which were filled with isopropanol (i-Pr) and placed in a cryostat, to maintain the temperature at around −15 °C and reduce the temperature of the pyrolysis oil as quickly as possible, so as to minimise any subsequent reactions. The last scrubber in the set was filled with glass wool to stop the aerosol particles from entering the Tedlar-type sample bag. Once the required amount of biomass had been placed, the reactor was closed and then flushed with nitrogen to inert the reaction environment. The gas purge was carried out using a nitrogen flow rate of 500 cm3/h for approx. 30 min. The retort was equipped with a thermocouple for measuring the temperature inside the retort, its length guaranteeing that the temperature was measured inside the sample. After this time, the nitrogen flow rate was reduced to 100 cm3/h and the retort with the sample was placed in a resistance furnace preheated to 600 °C, after that the temperature was increased so that a temperature of 600 °C was also reached on the inside of the retort, in order to obtain the fastest possible temperature ramp-up. Once the temperature inside the retort was reached, the pyrolysis process was carried out for 10 min. After this time, the retort with the sample was removed from the heating zone and cooled to room temperature. All products obtained after pyrolysis were collected and submitted for further physicochemical analyses. A more detailed description of the process carried out as described in the earlier studies is referenced [18].
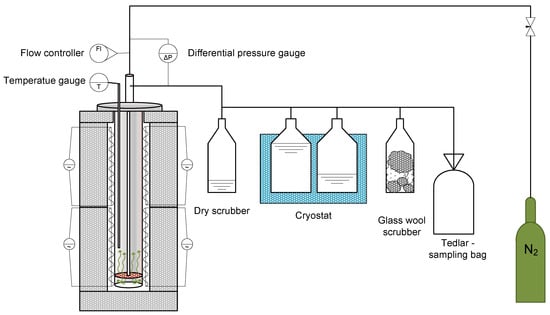
Figure 1.
The test set up for pyrolysis of biomass waste samples in a fixed-bed reactor.
3. Results
3.1. Materials
Table 2 displays the results of various analyses conducted on samples from the investigated waste biomass feedstocks (CS, TW, and FW).
Table 2.
Analytical results of air-dried waste biomass feedstock samples (CS, TW, and FW).
The volatile content was lowest in TW (67%) and highest in FW (78%), highlighting the potential range of bio-oil and syngas production in the biomass samples. In addition, TW had the highest levels of ash and moisture; whereas, CS and FW had nearly identical levels. TW contained the least amount of carbon (C), H2, and oxygen (O2) atoms. Similar ranges of three elemental compositions existed in SC and FW. However, FW contained the most amount of N2, and CS contained the least.
3.2. Results from the Pyrolysis Gas Chromatography Mass Spectrometry (Py-GC-MS)
The analytical pyrolysis method (Py-GC-MS) presented in this study was used to determine the main organic compounds that are formed during the pyrolysis of waste biomass samples, i.e., CS, FW, and TW. The analytical results presented below were obtained during analytical pyrolysis carried out at 600 °C. The pyrogram of the cereal straw (Figure 2) showed that its primary components were acetic acid (1.28 min), 4-ethenyl-2-methoxyphenol (12.72 min), 2-methoxyphenol (6.99 min), 2-methoxy-4-[(E)-prop-1-enyl]phenol (16.04 min), furan-2-carbaldehyde (2.38 min), and 4-ethylphenol (9.38 min). The pyrogram of furniture waste (Figure 2) contained prop-1-en-2-ylbenzene (2.98 min), 4-ethenyl-2-methoxyphenol (12.72 min), 4-ethylphenol (9.38 min), 2-methoxyphenol (6.99 min), 2-methoxy-4-[(E)-prop-1-enyl]phenol (16.04 min), and diphenylmethanone (19.87 min), and the pyrogram of tobacco waste (Figure 2) contained 3-[(2S)-1-methylpyrrolidin-2-yl]pyridine (nicotine) (13.38 min), 1,3-pentadiene (1.15 min), 1-methyl-4-prop-1-en-2-ylcyclohexene (5.49 min), acetic acid (1.28 min), icos-3-yne (24.70 min), and nitrosomethane (1.09 min).
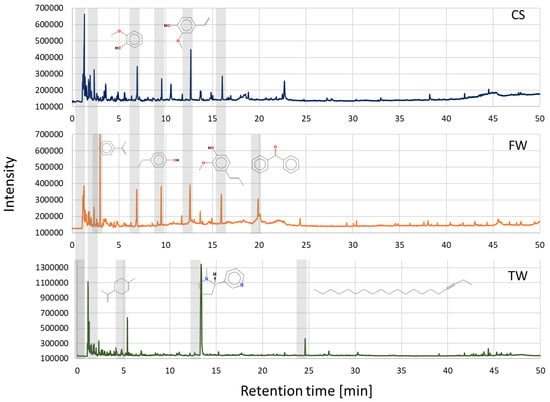
Figure 2.
Pyrograms of waste biomass feedstocks CS, FW, and TW were obtained at 600 °C.
Py-GC-MS analysis of the studied waste biomass feedstocks at 600 °C showed a distribution of chemical compounds (Table 3). The amount of possibly generated liquid product components varied depending on biomass type.
Table 3.
Chemical compound distribution determined by Py-GC-MS analysis (area%) of waste biomass feedstocks (CS, TW, and FW).
3.3. Distribution of Fixed-Bed Pyrolysis Products from Waste Biomass Feedstocks (CS, TW, and FW)
In the fixed-bed reactor, waste biomass feedstocks (CS, TW, and FW) were pyrolyzed under the same temperature conditions as Py-GC-MS analysis. The relative amounts of solid (biochar), liquid (condensable), and gaseous (incondensable) products from each fraction are shown in Figure 3. All the pyrolysis fractions produced by the fixed-bed reactor were collected for further chemical analysis. The pyrolysis tests were conducted in triplet to ensure consistency of the results.
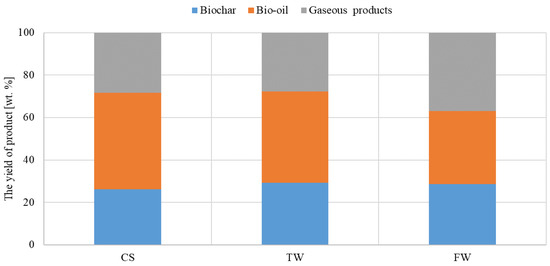
Figure 3.
Yield distribution of waste biomass feedstocks (CS, TW, and FW) pyrolyzed at the same temperatures.
Due to the low decomposition rate of TW at 600 °C, the biochar yield was only 29% by weight. Additionally, biochar yields of 28% and 26% were observed for FW and CS, respectively. Oil and gas products contained volatile compounds that were extracted from the solid residue during pyrolysis, where CS yielded the highest percentage. Volatile compounds predominated in the oil at 600 °C; in which, CS exhibited the highest percentage (45.5 wt%), and TW and FW were 42.9 wt% and 34.4 wt%, respectively. Though FW’s gas product yielded the highest percentage of volatile compounds at the same temperature, its maximum was only 37 wt%. CS and TW amounted to 28.4 wt% and 27.8 wt%, respectively.
The pyrolysis test results of the initial and final biochar analyses are shown in Figure 4. According to biochar’s basic composition, TW’s biochar displayed the highest concentrations of ash, FC, VM, and moisture.
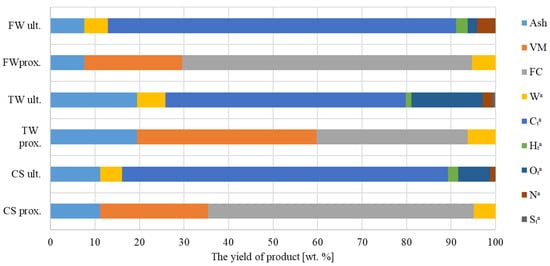
Figure 4.
Evaluation of biochar’s potential and its ultimate significance (t—total, e.g., total carbon, and a—in the analytical state, i.e., the sample after crushing, drying, and sieving—ready for analysis).
Element analysis further demonstrated that FW biochar had the highest concentrations of carbon, hydrogen, and nitrogen. However, TW’s biochar possessed the highest concentration of sulphur and oxygen among the studied samples.
The liquid and solid (biochar) fractions were also analysed. The water content (using the Karl Fischer method), organic matter content (using volatile organic compound analysis by gas chromatography), and tar content (using evaporation to constant mass at 65 °C under 0.1 bar pressure) of all liquid products were examined. Yields of water, volatile organic compounds (VOCs), and tar from waste biomass feedstocks obtained at the same temperatures are shown in Figure 5. Figure 3 shows that at 600 °C, CS yield was 45.5% and contained 29.2% water and 9.6% VOCs. At 9.0 wt%, FW displayed the highest tar content.
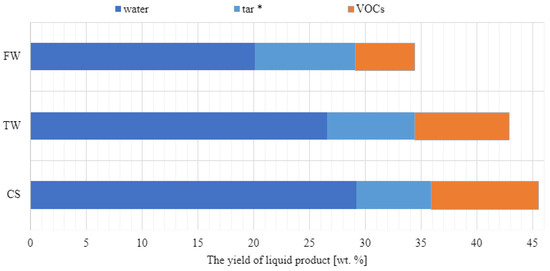
Figure 5.
Pyrolysis of waste biomass results in a variable liquid product yield distribution (CS, TW, and FW). Evaporation of the residue to a constant mass of liquid products (at 0.1 bar, 65 °C), allowing for the determination of tar concentration (*).
Quantitative analysis of the amount of water and final analysis was performed to determine the impact of waste biomass feedstocks on the characteristics of the liquid fraction (Figure 6). The final analysis showed that the organic component of oil was relatively high, with a C content of 68–70 wt% despite a high water content of 20–29 wt%. In general, all samples exhibited similar tendencies in hydrogen and nitrogen content, while FW had a higher oxygen content. The tar content may have affected similar carbon concentrations in all samples. In addition, during the research study, it was attempted to minimise the effect of heterogeneity of the liquid samples; hence, immediately before sampling for analysis, the samples were homogenised.
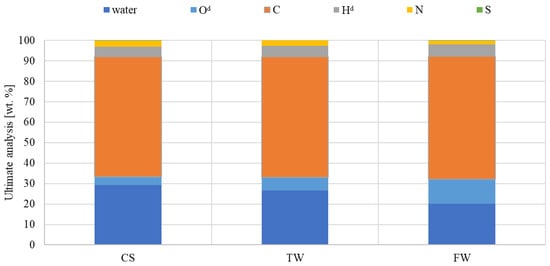
Figure 6.
The ultimate analysis of liquid compounds generated under the same pyrolysis conditions (d—dry condition).
Figure 7 shows the chemical groups’ concentrations in the liquid products under investigation. The liquid sample obtained from CS pyrolysis contained aldehydes, ketones, alcohols, and acids. The liquid samples obtained from CS and TW pyrolysis contained similar amounts of furans and phenols. In addition, it was noted that the liquid sample from TW pyrolysis had the highest concentrations of PAHs, N-compounds, and benzene derivatives. Compared to the other samples, the one obtained from the thermal conversion of FW had the lowest amount of organic compounds.
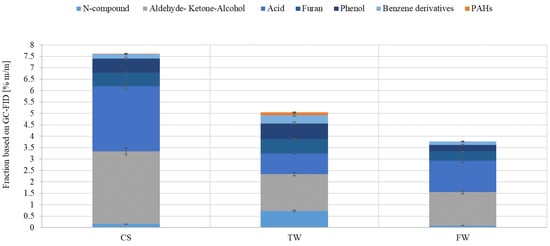
Figure 7.
Measurement of the fractional composition of liquid oil produced by pyrolysis of waste biomass feedstocks (CS, TW, and FW) at a constant temperature using Py-GC-MS.
The concentrations of H2, CO2, CO, and alkanes (CH4, C2H4, C2H6, C3H8, C3H6, etc.) analysed by chromatographic methods in the gaseous product obtained from pyrolysis are shown in Figure 8.
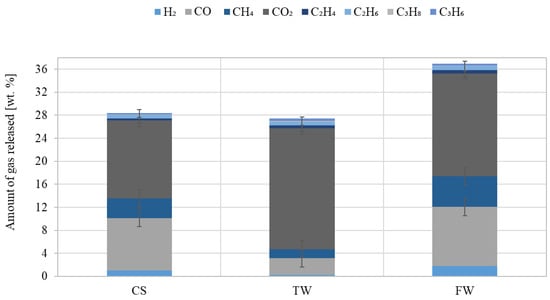
Figure 8.
Amount of gas released at the same pyrolysis temperature from waste biomass feedstocks (CS, TW, and FW) (composition converted to oxygen-free and nitrogen-free conditions).
The highest CO2 concentration of approximately 21 wt% was determined in the gas samples obtained after TW pyrolysis. It is known that decarboxylation of cellulose and hemicellulose, and the possibility of volatile compounds occurring during the secondary reaction, produce CO2. However, compared to CO2, the amount of CO released was much higher, where FW was approx. 10.2 wt%. The measured hydrogen content of the studied samples revealed that FW was the highest content at approx. 2 wt%. This stemmed from the demethoxylation of lignin in the solid residue or from the release of volatile compounds during the secondary reaction. It was observed that a discernable release of C2-C3 compounds occurred at 600 °C. At this temperature, the low calorific values (MJ/m3) of TW, CS, and FW gas were 12.8, 13.3, and 14.0, respectively.
Previous studies reported similar findings, even with other biomass-derived products such as rice straw and husk, corn cob, wheat straw, tobacco waste, pinewood, switchgrass, pine residues, date pits, coffee waste, cow dung, teff husk, eucalyptus, metha, and palmarosa biomass [5,13,14,15,16,17,18,19,20,21,22,42,43,44,45]. According to the literature, hemicellulose deteriorates at an accelerated rate at first when temperatures increase rapidly. The decomposition of hemicellulose occurs between 219 and 290 °C. Furthermore, cellulose’s structure is more sturdy and rigid than most organic compounds; hence, it degrades over time upon exposure to high temperatures. Between 269 and 388 °C, hemicellulose’s cellulose breaks down. In the third phase of pyrolysis, the temperature is raised to degrade lignin, the most resistant component of lignocellulosic biomass. Even though lignin decomposes at a higher temperature than the other components, all decompose simultaneously.
4. The Py-GC-MS and Fixed-Bed Pyrolysis—Discussion
The first step involves the removal of moisture and light organic substances, such as waxes, terpenes, and alkaloids (including nicotine found in TW), from the sample during the drying process. Pyrolysis consists of four main steps which schematically was presented in Figure 9.
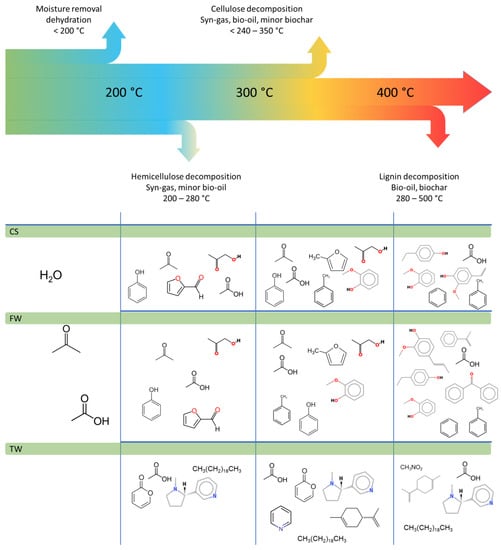
Figure 9.
Biomass decomposition behaviour of components at various temperatures together with selected chemical compounds released during the different stages of pyrolysis.
The presented data are comparable with other studies [32]. Based on the performed analysis with the highest moisture content, TW was analysed (11.1%). Samples of CS and FW were characterized by a slightly lower moisture content of 8.3% and 5.8% m/m, respectively.
When the pyrolysis temperature was consistently increased, the main building blocks of biomass (cellulose, hemicellulose, and lignin) decomposed to smaller chemicals, such as water, tar, and organic matter. The decomposition of hemicellulose and cellulose depended on the process conditions and generates water, ketones, aldehydes, furans, and carboxylic acids [13,14,15,16,17,18,19,20,21,22]. Thermal decomposition of lignin leads produced phenols (siring derivatives and guaiacol) and the majority of tar substances.
The second step (pyrolysis process) is related to the secondary thermal decomposition of the primary pyrolysis products and is affected by the temperature and the amount of time the liquid and gaseous components remain inside the heated zone of the reactor. A variety of aromatic hydrocarbons, including PAHs, toluene, benzene, xylenes, and styrene, are products of this system. It also affected the yield of gaseous products which increased with decreasing liquid product yield. The secondary process that uses water is steam gasification (mostly pyrogenetic) and biochar [42,43,44,45].
The pyrolysis of the various waste biomass feedstocks used in this study highlights the ability of the distribution of the main components to change.
In the case of TW, the drying process (the first stage) increased water production and the presence of nicotine in the collected products [13,14,16,17,18,19,20,21,22]. The primary and secondary decomposition efficiency of organic compounds (stages 2 and 3) in test samples were evaluated, where competitive secondary decomposition processes began to dominate, leading to increased gaseous product output. Anhydrosaccharides, one of the primary decomposition products of polysaccharides, such as cellulose and starch [46,47], were not detected at detectable concentrations (Figure 7). This was probably due to its brief exposure to the reactor’s core. As the residence time of liquid products was increased at elevated temperatures, the yields of the aforementioned compounds increased. However, benzene and its derivatives were detected in low yields due to the short residence time of liquid products in the heated zone of the reactor. The rapid temperature increase within the reactor (the retort with the tested sample was inserted into a heated furnace; thus, the heating rate was limited only by heat conduction through the retort walls) promoted pyrolysis in an N2 stream, as well as the turbulence of drying and thermal degradation processes.
The analysis of volatile components produced by pyrolysis of waste biomass feedstock (CS, TW, and FW) at the same temperature, and the comparison of the chemical composition of liquid samples obtained using two different methods reveals differences that were attributed to factors such as heating rate, duration of exposure to secondary reactions, and process size.
According to Py-GC-MS, when the peak area and relative abundance of compounds related to the area percentage were compared, it was discovered that benzene derivatives, specifically toluene, were present in greater quantities in TW and FW samples. This was in contrast to waste biomass feedstock pyrolysis in a fixed bed reactor, where benzene derivatives were present in low concentrations.
TW and FW had the highest and lowest toluene concentration values at 0.4% m/m and 0.1% m/m, respectively. It was considered that both benzene derivatives and PAHs showed the most increase during the condensation and structural reformation of biochar.
The percentage area of alkenes (1,3-pentadiene) was discovered in TW (confirmed in other studies of this type [35]) and CS samples, but alkenes were not detected in liquids derived from fixed-bed pyrolysis, which was most likely due to the substantial longer residence time in the reaction zone. Phenolic chemicals are typical lignocellulosic biomass products, principally derived from the degradation of lignin. These chemicals were observed in all examined samples, with the highest quantities recorded in CS and TW. Together with the temperature, prolongation of the residence time of volatile chemicals in the heating zone (compared to Py-GC-GM) could contribute to the concentration increase. However, in the case of Py-GC-MS, which includes pyrolysis in a matter of seconds, the liberated chemicals were delivered directly to the chromatographic column, with little probability of subsequent reactions increasing the number of phenolic compounds. We revealed the presence of a high concentration of the acid group in the pyrolysis products of waste biomass feedstocks. At 600 °C, the primary component was acetic acid, with a concentration of 16.5% for CS; while, the greatest concentration of this compound in a fixed bed reactor for SC was 2.8% m/m. Furan was formed largely through the degradation of hemicellulose and cellulose, and its concentrations were the highest in CS and TW, as well as the furan-2-carbaldehyde percentage area in CS (confirmed in other studies of this type [16,17,48]).
5. Conclusions
In order to cover the topic of pyrolysis of biomass and biomass-derived waste materials in a broader sense, three materials that differ greatly both chemically and in terms of origin were chosen in the study: cereal straw (CS), tobacco waste (TW), and furniture waste (FW). They were also chosen due to their widespread availability and potential for use as an alternative feedstock source for chemical compound synthesis or biofuel production.
The study was conducted under conditions comparable to others previously conducted by other researchers, allowing for comparison and providing a benchmark for future researchers. The experimental results corroborated the existing data while also revealing new information, such as the composition of the distinct fractions, with a focus on the liquid and gas fractions, and the distribution of their components based on the kind of biomass. The investigation demonstrated which primary components (depending on the substance) were present in the liquid products. In addition to the characterisation of both liquid and gaseous products, an important outcome of the study was the description of the yield of tar-forming products, the presence of which was correlated with the absence of anhydrosaccharides and benzene derivatives in the liquid products, which is related to the long residence time of volatile pyrolysis products in the reaction zone in the case of fixed-bed pyrolysis.
Author Contributions
Conceptualisation, R.M. and M.S.; methodology, R.M. and M.S.; formal analysis, R.M.; investigation, R.M. and M.S.; writing—original draft preparation, M.S., R.M., S.S., M.O. and M.D.; writing—review and editing, M.S., R.M., S.S., M.O. and M.D.; visualisation, M.S.; supervision, M.S. and R.M. All authors have read and agreed to the published version of the manuscript.
Funding
This work was supported by the Faculty of Energy and Environmental Engineering, Silesian University of Technology (statutory research).
Data Availability Statement
The supporting data and results can be found in the data repository: Sajdak, Marcin (2022), “Py-GC-MS of wheat straw”, Mendeley Data, V1, doi: 10.17632/pwpf26j8b3.1, and Sajdak, Marcin (2021), “Characteristics of chars from biomass and waste co-pyrolysis”, Mendeley Data, V2, doi: 10.17632/rjg7j5wzrj.2.
Conflicts of Interest
The authors declare no conflict of interest.
References
- Ahorsu, R.; Medina, F.; Constantí, M. Significance and Challenges of Biomass as a Suitable Feedstock for Bioenergy and Biochemical Production: A Review. Energies 2018, 11, 3366. [Google Scholar] [CrossRef]
- Dai, L.; Zhou, N.; Li, H.; Deng, W.; Cheng, Y.; Wang, Y.; Liu, Y.; Cobb, K.; Lei, H.; Chen, P.; et al. Recent Advances in Improving Lignocellulosic Biomass-Based Bio-Oil Production. J. Anal. Appl. Pyrolysis 2020, 149, 104845. [Google Scholar] [CrossRef]
- Barta-Rajnai, E.; Wang, L.; Sebestyén, Z.; Barta, Z.; Khalil, R.; Skreiberg, Ø.; Grønli, M.; Jakab, E.; Czégény, Z. Comparative Study on the Thermal Behavior of Untreated and Various Torrefied Bark, Stem Wood, and Stump of Norway Spruce. Appl. Energy 2017, 204, 1043–1054. [Google Scholar] [CrossRef]
- Hupa, M.; Karlström, O.; Vainio, E. Biomass Combustion Technology Development—It Is All about Chemical Details. Proc. Combust. Inst. 2017, 36, 113–134. [Google Scholar] [CrossRef]
- Kaur, R.; Kumar, A.; Biswas, B.; Krishna, B.B.; Bhaskar, T. Investigations into Pyrolytic Behaviour of Spent Citronella Waste: Slow and Flash Pyrolysis Study. Bioresour. Technol. 2022, 366, 128202. [Google Scholar] [CrossRef] [PubMed]
- Hoang, A.T.; Ong, H.C.; Fattah, I.M.R.; Chong, C.T.; Cheng, C.K.; Sakthivel, R.; Ok, Y.S. Progress on the Lignocellulosic Biomass Pyrolysis for Biofuel Production toward Environmental Sustainability. Fuel Process. Technol. 2021, 223, 106997. [Google Scholar] [CrossRef]
- Hansen, S.; Mirkouei, A.; Diaz, L.A. A Comprehensive State-of-Technology Review for Upgrading Bio-Oil to Renewable or Blended Hydrocarbon Fuels. Renew. Sustain. Energy Rev. 2020, 118, 109548. [Google Scholar] [CrossRef]
- Hu, X.; Gholizadeh, M. Progress of the Applications of Bio-Oil. Renew. Sustain. Energy Rev. 2020, 134, 110124. [Google Scholar] [CrossRef]
- Amenaghawon, A.N.; Anyalewechi, C.L.; Okieimen, C.O.; Kusuma, H.S. Biomass Pyrolysis Technologies for Value-Added Products: A State-of-the-Art Review. Environ. Dev. Sustain. 2021, 23, 14324–14378. [Google Scholar] [CrossRef]
- Fahmy, T.Y.A.; Fahmy, Y.; Mobarak, F.; El-Sakhawy, M.; Abou-Zeid, R.E. Biomass Pyrolysis: Past, Present, and Future. Environ. Dev. Sustain. 2020, 22, 17–32. [Google Scholar] [CrossRef]
- Muzyka, R.; Misztal, E.; Hrabak, J.; Banks, S.W.; Sajdak, M. Various Biomass Pyrolysis Conditions Influence the Porosity and Pore Size Distribution of Biochar. Energy 2023, 263, 126128. [Google Scholar] [CrossRef]
- Haghighat, M.; Majidian, N.; Hallajisani, A.; samipourgiri, M. Production of Bio-Oil from Sewage Sludge: A Review on the Thermal and Catalytic Conversion by Pyrolysis. Sustain. Energy Technol. Assess. 2020, 42, 100870. [Google Scholar] [CrossRef]
- Plis, A.; Lasek, J.; Skawińska, A.; Zuwała, J. Thermochemical and Kinetic Analysis of the Pyrolysis Process in Cladophora Glomerata Algae. J. Anal. Appl. Pyrolysis 2015, 115, 166–174. [Google Scholar] [CrossRef]
- Li, G.; Ji, F.; Bai, X.; Zhou, Y.; Dong, R.; Huang, Z. Comparative Study on Thermal Cracking Characteristics and Bio-Oil Production from Different Microalgae Using Py-GC/MS. Int. J. Agric. Biol. Eng. 2019, 12, 208–213. [Google Scholar] [CrossRef]
- Grams, J. Chromatographic Analysis of Bio-Oil Formed in Fast Pyrolysis of Lignocellulosic Biomass. Rev. Anal. Chem. 2020, 39, 65–77. [Google Scholar] [CrossRef]
- Chen, D.; Wang, Y.; Liu, Y.; Cen, K.; Cao, X.; Ma, Z.; Li, Y. Comparative Study on the Pyrolysis Behaviors of Rice Straw under Different Washing Pretreatments of Water, Acid Solution, and Aqueous Phase Bio-Oil by Using TG-FTIR and Py-GC/MS. Fuel 2019, 252, 1–9. [Google Scholar] [CrossRef]
- Biswas, B.; Pandey, N.; Bisht, Y.; Singh, R.; Kumar, J.; Bhaskar, T. Pyrolysis of Agricultural Biomass Residues: Comparative Study of Corn Cob, Wheat Straw, Rice Straw and Rice Husk. Bioresour. Technol. 2017, 237, 57–63. [Google Scholar] [CrossRef]
- Muzyka, R.; Chrubasik, M.; Dudziak, M.; Ouadi, M.; Sajdak, M. Pyrolysis of Tobacco Waste: A Comparative Study between Py-GC/MS and Fixed-Bed Reactors. J. Anal. Appl. Pyrolysis 2022, 167, 105702. [Google Scholar] [CrossRef]
- Rahman, M.M.; Sarker, M.; Chai, M.; Li, C.; Liu, R.; Cai, J. Potentiality of Combined Catalyst for High Quality Bio-Oil Production from Catalytic Pyrolysis of Pinewood Using an Analytical Py-GC/MS and Fixed Bed Reactor. J. Energy Inst. 2020, 93, 1737–1746. [Google Scholar] [CrossRef]
- Edmunds, C.W.; Molina, E.A.R.; André, N.; Hamilton, C.; Park, S.; Fasina, O.; Adhikari, S.; Kelley, S.S.; Tumuluru, J.S.; Rials, T.G.; et al. Blended Feedstocks for Thermochemical Conversion: Biomass Characterization and Bio-Oil Production from Switchgrass-Pine Residues Blends. Front. Energy Res. 2018, 6, 79. [Google Scholar] [CrossRef]
- Mariyam, S.; Alherbawi, M.; Rashid, N.; Al-Ansari, T.; McKay, G. Bio-Oil Production from Multi-Waste Biomass Co-Pyrolysis Using Analytical Py–GC/MS. Energies 2022, 15, 7409. [Google Scholar] [CrossRef]
- Landrat, M.; Abawalo, M.T.; Pikoń, K.; Turczyn, R. Bio-Oil Derived from Teff Husk via Slow Pyrolysis Process in Fixed Bed Reactor and Its Characterization. Energies 2022, 15, 9605. [Google Scholar] [CrossRef]
- Sajdak, M. Characteristics of Chars from Biomass and Waste Co-Pyrolysis. Mendeley Data 2021, 2. [Google Scholar] [CrossRef]
- Sajdak, M. Impact of Plastic Blends on the Product Yield from Co-Pyrolysis of Lignin-Rich Materials. J. Anal. Appl. Pyrolysis 2017, 124, 415–425. [Google Scholar] [CrossRef]
- Sieradzka, M.; Rajca, P.; Zajemska, M.; Mlonka-Mędrala, A.; Magdziarz, A. Prediction of Gaseous Products from Refuse Derived Fuel Pyrolysis Using Chemical Modelling Software—Ansys Chemkin-Pro. J. Clean. Prod. 2020, 248, 119277. [Google Scholar] [CrossRef]
- Mlonka-Mędrala, A.; Evangelopoulos, P.; Sieradzka, M.; Zajemska, M.; Magdziarz, A. Pyrolysis of Agricultural Waste Biomass towards Production of Gas Fuel and High-Quality Char: Experimental and Numerical Investigations. Fuel 2021, 296, 120611. [Google Scholar] [CrossRef]
- Zajemska, M.; Magdziarz, A.; Iwaszko, J.; Skrzyniarz, M.; Poskart, A. Numerical and Experimental Analysis of Pyrolysis Process of RDF Containing a High Percentage of Plastic Waste. Fuel 2022, 320, 123981. [Google Scholar] [CrossRef]
- Ugolini, M.; Recchia, L.; Guandalini, G.; Manzolini, G. Novel Methodology to Assess Advanced Biofuel Production at Regional Level: Case Study for Cereal Straw Supply Chains. Energies 2022, 15, 7197. [Google Scholar] [CrossRef]
- Zulkafli, A.H.; Hassan, H.; Ahmad, M.A.; Mohd Din, A.T.; Wasli, S.M. Co-Pyrolysis of Biomass and Waste Plastics for Production of Chemicals and Liquid Fuel: A Review on the Role of Plastics and Catalyst Types. Arab. J. Chem. 2023, 16, 104389. [Google Scholar] [CrossRef]
- Foong, S.Y.; Liew, R.K.; Lee, C.L.; Tan, W.P.; Peng, W.; Sonne, C.; Tsang, Y.F.; Lam, S.S. Strategic Hazard Mitigation of Waste Furniture Boards via Pyrolysis: Pyrolysis Behavior, Mechanisms, and Value-Added Products. J. Hazard. Mater. 2022, 421, 126774. [Google Scholar] [CrossRef]
- Chen, H.; Lin, G.; Chen, Y.; Chen, W.; Yang, H. Biomass Pyrolytic Polygeneration of Tobacco Waste: Product Characteristics and Nitrogen Transformation. Energy Fuels 2016, 30, 1579–1588. [Google Scholar] [CrossRef]
- Guo, Z.; Zhang, K.; Zhang, Q.; Fu, L.; Liu, Z.; Kong, Z.; Wang, L.; Liu, C.; Hua, L.; Li, B. Tobacco Fractionation and Its Effects on Pyrolysis Chemistry. J. Anal. Appl. Pyrolysis 2022, 167, 105650. [Google Scholar] [CrossRef]
- Dimitriadis, A.; Bergvall, N.; Johansson, A.C.; Sandström, L.; Bezergianni, S.; Tourlakidis, N.; Meca, L.; Kukula, P.; Raymakers, L. Biomass Conversion via Ablative Fast Pyrolysis and Hydroprocessing towards Refinery Integration: Industrially Relevant Scale Validation. Fuel 2023, 332, 126153. [Google Scholar] [CrossRef]
- Yıldız, Z.; Ceylan, S. Pyrolysis of Tobacco Factory Waste Biomass: TG-FTIR Analysis, Kinetic Study and Bio-Oil Characterization. J. Therm. Anal. Calorim. 2019, 136, 783–794. [Google Scholar] [CrossRef]
- Dai, Y.; Xu, J.; Zhu, L.; Jiang, J.; Zhou, Y.; Zhou, G. Mechanism Study on the Effect of Glycerol Addition on Tobacco Pyrolysis. J. Anal. Appl. Pyrolysis 2021, 157, 105183. [Google Scholar] [CrossRef]
- Ikiz, E.; Maclaren, V.W.; Alfred, E.; Sivanesan, S. Impact of COVID-19 on Household Waste Flows, Diversion and Reuse: The Case of Multi-Residential Buildings in Toronto, Canada. Resour. Conserv. Recycl. 2021, 164, 105111. [Google Scholar] [CrossRef]
- Rodgers, K.M.; Bennett, D.; Moran, R.; Knox, K.; Stoiber, T.; Gill, R.; Young, T.M.; Blum, A.; Dodson, R.E. Do Flame Retardant Concentrations Change in Dust after Older Upholstered Furniture Is Replaced? Environ. Int. 2021, 153, 106513. [Google Scholar] [CrossRef]
- Sajdak, M.; Słowik, K. Use of Plastic Waste as a Fuel in the Co-Pyrolysis of Biomass: Part II. Variance Analysis of the Co-Pyrolysis Process. J. Anal. Appl. Pyrolysis 2014, 109, 152–158. [Google Scholar] [CrossRef]
- Sajdak, M.; Muzyka, R.; Hrabak, J.; Rózycki, G. Biomass, Biochar and Hard Coal: Data Mining Application to Elemental Composition and High Heating Values Prediction. J. Anal. Appl. Pyrolysis 2013, 104, 153–160. [Google Scholar] [CrossRef]
- Sajdak, M.; Muzyka, R. Use of Plastic Waste as a Fuel in the Co-Pyrolysis of Biomass. Part I: The Effect of the Addition of Plastic Waste on the Process and Products. J. Anal. Appl. Pyrolysis 2014, 107, 267–275. [Google Scholar] [CrossRef]
- Sajdak, M.; Muzyka, R.; Hrabak, J.; Słowik, K. Use of Plastic Waste as a Fuel in the Co-Pyrolysis of Biomass: Part III: Optimisation of the Co-Pyrolysis Process. J. Anal. Appl. Pyrolysis 2015, 112, 298–305. [Google Scholar] [CrossRef]
- Odeh, A.O. Oualitative and Quantitative ATR-FTIR Analysis and Its Application to Coal Char of Different Ranks. J. Fuel Chem. Technol. 2015, 43, 129–137. [Google Scholar] [CrossRef]
- Lin, X.; Sui, S.; Tan, S.; Pittman, C.U.; Sun, J.; Zhang, Z. Fast Pyrolysis of Four Lignins from Different Isolation Processes Using Py-GC/MS. Energies 2015, 8, 5107–5121. [Google Scholar] [CrossRef]
- Song, E.; Park, S.; Han, S.; Lee, E.; Kim, H. Characteristics of Hydrothermal Carbonization Hydrochar Derived from Cattle Manure. Energies 2022, 15, 9195. [Google Scholar] [CrossRef]
- Tsai, W.-T.; Sen, U.; Martins, M.; Santos, E.; Lemos, M.A.; Lemos, F.; Pereira, H. Slow Pyrolysis of Quercus Cerris Cork: Characterization of Biochars and Pyrolysis Volatiles. Environments 2023, 10, 4. [Google Scholar] [CrossRef]
- Ghosh, A.; Brown, R.C. Factors Influencing Cellulosic Sugar Production during Acid-Catalyzed Solvent Liquefaction in 1,4-Dioxane. ACS Sustain. Chem. Eng. 2019, 7, 18076–18084. [Google Scholar] [CrossRef]
- Kudo, S.; Huang, X.; Asano, S.; Hayashi, J.I. Catalytic Strategies for Levoglucosenone Production by Pyrolysis of Cellulose and Lignocellulosic Biomass. Energy Fuels 2021, 35, 9809–9824. [Google Scholar] [CrossRef]
- Xu, C.; Hu, J.; Chen, Y.; Yang, Q.; Zhang, Y.; Wang, C.; Chen, K. Rapid Synthesis of Strawberry Microcapsules via Pickering Emulsion Photopolymerization for Use in Multifunctional Fabric Coatings. Prog. Org. Coat. 2021, 152, 106110. [Google Scholar] [CrossRef]


Disclaimer/Publisher’s Note: The statements, opinions and data contained in all publications are solely those of the individual author(s) and contributor(s) and not of MDPI and/or the editor(s). MDPI and/or the editor(s) disclaim responsibility for any injury to people or property resulting from any ideas, methods, instructions or products referred to in the content. |
© 2023 by the authors. Licensee MDPI, Basel, Switzerland. This article is an open access article distributed under the terms and conditions of the Creative Commons Attribution (CC BY) license (https://creativecommons.org/licenses/by/4.0/).