1. Introduction
Currently, the electrification of vehicles is a trending topic due to the high demand of CO
2 emissions restrictions [
1]. In addition, the high cost of fuels makes vehicle efficiency an important aspect. Therefore, original equipment manufacturers (OEMs) tried different configurations to attract costumers [
2]. However, depending on the application and the recharging availability, the results change [
3]. Despite governmental focus on the legislation of tailpipe (tank-to-wheel, TTW) CO
2 emissions, the real environmental impact must be analyzed in a global view [
4]. The incorporation of tools, such as well-to-wheel (WTW) or life cycle analysis (LCA) [
5], can help to ensure a fair comparison between different powertrain solutions.
In terms of electrification levels, the powertrain can be classified as non-plug-in and plug-in if the battery cannot be or can be charged externally, respectively [
6]. Among the non-plug-in powertrains, there are conventional powertrains that does not have an electric motor for propulsion assistance, and mild hybrid (MHEV) and full hybrid (FHEV) that are powertrains with both an internal combustion engine (ICE) and electric motor (EM) for propulsion assistance, fed by a fuel tank and lithium-ion battery, respectively [
7]. The last two types of hybrids are differentiated depending on the size of the battery package and the electric motor level of assistance [
8]. The battery size, in general, is approximately 5 kWh in mild hybrid and 10–20 kWh for full hybrid trucks [
9]. As the battery cannot be charged externally, it must maintain its level of charge via the liquid fuel energy through the ICE/EM in generator mode. The EM assistance can vary between 5 and 20%. The ICE can be fueled with different type of energy sources, such as liquid or gas fuels [
10,
11]. On the other hand, plug-in powertrains can be hybrid (PHEV) or pure electric (BEV). The first case uses an ICE together with a generator EM for charging the battery when it is totally depleted. The pure electric powertrain only has a traction EM to propel the vehicle, and all the energy comes from the battery. The advantage of the PHEV is that it allows a higher driving range and lower battery size than the BEV. However, they are more complex due to the ICE and generator motor. The battery size for the PHEV is approximately 50–100 kWh, while for the BEV it is higher than 200 kWh in order to achieve acceptable travel distance in heavy-duty applications [
12]. The EM must be similar in size to the ICE in nonhybrid applications. It is important to note that the BEV solves the tailpipe emissions problems. However, the hybrid cases still have high emissions in the combustion process. In recent years, active emission control solutions have been given more attention.
Engines using low temperature combustion (LTC) emit fewer NOx and soot particles than those using conventional diesel combustion (CDC) [
13]. Several studies have shown that reactivity-controlled compression ignition (RCCI) [
14] is a more promising LTC technique than partially premixed combustion (PPC) [
15] and homogeneous charge compression ignition (HCCI) [
16]. To effectively adjust the incylinder equivalence ratio and reactivity stratification during RCCI operation, high EGR rates are used in conjunction with gasoline fraction and direct injection time modulation [
17]. This aids in fostering the conditions required to produce ultralow NOx and soot emissions, with comparable fuel consumption to CDC over a broad engine operating range [
18]. It is still challenging to use this combustion mode across the entire engine range due to excessively high maximum pressure rise rates and incylinder maximum pressure peaks, as well as an increase in the HC and CO emissions, despite the RCCI technology showing improvements in fuel consumption and NOx and soot emissions [
19]. Due to these two restrictions, the RCCI’s application is compromised, and its operating range is limited to modest loads [
20]. However, when electric motor assists are used, electrification opens new possibilities.
To summarize, with some minor infrastructural changes, PHEVs could be the technology that offers the best chance of helping the industry meet its CO
2 reduction goals, without vehicle range limitations [
21]. However, the actual reductions in CO
2 emissions are largely dependent on the energy source (fuel and electricity mix), user behavior, and vehicle design. Additional emissions, such as NOx and particulate matter, are not reduced by electrifying the powertrain. Due to the use of two fuels with different reactivity, in combination with high EGR rates, low temperature combustion modes such as reactivity-controlled compression ignition have demonstrated, in recent years, ultralow NO
x and soot emissions, simultaneously. The purpose of this work is to compare the operation and emissions of a series RCCI PHEV fueled with OEM diesel and gasoline, through numerical simulations fed with experimental data, against two baselines: nonhybrid and BEV commercial trucks. This type of comparison cannot be found in the literature. This manuscript also adds novel information regarding how to model different powertrain components available in electrified vehicles. Electric motor and lithium-ion models are presented, and the data can be used by companies and researchers. Lastly, the LCA, WTW, and TTW CO
2 emissions are evaluated and compared. This adds an interesting point of view regarding the correct selection of the powertrain for a heavy-duty application.
2. Materials and Methods
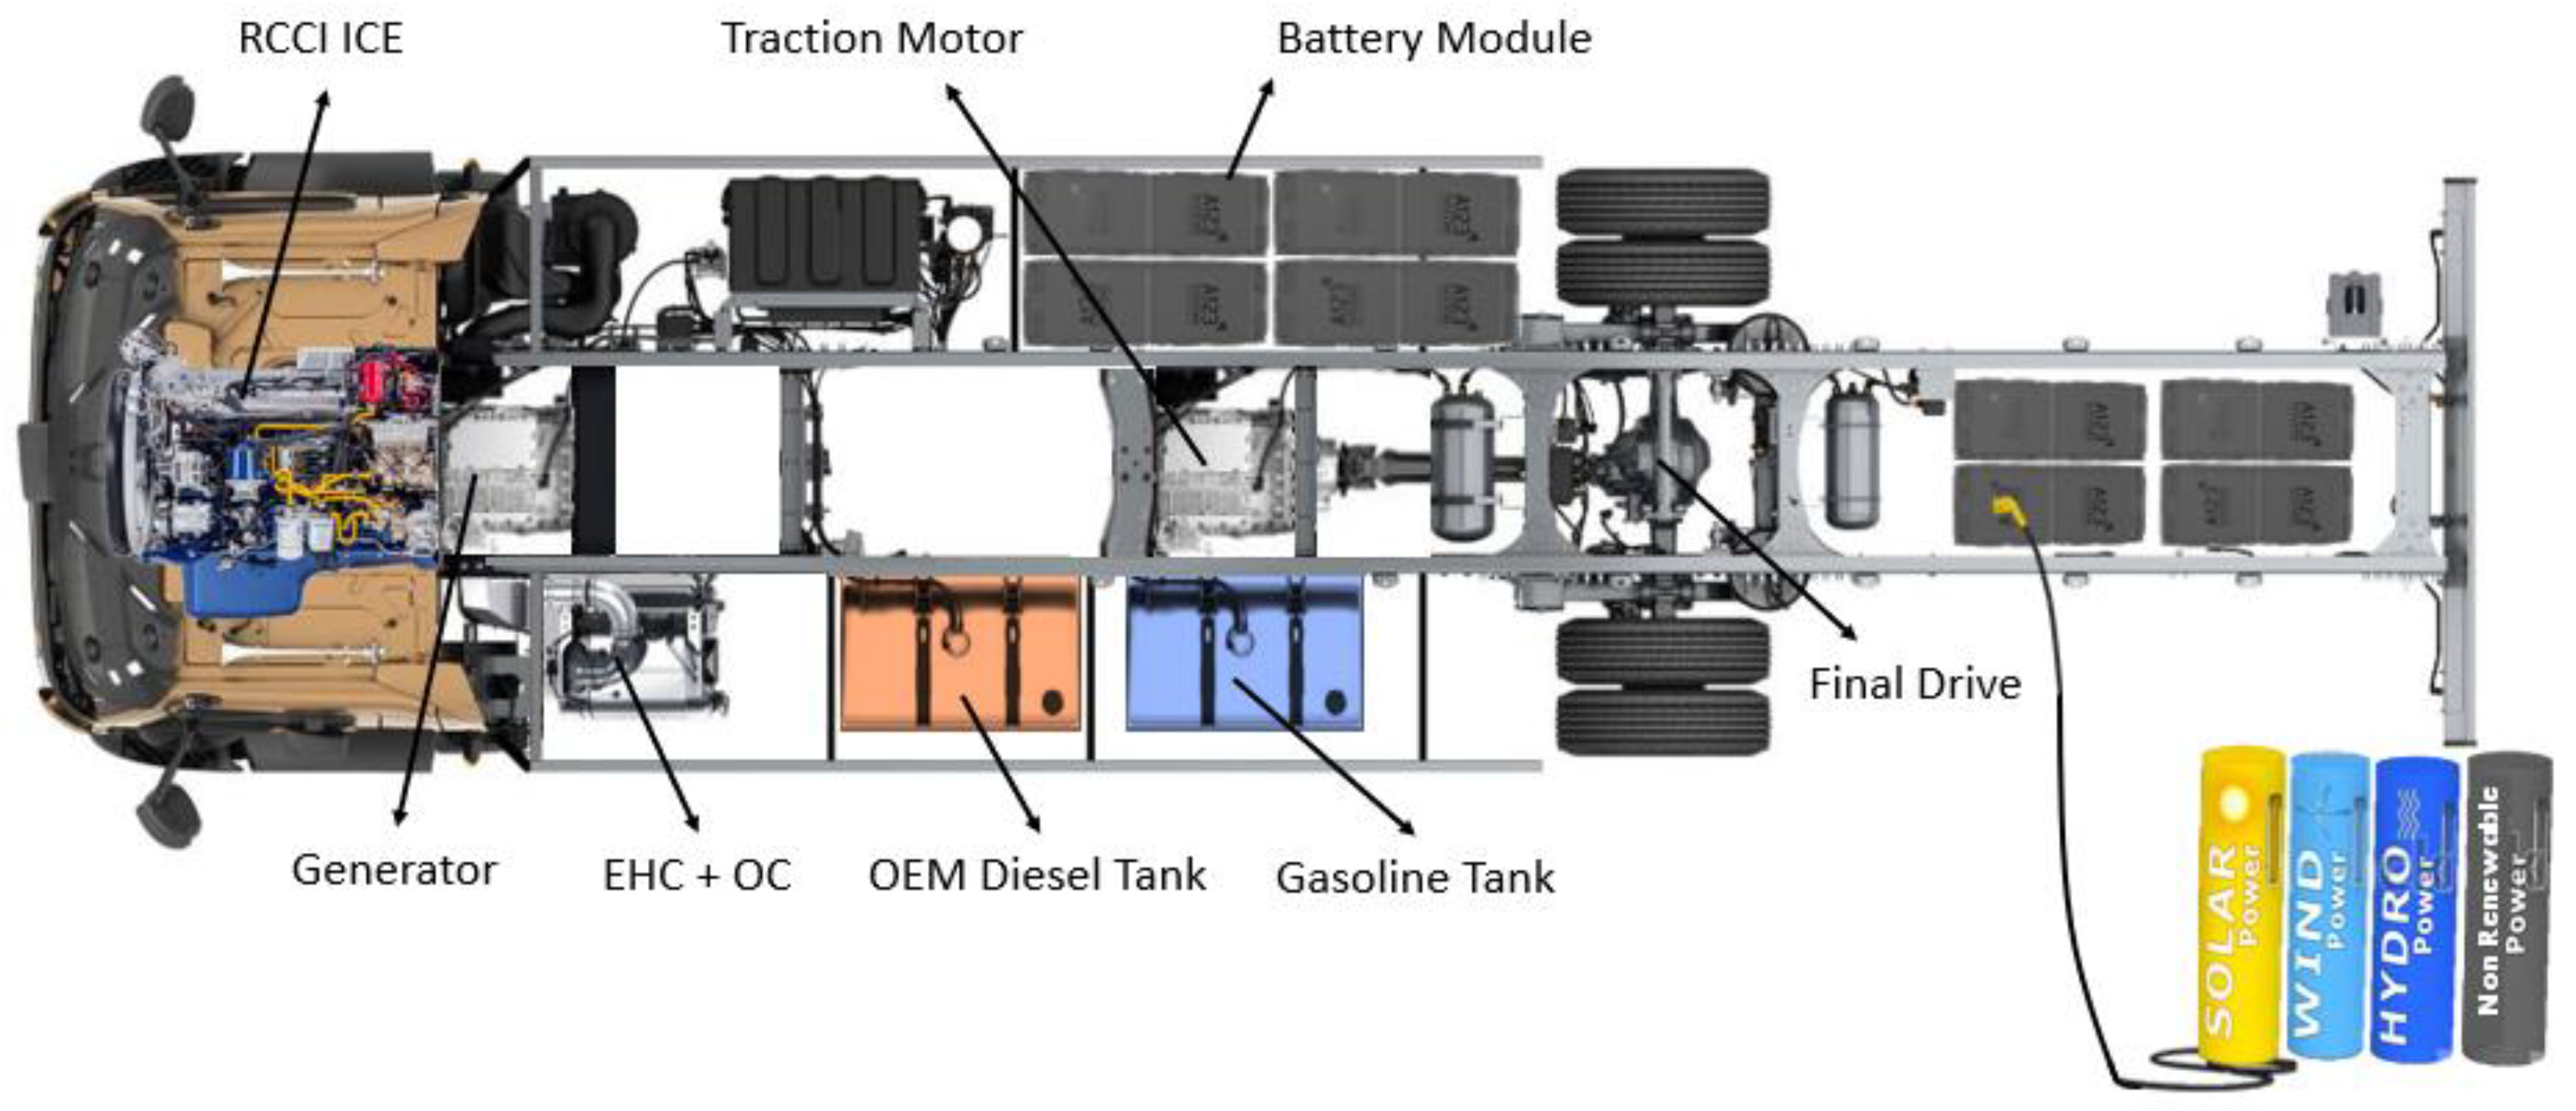
This section presents the vehicle numerical model, the evaluation approach, as well as details concerning the electric component’s numerical submodels. The newly developed model in this work is the plug-in hybrid RCCI truck. The nonhybrid and pure electric truck are modelled based on the commercially available truck. The plug-in hybrid incorporates the ICE, the EM, and a battery package. As explained in the introduction, the battery pack is larger (more energy storage though a greater number of individual lithium-ion cells) than in an MHEV and FHEV, and can be charged externally. The ICE/EM combination can be performed in parallel (P2), series, or power-split architecture. In this case, the series was selected due to the advantage of using three ICE operative conditions instead of the all-engine map, which the authors chose as the best points of the RCCI combustion mode. More details regarding the different powertrain architectures can be found in [
22]. A graphic of the proposed idea can be seen in
Figure 1.
Technological readiness level (TRL) 9 is needed for the integration of new technologies into a practical platform. TRL is used to assess a system’s technological component maturity. TRL 9 denotes the completion of the subsystems, controls, sensors, and testing. Unfortunately, achieving this level of preparedness takes time and money. Yet, simulation of the technology on a virtual platform can demonstrate the concept’s potential, to some level. Modelling complicated systems may be performed more quickly thanks to the abundance of tools and templates available in GT-Suite 2023 (Gamma Technologies®, Westmont, IL, USA) and its user-friendly interface. To analyze the developed concept and weigh its benefits and drawbacks, this program was used.
The chosen vehicle is a Volvo FL with an 18-ton maximum capacity, and is representative of medium-duty applications in Europe for urban and urban–rural trajectories.
Table 1 summarizes the characteristics of the truck. This commercial nonhybrid OEM vehicle is equipped with a 280 hp diesel internal combustion engine (6 cylinders, 8 L, turbocharged engine with a high pressure EGR line) with an aftertreatment system able to achieve EU VI limits. The engine has the latest technology available in the market, and is representative of medium-duty trucks. In addition, the nonhybrid powertrain has a manual gearbox of six gears (gear ratios of: 3.36/1.91/1.42/1.00/0.72/0.62). The pure BEV Volvo FL is modelled to have another reference, in addition to the CDC nonhybrid. The BEV truck is equipped with a central electric motor connected to a two-gear transmission and differential. The EM is liquid cooled, with a maximum power of 268 kW. The battery size ranges from 200 to 400 kWhThe cells are cylindrical cells with a nickel manganese cobalt (NMC) cathode. The maximum cargo mass that the truck can carry depends on the size of the battery.
It is important to comment that the BEV has reduced transmission complexity due to the higher operative range of the EM versus the ICE. In addition, the battery size range can be doubled if the consumer desires, depending on vehicle use. For urban trajectories, small batteries are preferred due to the low energy consumption and regenerative braking.
The series PHEV has two electric motors: the traction motor (TM) coupled to the wheels, and the generator (GEN), which is coupled to the ICE. These three components have a maximum power of 210 hp. The OEM ICE is modified to be able to operate with diesel and gasoline under the RCCI combustion mode. It is important to note that due to electrical losses in the charge station, cables, and battery, an efficiency of 5% is considered for external charging. In this work, a full charge is defined as SOC = 1.0, and a fully discharged battery as SOC = 0.1. The vehicle numerical models with the most important components for the three powertrains studied in this work are shown in
Figure 2.
The vehicle forces are calculated following the energy balance equation presented in Equations (1) and (2) with forces represented in
Figure 3.
where,
considering vehicle total mass and rotating inertias. The vehicle acceleration is
the vehicle speed is
,
is the traction torque,
is the wheel radius,
is the aerodynamic drag coefficient,
is the air density, and
is the frontal vehicle surface. The battery pack weight, as well as the TM and GEN weight, are considered in the simulation.
The engine is modelled using a map-based methodology. This entails inserting the engine speed (x-axis), torque (y-axis), and fuel consumption and emissions matrices (z-axis) as dependence parameters. The engine’s submodel will provide the values of fuel mass consumption and emissions (NOx, soot, CO, HC, and TTW CO2). In addition, the ECU submodel is responsible for managing the engine’s request for torque, based on the driver’s location on the accelerator.
To make sure the model accurately represents the behavior of the real vehicle, on-route measurements were compared to the 0D-vehicle model in the nonhybrid powertrain. Using torque measurements in the ICE, output of the gearbox, gear position, fuel consumption, and GPS data, it is possible to check the accuracy of the numerical model. The validation can be seen in [
23]. With a variance of under 2%, the model allows for a good level of agreement regarding overall fuel usage.
It is important to note that all of the models have a control system that was developed inhouse. In particular, the PHEV was programmed to have three ICE/GEN power levels at 0.25, 0.20, and 0.15 battery SOC value, and the initiation of charging fixed at 0.3. These parameters are adjusted to allow full battery utilization (SOC 1.0 to SOC 0.3 in pure electric) while staying above the minimum recommended level of 0.1, to prevent cell damage.
In terms of the electric motor selection, a permanent magnet synchronous motor (PMSM) is the best option for an electric motor when the operating torque–speed points are primarily spread in the low–medium speed range, as in the case of urban and urban–rural trajectories. The additional components in the HEV may make packaging a problem (ICE, transmission). The PMSM’s higher power density is unquestionably advantageous. As a result, this kind of motor is selected for the analysis. Details regarding the electric motor characteristics can be seen in
Table 2. The electric motor is recommended for heavy-duty application due to the high torque at low speeds.
Figure 4 shows the efficiency map delivered by the EM manufacturer. The adaptation to this study is performed by map scaling. Both the traction motor size and the two-gear transmission (with ratios of G1 = 3.5:1, G2 = 0.90:1, and final drive of 5.29:1) are kept as part of the series hybrid (210 hp continuous power).
For the lithium-ion battery, two different cell models were used. Both are cylindrical cells, but they have different cathode material, namely, lithium iron phosphate (LFP) and nickel manganese cobalt (NMC), and the size is also different between the NMC 26650 and LFP 18650. In particular, the NMC is an HG2 18650 variant, ideal for large battery packs, whereas the LFP is an ANR 26650, better for applications involving tiny battery packs, such as MHEVs, FHEVs, or PHEVs. The different application type is due to high energy capacities present in the NMC, while the LFP allows high-power charge/discharge. Due to the huge battery capacity in vehicles such as BEVs, energy density is crucial. The opposite is true for MHEVs, FHEVs, and PHEVs. The key traits are displayed in
Table 3.
To display the outcomes, 3D maps of the open circuit voltage (OCV), resistance out of the RC branch (R
0), resistance inside the RC branch (R
1), and capacitance inside the RC branch (C
1) are plotted against the battery’s state of charge (SOC) and surface temperature (see
Figure 5). As can be seen, the R
0 is mostly dependent on cell temperature, whereas the OCV is based on the battery’s SOC. Additionally, at a high SOC, the NMC’s internal resistance is greater than the OCV’s. To reach the appropriate battery package voltage and total energy, these maps are added to the equivalent circuit model, and the number of cells in series and parallel is increased. These maps were created by experimentally testing the cells in different temperature conditions. The test cell is an LBT 10 V 100 A, built by Arbin Instruments, with a bidirectional current source with a control precision of 0.02%, a step current input time of 5 ms, and a data logging rate of 2000 points per second. While measuring the cell voltage and surface temperature, this apparatus tries to send current to charge the batteries. A Thermal Hazards Technologies accelerating rate calorimeter, model ARC THT EV+, was utilized to measure the controlled ambient temperature. The ambient temperature can be regulated with an inaccuracy of ± 0.2%. Both types of equipment are part of the CMT laboratory battery test.
The calibration was performed by requesting constant current and transient current profiles. More details regarding the experimental campaign can be found in [
25].
Preliminary to understanding the battery type effect, a design of experiment (DoE) of various battery sizes is carried out for both cells, ranging from 40 to 700 kWh in the BEV under the homologation world harmonized vehicle cycle (WHVC) for heavy-duty applications. The cylindrical cells are connected in series to achieve 600 V. Therefore, the NMC pack has 167 series cells, while the LFP increases up to 182 series cells. The parallel number of cells depends on the total capacity of the battery.
The NMC LG 18650 has a 150 Wh/kg energy density, compared to the ANR 26650’s 75 Wh/kg. The battery package weight it considered in the vehicle model. Therefore, the energy consumption will increase due to the higher weight for large battery packs.
Figure 6 displays the outcomes of the BEV vehicle in the WHVC with a 50% payload. Due to its lighter overall weight, the NMC with a high energy density uses less energy. The results are more pronounced after 200 kWh, when the battery mass for the LFP and NMC is 2.5 tons and 1.3 tons, respectively. Furthermore, the LFP’s high power capacity enables more recovered energy with a compact battery pack size. The restriction for the NMC is removed by the larger battery packs, but the weight of the vehicle is still the most crucial element. It is important to note that the results match with the OEM declared values of 395 kWh and range of 300 km [
26]. Summarizing this graph, the cathode chemistry does not have a significant impact on PHEVs, which typically have batteries with capacities under 200 kWh; however, NMC is required for BEVs because of its high energy density.
As in the previous BEV analysis, the comparison between the PHEV and the two baselines will be performed using the world harmonized vehicle cycle. As opposed to light-duty cars, heavy-duty vehicles do not have a particular annex for the testing of plug-in hybrid systems. PHEVs are cars that can run on both grid energy and regular liquid fuels. As a result, modifications to the initial standard must be made in the upcoming years. For this project, the European light-duty WLTP standard for passenger cars was modified.
There are two established operating modes for PHEVs: charge depleting (CD) and charge sustaining (CS). When the battery is still charged (above SOC = 0.3), the TM takes over most of the vehicle’s propulsion duties while the ICE is turned off. The TM is fed from the chemical energy of the battery package. In the charge sustaining mode (SOC < 0.3), the combustion engine is turned on and is used to charge the batteries through the GEN, while the TM drives the vehicle. The standard establishes that the battery SOC must be in a specific range near the minimum throughout this phase. Then, the car is halted and the grid is used to fully charge the battery. Equation (3) is the rule that specifies the beginning of the charge depleting mode.
where,
is the relative electric energy change in cycle
i [%],
is the change of battery energy content I [Wh], and
is the energy required to complete one WHVC [Wh]. According to the WLTP standard, the test cannot be considered complete until one CS phase has been completed after the CD mode has ended. A typical WHVC for PHEVs is shown in
Figure 7, where the battery’s initial state of charge is set to its maximum (SOC = 1.0), followed by a series of WLTP cycles that are repeated until the battery hits its minimum permitted CD mode charge state (SOC = 0.30). A full WHVC is then carried out, and is in charge of maintaining operation after that (the vehicle is propelled by the ICE, and the SOC is maintained near the minimum).
In this study, the CD mode and CS mode energy consumption (fuel and electricity), and CO2 and other pollutant emissions will be determined by GT-Suite PHEV modelling. Nonetheless, the truck can complete all WHVCs (20 km) in the pure electric mode, depending on the battery size and starting energy. Or, in the worst-case situation, because it was not charged, everything would cycle in the CS mode. So, to calculate global energy consumption and emissions, both scenarios must be integrated. The charge depleting and charge sustaining fuel consumptions are applied to determine the vehicle’s equivalent fuel consumption in a single WHVC. While the total electric range expands with battery size, the WLTP for light-duty requirements creates a utility factor (UF) that takes into consideration the range of an electric vehicle.
Some authors define the UF as the ratio between the total distance travelled between two external battery charges divided by the distance travelled when the charge is decreasing. The Society of Automotive Engineers (SAE) has proposed a standard procedure (SAE J2841) [
27] that defines this weighting between charge depleting and charge sustaining driving as a utility factor, with the goal of representing the actual driving behaviors of a fleet of vehicles used for light-duty operation. The SAE J2841 approach assumes that the vehicle is fully charged when the test begins, and is only charged once daily. Equation (4) is utilized to obtain the final weighted result.
where,
is the weighted mass emission of the compound [g/km],
is the mass emission of the CD mode, in g/km, and
is the mass emission of the compound in CS mode. Because there is not a heavy-duty standard for PHEV applications, the formula is modified to Equation (5).
The UF, on the other hand, was developed for light-duty vehicles because they have shorter travel distances than heavy-duty trucks. As a result, additional adaption was developed by doubling and tripling the UF compensation.
Figure 8 displays the proposed new compensations (UF* and UF**), as well as the original compensation (UF).
Due to the high-power output of the electric motor in the PHEV, and the range extender series layout of the powertrain, the control strategy was designed to operate in the pure electric mode up to the depletion of the battery (SOC = 0.3). From this point, the CS mode will engage, and the ICE is turned on to maintain the SOC of the battery. The FHEV and BEV regenerative braking is considered, with a minimum speed of 5 km/h. For safety reasons, below this vehicle speed, the friction brakes stop the truck. Lastly, it is important to mention that the regenerative braking control system also considers the repartition between the front and rear wheels to have a balanced vehicle operation. More details can be found in [
28].
Figure 9 show a scheme of the methodology applied throughout this manuscript, as well as the series PHEV operation.
For further calculation of CO
2 impact, the WTW and LCA tools are used. Typically, the average electricity mix is used to determine the WTW CO
2 related to PHEV and BEV energy recharging. While being extensively used, there is a mistaken association that the charging vehicles have an effect on grid demand. As a result, the mix of electricity is related to CO
2 emissions. For this problem, marginal emissions can provide a more precise value. The marginal price that businesses charge their customers is where this idea originated. Every user is required to pay the price per kWh of electricity, as determined by the cost of the energy provided by the last power plant to meet the immediate demand, according to the norms of a marginalist pricing system. Based on the work of Garcia et al. [
29], where the Spanish grid was analyzed, the marginal and average CO
2 emissions were obtained. The need for meeting the energy demand is met by renewable sources. When demand exceeds their maximum generation capacity, nonrenewable sources are used in the following order to supply the needed additional power: waste-to-energy, coal, combined-cycle, and fuel gas; these are the four most carbon-intensive sources of energy. The marginal emission is 382 g/kWh on average. Without considering the marginal approach of 165 g/kWh, the chosen value is almost twice as high as the average emission. The new hybrid and electric vehicle (EV) technologies need to be considered as additional sources of power demands, on top of the existing demands; hence, focusing on average emissions is incorrect.
The production of batteries is essential to this study’s ability to fairly compare nonhybrid, PHEV, and BEV vehicles. Due to the thorough investigation of many scenarios, the research bibliography of [
30] is used as a reference. It is important to highlight that the batteries are anticipated to be manufactured in Europe. According to the 2019 updated study from IVL Sweden [
31], the carbon effect of the manufacture of batteries ranges from 61 to 106 kg CO
2/kWh. Their previous estimate, which was made in 2017, was between 150 and 200 kg CO
2/kWh, and was based on scant information from small-scale output, some of which dated back to 2010. Other components associated with CO
2 emissions can be found in [
23]. The expected lifespan of the vehicle was 16 years, or 800,000 km. Tire replacement and vehicle maintenance are two different categories of vehicle maintenance. The production and disposal of trucks are taken from [
32] because it analyses the CO
2 impact of vehicles under conditions such as those examined in the current work.
3. Results and Discussion
Two situations were used to evaluate the PHEV series truck. The charge depleting (CD) mode, in which the truck begins with 100% battery power (SOC = 1) and operates under a WHVC with 50% payload until the minimal SOC is attained. If that occurs in the middle of a WHVC, the truck completes the cycle in sustaining mode (the ICE/generator is turned on to maintain the battery state of charge), and at the end of the cycle the test is stopped. The other situation is charging sustaining mode (CS). In this case, the truck begins this test with a battery SOC of 0.3 and only performs one WHVC (20.1 km). The LFP 26650 cell is used for the PHEV at a variety of battery package sizes (20 to 200 kWh).
Figure 10a shows the distance travelled, as determined by simulations. The CD mode permits a range of 140 km when the battery is above 180 kWh, and is almost entirely electric.
Figure 10b depicts the cycle’s energy consumption (liquid fuel energy in the tank plus electric energy in the battery). In the case of the CS mode, the larger battery increases energy consumption, since it adds weight to the vehicle that is not used for propulsion. The average consumption under the CS mode is 126 kWh/100 km, compared to 235 kWh/100 km under the CD mode. It is important to notice that the CD energy is split between fuels to terminate the final WHVC and electricity used for practically all of the voyages. Depending on the battery range and cycle phase, 73% to 94% of cycles for various battery sizes are conducted exclusively in electric mode. The CS mode performs best near the battery capacity of 41 kWh; this is due to the trade-off between battery weight and battery efficiency. In small batteries, the losses due to the high current rates make the system more inefficient.
Figure 11 displays the energy divided by electricity to recharge the battery and fuel (diesel and gasoline) in the PHEV, to better understand the energy usage in the vehicle. As further referenced, the CDC nonhybrid and EV truck are included. It is important to note that, to give a full understanding of the difference between low and high electrification, the results of previous work of this research group is added [
23]. In particular, the series FHEV is used, which has a battery size of 22 kWh, along with the same ICE with RCCI mode, and the lithium-ion cell of the PHEV (LFP). Therefore, the difference between the FHEV and PHEV is the battery size and the energy management strategy (FHEV must maintain the SOC around 0.6, while PHEV varies between 1.0 and 0.1 depending on the operation mode).
Figure 11 shows that when the size of the load battery is increased, the PHEV under the CS mode achieves efficiency levels comparable to those of the FHEV and the nonhybrid diesel variant. This can be explained by the additional battery weight that is not used during a single WHVC, because the energy variance must be under 4%. The CD mode, however, exhibits significant energy advantages over the CS mode. At the same battery size, the overall energy consumption is comparable to an EV truck. In addition, from
Figure 11 it can be seen that the electrical energy has the opposite tendency from fuel energy, which declines as battery size increases. This graph demonstrates that a fully charged PHEV can operate as efficiently as an electric truck.
When comparing different technologies, the WTW analysis of the CO2 can provide useful data, including statistics on tailpipe emissions and fuel output. In this research, the electricity’s marginal emission (382 gCO2/kWhelectricity) is considered since it accurately captures the effects of adding PHEV and EV to the net. More information regarding this point was explained in the methodology section.
The outcomes of the WTW analysis are shown in
Figure 12. The first thing to bear in mind is that gasoline-powered models (FHEV and PHEV), which have a wider gap compared to CDC nonhybrid vehicles, do so because gasoline has a lower WTT CO
2 than diesel. Additionally, because diesel and gasoline emissions are lower in WTT than they are in Spain’s power mix, which accounts for the marginal value, the difference in energy consumption between PHEV CD and EV trucks is also minimized in WTW CO
2. Average CO
2 emissions for the PHEV in the CS mode are 735 g/km, whereas they are 541 g/km for the PHEV in the CD mode. The references take into account CDC nonhybrid 835 gCO
2/km, FHEV Series D-G 696 gCO
2/km, and EV truck 468 gCO
2/km.
Up to now, all of the analyses were performed without any compensation due to the electric range for the PHEV. As explained in the methodology, a benefit can be given to a plug-in powertrain when the electric range increases. Therefore, a combined CO
2 emission between the CD and CS modes can be obtained using the utility factor technique described in the methodology section. In this work, three UFs were obtained. One such UF for light-duty, and two UFs by doubling and tripling the daily travel distance benefit.
Figure 13 displays the outcomes of applying the UF to the TTW CO
2 emissions in terms of absolute value, and compared with the nonhybrid commercial truck baseline. The FHEV is added as a reference, and as the EV has zero tailpipe emissions, it is not added. Depending on the size of the battery, anywhere between 30% and 90% TTW CO
2 can be saved. The differences in the UF approach can cause the TTW to vary by 40% at the double distance, and 70% at the triple distance. These findings emphasize how crucial it will be in the next years to determine a fair remuneration for CD and CS modes in heavy-duty transportation.
The same calculation is performed for WTW CO
2 emissions, and is shown in
Figure 14. The most important result is that any PHEV evaluations with batteries larger than 50 kWh can meet the 2030 CO
2 standards. This means a WTW CO
2 emissions reduction of 30%. In addition, the PHEV series truck reduces emissions on average by 39% for a UF of light-duty, 34% for UF*, and 31% for UF**. To add this idea to other powertrain solutions, the FHEV can save 15% of WTW CO
2 with a battery size of 22 kWh, while the EV achieves WTW CO
2 savings of approximately 48% with a battery size between 50 and 200 kWh.
An approach to quantify the impact of the entire chain on CO
2 equivalent emissions is performed. The LCA hypothesis and values were explained in the methodology. The outcomes are shown in
Figure 15. Because the vehicle range (defined as the distance travelled with a full battery charge) is too low for batteries up to 200 kWh (approximately 180 km, see
Figure 6), the entire range of the EV is displayed. The commercial EV model uses approximately 400 kWh, which is somewhat more than the 2030 CO
2 goal (30% reduction with respect to 2020). Due to its reasonable range and 30% CO
2 reduction, 320 kWh is the best choice for the EV in terms of CO
2 output. On the other hand, after 100 kWh, when the minimum is reached, the PHEV does not demonstrate improvements. After this battery size, the LCA savings values fluctuate because of the repeated WHVCs and the distribution of the consumed fuel and electric energy. As a result, 100 kWh is chosen as the ideal for the PHEV using conventional fuels.
Reducing pollutant emission is the main purpose of using a low temperature combustion mode such as RCCI; the NOx and soot tailpipe emissions are presented.
Figure 16 shows that both pollutants are under the EUVI limit, without any aftertreatment system. This is because the powertrain electric assistance allows the engine to operate purely in the RCCI zone, which results in ultralow NOx and particulate matter emissions. As a result, without urea selective catalytic reduction (SCR-Urea) and diesel particle filtering (DPF), the PHEV can meet the 2030 CO
2 requirements, as well as EUVI NO
x and soot emissions. To meet CO and HC goals, the diesel oxidation catalyst (DOC) must be kept active with an electric heater in the catalyst (EHC).
The obtained optimum battery size values allow the comparison of the vehicle range between the different types of powertrains. To improve understanding, the fuel tank for the nonhybrid, FHEV, and PHEV is taken as the 210 lt version (OEM offers between 80–300 lt tanks). The nonhybrid allows a driving range of 817 km, while the FHEV is increased to 940 km due to higher vehicle efficiency. Using the 100 kWh battery size for the PHEV, the vehicle achieves 105 km in the pure electric mode, plus 895 km in the CS mode. This means a 1000 km driving range when the trip is started with a fully charged battery. Lastly, for the optimum CO2 case (320 kWh battery size), the EV has a driving range of 240 km. Therefore, the PHEV increases the driving range 18% vs. the nonhybrid, 6% vs. the FHEV, and 76% vs. the EV with a fully charge battery. If only the CS mode is used (starting with a depleted battery), the energy consumption increases and the pure electric mode is almost negligible, though the driving range is still high, being 9% higher than the nonhybrid and 73% higher than the EV. With respect to the FHEV, the driving range decreases by 5%.


 ,
, 


