Article

Phase Field Study of Cr-Oxide Growth Kinetics in the Crofer 22 APU Alloy Supported by Wagner’s Theory

1
Institute for Energy and Climate Research, IEK-2, Forschungszentrum Jülich, 52425 Jülich, Germany
2
JARA-ENERGY, Forschungszentrum Jülich, 52425 Jülich, Germany
*
Author to whom correspondence should be addressed.
Energies 2023, 16(8), 3574; https://doi.org/10.3390/en16083574
Submission received: 3 April 2023 / Revised: 14 April 2023 / Accepted: 18 April 2023 / Published: 20 April 2023
(This article belongs to the Special Issue Design, Modeling, and Optimization of Novel Fuel Cell Systems)

Abstract

:
The Crofer 22 APU alloy is a frequently used metallic material to manufacture interconnects in solid oxide fuel cells. However, the formation and evaporation of Cr 2 O 3 not only increases the electrical resistance but also leads to the Cr-related degradation over the service time. In order to investigate the growth kinetics of Cr-oxide, i.e., Cr 2 O 3 , the multi-phase field model coupled with reliable CALPHAD databases is employed. The phase field simulation results are benchmarked with the predictions of Wagner’s theory. Moreover, we evidence the influence of the temperature and Cr concentration on the ferritic matrix phase and the oxygen concentration at the Cr 2 O 3 /gas interface on the growth kinetics of Cr-oxide, paving the way for further investigations of Cr-related solid oxide fuel cell degradation processes.

1. Introduction

Solid oxide fuel cells (SOFCs) are an important green hydrogen technology for efficiently producing electricity in an environmentally friendly manner [1,2,3,4]. Due to the low emissions, flexible fuel and high efficiency at high operation temperatures, the main applications of SOFCs include stationary power production, auxiliary power units and other facilities. The operation mechanism of SOFCs is that the hydrogen and other fuels are oxidized at the anode side. Meanwhile, the oxygen is reduced at the cathode, which generates a potential difference between the two electrodes. In order to generate a reasonable voltage and higher powers, SOFCs are typically operated as a “stack” with interconnects linking the anodes and cathodes of adjacent units. The interconnects not only establish the electrical connection between the anode of one cell to the cathode of the neighboring cell but also block the contact of the oxidizing and reducing atmospheres. Therefore, the properties of interconnects significantly influence the overall performance of SOFCs [5].
In view of the high mechanical strength, adequate thermal conductivity, excellent electronic conductivity and low cost, metallic alloys are widely used as interconnects, such as Fe-Cr based alloys, operating at the working temperature of SOFCs [6]. Several ferritic stainless steels with the formation of protective Cr scales are promising candidates, such as AISI430 [7,8], ZMG232 [9] and Crofer 22 APU [10,11], due to the low mismatch between the thermal expansion coefficient of ferritic steels and other SOFC components [12]. The formation of a continuous Cr 2 O 3 protective layer with 20–25% Cr content increases the oxidation resistance of interconnects. However, two major challenges were raised with the aforementioned ferritic stainless steel. First, the enlargement of the electrical resistance over the service time is undesired owing to continuous oxidation. Second, the Cr 2 O 3 layer can react with dry and wet oxygen, which leads to the evaporation of gaseous hexavalent Cr species, such as CrO 3 and CrO 2 (OH) 2 . Subsequently, the gaseous Cr species can react with the LSCF cathode material and form a Sr- and Cr-containing oxide scale, which results in Cr-related SOFC degradation [13,14]. Although the formation of the spinel (Mn, Cr) 3 O 4 layer on the top of the Cr 2 O 3 layer can block the contact with the atmosphere, the Cr-evaporation is still not negligible without a dense coating. Therefore, the investigation of the Cr 2 O 3 oxidation layer evolution is essential for decreasing the Cr-related degradation effect and enhancing the service life of SOFCs.
As Cr oxidation and evaporation are occurring simultaneously, e.g., gravimetric measurements of the Cr oxidation kinetics in Crofer 22 APU alloy may be not accurate. In order to precisely evaluate the Cr oxidation kinetics, Sanchitanand et al. [15] comprehensively evaluated the Cr oxidation properties with or without the Cr evaporation corrections. After considering the loss of Cr due to evaporation, the measured mass gains of uncoated Crofer 22 APU alloy is about 1.8 mg / cm 2 at 1123 K when exposed to the air + 3%H 2 O atmosphere for 1000 h. Magdefrau et al. [16] investigated the exposure of uncoated Crofer 22 APU to air at 1073 K without considering the loss by Cr evaporation. The measured mass gain for 800 h is about 0.4 mg / cm 2 . Windisch et al. [17] also take into account the loss of Cr by evaporation. The measured net mass gain of Crofer 22 APU are 0.8, 0.1 and 0.02 mg / cm 2 at 1123 K, 1023 K and 923 K, respectively, when the exposure time is 500 h.
Aiming to explain the oxidation processes, a parabolic relation between the thickness of the oxide layer and oxidation time has been developed, known as Wagner’s theory [18,19]. Wagner’s theory originates from Fick’s laws, and is capable of depicting the oxidation kinetics and concentration profiles of different elements. Additionally, Wagner’s theory also provides criteria of the transition from external oxidation to internal oxidation. Wagner’s theory has been confirmed experimentally by Rapp et al. by using the Ag-In system [20]. However, the theory is considered with the assumption that the diffusivity of the solute is much smaller than the oxygen diffusivity, and the solubility of oxygen in the matrix phase is also very small. According to Wagner’s theory, Zhao et al. [21] developed a theoretical approach to calculate criteria for the transition from internal to external oxidation through employing an effective diffusion coefficient of oxygen in the alloy and taking into account the evolving blocking effect by forming internal oxide precipitates. Although these sharp interface methods can quantitatively give an understanding of the oxidation processes, the implementation of these methods can become complex. In addition, the morphology evolution of the oxide is not contained in the description beyond the motion of planar fronts between the phases, as this renders the description one-dimensional. This implies that questions concerning the front stability, which may lead to more complex growth morphologies, cannot be addressed in such an approach.
In the last decades, the phase field (PF) method coupled with reliable CALPHAD databases has become a powerful tool for investigating complex diffusion behaviors and microstructure evolutions during various material preparation/service processes [22,23]. The history of the phase field can be traced to the model of van de Waals for a liquid-gas system linked with a continuous density function more than a century ago [24]. Ginzburg and Landau proposed an order parameter to model the superconductivity [25]. Cahn and Hillert developed the coupled diffuse interface model for two coexisting phases whose interfacial energy is consistent with experimental data [26]. In the review of Hohenberg and Halperin, “Model C” is very similar to the current phase field model [27]. Two types of PF model are classified. The phase field variables in the first type of model present the local composition or long-range atomic order parameters, symmetry and orientation relations between coexisting phases. The second type of phase field model is well applied for reproducing the microstructure evolution during alloy solidification. Over the past years, the phase field approach has become an important technique for solving various problems in materials science and beyond. Historically, it has attracted its first major attention with the modeling of solidification and the formation of dendrites [28], as well as the formation of complex patterns in eutectic and peritectic alloys [29,30]. The phase field methods also play a major role in the modeling of the phase transformation kinetics in solid state transformations [31], where in particular elastic effects can play an important role and affect both the equilibrium thermodynamics as well as the dynamics of the transformations. More recently, quantum annealing techniques have been developed, which may help to lead to even more efficient descriptions of the solid state transformation equilibration with long range elastic coherency stresses [32]. Other applications for phase field models are related to fracture in brittle and ductile materials [33], grain boundary premelting [34], battery modeling [35] and phase change memory material simulations [36]. Compared to the sharp interface method (which tracks the sharp locations of the moving interfaces in a microstructure), the diffuse interface in the PF method provides the capability to quantitatively reproduce the evolution of the morphologies without tracking the interface positions [37,38]. Moreover, the PF model solves the interface propagation and transport processes in a self-consistent way, and therefore simplifying assumptions are not required. Additionally, reliable CALPHAD databases provide accurate chemical driving forces and diffusivities for oxidation processes [39]. In recent phase field modeling works on oxidation problems, Zaeem and Kadiri developed a multi-phase field model with simple quadratic free energy densities for non-selective oxidation to investigate oxidation kinetics and stress generation in the Zr-ZrO 2 system [40]. Sherman et al. formulated a phase field model to study the equilibrium state of an oxide where the film thickness is below the Debye length [41]. Kim et al. examined the kinetics of diffusion-controlled oxide growth by using Sherman’s model [42]. Wang et al. investigated the internal to external oxidation transition processes under different compositions and nucleation scenarios [43]. However, up to now, phase field investigations of the growth kinetics of the oxidation processes coupled with CALPHAD databases are still missing.
Consequently, the major goal of this work is to realize the quantitative phase-field simulation of the oxidation kinetics in Fe-Cr alloys by means of a multi PF model coupling with CALPHAD thermodynamic and atomic mobility descriptions. In Section 2, we introduce the multi PF method and the physical parameters used in the PF simulation. In Section 3, the multi PF results are presented and benchmarked against the predictions of Wagner’s theory.

2. Materials and Methods

In the multi PF modeling of a multi-phase and mult-components alloy during phase transformations, the nonconserved phase fields, ϕ α , ϕ β , ϕ γ ϕ N , and the conserved concentration fields, c 1 , c 2 , c 3 c n govern the evolution of the microstructure. The motion of the interfaces between different phases is controlled by the Allen–Cahn and Cahn–Hilliard equations, which are given by [22,23]
ϕ ˙ = j = α , β , , N μ i j σ i j ϕ j 2 ϕ i ϕ i 2 ϕ j + π 2 2 η 2 ( ϕ i ϕ j ) + π η ϕ i ϕ j Δ g i j ,
where μ i j indicates the interface mobility of an i / j interface, and σ i j is the orientation-dependent interface energy. In the present work, an isotropic interface energy is employed. η is the interface width and Δ g i j presents the chemical driving force which indicates the deviation from the thermodynamic equilibrium state and is given by
Δ g i j = f i ( c n i ) + f j ( c n j ) + μ ˜ n ( c n i c n j ) ,
where c n i and c n j are the concentration of component n in phase i and phase j, respectively. Additionally, μ ˜ n is the diffusion potential of component n.
The evolution equation of the concentration field obeys Fick’s law, which can be expressed as
c ˙ = i = α , β , , N ϕ i D i c i ,
with D i being the diffusion coefficient of phase i.
The aforementioned multi-PF model is incorporated in the commercial software MICRESS 6.4 (MICRostructure Evolution Simulation Software) [44]. One advantage of using MICRESS is that reliable chemical driving forces and diffusivity information required for the phase field simulations are capable of being provided by CALPHAD thermodynamic and atomic databases via the so-called TQ interface. The thermodynamic and atomic data utilized in the present simulations are chosen from [45,46].
As mentioned in Section 1, the Cr-related oxidation and degradation processes are of great interest in SOFCs. In this work, the oxidation behavior of one ferritic stainless steel, i.e., Crofer 22 APU, is investigated. The chemical composition of Crofer 22 APU [47] is listed in Table 1. Although small amounts of adding elements exist in Crofer 22 APU, we assume that they neither influence the diffusion of Cr in the matrix phase nor alter the composition of Cr oxide. The Cr content in the Crofer 22 APU serves as a reference for determining the appropriate Cr concentration in the following PF simulations.
Thus, the range of the Cr concentration in the present simulations is from 20 wt.% to 24 wt.%, while other elements are neglected. In order to reproduce the growth kinetics of the oxidation process of Crofer 22 APU, a sandwich simulation structure is initialized, in which the stoichiometric compound Cr 2 O 3 is defined between the fuel gas phase and the ferritic matrix phase, as shown in Figure 1.
The total length of the simulation box is 40 μ m with the grid spacing being 20 nm. To simplify the simulations, nucleation is not considered and instead a thin layer of Cr 2 O 3 is predefined at the beginning of the simulations. The thickness of the initialized Cr 2 O 3 layer is much smaller than the total length of the simulation domain. It ensures that the diffusion process ahead of the Cr 2 O 3 is not hampered. The interface energy between Cr 2 O 3 and the ferrite phase is set to 3.0 J/m 2 , which is taken from [48]. Due to the lack of measurement and estimation data, the interfacial mobility of the Cr 2 O 3 /ferritic matrix interface is chosen as large as possible in order to make sure the oxidation process is diffusion controlled [49]. As for the boundary conditions, the concentration of oxygen at the Cr 2 O 3 /gas interface and the concentration of Cr in the matrix phase far ahead from the growth front of Cr oxide are defined as constants, i.e., N O 0 and N Cr 0 .
In the real case, with the addition of Mn in the steels, the spinel phase (Mn, Cr) 3 O 4 also forms ahead of the Cr 2 O 3 layer and the concentration of Mn in the substrate depletes. However, the spinel layer affects the rate of Cr evaporation and therefore indirectly influences the thickness of Cr 2 O 3 observed in the experiments. In addition, our present work sets out to quantitatively investigate the growth rates of the protective Cr 2 O 3 layer, which paves the way for further modeling the combined Cr oxidation and evaporation processes. Hence, we only study the formation of Cr 2 O 3 with an internal oxidation behavior in the present work, and the transition from internal to external oxidation caused by the change in Cr concentration as well as the formation of other oxides with a multi-layer structure, such as Fe oxides and FeCr 2 O 4 layers, are not considered.

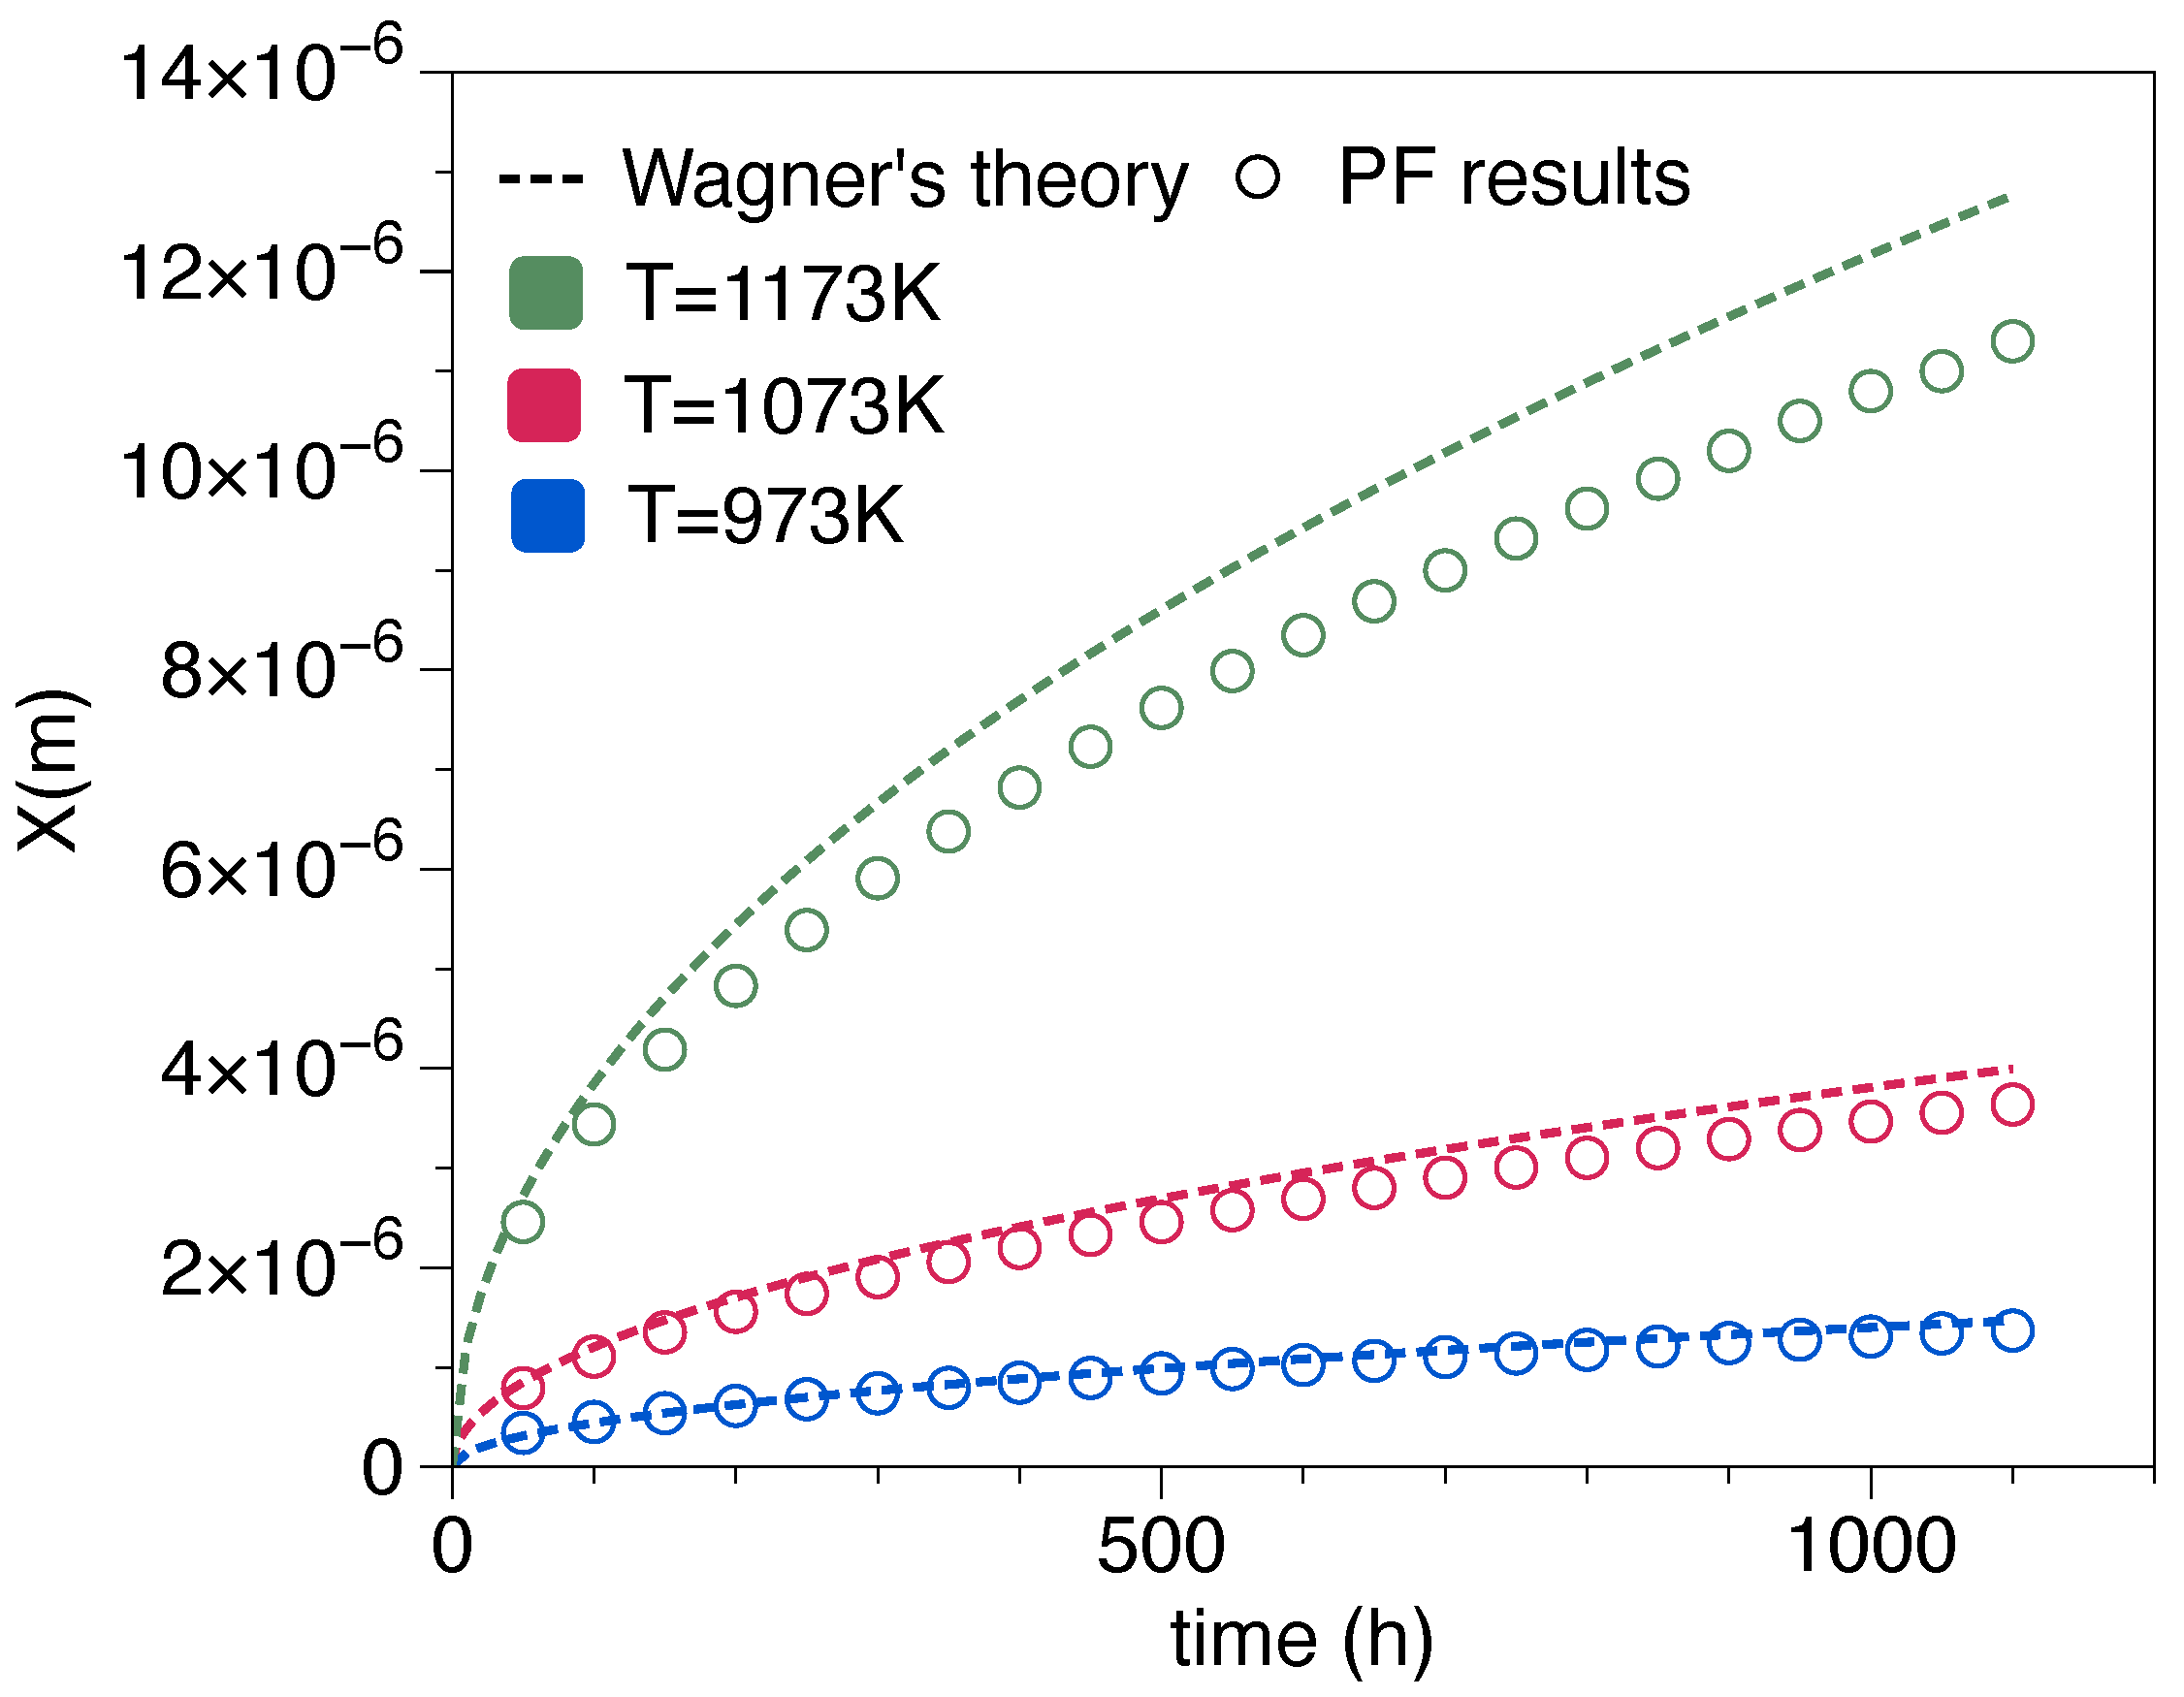
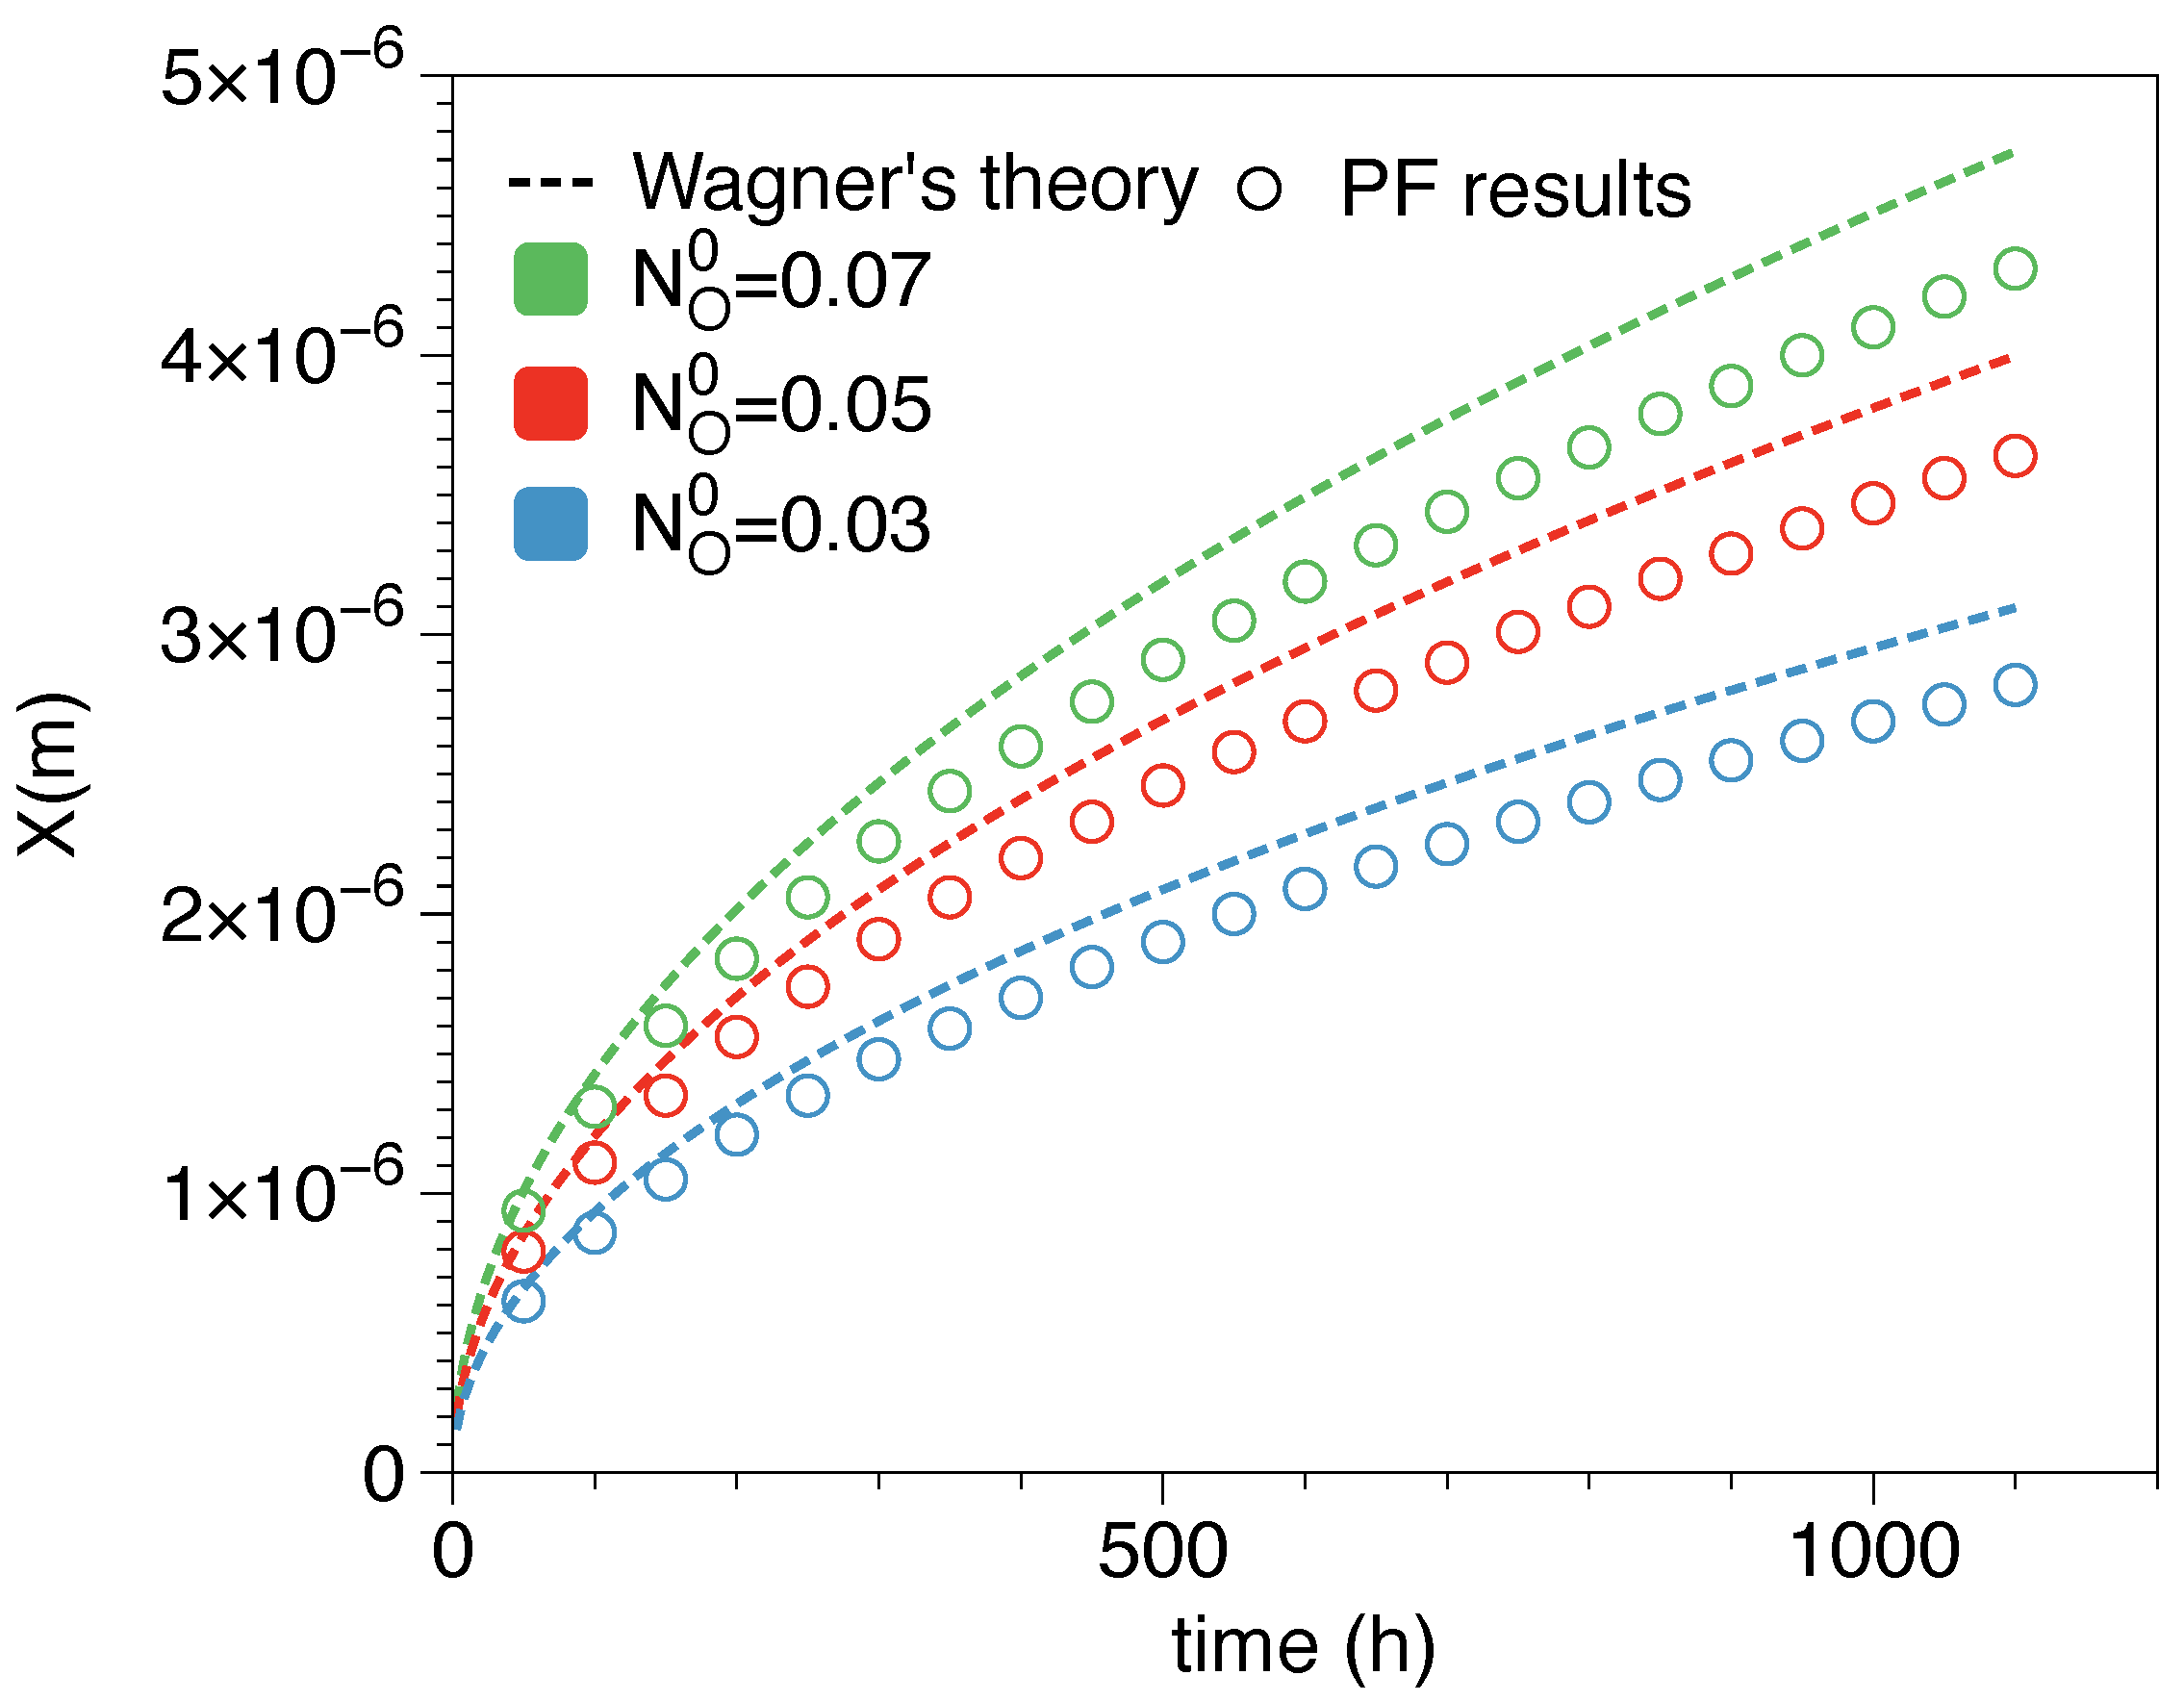
3. Results and Discussions

In the present work, the Cr 2 O 3 formation is simulated by using the multi-PF model, as implemented in MICRESS, linked to reliable CALPHAD databases. As mentioned in the introduction, the characteristic feature of the PF model is the use of a diffuse interface. The thickness of the diffuse interface can be several orders of magnitude larger than the true physical scale to save computational time. However, the artificially enhanced interface thickness brings some abnormal interface effects during PF simulations. These abnormal interface effects lead to undesired potential jumps at the interface region and deviations from the desired equilibrium boundary conditions. Consequently, compared to sharp interface predictions, the kinetics of the interface motion can be significantly altered in the PF simulations. In order to overcome the challenges of the standard PF model, on the one hand, a quantitative PF model, which is capable of reproducing the equilibrium boundary conditions during the diffusion-controlled growth of Cr-oxide and coupling with CALPHAD databases, is required. On the other hand, the kinetics of the interface motion, as predicted by the PF model, need to be compared to sharp interface approaches. Therefore, the multi-PF results are benchmarked with Wagner’s theory, which is frequently used in the literature to interpret oxidation kinetics. Wagner’s theory explains the growth kinetics of oxide in the condition of the quasi-steady approximation [18,19]. Through establishing the flux of oxygen through the internal oxidation zone, the parabolic relation of the thickness of the internal oxidation region for Crofer 22 APU alloy over time can be expressed as
X = 2 N O 0 D O k N Cr 0 t 1 / 2 ,
where X indicates the thickness of the internal oxidation zone and N O 0 and N Cr 0 are the compositions of oxygen and Cr at the oxide/gas interface and in the matrix far ahead from the growth front of oxide, respectively. D O is the effective diffusivity of oxygen in the oxide region. The stoichiometric parameter k is 1.5 for the formation of Cr 2 O 3 and t is the growth time of the oxide. The basic idea to obtain Equation (4) is as follows: At the two surfaces of the time dependent oxide with scale thickness X ( t ) we have different prescribed oxygen vacancy concentrations. At the air side, it results from a balance with the atmospheric partial pressure, and at the contact with the base metal from local equilibrium conditions there. As these two concentrations differ, a net diffusive flux arises, j D O / X , as the concentration gradient scales inversely proportional to the scale thickness X ( t ) . This flux induces scale growth with a velocity X ˙ j . By integration of this equation, one arises with the scaling X ( t ) ( D O t ) 1 / 2 , as given by Equation (4).
First, temperature plays an important role in the kinetics of oxidation. Temperature not only affects the chemical driving force but also changes the diffusivities of Cr in the matrix phase. Aiming to investigate the influence of temperature on the oxide growth kinetics, Fe-22 wt.%Cr is chosen for T = 973 K, 1073 K and 1173 K, i.e., N Cr 0 = 0.22 . These relatively high temperatures are chosen, as we expect the deviations between the analytical theory and the PF results to be most pronounced in this regime. The oxygen concentration at the Cr 2 O 3 /gas interface is 0.05, i.e., N O 0 = 0.05 . The simulation results are presented in Figure 2.
From the comparison, the growth rate of Cr 2 O 3 significantly enhances with the increment of temperature as predicted via Wagner’s theory. The deviation between the PF results and the prediction of Wagner’s theory is smaller than 7% for T = 973 K, while it increases to 11% for T = 1173 K. Therefore, we find that the discrepancy increases as a function of temperature. The reason might be that the concentrations of oxygen and Cr at the transformation front are assumed to be 0 instead of finite values in Wagner’s theory. Although such differences in the interface concentrations may exist between the two descriptions, we can conclude from the above results that for typical SOFC operation temperatures, which are smaller than 973 K, the PF simulations can indeed predict the oxidation kinetics very well.
Then, the effects of the Cr concentration in Crofer 22 APU alloy on the growth kinetics of Cr 2 O 3 are studied. In the PF simulations, 20 wt.%, 22 wt.% and 24 wt.%, i.e., N Cr 0 = 0.20, 0.22 and 0.24 are selected as the Cr concentrations, which are in the range of minimum and maximum Cr concentrations in the Crofer 22 APU alloy. Additionally, N O 0 is also defined as 0.05. Figure 3 illustrates the comparison of the PF results and the predictions of Wagner’s theory at 1073 K.
As predicted by Wagner’s theory, the decrease in Cr concentration in the matrix phase increases the growth velocity of the oxide layer. This is confirmed by the PF results. However, changing the Cr concentration within the admitted range of the Crofer 22 APU alloy only insignificantly alters the growth kinetics of Cr 2 O 3 . The ratio of the width of the internal oxidation zone between Fe-20 wt.% Cr and Fe-24 wt.% Cr is approximately 1.1.
We also investigate the influence of the oxygen concentration at the Cr 2 O 3 /gas interface, i.e., N O 0 . In the aforementioned simulations, N O 0 = 0.05 is selected. In this part, we also simulate Cr 2 O 3 growth in the same Fe-22 wt.%Cr alloy at T=1073 K with N O 0 = 0.07 and 0.03. The comparison between PF results and the predictions of Wagner’s theory is presented in Figure 4.
From the comparison, we can conclude that the raise of N O 0 is capable of increasing the growth velocity of the oxide layer. The discrepancy between the PF results and predictions of Wagner’s theory is smaller than 9%.
In addition, the evolution of the Cr concentration profile plays an important role in the oxidation process of Fe-Cr-based alloys and the further evaporation process. A larger gradient of the Cr concentration leads to faster loss of Cr from the interconnect, which is undesirable during SOFC operation. Thus, the concentration profile of Cr ahead of the interface of the Cr 2 O 3 /matrix phase is obtained from the PF results and compared with Wagner’s theory. In the latter, the concentration of Cr can be written as a function of distance x [19]
N C r = N C r 0 N C r 0 1 erf x 2 D C r t erfc ( θ 1 / 2 γ ) ,
where x is equal to 0 at the Cr 2 O 3 /gas interface, γ is the diffusion length and can be calculated by γ = X / ( 2 D O t ) with X being the position of the Cr 2 O 3 /matrix interface. In Figure 5, the Cr concentrations ahead of the interface of the Cr 2 O 3 and the matrix phase as obtained from the PF results are compared with the predictions of Wagner’s theory (denoted as analytical prediction).
The intersection of the Cr concentration profiles and the x-axis indicates the position of the Cr 2 O 3 /matrix location. In Figure 5a, the Cr concentration profiles at different times, i.e., 500 h and 1000 h, are demonstrated for T=1073 K, N O 0 = 0.05 , N C r 0 = 0.22 . We can find that the PF results agree well with the analytical predictions. However, the gradient of the Cr concentration decreases for a longer simulation time. In Figure 5b, for T = 1173 K, N O 0 = 0.05 , N C r 0 = 0.22 , the increment of the temperature significantly increases the position of the Cr 2 O 3 /matrix interface. Nevertheless, the discrepancy between the PF results and the analytical predictions is much larger. It might be caused by the Cr concentration at the right boundary of the matrix becoming smaller than N C r 0 in the analytical expression, while the right boundary is fixed to a finite concentration in the PF simulations. In Figure 5c,d, N C r 0 and N O 0 are changed to 0.2 and 0.07, respectively, compared to Figure 5a. The PF results show good agreement with the analytical predictions.
Although our present PF simulations demonstrate a good agreement with the predictions of Wagner’s theory, a direct comparison between the PF results and experimental observations is still desirable for further validation in the future. For the oxidation processes of an alloy, different oxides might form and a multi-layer structure appears aforementioned. For instance, in the Crofer 22 APU alloy, not only Cr 2 O 3 but also the spinel phase, such as (Mn,Cr) 3 O 4 , grow near the gas/matrix interface region, which strongly influences the oxygen adsorption and diffusion. Moreover, the lack of accurate oxygen concentration at the gas/matrix interface is another factor to hinder the quantitative comparison of the PF results and experimental observations. Therefore, in future work, the PF modeling of the entire oxidation process and reproducing the experimental observations are interesting directions. In order to achieve this goal, a PF model equipped with nucleation behavior is required to reproduce the grain formation and growth of Cr-oxide. Additionally, with nucleation behavior, the grain boundary distribution is presented and the grain boundary diffusion of Mn for the formation of spinel phase can be well estimated.

4. Conclusions

In the present work, the kinetics of the internal oxide formation in Crofer 22 APU alloy are investigated by means of the multi-PF model coupled with CALPHAD databases for different temperatures, Cr concentration in the matrix, N Cr 0 and oxygen concentration at the Cr 2 O 3 /gas interface, N O 0 . On the one hand, benchmarks between the PF results and the predictions of Wagner’s theory are implemented and a good agreement is evidenced, which verifies the quantitative performance of the multi-PF model. On the other hand, we find that the increment in temperature considerably enhances the growth velocity of Cr 2 O 3 , whereas the influence of N Cr 0 and N O 0 is not very significant. In addition, the Cr concentration profiles ahead of the Cr 2 O 3 /matrix interface obtained from PF simulations are also presented and lead to a nice agreement with the predictions of Wagner’s theory. We believe that our work paves the way for further theoretical investigations of the evaporation process of Cr 2 O 3 in dry or humid atmospheres, as well as for studying the influence of oxide formation in the interconnect on the SOFC degradation process. Here, it should be pointed out that the strength of the phase field method is that it can model accurately the entire microstructure evolution during oxidation with formation of different phases and the development of complex morphologies without making assumptions about the shape of the transformation fronts. Therefore, this technique has the advantage to model the development of the microstructure in the interconnector steels without making a priori assumptions on the distribution and types of phases, which are captured here in a fully self-consistent way.

Author Contributions

Conceptualization, K.W. and R.S.; methodology, K.W.; software, K.W.; validation, K.W. and R.S.; formal analysis, K.W.; investigation, K.W.; resources, K.W.; data curation, K.W.; writing—original draft preparation, K.W.; writing—review and editing, R.S.; visualization, K.W.; supervision, R.S.; project administration, R.S.; funding acquisition, R.S. All authors have read and agreed to the published version of the manuscript.

Funding

This research was funded by Project SOC Degradation 2.0 (FKZ: 03SF0621A) from the German Federal Ministry of Education and Research.

Institutional Review Board Statement

Not applicable.

Informed Consent Statement

Not applicable.

Data Availability Statement

Not applicable.

Acknowledgments

The authors gratefully acknowledge the computing time granted by the JARA Vergabegremium and provided on the JARA Partition part of the supercomputer JURECA at Forschungszentrum Jülich [50]. Open access was funded by the Deutsche Forschungsgemeinschaft (DFG, German Research Foundation)—491111487.

Conflicts of Interest

The authors declare no conflict of interest.

References

  1. Chehrmonavari, H.; Kakaee, A.; Hosseini, S.E.; Desideri, U.; Tsatsaronis, G.; Floerchinger, G.; Braun, R.; Paykani, A. Hybridizing solid oxide fuel cells with internal combustion engines for power and propulsion systems: A review. Renew. Sustain. Energy Rev. 2023, 171, 112982. [Google Scholar] [CrossRef]
  2. Zarabi Golkhatmi, S.; Asghar, M.I.; Lund, P.D. A review on solid oxide fuel cell durability: Latest progress, mechanisms, and study tools. Renew. Sustain. Energy Rev. 2022, 161, 112339. [Google Scholar] [CrossRef]
  3. Xu, Q.; Guo, Z.; Xia, L.; He, Q.; Li, Z.; Temitope Bello, I.; Zheng, K.; Ni, M. A comprehensive review of solid oxide fuel cells operating on various promising alternative fuels. Energy Convers. Manag. 2022, 253, 115175. [Google Scholar] [CrossRef]
  4. Bilal Hanif, M.; Motola, M.; qayyum, S.; Rauf, S.; khalid, A.; Li, C.J.; Li, C.X. Recent advancements, doping strategies and the future perspective of perovskite-based solid oxide fuel cells for energy conversion. Chem. Eng. J. 2022, 428, 132603. [Google Scholar] [CrossRef]
  5. Hu, Y.Z.; Yao, S.W.; Li, C.X.; Li, C.J.; Zhang, S.L. Influence of pre-reduction on microstructure homogeneity and electrical properties of APS Mn1.5Co1.5O4 coatings for SOFC interconnects. Int. J. Hydrogen Energy 2017, 42, 27241–27253. [Google Scholar] [CrossRef]
  6. Han, M.; Peng, S.; Wang, Z.; Yang, Z.; Chen, X. Properties of Fe–Cr based alloys as interconnects in a solid oxide fuel cell. J. Power Sources 2007, 164, 278–283. [Google Scholar] [CrossRef]
  7. Ebrahimifar, H.; Zandrahimi, M. Oxidation and electrical behavior of AISI 430 coated with cobalt spinels for SOFC interconnect applications. Surf. Coat. Technol. 2011, 206, 75–81. [Google Scholar] [CrossRef]
  8. Thublaor, T.; Chandra-ambhorn, S. High temperature oxidation and chromium volatilisation of AISI 430 stainless steel coated by Mn-Co and Mn-Co-Cu oxides for SOFC interconnect application. Corros. Sci. 2020, 174, 108802. [Google Scholar] [CrossRef]
  9. Fujita, K.; Ogasawara, K.; Matsuzaki, Y.; Sakurai, T. Prevention of SOFC cathode degradation in contact with Cr-containing alloy. J. Power Sources 2004, 131, 261–269. [Google Scholar] [CrossRef]
  10. Manjunath, N.; Santhy, K.; Rajasekaran, B. Thermal expansion of Crofer 22 APU steel used for SOFC interconnect using in-situ high temperature X-ray diffraction. In Materials Today: Proceedings; Elsevier: Amsterdam, The Netherlands, 2023. [Google Scholar] [CrossRef]
  11. Topcu, A.; Öztürk, B.; Cora, Ö.N. Performance evaluation of machined and powder metallurgically fabricated Crofer®22 APU interconnects for SOFC applications. Int. J. Hydrog. Energy 2022, 47, 3437–3448. [Google Scholar] [CrossRef]
  12. Yin, X.; Beez, A.; Menzler, N.H.; Spatschek, R. Combined experimental and ab initio based determination of the thermal expansion of La0.5Sr0.5Co0.25Fe0.75O3. J. Am. Ceram. Soc. 2018, 101, 3086. [Google Scholar] [CrossRef]
  13. Beez, A.; Yin, X.; Menzler, N.H.; Spatschek, R.; Bram, M. Insight into the Reaction Mechanism of (La0.58Sr0.40)(Co0.20Fe0.80)O3-δ Cathode with Volatile Chromium Species at High Current Density in a Solid Oxide Fuel Cell Stack. J. Electrochem. Soc. 2017, 164, F3028. [Google Scholar] [CrossRef]
  14. Fang, Q.; Menzler, N.H.; Blum, L. Degradation Analysis of Long-Term Solid Oxide Fuel Cell Stacks with Respect to Chromium Poisoning in La0.58Sr0.4Co0.2Fe0.8O3-δ and La0.6Sr0.4CoO3-δ Cathodes. J. Electrochem. Soc. 2021, 168, 104505. [Google Scholar] [CrossRef]
  15. Sachitanand, R.; Sattari, M.; Svensson, J.E.; Froitzheim, J. Evaluation of the oxidation and Cr evaporation properties of selected FeCr alloys used as SOFC interconnects. Int. J. Hydrogen Energy 2013, 38, 15328–15334. [Google Scholar] [CrossRef]
  16. Magdefrau, N.J.; Chen, L.; Sun, E.Y.; Aindow, M. Effects of alloy heat treatment on oxidation kinetics and scale morphology for Crofer 22 APU. J. Power Sources 2013, 241, 756–767. [Google Scholar] [CrossRef]
  17. Falk-Windisch, H.; Svensson, J.E.; Froitzheim, J. The effect of temperature on chromium vaporization and oxide scale growth on interconnect steels for Solid Oxide Fuel Cells. J. Power Sources 2015, 287, 25–35. [Google Scholar] [CrossRef]
  18. Wagner, C. Reaktionstypen bei der Oxydation von Legierungen. Z. Für Elektrochem. Berichte Bunsenges. Für Phys. Chem. 1959, 63, 772–782. [Google Scholar] [CrossRef]
  19. Birks, N.; Meier, G.H.; Pettit, F.S. Introduction to the High Temperature Oxidation of Metals, 2nd ed.; Cambridge University Press: Cambridge, UK, 2006. [Google Scholar] [CrossRef]
  20. Rapp, R. The transition from internal to external oxidation and the formation of interruption bands in silver-indium alloys. Acta Metall. 1961, 9, 730–741. [Google Scholar] [CrossRef]
  21. Zhao, W.; Kang, Y.; Orozco, J.M.A.; Gleeson, B. Quantitative approach for determining the critical volume fraction for the transition from internal to external oxidation. Oxid. Met. 2015, 83, 187–201. [Google Scholar] [CrossRef]
  22. Wang, K.; Wei, M.; Zhang, L.; Du, Y. Morphologies of Primary Silicon in Hypereutectic Al-Si Alloys: Phase-Field Simulation Supported by Key Experiments. Metall. Mater. Trans. A 2016, 47, 1510–1516. [Google Scholar] [CrossRef]
  23. Wang, K.; Zhang, L. Quantitative phase-field simulation of the entire solidification process in one hypereutectic Al–Si alloy considering the effect of latent heat. Prog. Nat. Sci. Mater. Int. 2021, 31, 428–433. [Google Scholar] [CrossRef]
  24. Van der Waals, J.D. The thermodynamic theory of capillarity under the hypothesis of a continuous variation of density. J. Stat. Phys. 1979, 20, 200–244. [Google Scholar] [CrossRef]
  25. Ginzburg, V.L.; Ginzburg, V.L.; Landau, L. On the Theory of Superconductivity; Springer: Berlin/Heidelberg, Germany, 2009. [Google Scholar]
  26. Cahn, J.W.; Hilliard, J.E. Free energy of a nonuniform system. I. Interfacial free energy. J. Chem. Phys. 1958, 28, 258–267. [Google Scholar] [CrossRef]
  27. Hohenberg, P.C.; Halperin, B.I. Theory of dynamic critical phenomena. Rev. Mod. Phys. 1977, 49, 435. [Google Scholar] [CrossRef]
  28. Karma, A.; Rappel, W.J. Quantitative phase-field modeling of dendritic growth in two and three dimensions. Phys. Rev. E 1998, 57, 4323. [Google Scholar] [CrossRef]
  29. Karma, A. Phase-field model of eutectic growth. Phys. Rev. E 1994, 49, 2245. [Google Scholar] [CrossRef]
  30. Nestler, B.; Wheeler, A. A multi-phase-field model of eutectic and peritectic alloys: Numerical simulation of growth structures. Phys. D Nonlinear Phenom. 2000, 138, 114–133. [Google Scholar] [CrossRef]
  31. Chen, L.Q. Phase-field models for microstructure evolution. Annu. Rev. Mater. Res. 2002, 32, 113–140. [Google Scholar] [CrossRef]
  32. Sandt, R.; Le Bouar, Y.; Spatschek, R. Quantum annealing for microstructure equilibration with long-range elastic interactions. Sci. Rep. 2023, 13, 6036. [Google Scholar] [CrossRef]
  33. Borden, M.J.; Verhoosel, C.V.; Scott, M.A.; Hughes, T.J.; Landis, C.M. A phase-field description of dynamic brittle fracture. Comput. Methods Appl. Mech. Eng. 2012, 217, 77–95. [Google Scholar] [CrossRef]
  34. Mellenthin, J.; Karma, A.; Plapp, M. Phase-field crystal study of grain-boundary premelting. Phys. Rev. B 2008, 78, 184110. [Google Scholar] [CrossRef]
  35. Miehe, C.; Dal, H.; Schänzel, L.M.; Raina, A. A phase-field model for chemo-mechanical induced fracture in lithium-ion battery electrode particles. Int. J. Numer. Methods Eng. 2016, 106, 683–711. [Google Scholar] [CrossRef]
  36. Jin, Y.M. Domain microstructure evolution in magnetic shape memory alloys: Phase-field model and simulation. Acta Mater. 2009, 57, 2488–2495. [Google Scholar] [CrossRef]
  37. Wang, K.; Boussinot, G.; Hüter, C.; Brener, E.A.; Spatschek, R. Modeling of dendritic growth using a quantitative nondiagonal phase field model. Phys. Rev. Mater. 2020, 4, 033802. [Google Scholar] [CrossRef]
  38. Wang, K.; Boussinot, G.; Brener, E.A.; Spatschek, R. Quantitative nondiagonal phase field modeling of eutectic and eutectoid transformations. Phys. Rev. B 2021, 103, 184111. [Google Scholar] [CrossRef]
  39. Wang, K.; Wei, M.; Zhang, L. Anomalous Halo Formation in an Arc-Melted ScNi-Sc2Ni Off-Eutectic Binary Alloy. Materials 2016, 9, 584. [Google Scholar] [CrossRef]
  40. Asle Zaeem, M.; El Kadiri, H. An elastic phase field model for thermal oxidation of metals: Application to zirconia. Comput. Mater. Sci. 2014, 89, 122–129. [Google Scholar] [CrossRef]
  41. Sherman, Q.C.; Voorhees, P.W. Phase-field model of oxidation: Equilibrium. Phys. Rev. E 2017, 95, 032801. [Google Scholar] [CrossRef]
  42. Kim, K.; Sherman, Q.C.; Aagesen, L.K.; Voorhees, P.W. Phase-field model of oxidation: Kinetics. Phys. Rev. E 2020, 101, 022802. [Google Scholar] [CrossRef]
  43. Wang, R.; Ji, Y.; Cheng, T.; Xue, F.; Chen, L.Q.; Wen, Y.H. A Phase-Field Study on Internal to External Oxidation Transition in High-Temperature Structural Alloys. JOM 2022, 74, 1435–1443. [Google Scholar] [CrossRef]
  44. ACCESS, e.V. MICRESS. Available online: https://micress.rwth-aachen.de (accessed on 2 April 2023).
  45. Taylor, J.R.; Dinsdale, A.T. A Thermodynamic Assessment of the Cr-Fe-O System. Int. J. Mater. Res. 1993, 84, 335–345. [Google Scholar] [CrossRef]
  46. Auinger, M.; Naraparaju, R.; Christ, H.J.; Rohwerder, M. Modelling High Temperature Oxidation in Iron–Chromium Systems: Combined Kinetic and Thermodynamic Calculation of the Long-Term Behaviour and Experimental Verification. Oxid. Met. 2011, 76, 247–258. [Google Scholar] [CrossRef]
  47. Saeidpour, F.; Zandrahimi, M.; Ebrahimifar, H. Evaluation of pulse electroplated cobalt/yttrium oxide composite coating on the Crofer 22 APU stainless steel interconnect. Int. J. Hydrogen Energy 2019, 44, 3157–3169. [Google Scholar] [CrossRef]
  48. Sun, J.; Stirner, T.; Matthews, A. Structure and surface energy of low-index surfaces of stoichiometric α-Al2O3 and α-Cr2O3. Surf. Coat. Technol. 2006, 201, 4205–4208. [Google Scholar] [CrossRef]
  49. Nakajima, K.; Apel, M.; Steinbach, I. The role of carbon diffusion in ferrite on the kinetics of cooperative growth of pearlite: A multi-phase field study. Acta Mater. 2006, 54, 3665–3672. [Google Scholar] [CrossRef]
  50. Krause, D.; Thörnig, P. JURECA: Modular supercomputer at Jülich supercomputing centre. J. Large-Scale Res. Facil. 2018, 4, A132. [Google Scholar] [CrossRef]
Figure 1. Schematic sandwich structure of the PF simulation domain. The yellow, blue and grey regions are the thin layer of Cr 2 O 3 , the ferritic matrix phase and an assumed gas phase, respectively. The goal of introducing the gas phase region is to provide sufficient oxygen. The mobility of the Cr 2 O 3 /gas interface is set to 0.
Energies 16 03574 g001
Figure 2. Comparison of the oxide scale thickness X of the Cr 2 O 3 layer obtained from PF results and the predictions of Wagner’s theory for different temperatures, such as T = 1173 K, 1073 K and 973 K in an Fe-22 wt.%Cr alloy with N O 0 = 0.05 . The increment of temperature significantly enhances the growth velocity of Cr 2 O 3 .
Energies 16 03574 g002
Figure 3. Comparison of the oxide scale thickness X of the Cr 2 O 3 layer obtained from PF results and the predictions of Wagner’s theory for different Cr concentrations in the matrix phase with N C r 0 = 0.22 at T = 1073 K. The PF results predict similar trends as Wagner’s theory.
Energies 16 03574 g003
Figure 4. Comparison of the scale growth of the Cr 2 O 3 layer obtained from the PF results and the predictions of Wagner’s theory for different oxygen concentrations at the Cr 2 O 3 /gas interface, i.e., N O 0 = 0.07, 0.05 and 0.03, in Fe-22 wt.%Cr alloy at T = 1073 K.
Energies 16 03574 g004
Figure 5. Comparison of the PF results and the predictions of Wagner’s theory for the Cr concentration ahead of the interface of the Cr 2 O 3 /matrix phase when (a) T = 1073 K, N O 0 = 0.05 , N C r 0 = 0.22 , (b) T = 1173 K, N O 0 = 0.05 , N C r 0 = 0.22 , (c) T = 1073 K, N O 0 = 0.05 , N C r 0 = 0.20 , (d) T = 1073 K, N O 0 = 0.07 , N C r 0 = 0.22 .
Energies 16 03574 g005
Table 1. Composition of the Crofer 22 APU alloy used in this study (in wt.%).
ElementFeCrMnTiLaCSiCuPAlS
ConcentrationBal.20–240.420.070.04–0.20.030.50.50.0050.50.5
Disclaimer/Publisher’s Note: The statements, opinions and data contained in all publications are solely those of the individual author(s) and contributor(s) and not of MDPI and/or the editor(s). MDPI and/or the editor(s) disclaim responsibility for any injury to people or property resulting from any ideas, methods, instructions or products referred to in the content.

