Article

Study on the Effect of Initial Delamination on Tensile Behavior of Offshore Wind Turbine Blade Spar Cap

1
School of Mechanical Engineering, Shenyang University of Technology, Shenyang 110870, China
2
School of Mechanical Engineering, Liaoning Institute of Science and Technology, Benxi 117004, China
3
School of Architecture and Civil Engineering, Shenyang University of Technology, Shenyang 110870, China
*
Author to whom correspondence should be addressed.
Energies 2023, 16(8), 3607; https://doi.org/10.3390/en16083607
Submission received: 23 March 2023 / Revised: 16 April 2023 / Accepted: 18 April 2023 / Published: 21 April 2023
(This article belongs to the Special Issue Theoretical and Technical Challenges in Offshore Wind Power)

Abstract

:
Delamination damage to spar caps seriously endangers the operation safety of offshore wind turbines. The effect of initial delamination of various depths and areas on the ultimate tensile load of laminates is studied based on experiments and numerical simulation, and an effective method for predicting the residual tensile strength of laminates with high thickness is proposed. Three groups of initial delamination specimens with different characteristics were fabricated, and static displacement tensile tests were carried out. An accurate three-dimensional numerical analysis model was established, and the results were in good agreement with the experimental values, with the overall error of the failure load being less than 6%. Furthermore, a numerical model for a 20-ply high-thickness spar cap laminate was established to predict the effect of delamination on tensile strength. The results showed that, for the same depth of initial delamination, the difference in delamination area had little influence on the tensile strength. The dangerous locations of delamination were at the shallow surface and at the ratio of 0.3–0.4 in the thickness direction, and the maximum decrease in tensile strength was 14.86%; meanwhile, it was found that delamination on the middle surface had no significant effect on tensile strength.

1. Introduction

In recent years, offshore wind turbines have brought considerable economic benefits to energy power generation in a number of countries due to its advantages in terms of abundant wind energy reserves, continuous stability, the territory being free of charge, flexible construction space, low degree of visual interference and low environmental impact [1,2]. With the increase in the demand for power generation, blade structures have also been upgraded in terms of size [3]. Wind turbine blades are a key component in converting wind energy into electric energy, and their ultimate load carrying capacity plays a vital role in safe operation. However, offshore wind turbines operate under changeable, rough sea conditions and environments with extreme wind load, along with increased probability of blade failure. As an important structural part of the blades, the spar cap is a fiber–resin composite laminated using dozens of unidirectional fabrics, which bears more than 60% of the blade’s ultimate load and provides the ability to resist flapping deformation [4]. During the health inspection of blades, it has been found that defects can occur in the process of manufacturing, transportation and operation of spar cap laminates, and these defects can easily evolve into damage under ultimate load or fatigue load [5,6]. At the same time, the complex offshore environment can accelerate the evolution of such defects into damage. Among the typical forms of damage to which blades are subjected, delamination is the most common, and it is also form of damage unique to composite laminated structures [7]. Delamination damage can lead to severe degradation of the mechanical properties of laminate structures, with 35–40% reduction in strength [8]. The spar cap is one of the areas prone to delamination damage, driven by tensile load or buckling load, and delamination damage can easily occur in the interior of the spar cap laminate structure [9]. The delamination in the spar cap can aggravate interlaminar damage, reducing the structural stiffness, strength and load-carrying capacity of the blades, and in serious cases, this can lead to catastrophic blade accidents or even the destruction of the whole machine [10,11,12]. Although the development potential of offshore wind turbines is huge, the structural safety problems caused by the extreme environment deserve special attention. Therefore, the evaluation of the initial delamination damage experienced by offshore blades and the effective prediction and assessment of failure can make it possible for blade accidents to be predicted and avoided at an early stage, which is of great significance to improving the operation of wind turbines and satisfying the requirements of safety, durability and sustainability.
To date, researchers have mainly studied the influence of initial delamination on the mechanical properties of laminates by meanas of experiments and numerical simulation. Haselbach [13] used numerical methods to study the effect of different degrees of initial delamination on the buckling performance of blade spar cap, and found that initial delamination near the surface led to high levels of strain, stress and local buckling, while delamination around the middle surface of the thickness direction of the spar cap had no significant influence on blade buckling performance. Li [14] investigated the effect of different types of initial delamination on the buckling behavior of laminates with an 8-mm-thick blade spar cap using the finite element method, and verified the results by means of compression tests, showing that the buckling mode was dependent on the size and position of the delamination. Fu and Zhang [15] studied the effects of circular initial delamination on the compressive strength of 3.84 mm laminates using a shell element numerical model considering delamination growth. The results showed that delamination size had a considerable influence on the compressive strength of the laminates, while the delamination position in the thickness direction had no obvious influence on compressive strength. Amaro [16] and Liu [17] carried out bending tests on carbon fiber laminates with initial delamination in the width direction, and showed that delamination damage significantly reduced the bending performance of the materials, mainly due to the change in shear stress distribution. It can be seen that under different loading modes, the initial delamination in laminates results in differences in failure capabilities. Studies on the initial delamination of laminates have mainly been focused on their buckling, compression and bending properties. However, the effect of initial delamination on tensile strength has rarely been studied, and the tensile properties of laminates with large thickness have not received enough attention. During the operation of the blade, the spar cap of glass fiber laminates is subjected to the coupled action of a variety of loads, including tension, compression and bending, with alternating tensile and other stress loads constantly testing the performance of the blade spar cap. Even small degrees of delamination damage represent a certain hidden danger to the safe operation of blades, so it is necessary to study the influence of delamination on the mechanical behavior of blade spar caps under tensile loads.
The Cohesive Zone Model (CZM) has been widely used for the numerical simulation of delamination [18,19]. CZM can be used not only to study the growth of initial delamination, but also to predict the initiation of new instances of delamination, which has important application value in the prediction of the occurrence of delamination [20,21]. When studying the delamination damage experienced by local blade components, Haselbach [13], Li [14] and Overgaard [19] used the CZM method to simulate the initiation and propagation of delamination, but only a single damage mode was simulated, and the interaction of multiple damage modes was not considered, thus limiting the applicability and integrity of failure assessment. The mechanical behavior and damage modes of composite materials are complex due to the different mechanical properties of the composite components (i.e., fiber and matrix). For example, failure modes such as fiber fracture, matrix cracking and delamination damage can occur independently or simultaneously [22,23]. The Continuum Damage Model (CDM) takes into account various local damage forms and the material property degradation of laminates [24], and can be used together with the CZM method to predict the damage mechanism of laminates and the interlaminar and intralaminar coupling effect. By combining the two models, an accurate finite element model can be established to simulate to a great extent the real process of damage initiation and propagation. Thus, structural damage expansion and ultimate strength can be predicted more accurately [25,26]. In order to systematically explore the influence of delamination on the tensile properties of laminates, it is still necessary to comprehensively consider various damage effects and establish an accurate numerical analysis model.
Combined with the above research progress, aiming to address the insufficiency of research on the effect of delamination on tensile properties, in this paper, the influence of initial delamination on the tensile properties of offshore blade spar caps was studied through the technical route of mutual verification on the basis of experiments and numerical simulation. The same composite material as that used for spar caps was used to make the specimens, which were prefabricated with different sizes and depths, and uniaxial tensile tests were carried out. An accurate three-dimensional numerical analysis model of a spar cap with large thickness was established, and the Cohesive Zone Model (CZM) and the Continuum Damage Model (CDM) were used to simulate the progressive interlaminar and intralaminar damage evolution process. The delamination propagation law and the coupling effect among various damage modes are expounded. Combined with the experimental and simulation results, the influence of different initial delamination damage states on the tensile strength of spar cap laminates was further verified. The research results can serve as a reference for the failure assessment and maintenance of the composite materials constituting offshore blade spar caps.

2. Experimental Study of Initial Delamination

2.1. Delamintion Damage of Blade Spar Cap

In this paper, a 1.5 MW, 40.3 m in-service blade (40.3 m blade for short) is used as the research object, and the maximum thickness of the blade spar cap is nearly 40 layers. As shown in Figure 1a, the thickness of the spar cap rapidly increases from the blade root to 5 m along the blade, before slowing down after 5 m until it reaches its maximum thickness at 20 m, after which the layup thickness of the blade spar cap gradually decreases. In the design of this blade spar cap, the minimum design safety factor is mainly distributed in the 10 m–20 m range. Therefore, this working section is an area requiring comprehensive consideration with respect to design safety factor and layup thickness of the spar cap. In Figure 1b, the ultimate flapwise moment increases linearly from the root to the tip, and the load accumulates, reaching its maximum value at the tip. However, the blade output efficiency of the cross-section decreases, so the key area for researching blade ultimate load and power generation efficiency is the area near 16 m in the spanwise direction of the blade. Therefore, in this paper, after weighing the structural safety design, power generation efficiency, ultimate loading capacity and other factors of the blade, the balanced region in the 10 m–20 m range of the blade is selected to study the delamination tensile performance of spar cap.
Infrared thermography is a visual, non-contact and nondestructive detection technology that can be used to detect and characterize near-surface defects in or damage to composite materials, and it has become an important tool for performing nondestructive detection and fault diagnosis. In recent years, it has been widely used in nondestructive detection of damage in wind turbine blades [5,27,28]. When performing field detection in the 40.3 m in-service blade (Figure 2), the areas of blade experiencing damage determined using infrared thermal imaging technology were compared with the verification results after polishing, and three delamination damages in blade spar cap area were identified. As shown in Figure 3a, delamination damage was detected at distances of 10 m, 14 m and 16 m away from the blade root. Figure 3b,e,h respectively show the infrared thermal image, optical image after polishing, and schematic diagram of delamination damage at 10 m away from the blade root. The damage was located on the pressure side, 0.8 m from the leading edge, with a long strip shape, and the delamination depth was about 5 mm. As the shape of the damage is usually irregular, the size of the damage was determined using the minimum external rectangle method (the red rectangle in the picture), and the damage area was about 10 cm × 2 cm. The delamination at R14m is shown in Figure 3c,f,i. The damage was leaf-shaped, and was located on the pressure side, with an area of about 2 cm × 2 cm and a delamination depth of 3 mm. The third delamination area was located 16 m from the pressure side, and the damage was shaped like a long strip, with an area of approximately 18 cm × 4 cm; the delamination depth was 5 mm–6 mm away from the surface, as shown in Figure 3d,g,j. By analyzing the three areas of delamination damage, it can be observed that the characteristics of the delamination can mainly be described on the basis of similarities and differences in depth and area, and the characteristics of the three instances of damage are presented as schematic diagrams in Figure 3h–j.
Because the spar cap is the main structure of the blade to bear flapwise moment load, the suction side bears the compressive load, and the pressure side bears the tensile load. It was identified in this paper that the delamination damage experienced by the in-service blade spar cap was located near the surface of the pressure side of the blade, and the damaged areas had obviously been subjected to tensile load. At the same time, according to the DNVGL-ST-0376 standard [29], the main test for blade spar cap structures is tensile load. Therefore, static tensile load was selected as the test load in this paper.

2.2. Specimen Design and Test Process

The delamination damage exhibited by the in-service blade, detected using the infrared thermal imaging method in the previous section, presented different characteristics with respect to area and depth. Therefore, three groups of test specimens presenting delamination were prefabricated in accordance with these characteristics, and a group of undamaged specimens was fabricated as the control group (No. A4), as shown in Table 1.
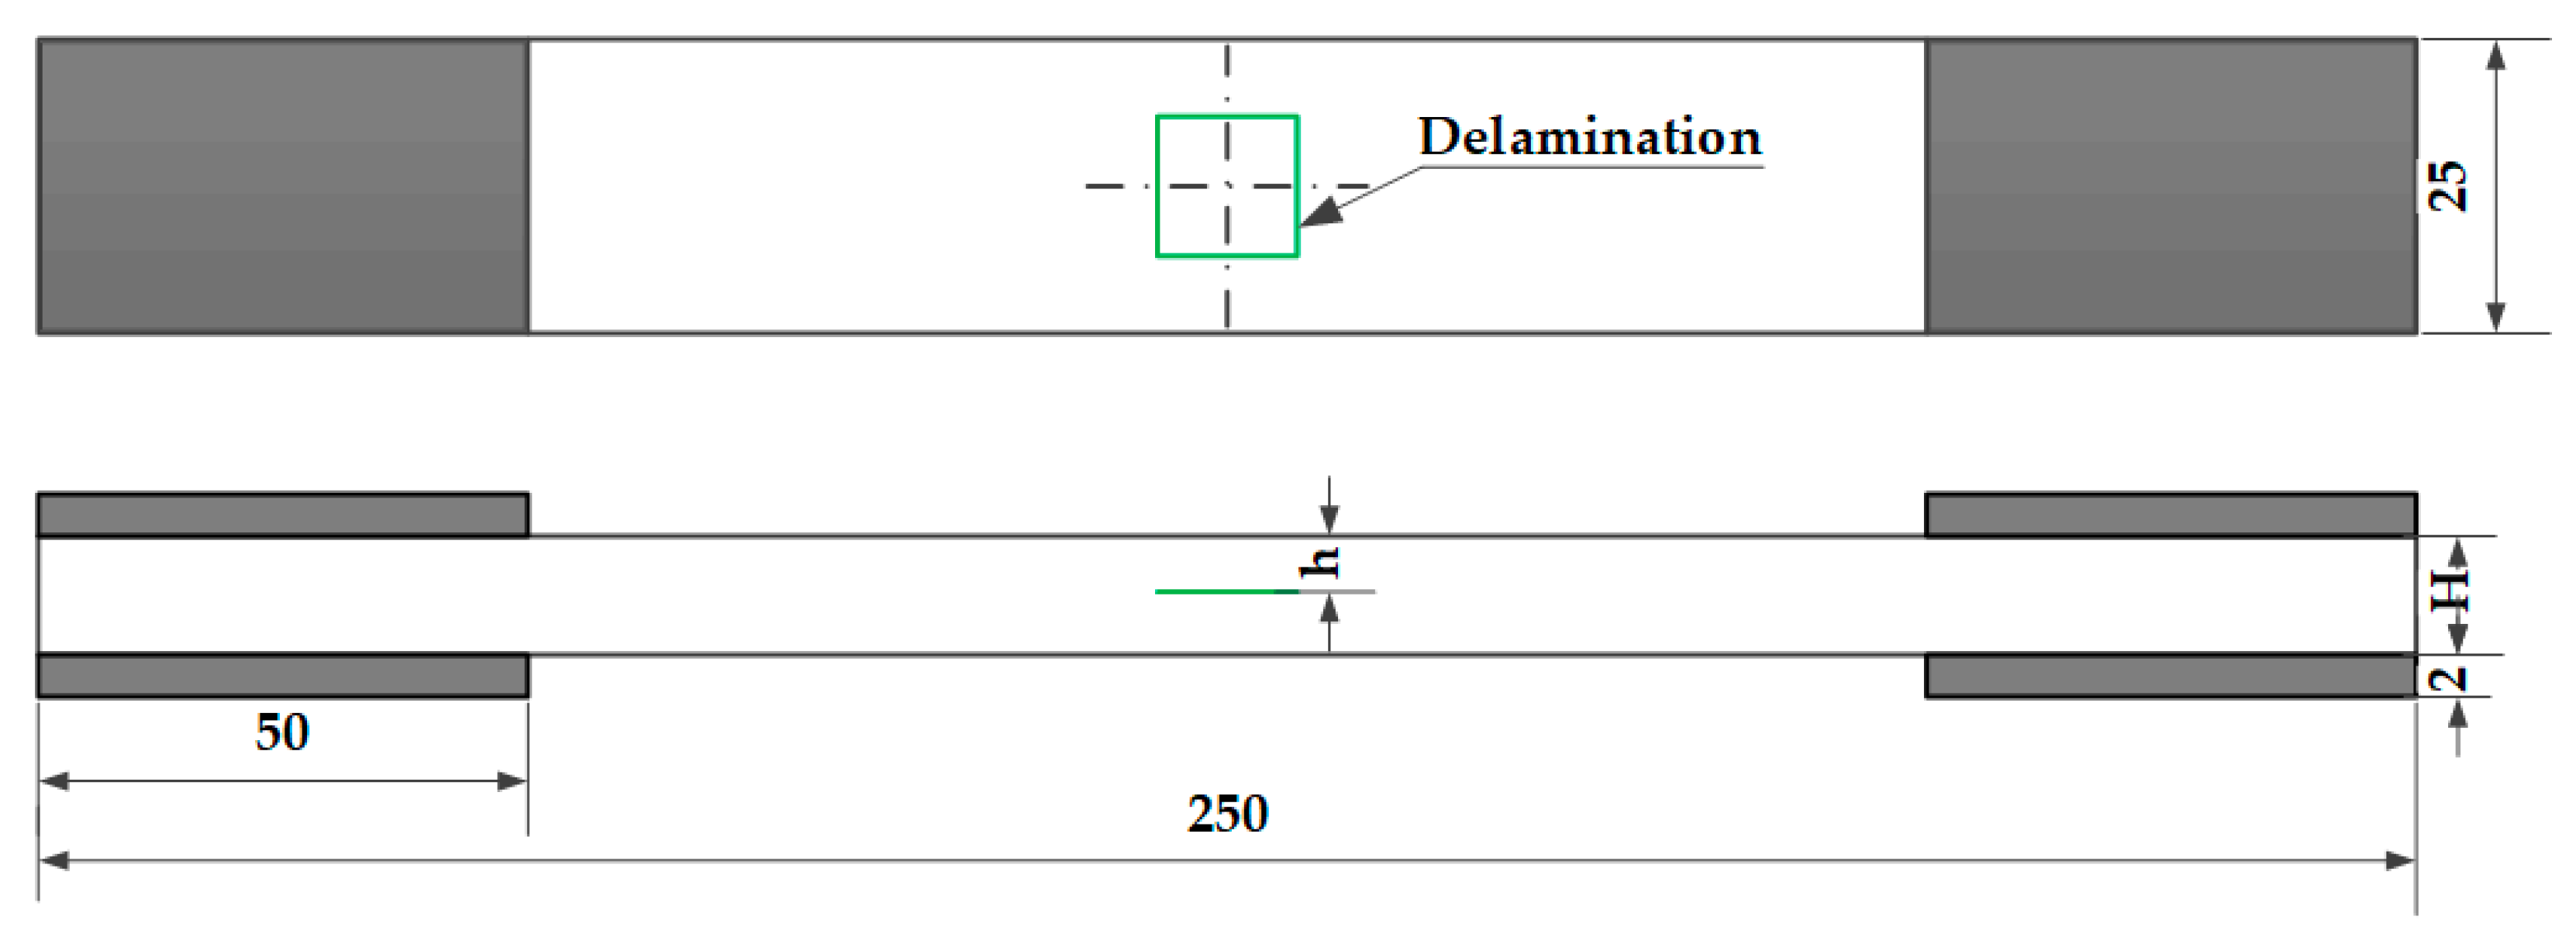
The specimens were made of UDH-1250 unidirectional (UD) layers (Owens Corning), TECHSTROM™ 180 epoxy resin and TECHSTROM™ 185 curing agent (100: 32). The laminates with stacking sequence [0]4 were prepared using the vacuum infusion method, and cured at 50 °C for 3 h, then cured at 80 °C for 3 h. The cured templates were cut into specimens of small size using the water cutting method, whereby the specimens had dimensions of 250 mm × 25 mm. Tabs were pasted on both ends to protect the clamping ends and to transfer the load to the effective area of the specimen, which were made of BX800 biaxial layers, while the effective distance of the specimen was 150mm. The embedded delamination was made of PTFE film with a thickness of 0.01 mm. During the UD laying, PTFE films with different areas were placed in the center of specimens in different layers, that is, the location of the occurrence of delamination in the thickness direction is indicated by h/H, as shown in Figure 4. Five specimens for each group were fabricated to ensure the validity of the test.
The uniaxial tensile testing of the laminates was carried out in accordance with the GB T 1040.4-2006 standard. Both ends of the specimen were held in the clamp of an Instron-5982 universal testing machine. Under the atmospheric environment of a standard laboratory (23 ± 2 °C, 50 ± 10% relative humidity), a displacement control loading mode was adopted until the failure of the specimen using a loading rate of 2 mm/min. The damage process and final failure mode of the specimen were recorded during the test. Figure 5 shows the tensile test system and test specimen.

2.3. Experimental Results and Disscussion

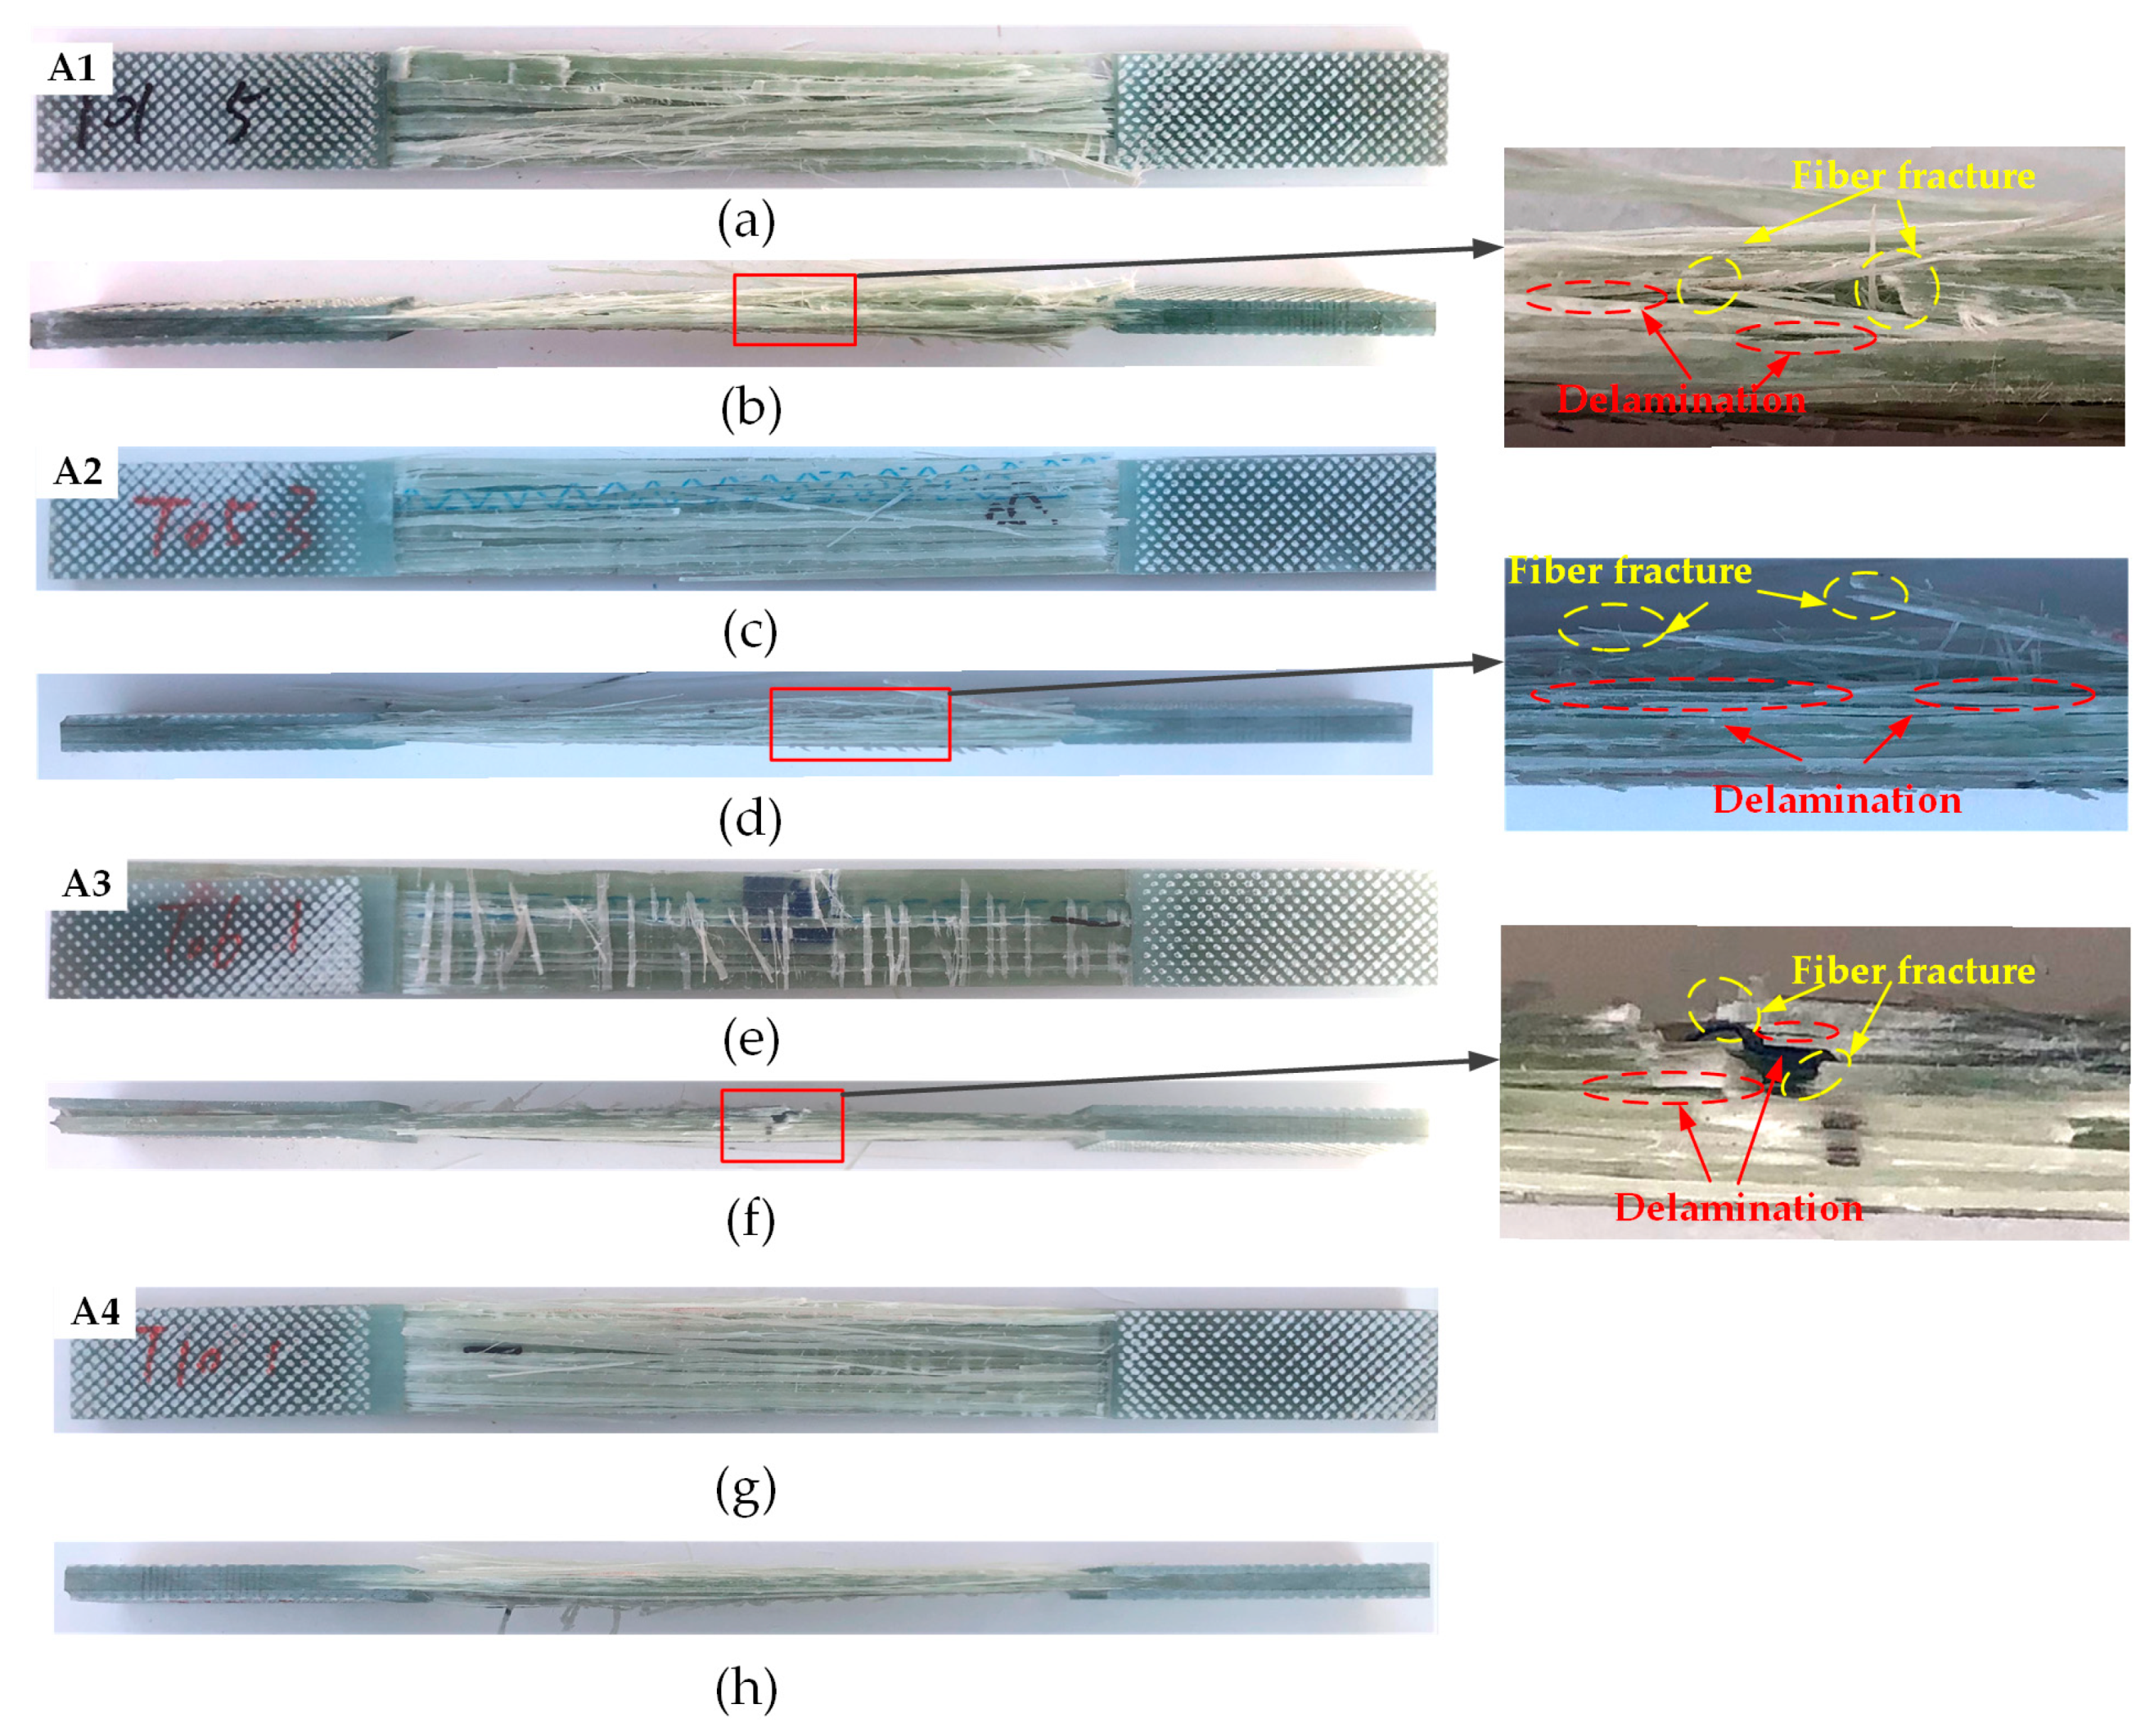
The final failure morphologies of the specimens are shown in Figure 6, where Figure 6a,b present the front and side view, respectively, of the failure of specimen A1, Figure 6c,d present the failure form of A2, and Figure 6e,f present the failure morphology of A3. It can be seen from the main view of Figure 6 that the failure morphologies of the specimen all corresponded to explosive fiber tearing, with many fibers having been pulled out, and the fracture positions were close to the side of the end tab. From the side view, it can be observed that the A1–A3 samples were damaged at or near the location of the prefabricated delamination, and there were traces of delamination propagation to a certain extent. The failure modes and appearances of the specimens were roughly the same, and the fracture positions were also roughly the same, but the ultimate tensile loads were different. Figure 6g,h show the failure mode of undamaged specimen A4, the failure mode of which mainly corresponded to whole-matrix tensile failure, and the fracture position was also close to the side of the end tab.
The tensile test results are shown in Table 2. The tensile failure load was taken as the average value of each group with effective specimens, and the dispersion coefficients of the four groups were all within 2%. The failure load of the undamaged specimen (A4) was 112kN. The failure loads of the prefabricated initial delamination specimens were reduced to varying degrees, which are expressed as tensile load loss rate. The average limit load of the A3 specimen, which had a size of 15mm × 15mm and was located at the 1/2 position of the laminate, exhibited the greatest decrease, about 11.25%. From the results, it can be observed that the average limit load was to a certain extent related to the area and position of the delamination damage. The delamination area in A2 was the same as that in A3, but the delamination damage in A2 located at the 1/4 position of the laminate in the thickness direction, and the average rate of decline in limit load was lower than that of A3, which was about 4.79%. The delamination area of A1 was 10mm × 10mm, and it was located at the 1/4 position of the laminate, exhibiting the lowest average ultimate load reduction rate, which was about 2.74%.

3. Numerical Analysis

Due to the inhomogeneity of fiber-reinforced composites at the mesoscale, their failure modes and processes are very complex, and the failure forms and mechanisms of composites with different fibers, interfaces and matrix are completely different. In light of the complexity of damage evolution, CDM and CZM were used to describe the progressive interlaminar and intralaminar damage evolution.

3.1. Intralaminar Damage Model

The Hashin failure criterion [30] can be used to distinguish different damage modes, and has been widely used to predict the damage behavior of composite materials. In this paper, the stress in the thickness direction was considered, and the three-dimensional Hashin criterion was used to predict the different damage types. The specific expression is as follows:
Fiber tensile damage ( σ 11   0 ):
( σ 11 X T ) 2 + ( τ 12 S 12 ) 2 + ( τ 13 S 13 ) 2 1
Fiber compression damage ( σ 11 0 ):
( σ 11 X C ) 2 1
Matrix tensile damage ( σ 22 + σ 33 0 ):
( σ 22 + σ 33 ) Y t 2 + τ 23 2 σ 22 σ 33 S 23 2 + ( τ 12 S 12 ) 2 + ( τ 13 S 13 ) 2 1
Matrix compression damage ( σ 22 + σ 33 < 0 ):
1 Y c [ ( Y c 2 S 12 ) 2 1 ] ( σ 22 + σ 33 ) + ( σ 22 + σ 33 2 S 12 ) 2 + 1 2 S 23 2 ( τ 23 2 σ 22 σ 33 ) + ( τ 12 S 12 ) 2 + ( τ 13 S 13 ) 2 1
where σ 11 ,   σ 33 , σ 22 ,   σ 33 are normal stresses, τ 12 ,   τ 13 ,   τ 23 are shear stresses, X T and X C are longitudinal tensile and compressive strengths, Y T and Y C are transverse tensile and compressive strength, and S 12 ,   S 13 ,   S 23 are longitudinal and transverse shear strengths, respectively.
When a certain element satisfies one or more criteria of the Hashin criterion, the laminate will be damaged, and the stiffness will change, accordingly. The Camaho [31] parametric degradation model assumes that the effect of the damage on material stiffness can be expressed by intermediate state variables, and the reduced material properties will be used to recalculate the local stiffness, a process which is similar to the actual failure process of materials. In this paper, the Camaho model was used to reduce the element stiffness, as shown in Table 3.

3.2. Interlaminar Damage Model

The CZM (Cohesive Zone Model) element can be used to describe the mechanical behavior of an interface. The bilinear CZM model is simple, effective and clear in terms of physical meaning, and is widely used for describing the delamination behavior of composite structures. At the same time, it has been found to be applicable to brittle materials [32]. In this paper, the bilinear CZM model was adopted to study the interlaminar mechanical characteristics of wind turbine blade spar caps.
In Griffith’s theory of fracture, cohesive elements can be used to simulate delamination growth. The energy release rate with respect to delamination growth is strongly dependent on fracture mode, and the criteria for delamination onset and delamination propagation must take the interaction between modes into consideration. Generally, three different fracture modes are assumed. Under uniaxial load, damage occurs only when the external load reaches the point strength in each direction on the contact surface. However, under a mixed-mode load, damage occurs before the point strength of each individual mode has been reached due to the interaction of contact forces in all directions on the contact surface. Therefore, it is necessary to comprehensively consider the interactions among all modes, and the quadratic nominal stress criterion is able to satisfy the requirements of the definition of this damage threshold [33], as shown in Equation (5).
( σ n N ) 2 + ( τ s S ) 2 + ( τ t T ) 2 = 1
where σ n , τ s , τ t represent the interfacial stress corresponding to type I, II and III delamination damage, respectively, and N , S , T are their corresponding sectional strength values. The symbol 〈〉 denotes the Macaulay bracket operator, defined as follows:
x = { x , x > 0 0 , x 0
When Equation (5) is satisfied, delamination damage begins to occur.
Delamination growth is dependent on the energy release rate, and the Benzeggagh–Kenane [34] (B-K) criterion is able to achieve the goal of describing the failure surfaces of different composites using the least number of parameters, taking into consideration the dependence of fracture energy on the mode mixture. At the same time, it is assumed that delamination can only propagate at the interface between two layers, and the interface is represented by cohesive elements. The critical strain energy release rate G C , calculated using the B-K criterion, is as follows:
G C = G I C + ( G II C G I C ) ( G II G I + G II ) η
where G I C , G II C are the critical strain energy release rates of modes I and II, respectively. η is the mixed-mode ratio index, which is dependent on the material properties. For glass epoxy resin composites, η = 2 3 . When G G C , delamination damage begins to propagate.

3.3. Finite Element Model

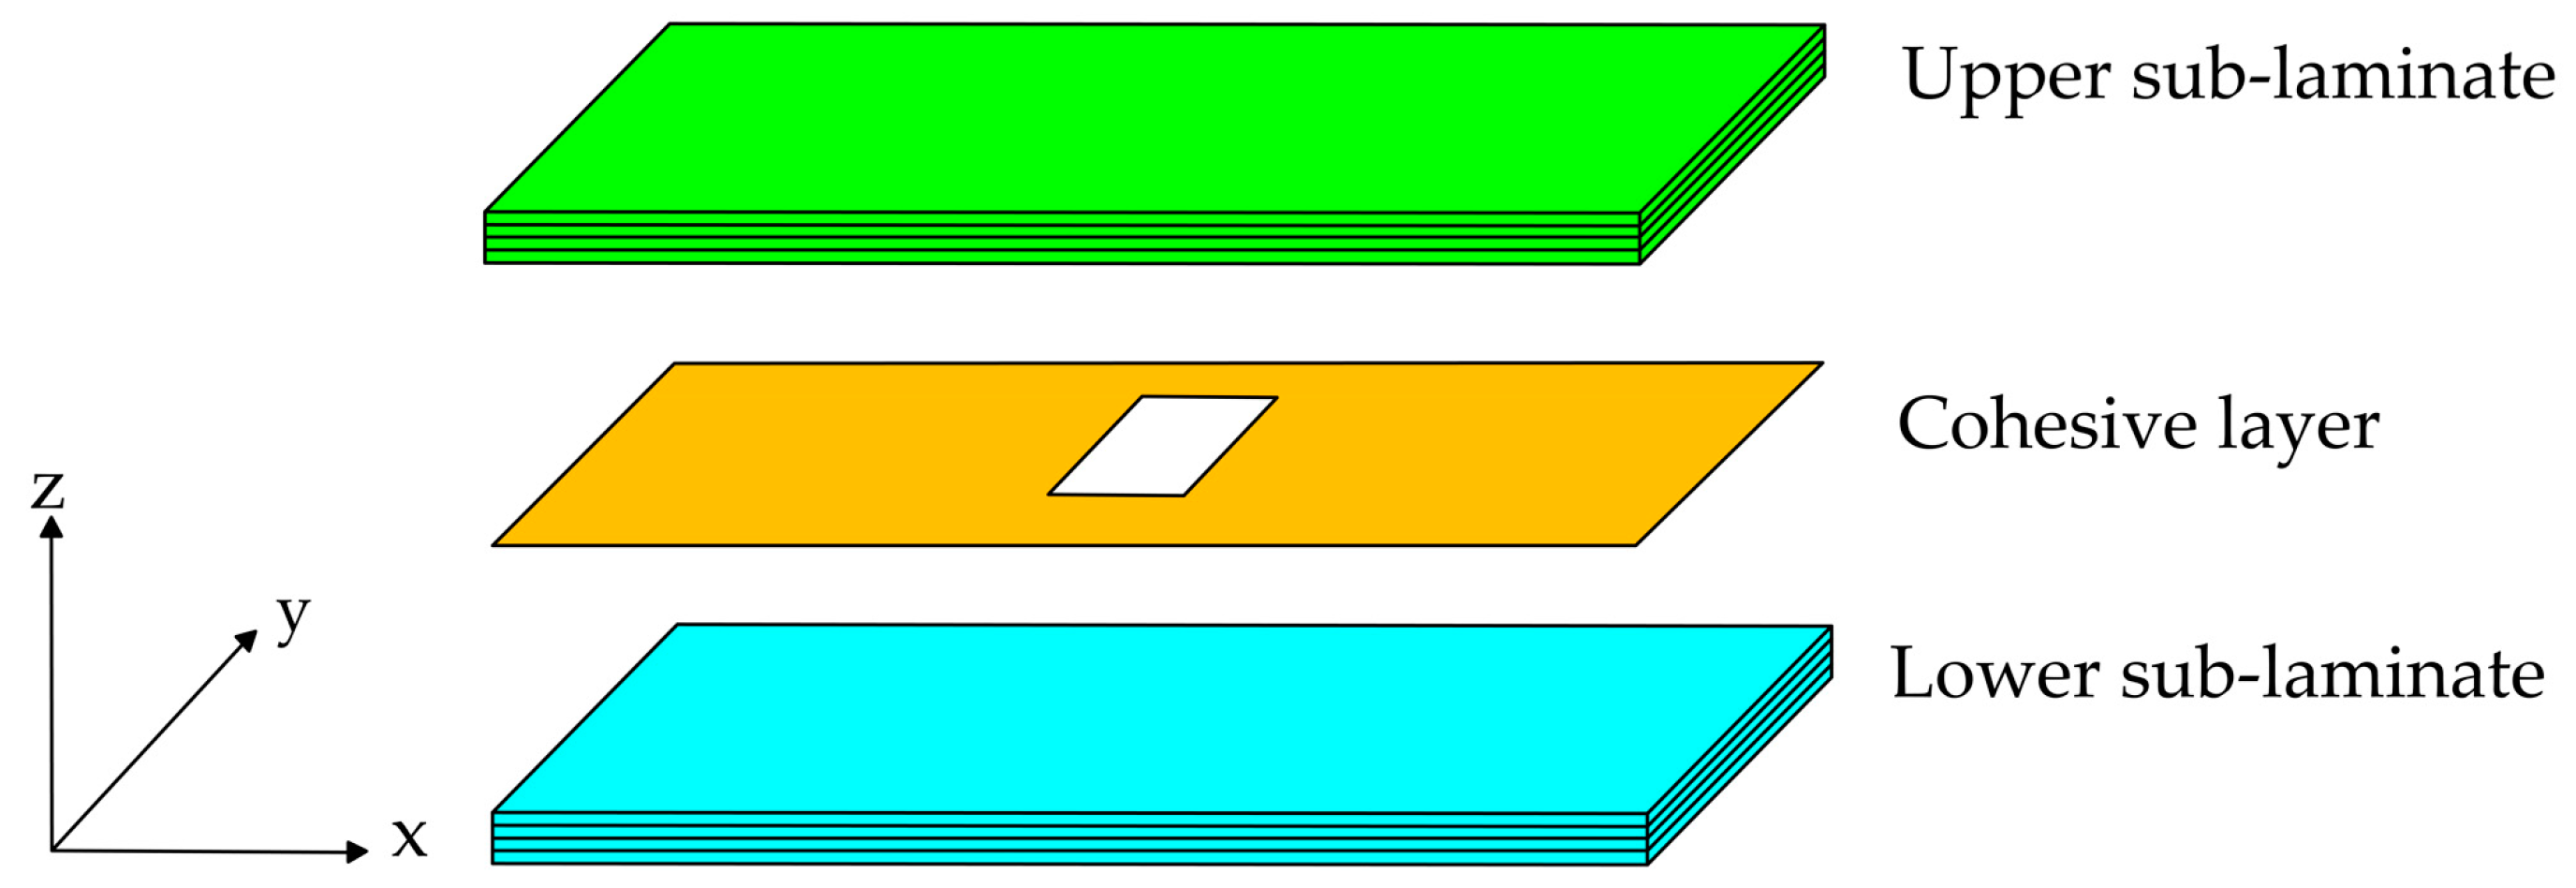
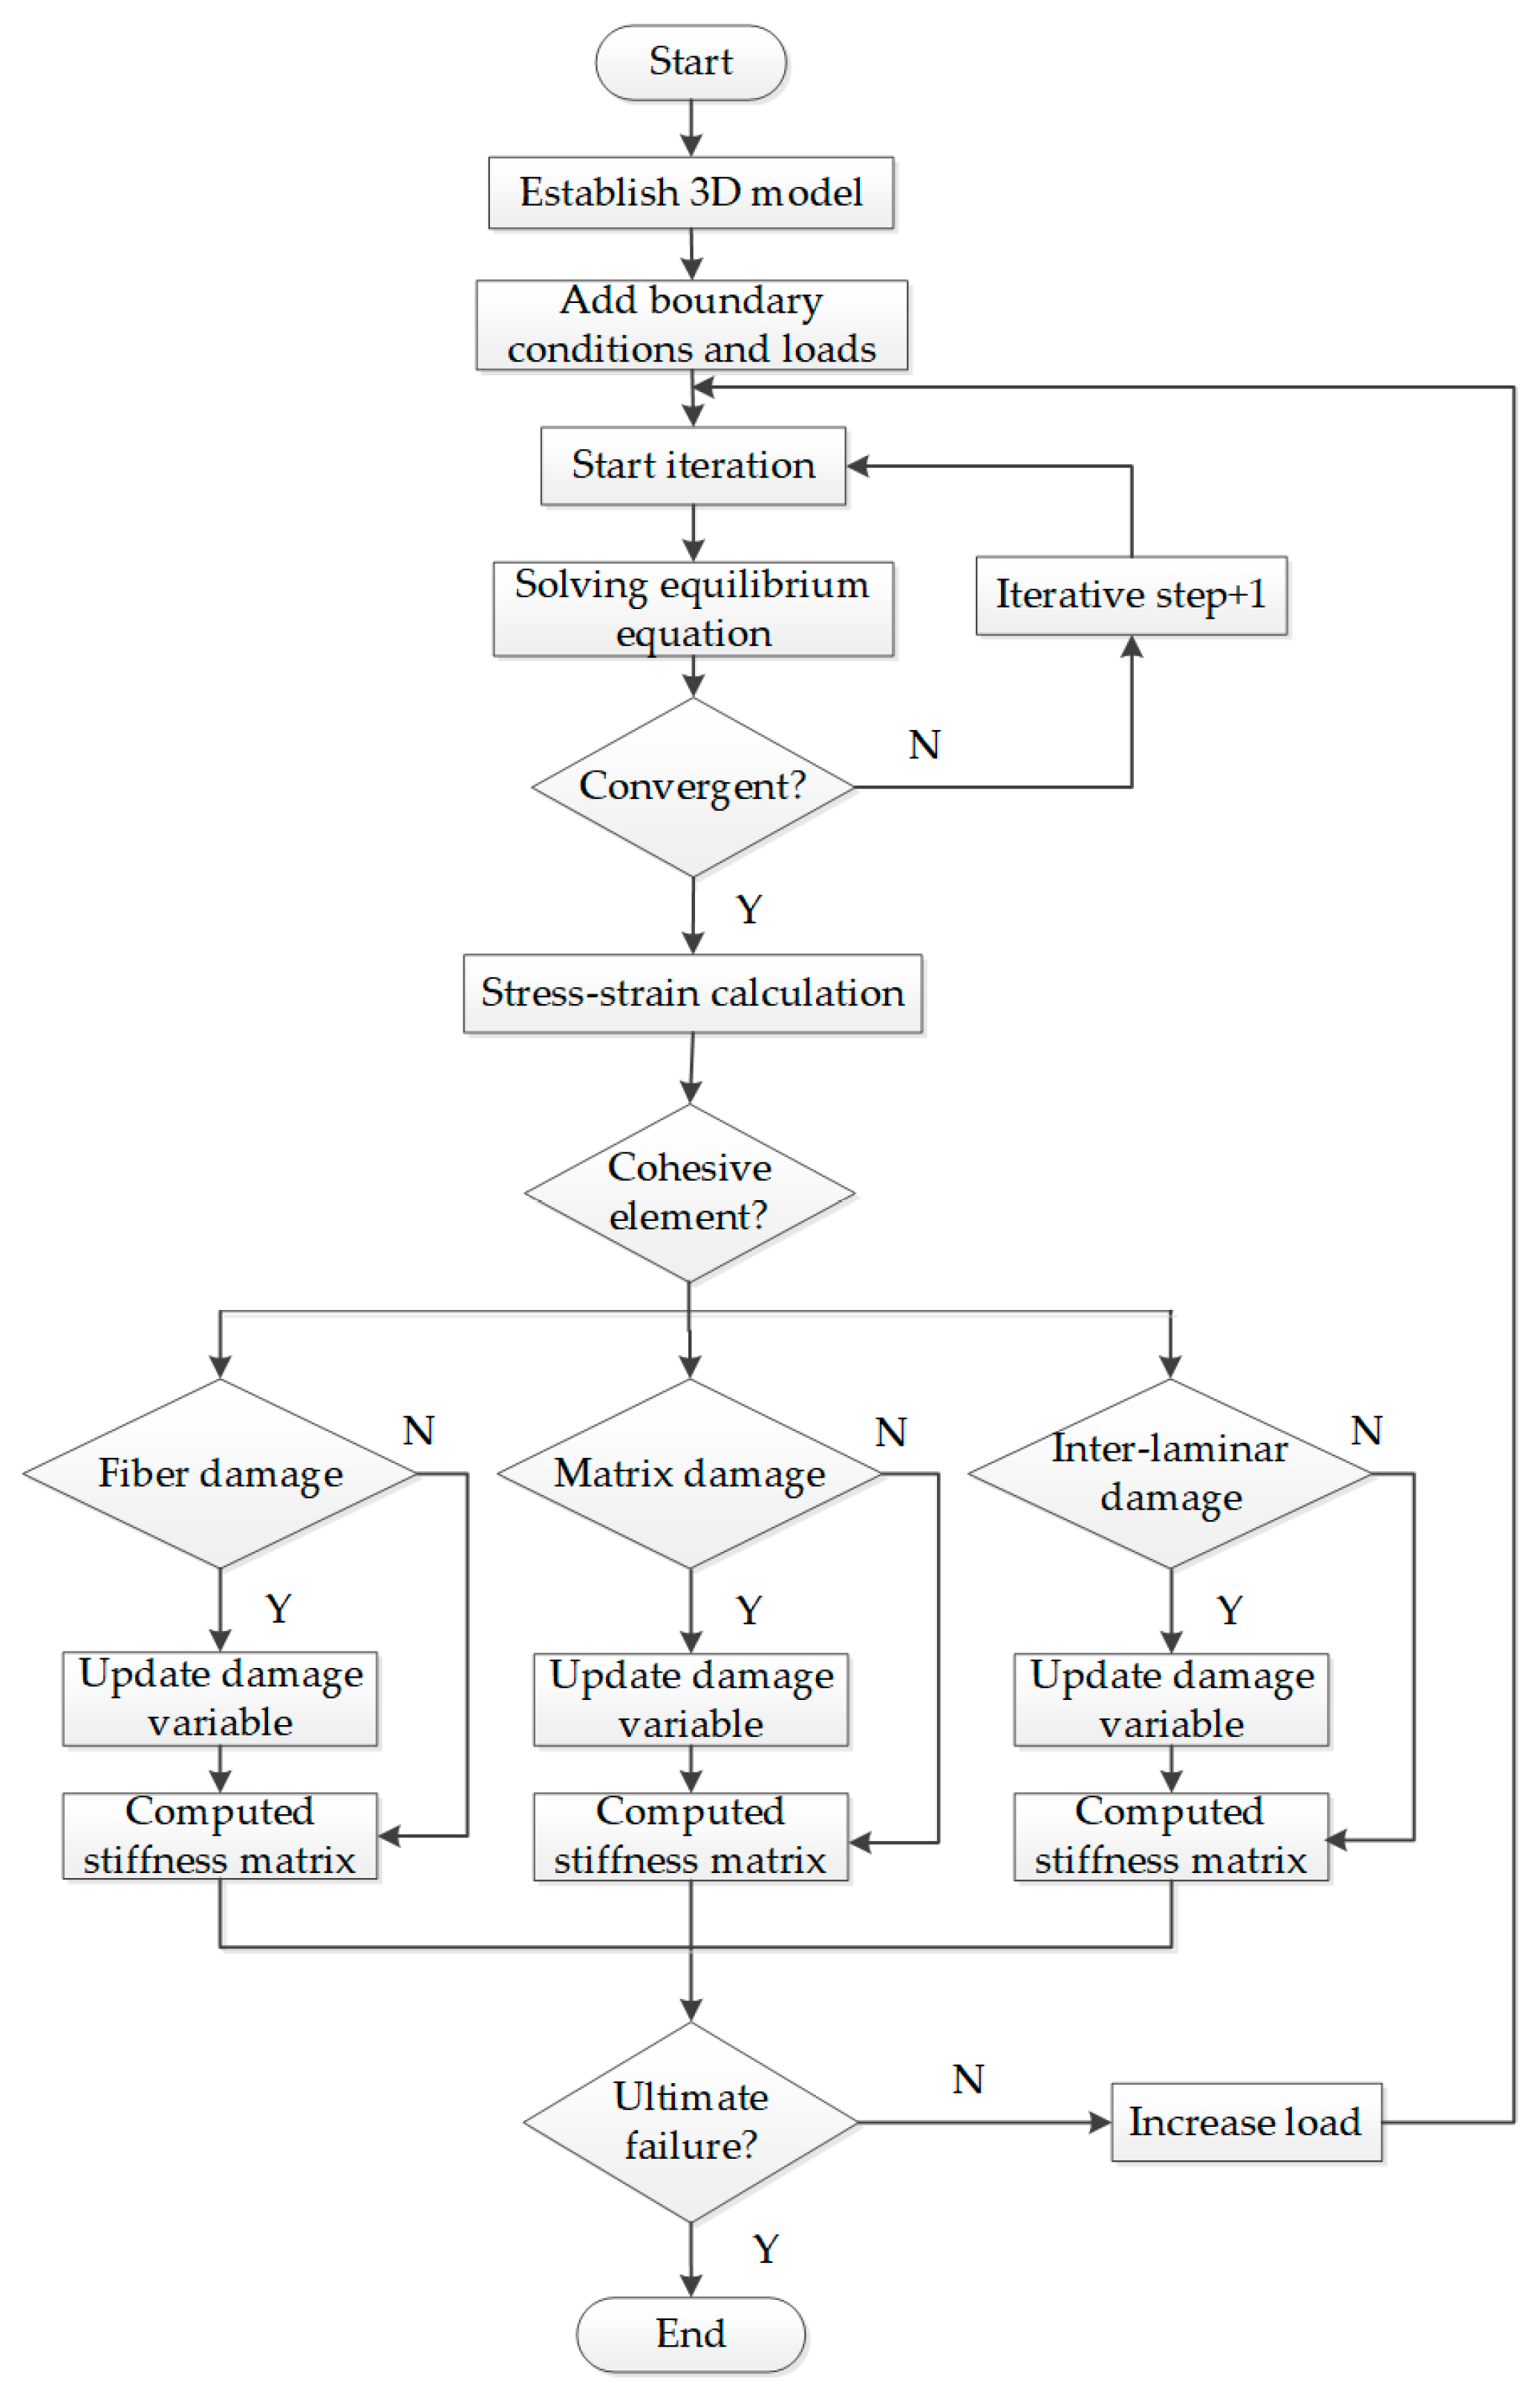
In this section, a finite element model with delamination damage is established (Figure 7). By using the ABAQUS/Explicit module, a VUMAT subroutine was written to introduce the 3D Hashin failure criterion and linear degradation criteria to analyze the unit damage evolution, and the delamination growth in the interfaces was analyzed in combination with the CZM model. A flow chart of the analytical process is presented in Figure 8.
The size of the model is consistent with that of the specimen in the test section above. The mechanical properties of the material are presented in Table 4. A C3D8R hexahedron reduced integral element was used to divide the mesh of the laminate, and the thickness of a single layer was taken as the element thickness. The interface layer used a COH3D8 zero-thickness cohesive element. Local mesh refinement was carried out for the growth area around the delamination. The finite element model of specimen A1 was selected as an example. A total of 62,000 solid elements and 2500 cohesive elements were used in the finite element model. The left end of the laminate was fixed, and the right end was subjected to tensile displacement load, as shown in Figure 9, the red area represents delamination, the yellow is delamination expansion area, and the blue area represents clamping area.

3.4. Modeling Results and Discussion

The tensile load–displacement curves of specimen A1 are shown in Figure 10. The ultimate load of the numerical simulation was 104.9 kN, and the test result was 108.93 kN, exhibiting a difference of 3.7%. The tensile displacement calculated by numerical simulation was 9.79 mm, demonstrating a difference of 8.4% with respect to the experimental result (10.69 mm). It can be seen that the errors were within the allowable range, and a good correlation could be observed between the numerical and experimental results, showing that the numerical model described in this paper possessed the ability to predict damage evolution.
Matrix tensile failure and interlaminar delamination damage were the main failure modes of the prefabricated laminates with delamination under tensile load. Figure 11 presents the final matrix tensile failure nephogram of the UD layer. It can be clearly seen that the matrix experienced complete failure, which is consistent with the complete separation of fibers into explosions observed in Figure 6a. The failure factor nephograms of the delamination damage propagation area at six load steps are extracted in Figure 12. With increasing load, the prefabricated delamination extends to the surrounding area, until complete failure of the damage propagation area occurs. At that time, the maximum loading capacity of the laminate had not been reached, and the tensile load continued to increase, with the fibers around the delamination area carrying part of the load and transferred stress, aggravating the fiber damage here. This is consistent with the interlaminar delamination and local fiber fracture damage forms presented in the local enlarged diagram in Figure 6b. Therefore, the failure process under tensile load of laminate subjected to initial delamination is complex, as a result of the interaction between multiple damage failure modes.
Table 5 presents a comparison between the ultimate loads of specimens A1–A4 obtained by means of the finite element models and those obtained from the test results. It can be seen that the simulation results were consistent with the test results, further proving the rationality of the cohesive element method and progressive failure analysis method used in this paper.

4. Simulation and Prediction of Blade Laminate with Delamination

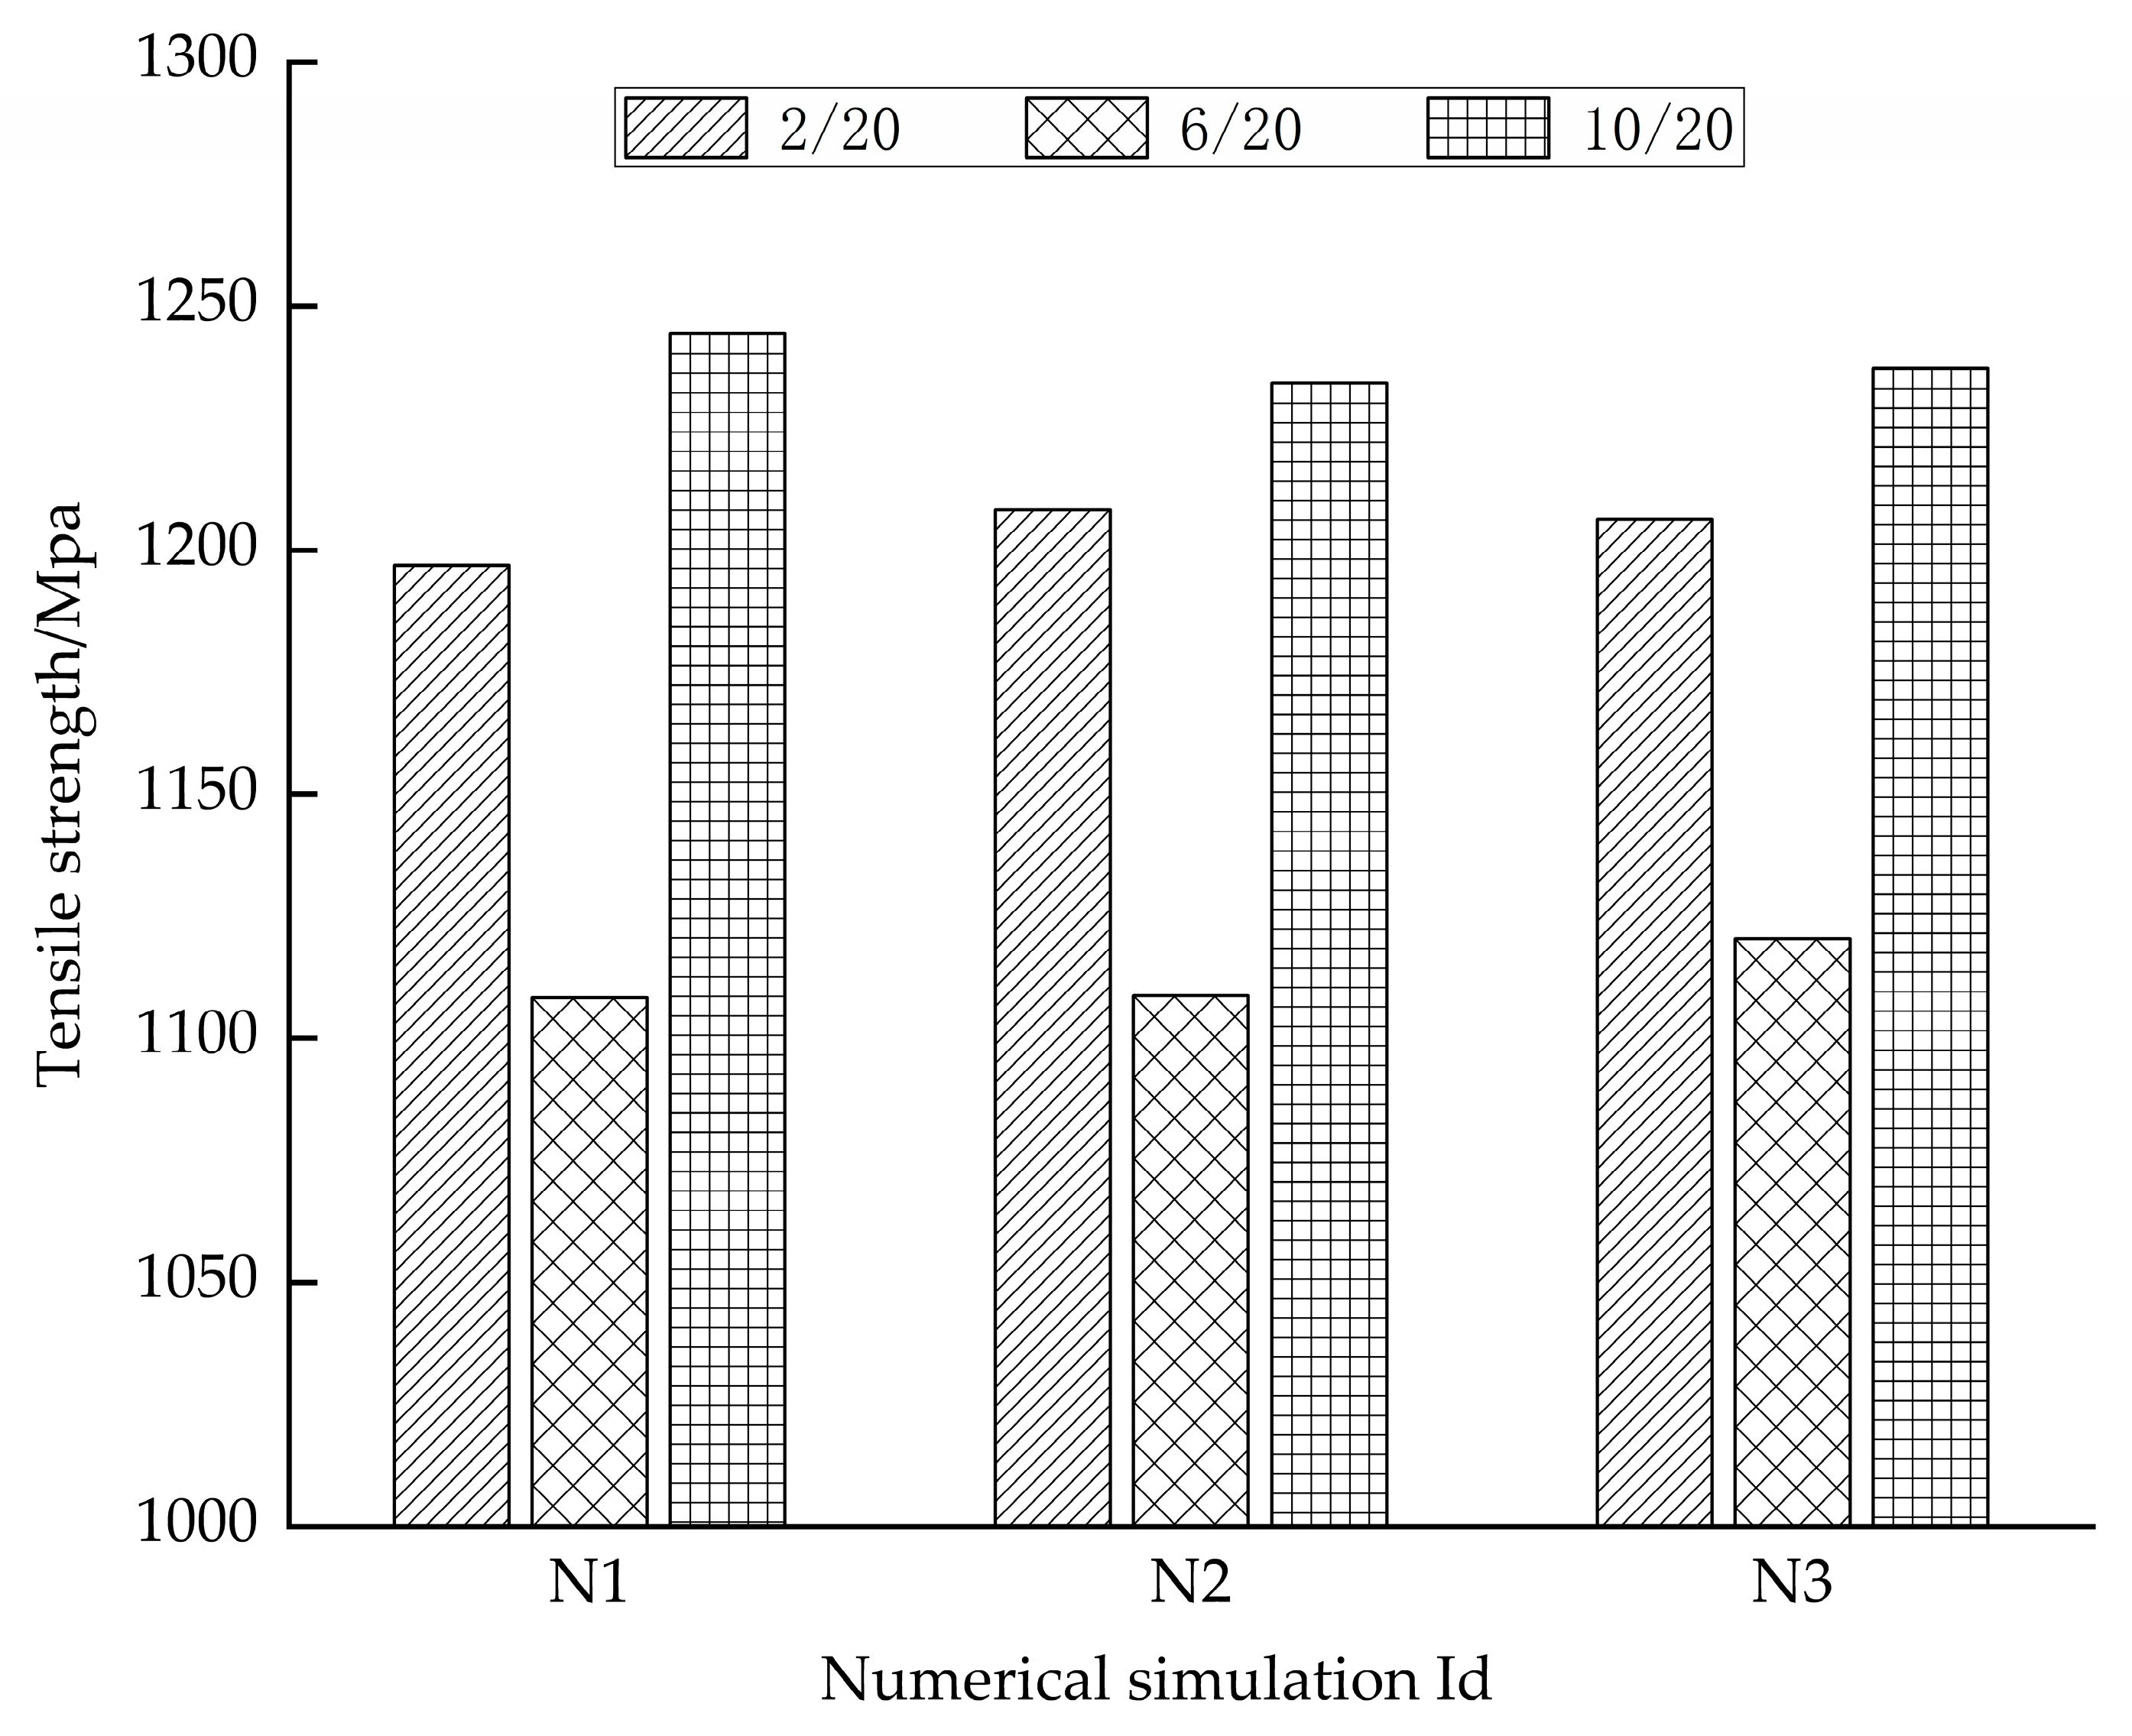
For the 40.3 m blade, the thickness of the 10–20 m section of the spar cap was 34 mm–38 mm. For the prediction component, the thickness of the spar cap was reduced to 1/2 of its original thickness, that is, 18 mm. The length and width were also reduced, and the length–width ratio was selected to be 5: 1. In combination with the verified numerical analysis model in the previous section, the size of the spar cap was determined to be equivalent to a finite element model with dimensions of 800 mm × 160 mm × 18 mm, and the stacking sequence was [0]20. The geometric configuration and mesh division of the model are shown in Figure 13 (the blue area represents the delamination, the green area represents the delamination extension in the partial enlargement), and the material parameters were the same as those described in Table 4. In order to study the influence of initial delamination on the tensile performance of the blade spar cap, the delamination was located in the center of the model, and the area and position of the initial delamination were varied in the thickness direction. Table 6 shows the initial delamination design and failure strength of the prediction model. N4 denotes the undamaged spar cap laminate, which possesses a tensile strength of 1243.57 Mpa. It was found that the failure strength of the laminates with delamination decreased to different degrees.

4.1. Influence of Delamination Size

By analyzing the data in Table 6, it was found that when delamination occurred at the same depth, as is the case for N1-2, N2-2 and N3-2, the tensile strengths were similar, even though the delamination areas were quite different, as shown in the histogram of the same line in Figure 14, which shows that differences in delamination area had little effect on residual tensile strength. Comparing the data obtained for N1, N2 and N3, it was found that the tensile strength exhibited the same trend. For delamination of the same size, with increasing depth, a trend of first decreasing and then increasing was observed, showing that delamination position has an influence on tensile strength.

4.2. Influence of Delamination Depth

As reported in the previous section, the delamination depth has an impact on tensile strength; therefore, in this section, a more detailed simulation of the influence of delamination depth is performed. Based on the N2 group, that is, with a delamination area of 80 mm × 80 mm, a simulation was performed starting from the first layer and progressing through to the tenth layer, which were then numbered according to the delamination depth, with the delamination on the first layer named N2-1. Because the [0]20 laminates were centrosymmetric, the simulation was run from the first layer to the tenth layer. Figure 15 shows the tensile strength at different depths when the delamination area was 80 mm × 80 mm. When the delamination was located in the first layer, the minimum residual tensile strength was obtained, which was 1058.74 Mpa, representing a decrease of 14.86%. When the delamination was located at a ratio of 0.3–0.4 in the thickness direction, that is, in the sixth–eighth layer, this was also a dangerous layer position. With increasing depth, the tensile strength increased. When the delamination position was 0.5, that is, in the middle layer, the load was 1234.21 Mpa, which was close to the strength of the undamaged laminate, which was 1243.57 Mpa. Figure 16 shows the load–displacement curves of a part of the N2 group simulation. Compared with the undamaged laminate N4, the ultimate load of the N2 group decreased to varying degrees.
In conclusion, for spar cap laminate structures with a large thickness, the most dangerous position of delamination was at the shallow surface and at the depth ratio h/H equals 0.3–0.4, and the delamination on the middle surface had no significant influence on tensile strength.

5. Conclusions

In order to solve the problem of there being insufficient research on the influence of delamination on the tensile properties of offshore blade spar cap laminates, specimens were prefabricated with initial delamination of different sizes and at different depths, and the influence of initial delamination on the tensile properties of blade spar caps was studied. An accurate three-dimensional numerical analysis model of blade spar cap laminate was established using a solid element and a cohesion element. The Hashin failure criterion was used as the intralaminar damage criterion, and the quadratic nominal stress criterion and the B-K failure criterion were used as interlaminar damage criteria. The results showed that:
  • On the basis of comparison with the experimental results, the three-dimensional solid numerical model and progressive failure criterion used in this paper were able to effectively simulate and predict the progressive intralaminar and interlaminar damage process of composite laminates under tensile load, and the structural damage behavior was more comprehensive and detailed. The load–displacement distribution trend of the numerical simulation was consistent with that of the tests, and the overall failure load deviation was less than 6%.
  • The main failure modes of laminates with initial delamination under tensile load were matrix tensile failure and interlaminar delamination damage. Initial delamination aggravated the stress transfer and caused the periphery to bear part of the load, leading to local fiber failure.
  • For initial delamination at the same depths, differences in delamination area had little influence on tensile strength. The most dangerous locations of delamination were at the shallow surface and at the ratio of 0.3–0.4 in the thickness direction, and the maximum decrease in tensile strength was 14.86%. The delamination at the middle surface had no significant effect on tensile strength.
Future research should consider the size effect of the blades, study the damage evolution law of the initial delamination at the component level and on full-sized blades, as well as the influence initial delamination on their mechanical properties.

Author Contributions

W.X., Conceptualization, Methodology, Software, Validation, Investigation, Formal Analysis, Data Curation, Writing—Original Draft Preparation; H.L. and B.Z., Conceptualization, Funding Acquisition, Writing—Review and Editing; X.L., Software, Visualization, Data Curation. All authors have read and agreed to the published version of the manuscript.

Funding

This research was funded by the National Natural Science Foundation of China under grant No. 52175105 and the Basic Scientific Research Project of Liaoning Province under grant No. LJKMZ20220486.

Data Availability Statement

The data of this paper are proposed for the first time and could be shared.

Acknowledgments

The authors would like to thank Zhang Xueyan of Shenyang University of Technology for providing infrared thermal images and on-site inspection pictures, Yang Qingfa of Luoyang Sunrui Wind Turbine Blade Co., Ltd. for providing specimens and professional opinions on test inquiry, and Jie Xu of Jiangsu Aosheng Composite Materials Hi-Tech Co., Ltd. for testing specimens.

Conflicts of Interest

The authors declare no conflict of interest.

References

  1. Sun, X.; Huang, D.; Wu, G. The current state of offshore wind energy technology development. Energy 2012, 41, 298–312. [Google Scholar] [CrossRef]
  2. Ren, Z.; Verma, A.S.; Li, Y.; Teuwen, J.J.; Jiang, Z. Offshore wind turbine operations and maintenance: A state-of-the-art review. Renew. Sustain. Energy Rev. 2021, 144, 110886. [Google Scholar] [CrossRef]
  3. Chen, C.-H.; Su, N.-J. Global Trends and Characteristics of Offshore Wind Farm Research over the Past Three Decades: A Bibliometric Analysis. J. Mar. Sci. Eng. 2022, 10, 1339. [Google Scholar] [CrossRef]
  4. Mishnaevsky, L.; Branner, K.; Petersen, N.H.; Justine Beauson, J.; McGugan, M.; Sørensen, B.F. Materials for Wind Turbine Blades: An Overview. Materials 2017, 10, 1285. [Google Scholar] [CrossRef] [PubMed]
  5. Zhang, X.Y.; Zhou, B.; Li, H.; Xin, W. Depth detection of spar cap defects in large-scale wind turbine blades based on a 3D heat conduction model using step heating infrared thermography. Meas. Sci. Technol. 2022, 33, 055008. [Google Scholar] [CrossRef]
  6. Nelson, J.W.; Cairns, D.S.; Riddle, T.W. Manufacturing defects common to composite wind turbine blades: Effects of defects. In Proceedings of the 52nd AIAA/ASME/ASCE/AHS/ASC Structures, Structural Dynamics and Materials Conference, Denver, CO, USA, 4–7 April 2011. [Google Scholar] [CrossRef]
  7. Shohag, M.A.; Hamme, E.C.; Olawale, D.O.; Okoli, O. Damage mitigation techniques in wind turbine blades: A review. Wind Eng. 2017, 41, 185–210. [Google Scholar] [CrossRef]
  8. Yang, G.S. Damage Mechanics and Damage of Composite Materials; National Defense Industry Press: Beijing, China, 1995. (In Chinese) [Google Scholar]
  9. Ciang, C.C.; Lee, J.-R.; Bang, H.-J. Structural health monitoring for a wind turbine system: A review of damage detection methods. Meas. Sci. Technol. 2008, 19, 122001. Available online: https://iopscience.iop.org/article/10.1088/0957-0233/19/12/122001 (accessed on 13 October 2008). [CrossRef]
  10. Branner, K.; Ghadirian, A. Database about Blade Faults; DTU Wind Energy E, No. 0067; DTU Wind Energy: Roskilde, Denmark, 2014; Available online: https://backend.orbit.dtu.dk/ws/portalfiles/portal/118222161/Database_about_blade_faults.pdf (accessed on 1 December 2014).
  11. Chen, X.; Zhao, W.; Zhao, X.L.; Xu, J.Z. Preliminary failure investigation of a 52.3 m glass/epoxy composite wind turbine blade. Eng. Fail. Anal. 2014, 44, 345–350. [Google Scholar] [CrossRef]
  12. Overgaard, L.C.T.; Lund, E.; Thomsen, O.T. Structural collapse of a wind turbine blade. Part A: Static test and equivalent single layered models. Compos. Part A 2010, 41, 257–270. [Google Scholar] [CrossRef]
  13. Haselbach, P.U.; Bitsche, R.D.; Branner, K. The effect of delaminations on local buckling in wind turbine blades. Renew. Energy 2016, 85, 295–305. [Google Scholar] [CrossRef]
  14. Li, J.; Wang, J.; Zhang, L.; Huang, X.; Yu, Y. Study on the Effect of Different Delamination Defects on Buckling Behavior of Spar Cap in Wind Turbine Blade. Adv. Mater. Sci. Eng. 2020, 2020, 6979636. [Google Scholar] [CrossRef]
  15. Fu, H.M.; Zhang, Y.B. On the distribution of delamination in composite structures and compressive strength prediction for laminates with embedded delaminations. Appl. Compos. Mater. 2011, 18, 253–269. [Google Scholar] [CrossRef]
  16. Amaro, A.M.; Reis, P.N.B.; de Moura, M.F.S.F. Delamination effect on bending behaviour in carbon–epoxy composites. Strain 2011, 47, 203–208. [Google Scholar] [CrossRef]
  17. Zhe, L.A.; Pl, B.; Ns, C. Effect of delamination on the flexural response of [+45/45/0]2s carbon fibre reinforced polymer laminates. Compos. Struct. 2019, 209, 93–102. [Google Scholar] [CrossRef]
  18. Barenblatt, G.I. The mathematical theory of equilibrium cracks in brittle fracture. Adv. Appl. Mech. 1962, 7, 55–129. [Google Scholar] [CrossRef]
  19. Overgaard, L.C.T.; Lund, E. Structural collapse of a wind turbine blade. Part B Progressive interlaminar failure models. Composites Part A Appl. Sci. Manuf. 2010, 41, 271–283. [Google Scholar] [CrossRef]
  20. Mandell, J.F.; Cairns, D.S.; Samborsky, D.D.; Morehead, R.B.; Haugen, D.J. Prediction of Delamination in Wind Turbine Blade Structural Details. J. Sol. Energy Eng. Trans. ASME 2003, 125, 522–530. [Google Scholar] [CrossRef]
  21. Ye, Q.; Chen, P.H. Prediction of the cohesive strength for numerically simulating composite delamination via CZM-based FEM. Compos. Part B-Eng. 2011, 42, 1076–1083. [Google Scholar] [CrossRef]
  22. Nelson, J.-W.; Riddle, T.W.; Cairns, D.-S. Effects of defects in composite wind turbine blades—Part 2: Progressive damage modeling of fiberglass-reinforced epoxy composites with manufacturing-induced waves. Wind Energ. Sci. 2017, 2, 653–669. [Google Scholar] [CrossRef]
  23. Zhao, L.B.; Gong, Y.; Zhang, J.Y. A survey on delamination growth behavior in fiber reinforced composite laminates. Acta Aeronaut. Astronaut. Sin. 2019, 40, 171–199. Available online: https://hkxb.buaa.edu.cn/EN/10.7527/S1000-6893.2018.22509 (accessed on 13 October 2018).
  24. Sleight, D.W. Progressive Failure Analysis Methodology for Composite Laminated Structural. NASA/TP-1999-209107, 1 March 1999. Available online: http://ntrs.nasa.gov/citations/19990052628 (accessed on 6 September 2013).
  25. Santos, F.; Teixeira, A.; Guedes Soares, C. Assessing progressive failure in long wind turbine blades under quasi-static and cyclic loads. Renew. Energy 2018, 219, 754–766. [Google Scholar] [CrossRef]
  26. Verma, A.S.; Vedvik, N.P.; Haselbach, P.U.; Gao, Z.; Jiang, Z. Comparison of numerical modelling techniques for impact investigation on a wind turbine blade. Compos. Struct. 2019, 209, 856–878. [Google Scholar] [CrossRef]
  27. Yang, R.; He, Y.; Mandelis, A.; Wang, N.; Wu, X.; Huang, S. Induction infrared thermography and thermal-wave-radar analysis for imaging inspection and diagnosis of blade composites. IEEE Trans. Ind. Inform. 2018, 14, 5637–5647. [Google Scholar] [CrossRef]
  28. Manohar, A.; Lanza di Scalea, F. Detection of defects in wind turbine composite blades using statistically enhanced Lock-In Thermography. Struct. Health Monit. 2013, 12, 566–574. [Google Scholar] [CrossRef]
  29. Det Norske Veritas. DNVGL-ST-0376. Rotor Blades for Wind Turbines. 2015. Available online: https://rules.dnvgl.com/docs/pdf/DNVGL/ST/2015-12/DNVGL-ST-0376.pdf (accessed on 1 December 2015).
  30. Hashin, Z. Failure Criteria for Unidirectional Fiber Composites. J. Appl. Mech. 1980, 47, 329–334. [Google Scholar] [CrossRef]
  31. Camanho, P.P.; Matthews, F.L. A progressive damage model for mechanically fastened joints in composite laminates. J. Compos. Mater. 1999, 24, 2248–2280. [Google Scholar] [CrossRef]
  32. Richefeu, V.; Chrysochoos, A.; Huon, V.; Monerie, Y.; Peyroux, R.; Wattrisse, B. Toward local identification of cohesive zone models using digital image correlation. Eur. J. Mech. A Solids 2012, 34, 38–51. [Google Scholar] [CrossRef]
  33. Shokrieh, M.; Zeinedini, A.; Ghoreishi, S. On the mixed mode I/II delamination R-curve of E-glass/epoxy laminated composites. Compos. Struct. 2017, 171, 19–31. [Google Scholar] [CrossRef]
  34. Camanho, P.P.; Dávila, C.G. Mixed-Mode Decohesion Finite Elements for the Simulation of Delamination in Composite Materials; NASA: Washington, DC, USA, 2002. [Google Scholar]
Figure 1. Structure distribution of the 40.3 m blade: (a) spar cap layup thickness and design safety factor; (b) ultimate flapwise moment and output efficiency of the cross-section.
Energies 16 03607 g001
Figure 2. Infrared thermal image detection of in-service blade spar cap.
Energies 16 03607 g002
Figure 3. Delamination damage experienced by in-service blade spar cap: (a) location of detected delamination damage in the blade spar cap; (b) infrared thermal image at R10; (c) infrared thermal image at R14; (d) infrared thermal image at R16; (e) optical image after polishing at R10; (f) optical image after polishing at R14; (g) optical image after polishing at R16; (h) schematic diagram of R10; (i) schematic diagram of R14; (j) schematic diagram of R16.
Energies 16 03607 g003
Figure 4. Schematic diagram of specimens with delamination.
Energies 16 03607 g004
Figure 5. Tensile test: (a) test system; (b) Partial A1–A4 specimens.
Energies 16 03607 g005
Figure 6. Specimen failure morphologies. (a) A1 specimen failure front view; (b) A1 specimen failure side view; (c) A2 specimen failure front view; (d) A2 specimen failure side view; (e) A3 specimen failure front view; (f) A3 specimen failure side view; (g) A4 specimen failure front view; (h) A4 specimen failure side view.
Energies 16 03607 g006
Figure 7. Schematic diagram of the delamination damage structure model.
Energies 16 03607 g007
Figure 8. Flow chart of the finite element analysis.
Energies 16 03607 g008
Figure 9. Meshing and boundary conditions of the model.
Energies 16 03607 g009
Figure 10. Load–displacement curve of specimen A1 on the basis of test and simulation results.
Energies 16 03607 g010
Figure 11. Matrix tensile failure nephogram.
Energies 16 03607 g011
Figure 12. Evolution process of prefabricated delamination damage propagation region: (a) F = 0 kN; (b) F = 1.2 kN; (c) F = 12 kN; (d) F = 25.8 kN; (e) F = 45.7 kN; (f) F = 98 kN.
Energies 16 03607 g012
Figure 13. The geometric configuration and mesh division of the model: (a) geometric distribution of the model; (b) local meshing of the model.
Energies 16 03607 g013
Figure 14. Tensile strength of the predicted model.
Energies 16 03607 g014
Figure 15. Influence of delamination depth on residual strength.
Energies 16 03607 g015
Figure 16. Comparison between the partial prediction results of the N2 group and the N4 group.
Energies 16 03607 g016
Table 1. Design of specimens with delamination.
Marked IDDelamination Area (mm)Delamination Position
h/H
Number of Specimens
A110 × 101/45
A215 × 151/45
A315 × 151/25
A4NoneNone5
Table 2. Static tensile test results of specimens.
Marked IDTensile Load (Kn)Tensile Strength
(Mpa)
Thick-Ness
(mm)
Width
(mm)
Mean Tensile Load (kN)Dispersion Coefficient (%)Effective Sample QuantityTensile Load Loss Rate (%)
A1-1107.69212733.38025.037108.930.8542.74
A1-2108.8312923.32725.310
A1-3109.11512853.35025.357
A1-4110.07413033.35325.200
A2-1102.98912023.39025.280107.110.3254.79
A2-2101.82211813.39025.423
A2-3108.38412813.38724.987
A2-4110.26812783.39725.400
A2-5112.10212933.43325.257
A3-192.90311633.40323.46799.40.74511.25
A3-299.81911663.35025.550
A3-3101.25311513.45025.500
A3-4101.26111723.44325.090
A3-5101.84811763.43325.223
A4-1110.83412903.40725.2271121.5350
A4-2111.27812693.43325.553
A4-3112.16613083.38725.327
A4-4111.52312993.37025.477
A4-5114.19813293.40325.247
Table 3. Degradation modes of material properties.
Failure ModeRules for Reduction of Materials
Fiber tensile E 11 = 0.07 E 11
Fiber compression E 11 = 0.14 E 11
Matrix tensile E 22 = 0.2 E 22 , G 12 = 0.2 G 12 , G 23 = 0.2 G 23
Matrix compression E 22 = 0.4 E 22 , G 12 = 0.4 G 12 , G 23 = 0.4 G 23
Table 4. Material properties of the laminate. Young’s modulus ( E ), shear modulus ( G ), Poisson’s ratio ( μ ), fiber longitudinal strength ( X ), fiber transverse direction strength ( Y ), fiber shear strength ( S ), critical energy release rate ( G C ), interlaminar normal strength ( N ), interlaminar shear strength ( T ), mixed-mode exponent ( η ).
Ply PropertiesInterface Properties [23]
E 11 48.8 GPa G I C 0.368 kJ/m2
E 22 = E 33 13.6 GPa G I I C 0.702 kJ/m2
G 12 = G 13
G 23
4.33 Gpa
4.5 Gpa
N
S
20.02 MPa
28.73 MPa
μ 12 = μ 13
μ 23
0.26
0.3
T
η
28.73 MPa
2
X T 1207 MPa
X C 918.3 MPa
Y T 46.6 MPa
Y C 154.1 MPa
S 12   =   S 13   =   S 23 66.5 MPa
Table 5. Comparison between test results and simulation results.
Marked IDDelamination Area (mm)Delamination Position h/HMean Ultimate Tensile Load (kN)Simulated Limit Load (kN)Error Rate (%)
A110 × 101/4108.93104.9−3.7
A215 × 151/4107.11101.3−5.42
A315 × 151/299.497.9−1.5
A4NoneNone112108.2−3.39
Table 6. Initial delamination design and failure strength.
GroupMarked IDDelamination Area (mm)Delamination Position h/HTensile Strength (Mpa)Tensile Strength Loss Rate (%)
N1N1-2 2/201196.93.75
N1-640 × 406/201108.3610.87
N1-10 10/201244.34−0.06
N2N2-2 2/201208.37 2.83
N2-680 × 806/201108.74 10.84
N2-10 10/201234.21 0.75
N3N3-2 2/201206.37 2.99
N3-6100 × 1006/201120.4 9.90
N3-10 10/201237.3 0.50
N4N4NoneNone1243.57 0
Disclaimer/Publisher’s Note: The statements, opinions and data contained in all publications are solely those of the individual author(s) and contributor(s) and not of MDPI and/or the editor(s). MDPI and/or the editor(s) disclaim responsibility for any injury to people or property resulting from any ideas, methods, instructions or products referred to in the content.