
Free Cooling for Saving Energy: Technical Market Analysis of Dry, Wet, and Hybrid Cooling Based on Manufacturer Data

Abstract
:1. Introduction
1.1. Previous Research
1.2. Study’s Objective
2. Materials and Methods
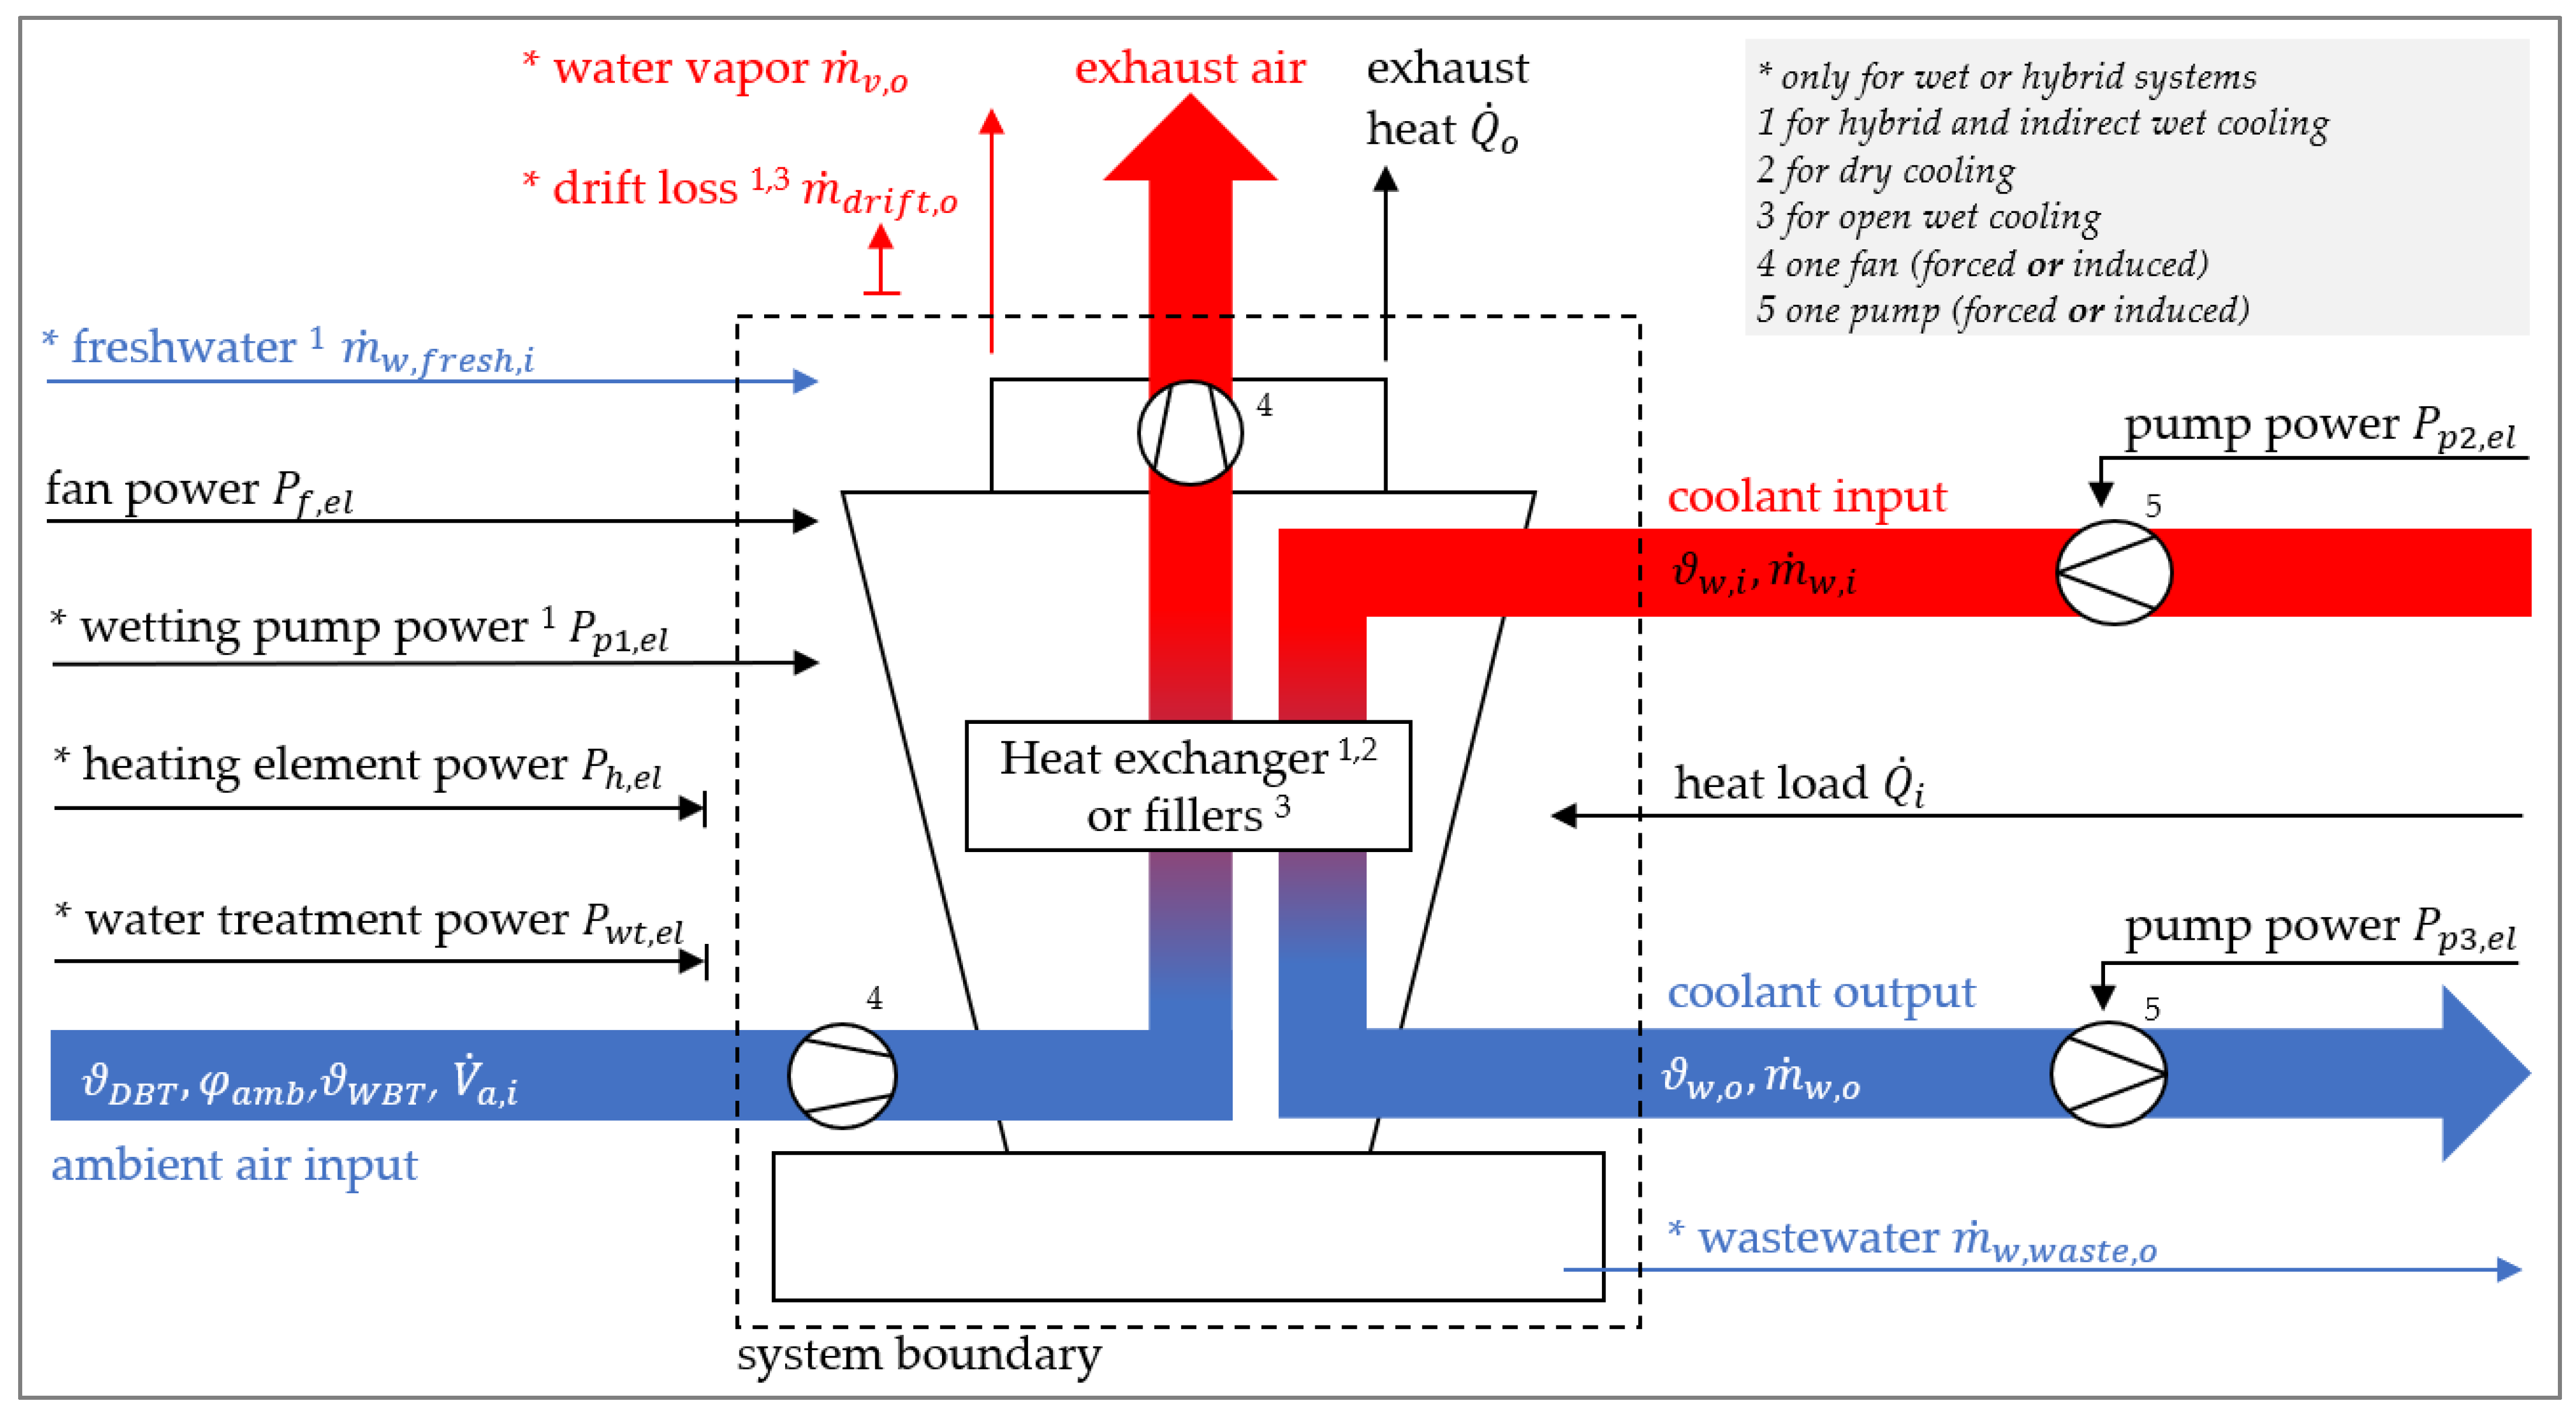
2.1. System Definition
- dry cooling towers,
- wet cooling towers with open circuit (direct),
- wet cooling towers with closed circuit (indirect),
- directly wetted hybrid cooling towers,
- sprayed hybrid cooling towers, and
- hybrid cooling towers with wetting-mats.
2.2. Data Acquisition
adry = ϑw,o − ϑDBT.
2.3. Statistical Evaluation
3. Results
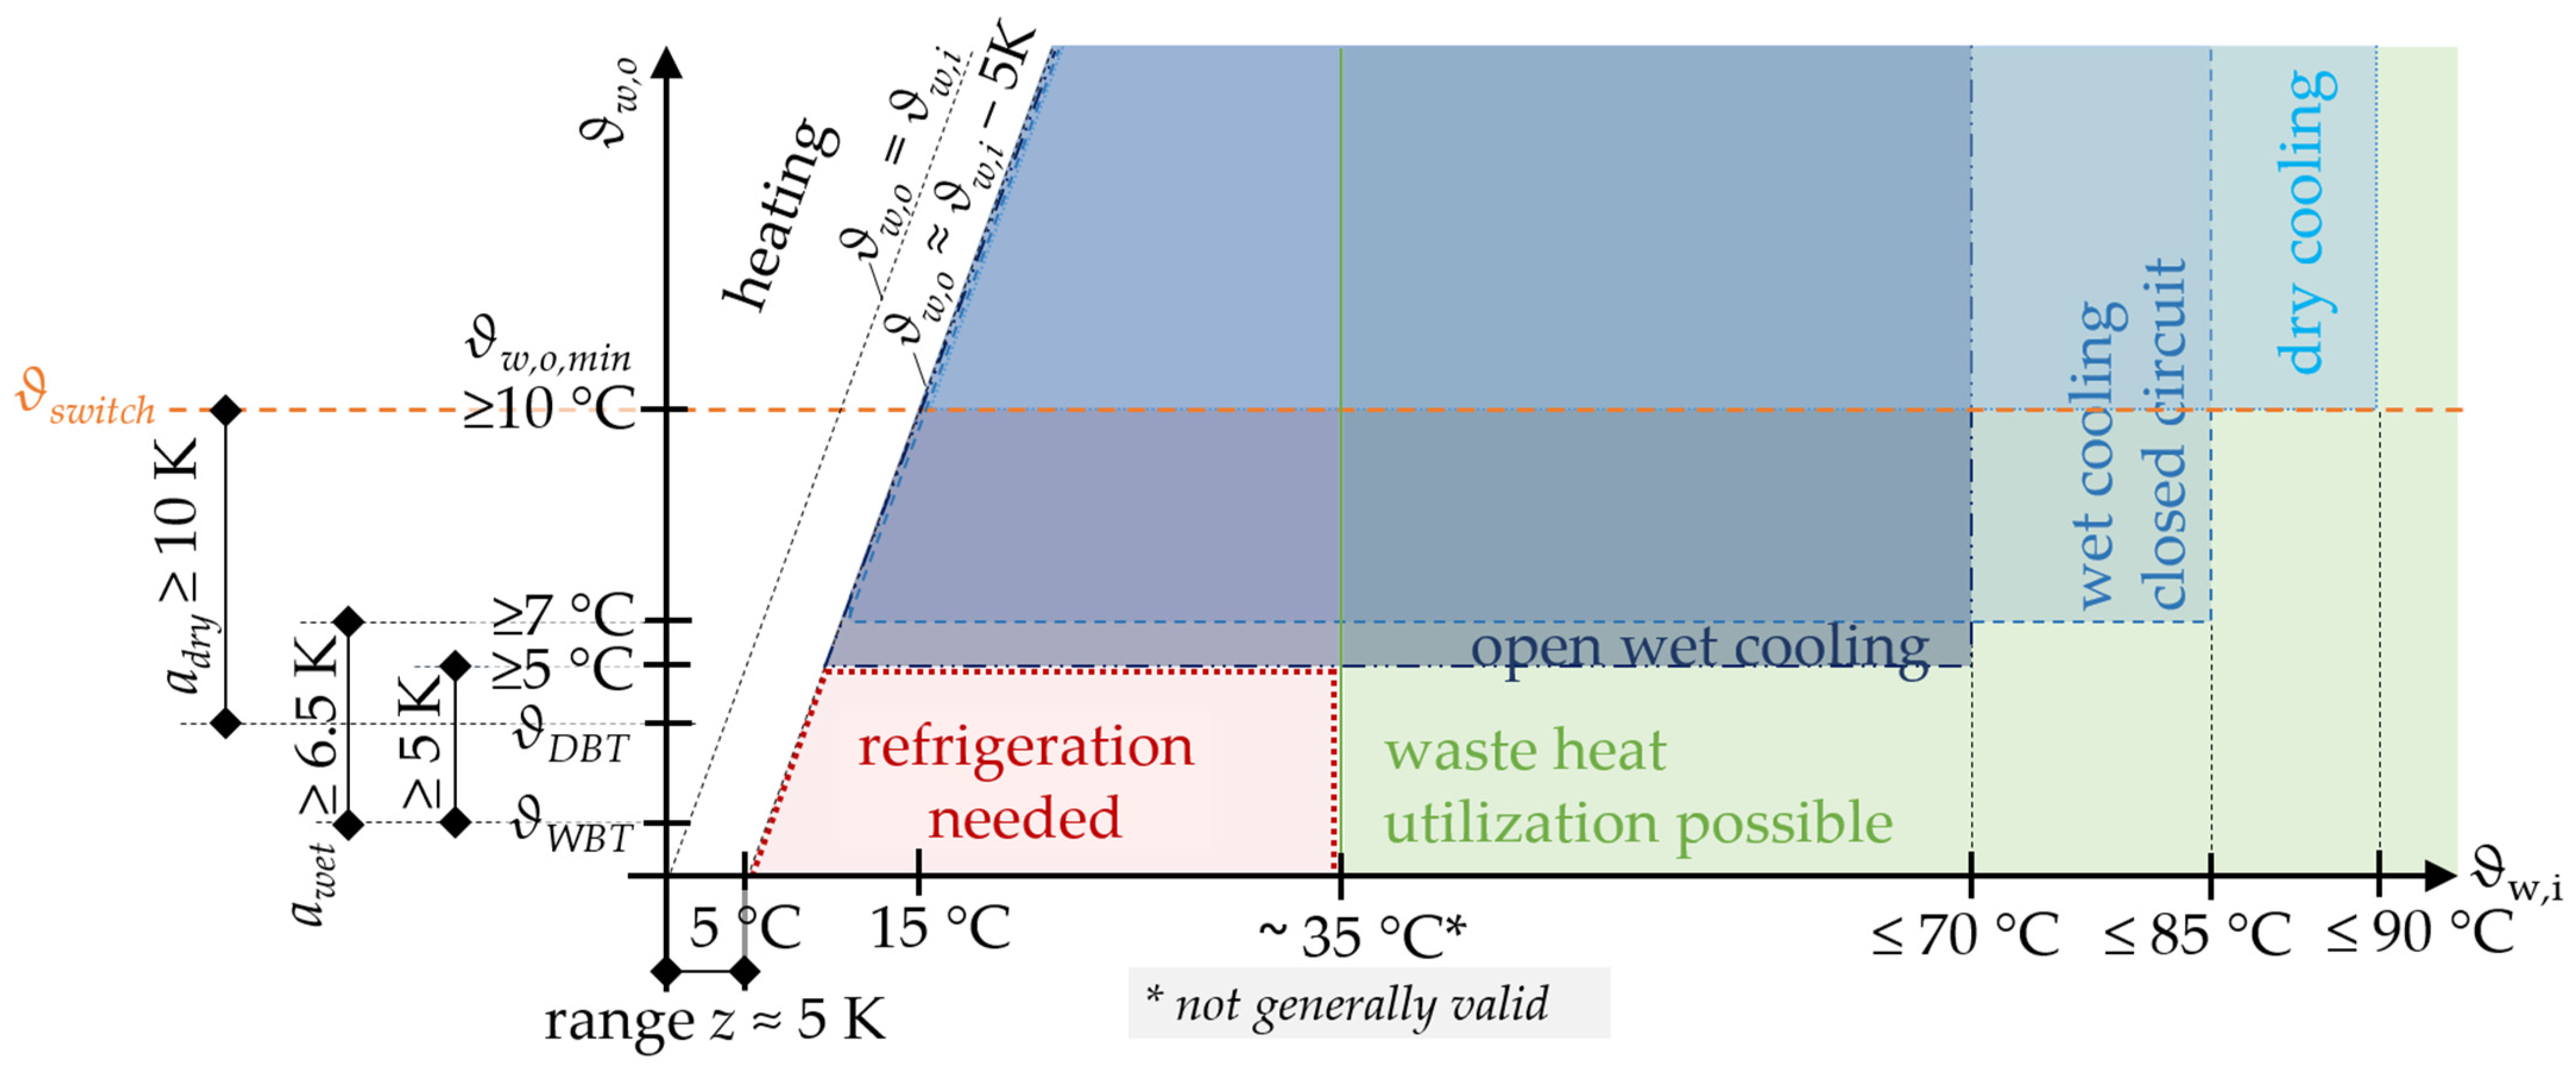
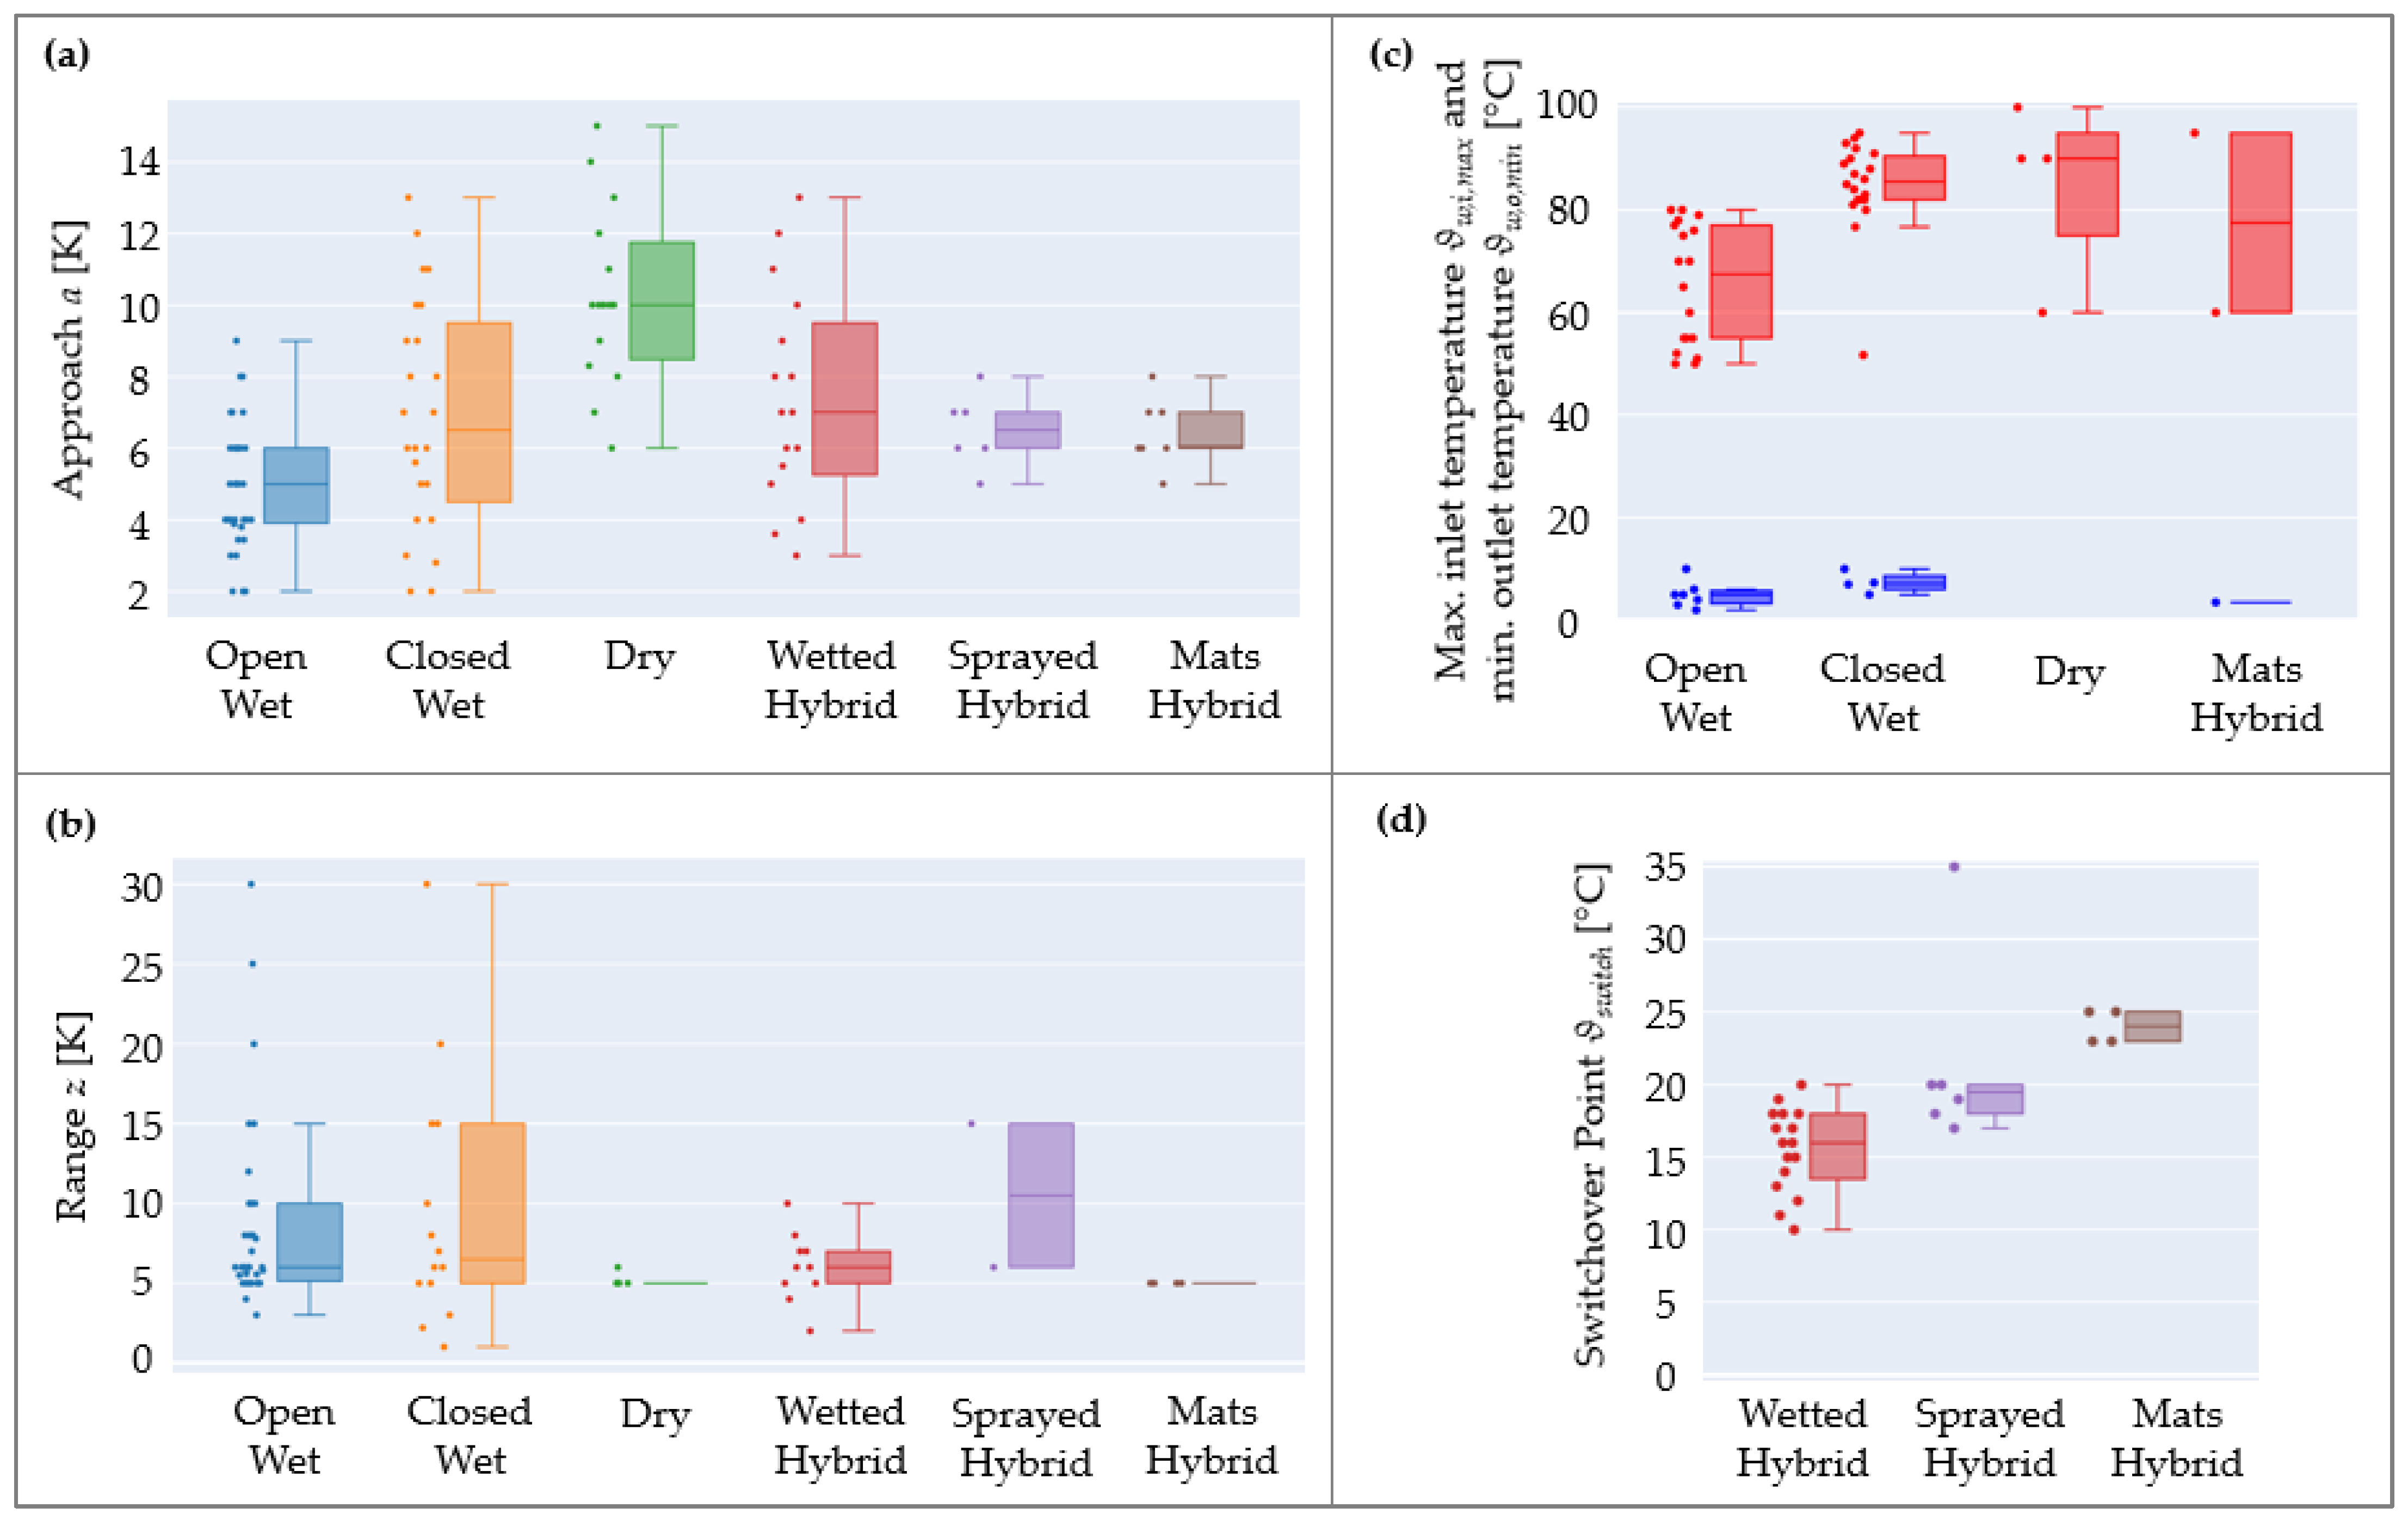
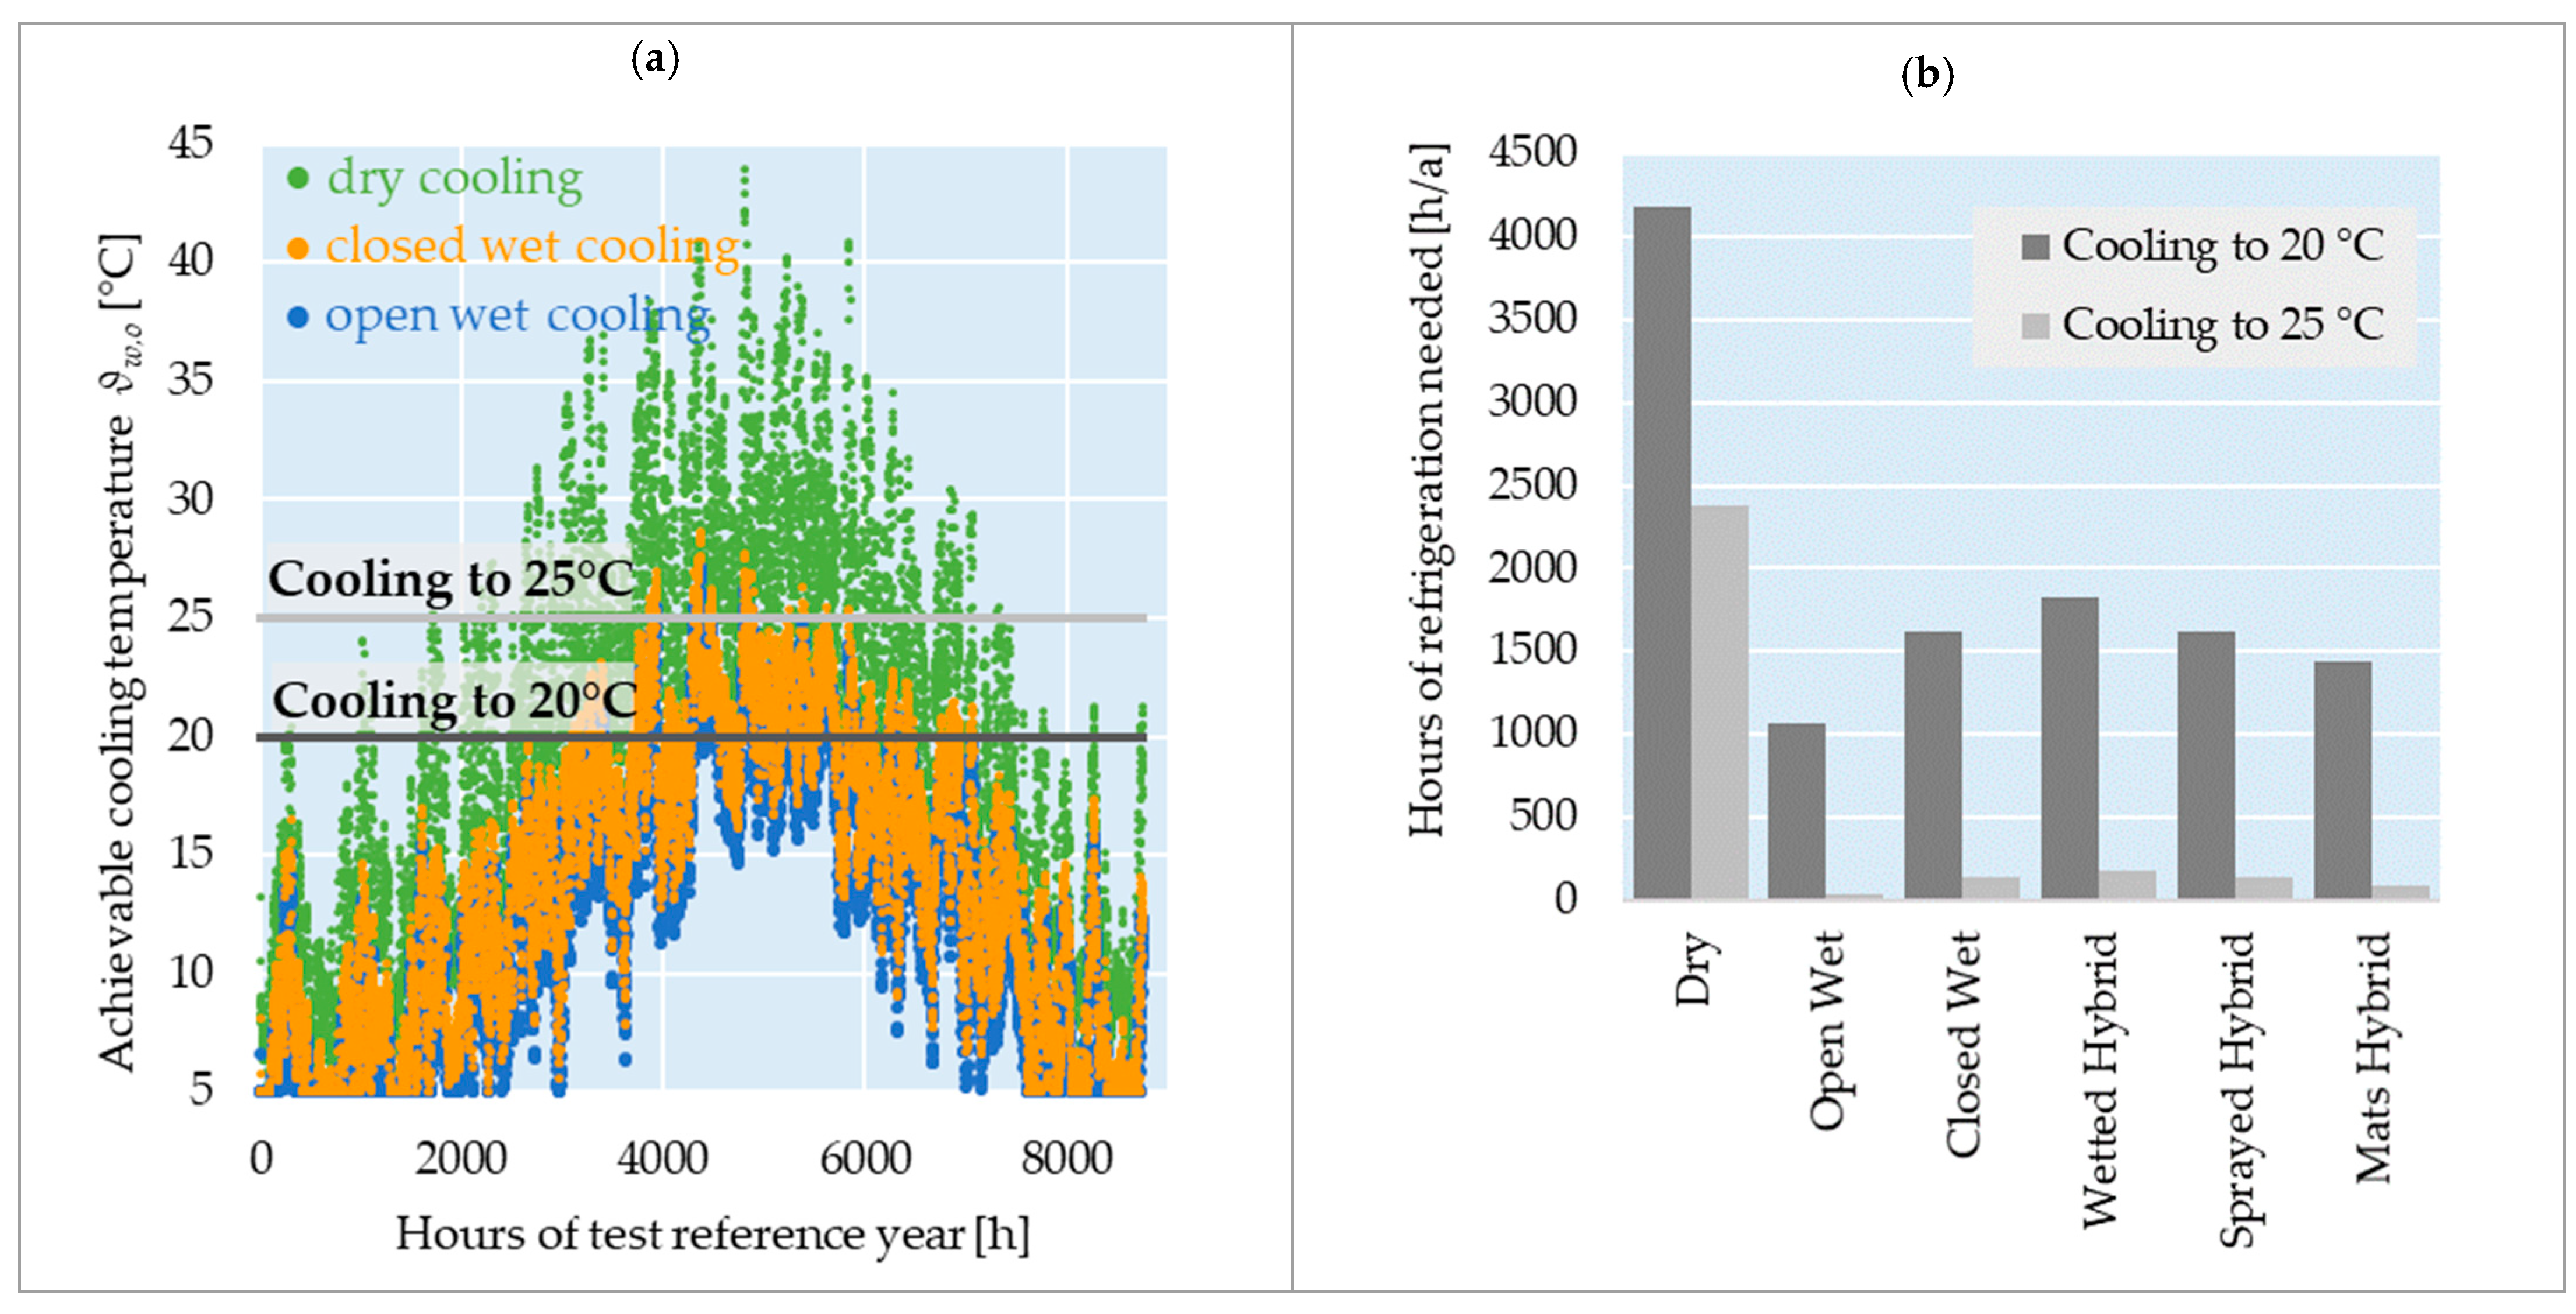
3.1. Limits of Cooling Tower Use
3.2. Electricity and Water Consumption
3.3. Exemplary Application
4. Discussion
5. Conclusions and Outlook
- The free cooling potential with cooling towers depends on whether the required cooling temperature is achievable, which the cooling tower approach and ambient temperature determine. Dry cooling has a median approach of 10 K towards ambient DBT. In contrast, open wet cooling enables a median approach of 5 K towards ambient WBT, while the median of wet cooling with a closed circuit is 6.5 K. Additionally, a safety gap of around 5 K towards freezing applies to wet cooling.
- All cooling tower types exhibit a typical coolant temperature range of at least 5 K. Thus, free cooling with cooling towers is mostly not feasible if the desired coolant outlet temperature is less than 5 K higher than the inlet temperature.
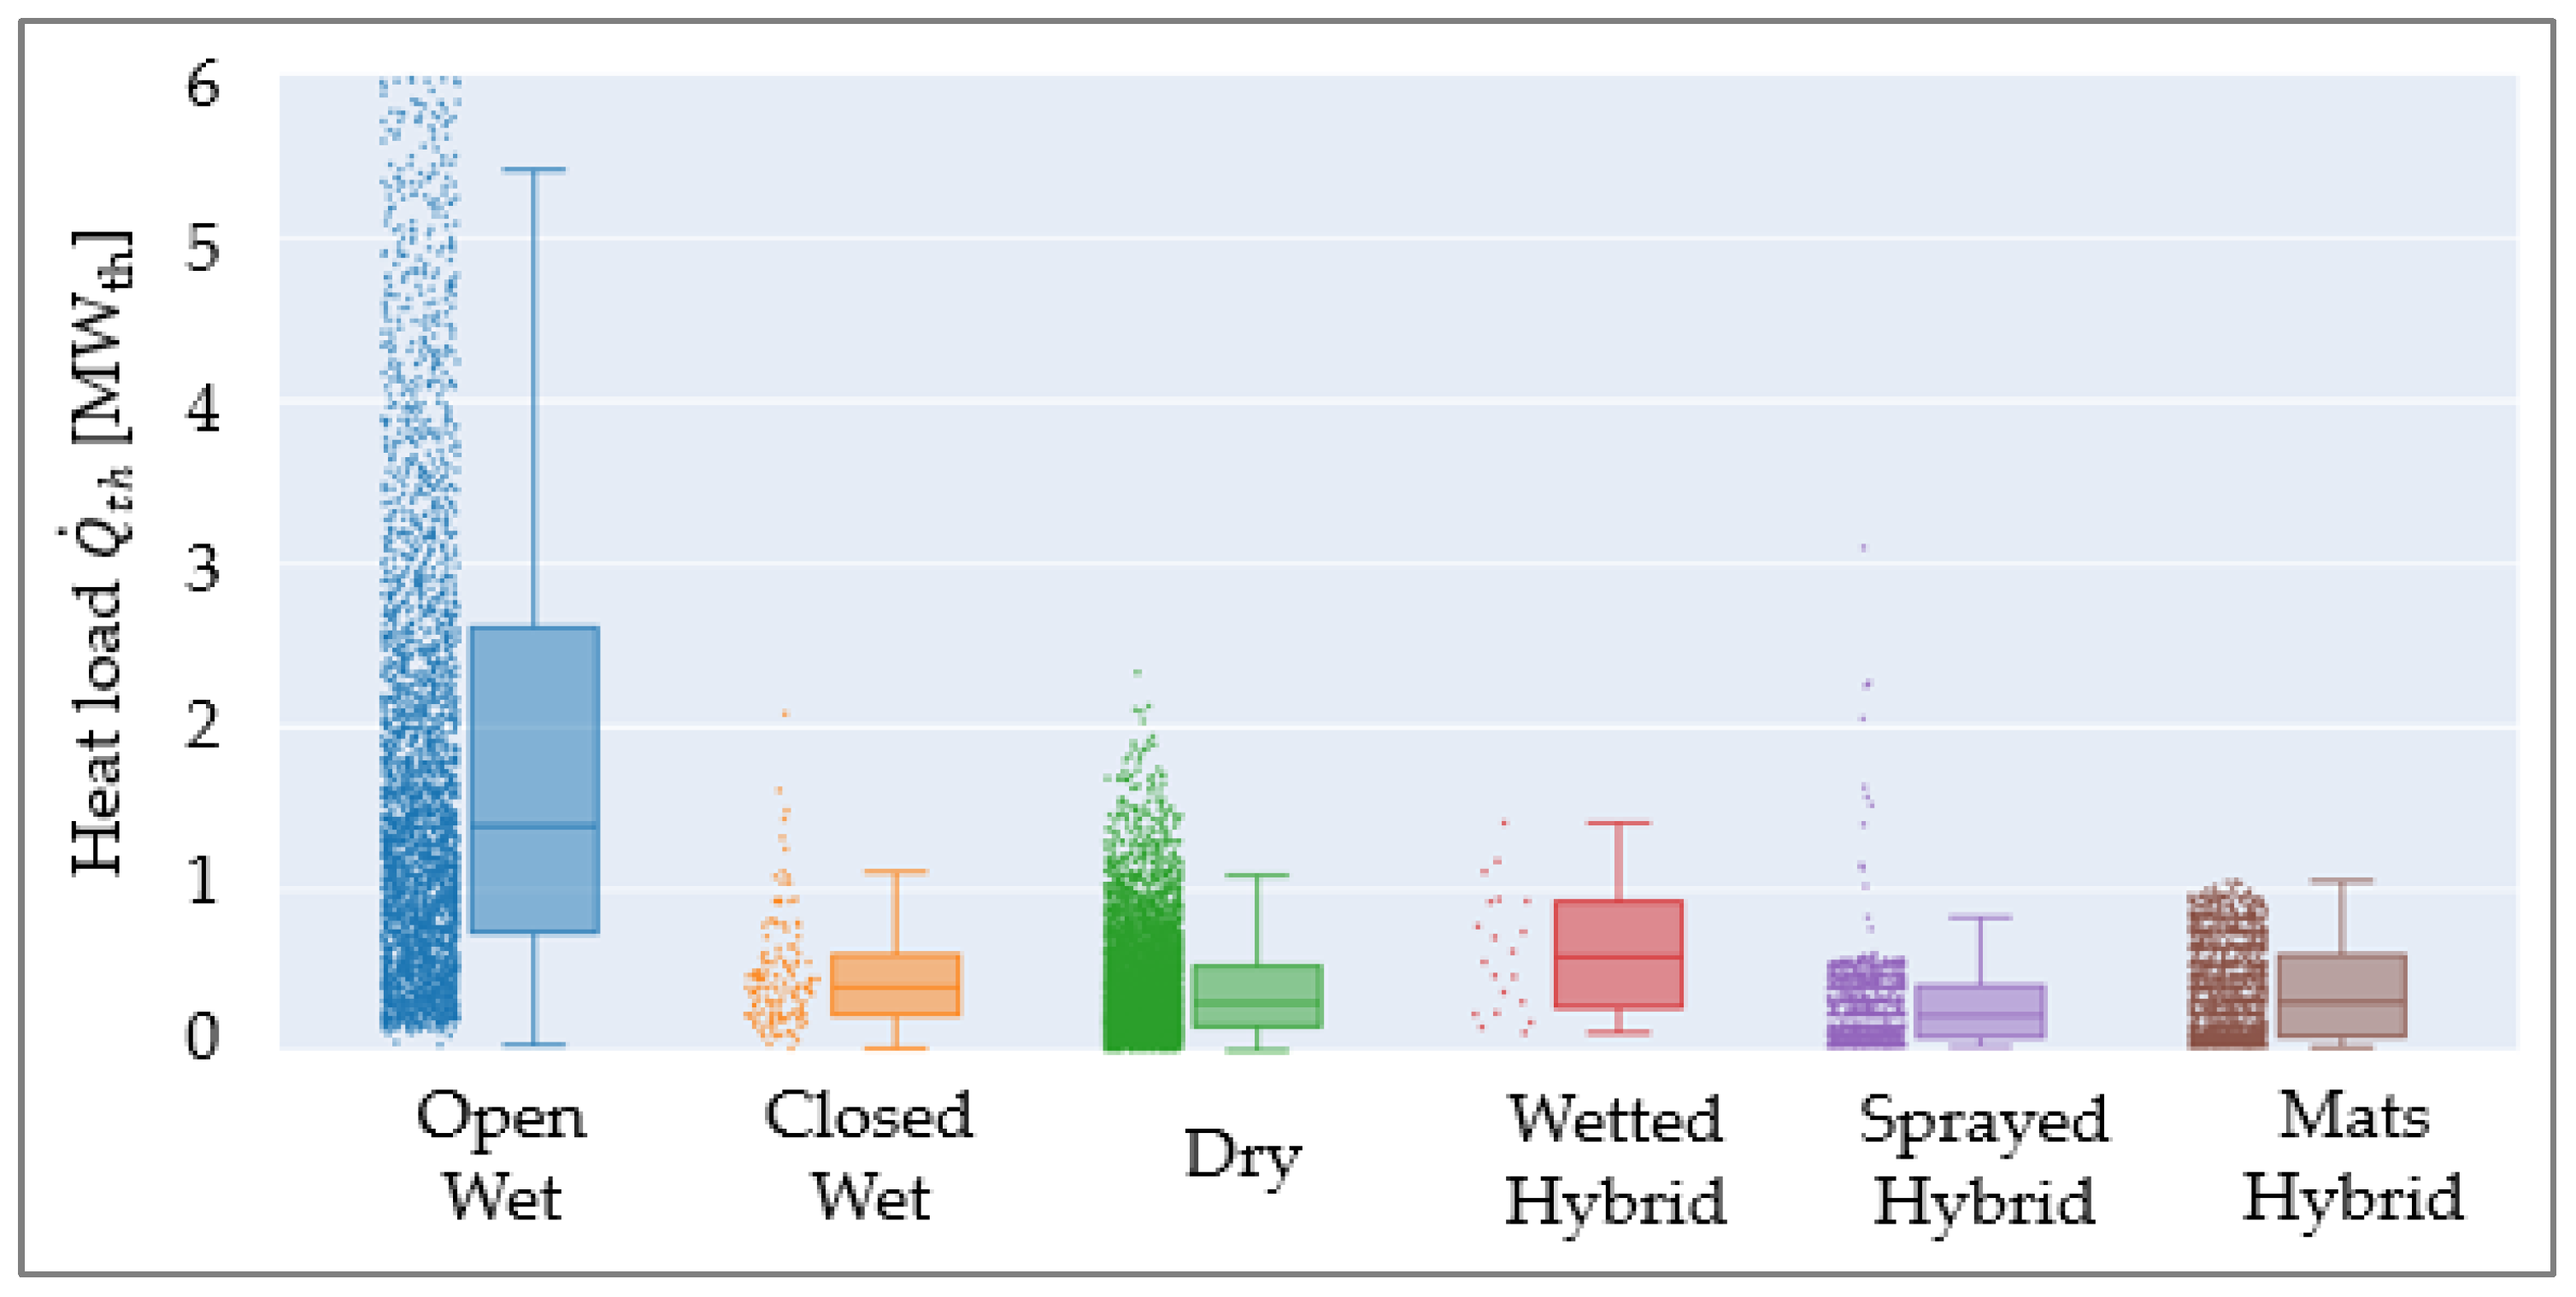
- Open wet cooling has the lowest specific electricity demand, ranging approximately from 0.012 to 0.021 kWel/kWth. The data of the other cooling tower types vary widely depending on factors such as design, size, and operating point.
- Data on water consumption are scarce but indicate that sprayed hybrid cooling towers use less water per MWth than hybrid systems with wetting-mats.
Supplementary Materials
Author Contributions
Funding
Institutional Review Board Statement
Informed Consent Statement
Data Availability Statement
Acknowledgments
Conflicts of Interest
Disclaimer
Nomenclature
| Abbreviations | Subscripts | ||
| DBT | dry-bulb temperature | 0.25 | 25%-quartile |
| EC | European Commission | 0.75 | 75%-quartile |
| IQR | interquartile range | a | air |
| ns | not specified | DBT | ambient DBT |
| VDI | Association of German Engineers | el | related to electricity |
| (German: Verein Deutscher Ingenieure) | h | heating element | |
| WBT | wet-bulb temperature | i | input, inlet |
| o | output, outlet | ||
| Symbols | p | pump | |
| c | heat capacity [kJ/(kgK)] | th | thermal |
| H | enthalpy [J] | v | vapor |
| p | pressure [Pa] | w | water |
| Q | heat [J] | WBT | ambient WBT |
| q | specific electricity consumption [kWel/kWth] | wt | water treatment |
| T | temperature [K] | ||
| V | volume [m3] | ||
| ϑ | temperature [°C] | ||
| φ | relative moisture [%] | ||
Appendix A

| Manufacturer’s Name | Name of Data Source | Ref. |
|---|---|---|
| Alfa-Laval AB | Niagara Wet Surface Air Coolers—Website | [46] |
| Alfa-Laval AB | Niagara Wet Surface Air Coolers—Product brochure | [44] |
| Baltimore Aircoil International nv | Operating points PTE—Technical documentation | [47] |
| Baltimore Aircoil International nv | Operating points VT0-VT1—Technical documentation | [48] |
| Baltimore Aircoil International nv | Operating points VTL-E—Technical documentation | [49] |
| Baltimore Aircoil International nv | TVCF Cooler—Product brochure | [50] |
| Baltimore Aircoil International nv | Adiabatic Cooler—Model TRF—Website | [51] |
| Baltimore Aircoil International nv | FXVS—Operating and maintenance manual | [52] |
| Baltimore Aircoil International nv | FXVT—Operating and maintenance manual | [53] |
| Baltimore Aircoil International nv | HFL—Operating and maintenance manual | [54] |
| Baltimore Aircoil International nv | NXF—Operating and maintenance manual | [55] |
| Baltimore Aircoil International nv | PFI—Operating and maintenance manual | [56] |
| Baltimore Aircoil International nv | PTE—Operating and maintenance manual | [57] |
| Baltimore Aircoil International nv | S1500E—Operating and maintenance manual | [58] |
| Baltimore Aircoil International nv | S3000E—Operating and maintenance manual | [59] |
| Baltimore Aircoil International nv | VFL—Operating and maintenance manual | [60] |
| Baltimore Aircoil International nv | VT0—Operating and maintenance manual | [61] |
| Baltimore Aircoil International nv | VTL-E—Operating and maintenance manual | [62] |
| Baltimore Aircoil International nv | VXI—Operating and maintenance manual | [63] |
| Baltimore Aircoil International nv | FXT—Operating and Maintenance Instructions | [64] |
| Baltimore Aircoil International nv | HXI—Operating and Maintenance Instructions | [65] |
| Baltimore Aircoil International nv | Operating points S1500E—Technical documentation | [66] |
| Carrier Global Corporation | 09PE- 09 VE—Manual for control system | [67] |
| Decsa S.r.l | TMA—EU—Product catalog | [68] |
| Decsa S.r.l | TMR—Product catalog | [69] |
| Decsa S.r.l | REF-A—Product catalog | [43] |
| Decsa S.r.l | REF-C—Product catalog | [70] |
| Decsa S.r.l | SQA—Product catalog | [71] |
| ENGIE Refrigeration GmbH | Re-cooling systems—Product catalog | [72] |
| EUROCONFORT GRUP (JACIR-GOHL) | Adiabatic Cooler—Topaz—Product brochure | [73] |
| EUROCONFORT GRUP (JACIR-GOHL) | Product Overview | [74] |
| EUROCONFORT GRUP (JACIR-GOHL) | Dunstturm EcoTec—Product brochure | [75] |
| EUROCONFORT GRUP (JACIR-GOHL) | LW Air-cooled Water Cooler—Website | [76] |
| EUROCONFORT GRUP (JACIR-GOHL) | Cooling Tower DT—Product brochure | [77] |
| EUROCONFORT GRUP (JACIR-GOHL) | Cooling Tower SK—Product brochure | [78] |
| EUROCONFORT GRUP (JACIR-GOHL) | Evaporative Cooler VK—Product brochure | [79] |
| EUROCONFORT GRUP (JACIR-GOHL) | Hybrid Water Cooler HK—Product brochure | [80] |
| Evapco Europe GmbH | LPT—Product brochure | [81] |
| Evapco Europe GmbH | LSTE—Product brochure | [82] |
| Evapco Europe GmbH | LSWA-H/LRW-H—Product brochure | [83] |
| Evapco Europe GmbH | ATWB—Product brochure | [84] |
| Evapco Europe GmbH | Air-cooled and adiabatic liquid coolers—Installation, operating, and maintenance manual | [85] |
| Evapco Europe GmbH | AT Thermal Performance—Technical documentation | [86] |
| Evapco Europe GmbH | AT Atlas—Product brochure | [87] |
| Evapco Europe GmbH | AT, AT Atlas, AXS, SUN, LPT, LSTE—Operating and maintenance manual | [88] |
| Evapco Europe GmbH | Closed Circuit Coolers—Product brochure | [89] |
| EWK Kühlturm GmbH | EWK-A—Operating and maintenance manual | [90] |
| EWK Kühlturm GmbH | EWK-I—Operating and maintenance manual | [91] |
| EWK Kühlturm GmbH | EWK-C—Operating and maintenance manual | [92] |
| EWK Kühlturm GmbH | EWB—Operating and maintenance manual | [93] |
| EWK Kühlturm GmbH | EWK—Operating and maintenance manual | [94] |
| EWK Kühlturm GmbH | EWK-D—Operating and maintenance manual | [95] |
| EWK Kühlturm GmbH | Cooling tower Ty p. EWK—Website | [96] |
| EWK Kühlturm GmbH | Cooling tower Ty p. EWK-A—Website | [97] |
| EWK Kühlturm GmbH | Cooling tower Ty p. EWK-C—Website | [92] |
| EWK Kühlturm GmbH | Cooling tower Ty p. EWK-D—Website | [98] |
| EWK Kühlturm GmbH | Cooling tower Ty p. EWK-DC—Website | [99] |
| EWK Kühlturm GmbH | Cooling tower Ty p. EWB—Website | [100] |
| EWK Kühlturm GmbH | Cooling tower Ty p. EWK-I—Website | [101] |
| Frigosystem S.r.l. | Corema—Product catalog | [102] |
| Frigosystem S.r.l. | ACE—Website | [103] |
| Frigosystem S.r.l. | Performance of adiabatic hybrid coolers—Website | [104] |
| Frigosystem S.r.l. | DCS—Website | [105] |
| Friterm AS | Horizontal- and vertical-type dry coolers with axial fans—Product catalog | [106] |
| Gohl-KTK GmbH | ERD—Product information | [107] |
| Gohl-KTK GmbH | WRD—Product information | [108] |
| Gohl-KTK GmbH | KAHV—Product flyer | [109] |
| Gohl-KTK GmbH | Product information Topaz—Website | [110] |
| JACIR SAS | Performance Table DTC—Technical documentation | [111] |
| JACIR SAS | Performance Table VAP—Technical documentation | [112] |
| JAEGGI Hybridtechnologie AG 1 | Re-cooling systems in the cooling circuit, presentation, evaluation, calculation of economic efficiency—Technical article | [34] |
| JAEGGI Hybridtechnologie AG 1 | Operating cost reduction in the data center—Presentation | [113] |
| JAEGGI Hybridtechnologie AG 1 | Innovative and sustainable cooling with hybrid or adiabatic dry coolers—Technical article | [114] |
| JAEGGI Hybridtechnologie AG 1 | ADC—Product information | [115] |
| JAEGGI Hybridtechnologie AG 1 | HTK—Product information | [116] |
| JAEGGI Hybridtechnologie AG 1 | Data center cooling with hybrid coolers—Technical article | [33] |
| JAEGGI Hybridtechnologie AG 1 | HTK-SE—Product information | [36] |
| JAEGGI Hybridtechnologie AG 1 | Efficient cooling of data centers with hybrid dry coolers—Technical article | [117] |
| JAEGGI Hybridtechnologie AG 1 | Phone call on the design and energetic evaluation of cooling towers | [118] |
| Kaltra Innovativtechnik GmbH | Bora—Product catalog | [38] |
| Kelvion Holding GmbH | Phone call on the design and electricity consumption of hybrid cooling towers | [119] |
| Kelvion Holding GmbH | Adiabatic Systems—Customer presentation | [120] |
| Kelvion Holding GmbH | Adiabatic Systems—Installation and maintenance manual | [121] |
| Kelvion Holding GmbH | Selection Tool | [122] |
| LU-VE S.p.A.—LU-VE AIA AB | Emeritus—Product brochure | [123] |
| LU-VE S.p.A.—LU-VE AIA AB | Dri-Batic Spray System—Produktinformationsblatt | [124] |
| LU-VE S.p.A.—LU-VE Exchangers | Heat-Exchangers-Production-Range—Product catalog | [125] |
| LU-VE S.p.A.—LU-VE Exchangers | Dry-Coolers—Product catalog | [126] |
| MITA Cooling Technologies S.r.l | PMS-K12-Open-Circuit-Cooling-Towers—Product catalog | [127] |
| MITA Cooling Technologies S.r.l | PME-K12-Open-Circuit-Cooling-Towers—Product catalog | [128] |
| MITA Cooling Technologies S.r.l | PMM-Cooling-Towers—Product catalog | [129] |
| Multi Kühlsysteme GmbH | Hybride Trockenkühler—Website | [130] |
| Multi Kühlsysteme GmbH | Kühltürme—Website | [131] |
| Multi Kühlsysteme GmbH | Dry coolers for dry and hybrid cooling—Website | [132] |
| Multi Kühlsysteme GmbH | Dry coolers in horizontal design—Website | [133] |
| Multi Kühlsysteme GmbH | Dry coolers V-type—Website | [134] |
| Refrion S.r.l. | Adiabatic Systems—Product information | [135] |
| SECESPOL Sp. z o.o. | Dry-Coolers—Product catalog | [136] |
| Secon GmbH | Adiabate Rückkühler—Product catalog | [35] |
| Secon GmbH | Trockenrückkühler—Product catalog | [137] |
| SPX Cooling Technologies Inc. | Marley CP Cooling Tower—Produktinformation | [138] |
| SPX Cooling Technologies Inc. | Marley CP Cooling tower—Operating and maintenance manual | [139] |
| SPX Cooling Technologies Inc. | Marley MCW Cooling tower—Operating and maintenance manual | [140] |
| SPX Cooling Technologies Inc. | Marley MD Cooling Tower—Operating and maintenance manual | [141] |
| SPX Cooling Technologies Inc. | Marley MD Cooling tower—Technical data | [142] |
| SPX Cooling Technologies Inc. | Marley MH Fluid Cooler—Operating and maintenance manual | [143] |
| SPX Cooling Technologies Inc. | Marley MH liquid cooler—Technical data | [144] |
| SPX Cooling Technologies Inc. | Marley NC Stahl Cooling tower—Operating and maintenance manual | [145] |
| SPX Cooling Technologies Inc. | Marley NC Stahl Cooling tower—Technical data | [146] |
| Stefani S.p.A. | Scirocco—Dry Cooler—Product catalog | [147] |
| Stefani S.p.A. | Zonda—Dry Cooler—Product catalog | [148] |
| Stefani S.p.A. | Ostro—Dry Cooler—Product catalog | [149] |
| Swegon Germany GmbH | Heat exchanger—Product brochure | [150] |
| Thermofin GmbH | Adiabatic precooling—Product catalog | [151] |
| Thermofin GmbH | Hybrid cooling—Product data sheet | [37] |
| ThermoKey S.P.A. | Dry Cooler—Product brochure | [152] |
| ThermoKey S.P.A. | V-Tower—Product brochure | [153] |
References
- Deroubaix, A.; Labuhn, I.; Camredon, M.; Gaubert, B.; Monerie, P.-A.; Popp, M.; Ramarohetra, J.; Ruprich-Robert, Y.; Silvers, L.G.; Siour, G. Large uncertainties in trends of energy demand for heating and cooling under climate change. Nat. Commun. 2021, 12, 5197. [Google Scholar] [CrossRef] [PubMed]
- IEA. Space Cooling. International Energy Agency, Paris, License: CC BY 4.0. Available online: https://www.iea.org/reports/space-cooling (accessed on 13 December 2022).
- Turek, D.; Radgen, P. Optimized data center site selection—Mesoclimatic effects on data center energy consumption and costs. Energy Effic. 2021, 14, 33. [Google Scholar] [CrossRef]
- Zhang, Q.; Meng, Z.; Hong, X.; Zhan, Y.; Liu, J.; Dong, J.; Bai, T.; Niu, J.; Deen, M.J. A survey on data center cooling systems: Technology, power consumption modeling and control strategy optimization. J. Syst. Archit. 2021, 119, 102253. [Google Scholar] [CrossRef]
- Butler, I.; Vandenboer, R. Eurovent Certita Certification (ECC) & Cooling Technology Institute (CTI) together provide industry certification of Cooling Towers and Closed Circuit Coolers covering the world. REHVA J. 2015. Available online: https://www.rehva.eu/fileadmin/REHVA_Journal/REHVA_Journal_2015/RJ_issue_2/P.34/34-42_RJ1502_WEB.pdf (accessed on 17 April 2023).
- Brückner, S. Industrielle Abwärme in Deutschland: Bestimmung von Gesichertem Aufkommen und Technischer bzw. Wirtschaftlicher Nutzbarkeit. Ph.D. Thesis, Technische Universität München, Munich, Germany, 2016. [Google Scholar]
- Zhang, H.; Shao, S.; Xu, H.; Zou, H.; Tian, C. Free cooling of data centers: A review. Renew. Sustain. Energy Rev. 2014, 35, 171–182. [Google Scholar] [CrossRef]
- Liu, J.; Su, L.; Dong, K.; Liu, X. Critical temperature of free cooling using indirect opening cooling tower in data centres: A review. Int. J. Ambient. Energy 2022, 43, 1339–1344. [Google Scholar] [CrossRef]
- Lee, K.-P.; Chen, H.-L. Analysis of energy saving potential of air-side free cooling for data centers in worldwide climate zones. Energy Build. 2013, 64, 103–112. [Google Scholar] [CrossRef]
- Schlei-Peters, I.; Kurle, D.; Wichmann, M.G.; Thiede, S.; Herrmann, C.; Spengler, T.S. Assessing Combined Water-Energy-Efficiency Measures in the Automotive Industry. Procedia CIRP 2015, 29, 50–55. [Google Scholar] [CrossRef]
- Schlei-Peters, I.; Wichmann, M.G.; Matthes, I.-G.; Gundlach, F.-W.; Spengler, T.S. Integrated material flow analysis and process modeling to increase energy and water efficiency of industrial cooling water systems. J. Ind. Ecol. 2017, 22, 41–54. [Google Scholar] [CrossRef]
- Wang, J.-G.; Shieh, S.-S.; Jang, S.-S.; Wu, C.-W. Discrete model-based operation of cooling tower based on statistical analysis. Energy Convers. Manag. 2013, 73, 226–233. [Google Scholar] [CrossRef]
- Táboas, F.; Vázquez, F. Pressure Drops and Energy Consumption Model of Low-Scale Closed Circuit Cooling Towers. Processes 2021, 9, 974. [Google Scholar] [CrossRef]
- European Commission. Reference Document on the Application of Best Available Techniques to Industrial Cooling Systems: Integrated Pollution Prevention and Control (IPPC). 2001. Available online: https://eippcb.jrc.ec.europa.eu/sites/default/files/2019-11/cvs_bref_1201.pdf (accessed on 14 July 2022).
- Pfeiffenberger, U. Planung und Projektierung von Kühltürmen: Eigenschaften, Auswahl und Betrieb von Rückkühlwerken. Available online: https://www.kka-online.info/artikel/kka_Planung_und_Projektierung_von_Kuehltuermen_2021948.html (accessed on 14 July 2020).
- Schulze, T. Gleichungsorientierte Modellierung der Wärme- und Stoffübertragungsprozesse in Verdunstungskühltürmen. Ph.D. Thesis, Technische Universität Dresden, Dresden, Germany, 2015. [Google Scholar]
- Hincke, P.; Hainbach, C. Komponenten und Bauteile: Rückkühler. In Pohlmann Taschenbuch der Kältetechnik: Grundlagen, Anwendungen, Arbeitstabellen und Vorschriften, 22nd ed.; IKET GmbH, Ed.; VDE Verlag GmbH: Berlin, Germany; Offenbach, Germany, 2018; pp. 324–335. ISBN 9783800741496. [Google Scholar]
- Dehli, M. Energieeffizienz in Industrie, Dienstleistung und Gewerbe: Energietechnische Optimierungskonzepte für Unternehmen; Springer Vieweg: Wiesbaden, Germany, 2020; ISBN 978-3-658-23203-0. [Google Scholar]
- Deutsches Institut für Normung e. V. DIN SPEC 15240; Energy Performance of Buildings—Ventilation for Buildings—Inspection of Air-conditioning Systems. 27.015; 91.140.30 (SPEC 15240); Beuth Verlag GmbH: Berlin, Germany, 2019.
- Eurovent. Performance Efficiency Standard for Evaporative Cooling Equipment: Eurovent 9/12—2016; Eurovent: Brussels, Belgium, 2016; Available online: https://eurovent.eu/?q=content/eurovent-912-2016-performance-efficiency-standard-evaporative-cooling-equipment (accessed on 17 April 2023).
- Qi, X.; Liu, Y.; Guo, Q.; Yu, S.; Yu, J. Performance prediction of a shower cooling tower using wavelet neural network. Appl. Therm. Eng. 2016, 108, 475–485. [Google Scholar] [CrossRef]
- Schulze, C.; Thiede, S.; Thiede, B.; Kurle, D.; Blume, S.; Herrmann, C. Cooling tower management in manufacturing companies: A cyber-physical system approach. J. Clean. Prod. 2019, 211, 428–441. [Google Scholar] [CrossRef]
- Gerke, B.F.; McNeil, M.A.; Tu, T. The International Database of Efficient Appliances (IDEA): A new tool to support appliance energy-efficiency deployment. Appl. Energy 2017, 205, 453–464. [Google Scholar] [CrossRef]
- Monfet, D.; Zmeureanu, R. Calibration of a central cooling plant model using manufacturer’s data and measured input parameters and comparison with measured performance. J. Build. Perform. Simul. 2013, 6, 141–155. [Google Scholar] [CrossRef]
- Tan, F.L.; Fok, S.C. Methodology on sizing and selecting thermoelectric cooler from different TEC manufacturers in cooling system design. Energy Convers. Manag. 2008, 49, 1715–1723. [Google Scholar] [CrossRef]
- Lucas, M.; Martínez, P.J.; Viedma, A. Experimental determination of drift loss from a cooling tower with different drift eliminators using the chemical balance method. Int. J. Refrig. 2012, 35, 1779–1788. [Google Scholar] [CrossRef] [Green Version]
- Mühlen, M. Datenbasierte Identifikation Bauartspezifischer Einsatzbereiche von Rückkühlwerken. Study Thesis, University of Stuttgart, Stuttgart, Germany, 2022. [Google Scholar]
- Eurovent Certita Certification SAS. Certified Product Directory|Eurovent Certita Certification. Available online: https://www.eurovent-certification.com/en/advancedsearch/result?program=HE (accessed on 26 March 2022).
- Deutsches Institut für Normung e. V. V 18599-7; Energetische Bewertung von Gebäuden—Berechnung des Nutz-, End- und Primärenergiebedarfs für Heizung, Kühlung, Lüftung, Trinkwarmwasser und Beleuchtung: Teil 7: Endenergiebedarf von Raumlufttechnik- und Klimakältesystemen für den Nichtwohnungsbau. Beuth Verlag GmbH: Berlin, Germany, 2018.
- Deutscher Wetterdienst. Wetter und Klima—Deutscher Wetterdienst—TRY. Available online: https://www.dwd.de/DE/klimaumwelt/klimaforschung/spez_themen/try/try_node.html (accessed on 18 May 2022).
- Kenett, R.S.; Zacks, S.; Gedeck, P. Modern Statistics: A Computer-Based Approach with Python, 1st ed.; Springer International Publishing, Imprint Birkhäuser: Cham, Switzerland, 2022; ISBN 9783031075667. [Google Scholar]
- Deutsches Institut für Normung e. V. Deutsche Fassung EN 1048:2014; Wärmeübertrager—Luftgekühlte Flüssigkeitskühler (’Trockenkühltürme’): Prüfverfahren zur Leistungsfeststellung (EN 1048). Beuth Verlag GmbH: Berlin, Germany, 2014.
- Ballandt, J. Datencenterkühlung mit Hybriden Rückkühlern. 2017. Available online: https://www.jaeggi-hybrid.ch/fileadmin/sites/jaeggi/ch/Fachartikel/Datencenterk%C3%BChlung.pdf (accessed on 27 March 2023).
- Rack, T. Rückkühlsysteme im Kühlkreislauf: Vorstellung, Bewertung, Wirtschaftlichkeitsberechnung, Filderstadt. 2007. Available online: https://www.jaeggi-hybrid.ch/fileadmin/sites/jaeggi/ch/Fachartikel/07-09-13_Vortrag_HDT_DE.pdf (accessed on 27 March 2023).
- Secon GmbH. Adiabate Rückkühler. 2018. Available online: https://secon-gmbh.com/assets/uploads/dateien/downloads/2018/2018-secon-adiabate-rueckkuehler-l-de.pdf (accessed on 25 January 2022).
- JAEGGI Hybridtechnologie AG. Produktinformationsblatt HTK-SE. 2018. Available online: http://www.jaeggi-hybrid.ch/fileadmin/literature/europe/JAEGGI/HTK-SE/JAEGGI_HTK-SE_Info_DE.pdf (accessed on 24 January 2022).
- Thermofin GmbH. Produktdatenblatt Hybridkühlung. 2020. Available online: https://www.thermofin.de/download.php?download=END-Produktdatenblatt-Hybride-K%C3%BChlung-2020-Screen (accessed on 26 January 2022).
- Kaltra Innovativtechnik GmbH. Produktkatalog Kaltra Bora. 2018. Available online: https://www.kaltra.de/_files/ugd/fd43f4_50a00546cdb041bf9677a7759faa077a.pdf (accessed on 24 January 2022).
- Freiherr, M. Welche Rückkühltechnologie Eignet sich für Welchen Anwendungsfall? Von Trocken bis Hybrid; KI Kälte Luft Klimatechnik: Heidelberg, Germany, 2019; pp. 38–43. Available online: https://www.ki-portal.de/serp/serp-heftarchiv.html?q=welche+r%C3%BCckk%C3%BChl (accessed on 17 April 2023).
- Pech, A.; Jens, K. Heizung und Kühlung; Springer: Wien, Austria, 2005; ISBN 978-3990436981. [Google Scholar]
- Erens, P.J.; Reuter, H.C. N4 Kühltürme. In VDI-Wärmeatlas: Fachlicher Träger VDI-Gesellschaft Verfahrenstechnik und Chemieingenieurwesen, 12th ed.; Aufl, S.P., Kabelac, S., Kind, M., Mewes, D., Schaber, K., Wetzel, T., Eds.; Springer: Berlin/Heidelberg, Germany, 2019; pp. 1937–1958. ISBN 978-3-662-52989-8. [Google Scholar]
- Brunner, A.; Kriegers, M.; Prochaska, V.; Tillenkamp, F. Klimakälte Heute: Kluge Lösungen für Ein Angenehmes Raumklima; Faktor Verlag: Zürich, Switzerland, 2019; ISBN 978-3-905711-48-6. [Google Scholar]
- Decsa S.r.l. Catalogue REF-A. 2019. Available online: https://uploads-ssl.webflow.com/608a7afa4bc0372c48e8fa8b/608c29cae0c02cdad8eb155b_catalogo-REF-A.pdf (accessed on 31 January 2022).
- Alfa Laval AB. Niagara Wet Surface Air Coolers Produktbroschüre. Available online: https://www.alfalaval.com/globalassets/documents/products/heat-transfer/wsac/alfa-laval-niagara-wsac_product-brochure_en.pdf (accessed on 20 January 2022).
- Sharifullin, V.N.; Badriev, A.I. Aerodynamic Characteristics of the Cooling Tower under the Nonuniform Distribution of the Water and Air Flows. Therm. Eng. 2019, 66, 569–574. [Google Scholar] [CrossRef]
- Alfa Laval AB. Alfa Laval—Niagara Wet Surface Air Coolers. Available online: https://www.alfalaval.com/products/heat-transfer/air-heat-exchangers-wetted/wet-surface-air-heat-exchangers/niagara-wet-surface-air-coolers/ (accessed on 20 January 2022).
- Baltimore Aircoil International nv. PTE Cooling Tower Performance at Standard Conditions. 2015. Available online: https://www.baltimoreaircoil.eu/de/media/980 (accessed on 29 March 2022).
- Baltimore Aircoil International nv. VT0_VT1 Cooling Tower Performance at Standard Conditions. Available online: https://www.baltimoreaircoil.eu/de/media/1083 (accessed on 29 March 2022).
- Baltimore Aircoil International nv. VTL-E Cooling Tower Performance at Standard Conditions. 2015. Available online: https://www.baltimoreaircoil.eu/de/media/1084 (accessed on 29 March 2022).
- Baltimore Aircoil International nv. TVCF Cooler—Produktbroschüre. 2021. Available online: https://www.baltimoreaircoil.eu/sites/default/files/uploads/media/document/BAC_website_TVFC_EN_2021.pdf (accessed on 30 January 2022).
- Baltimore Aircoil International nv. Adiabatic Cooler—Model TRF|BAC Europe. Available online: https://www.baltimoreaircoil.eu/en/products/trf (accessed on 30 January 2022).
- Baltimore Aircoil International nv. Betriebs- und Wartungsanleitung—FXVS. Available online: https://www.baltimoreaircoil.eu/sites/default/files/uploads/media/document/BAC_Wartung-FXVS_MFXVSv08DE.pdf (accessed on 30 January 2022).
- Baltimore Aircoil International nv. Betriebs- und Wartungsanleitung—FXVT. Available online: https://www.baltimoreaircoil.eu/sites/default/files/uploads/media/document/BAC_Wartung-FXVT_MFXVTv07DE.pdf (accessed on 30 January 2022).
- Baltimore Aircoil International nv. Betriebs- und Wartungsanleitung—HFL. Available online: https://www.baltimoreaircoil.eu/sites/default/files/uploads/media/document/BAC_Wartung-HFL_MHFLv15DE.pdf (accessed on 30 January 2022).
- Baltimore Aircoil International nv. Betriebs- und Wartungsanleitung—NXF. Available online: https://www.baltimoreaircoil.eu/sites/default/files/uploads/media/document/BAC_Wartung-NXF_MNXFv01DE.pdf (accessed on 30 January 2022).
- Baltimore Aircoil International nv. Betriebs- und Wartungsanleitung—PFI. Available online: https://www.baltimoreaircoil.eu/sites/default/files/uploads/media/document/BAC_Wartung-PFI_MPFIv07DE.pdf (accessed on 30 January 2022).
- Baltimore Aircoil International nv. Betriebs- und Wartungsanleitung—PTE. Available online: https://www.baltimoreaircoil.eu/sites/default/files/uploads/media/document/BAC_Wartung-PTE_MPTEv12DE.pdf (accessed on 30 January 2022).
- Baltimore Aircoil International nv. Betriebs- und Wartungsanleitung—S1500E. Available online: https://www.baltimoreaircoil.eu/sites/default/files/uploads/media/document/BAC_Wartung-S1500E_MS1500Ev07DE.pdf (accessed on 30 January 2022).
- Baltimore Aircoil International nv. Betriebs- und Wartungsanleitung—S3000E, XES3000E. Available online: https://www.baltimoreaircoil.eu/sites/default/files/uploads/media/document/BAC_Wartung-S3000E_MS3000Ev09DE.pdf (accessed on 30 January 2022).
- Baltimore Aircoil International nv. Betriebs- und Wartungsanleitung—VFL. Available online: https://www.baltimoreaircoil.eu/sites/default/files/uploads/media/document/BAC_Wartung-VFL_MVFLv20DE.pdf (accessed on 30 January 2022).
- Baltimore Aircoil International nv. Betriebs- und Wartungsanleitung—VT0. Available online: https://www.baltimoreaircoil.eu/sites/default/files/uploads/media/document/BAC_Wartung-VT0_MVTv08DE_0.pdf (accessed on 30 January 2022).
- Baltimore Aircoil International nv. Betriebs- und Wartungsanleitung—VTL-E. Available online: https://www.baltimoreaircoil.eu/sites/default/files/uploads/media/document/BAC_Wartung-VTL-E_MVTL-Ev20DE.pdf (accessed on 30 January 2022).
- Baltimore Aircoil International nv. Betriebs- und Wartungsanleitung—VXI. Available online: https://www.baltimoreaircoil.eu/sites/default/files/uploads/media/document/BAC_Wartung-VXI_MVXIv23DE.pdf (accessed on 30 January 2022).
- Baltimore Aircoil International nv. Operating and Maintenance Instuctions—FXT. Available online: https://www.baltimoreaircoil.eu/sites/default/files/bac_maintenancefxt_mfxtv07en.pdf (accessed on 30 January 2022).
- Baltimore Aircoil International nv. Operating and Maintenance Instuctions—HXI. Available online: https://www.baltimoreaircoil.eu/sites/default/files/uploads/media/document/BAC_Maintenance-HXI_MHXIv15EN.pdf (accessed on 30 January 2022).
- Baltimore Aircoil International nv. S1500E Cooling Tower Performance at Standard Conditions. Available online: https://www.baltimoreaircoil.eu/de/media/979 (accessed on 29 March 2022).
- Carrier Global Corporation. Carrier Handbuch Regelung. 2020. Available online: https://eto.carrier.com/litterature/cm/DE7510377-03_IOM_10_2021_Dry_Pic.pdf (accessed on 20 January 2022).
- Decsa S.r.l. Catalogue—TMA-EU. Available online: https://uploads-ssl.webflow.com/608a7afa4bc0372c48e8fa8b/608a9608a88d66e8c3c52647_catalogo-TMA-EU.pdf (accessed on 31 January 2022).
- Decsa S.r.l. Catalogue—TMR. 2019. Available online: https://uploads-ssl.webflow.com/608a7afa4bc0372c48e8fa8b/608c17eecd47ed787e33882e_catalogo-TMR.pdf (accessed on 31 January 2022).
- Decsa S.r.l. Catalogue REF-C. 2019. Available online: https://uploads-ssl.webflow.com/608a7afa4bc0372c48e8fa8b/608c3862a65d0f3018f7c6db_catalogo-REF-C.pdf (accessed on 31 January 2022).
- Decsa S.r.l. Catalogue SQA. 2020. Available online: https://uploads-ssl.webflow.com/608a7afa4bc0372c48e8fa8b/608c2256b216e017686eb227_catalogo-SQA.pdf (accessed on 31 January 2022).
- ENGIE Refrigeration GmbH. Broschüre Rückkühlwerke. 2021. Available online: https://www.engie-refrigeration.de/sites/engie-refrigeration.de/files/2021-08/DE_Folder%20VENTUM_DS.pdf (accessed on 20 January 2022).
- EUROCONFORT GRUP. Adiabatic Cooler—Topaz—Brochure. 2013. Available online: https://www.jacir-gohl.ro/sites/default/files/gohl/documentatie/topaz_en.pdf (accessed on 31 January 2022).
- EUROCONFORT GRUP. Product Overview. 2013. Available online: https://www.jacir-gohl.ro/sites/default/files/gohl/documentatie/product_overview_en.pdf (accessed on 31 January 2022).
- EUROCONFORT GRUP. Produktkatalog Dunstturm EcoTec. 2014. Available online: https://www.jacir-gohl.ro/sites/default/files/gohl/documentatie/dunstturm_dt_ecotec_de_05.pdf (accessed on 31 January 2022).
- EUROCONFORT GRUP. LW Air-Cooled Water Cooler. Available online: https://www.jacir-gohl.ro/en/gohl/lw-air-cooled-water-cooler/ (accessed on 31 January 2022).
- EUROCONFORT GRUP. Cooling Tower DT Brochure. Available online: https://www.jacir-gohl.ro/sites/default/files/gohl/documentatie/dt_cooling_tower.pdf (accessed on 31 January 2022).
- EUROCONFORT GRUP. Cooling Tower SK Brochure. Available online: https://www.jacir-gohl.ro/sites/default/files/gohl/documentatie/coolingtower_sk.pdf (accessed on 31 January 2022).
- EUROCONFORT GRUP. Evaporative Cooler VK Brochure. Available online: https://www.jacir-gohl.ro/sites/default/files/gohl/documentatie/evaporative_cooler_vk.pdf (accessed on 31 January 2022).
- EUROCONFORT GRUP. Hybrid Water Cooler HK Brochure. Available online: https://www.jacir-gohl.ro/sites/default/files/gohl/documentatie/hybrid_water-cooler_hk.pdf (accessed on 31 January 2022).
- EVAPCO Europe GmbH. LPT Bulletin. 2012. Available online: https://www.evapco.eu/sites/evapco.eu/files/2017-10/Evapco%20LPT%20Bulletin%20305-E_0416.pdf (accessed on 28 January 2022).
- EVAPCO Europe GmbH. LSTE Bulletin. 2013. Available online: https://www.evapco.eu/sites/evapco.eu/files/2021-11/EVAPCO%20LSTE%20Bulletin%20313-D_1121.pdf (accessed on 28 January 2022).
- EVAPCO Europe GmbH. LSWA-H/LRW-H Bulletin. 2013. Available online: https://www.evapco.eu/sites/evapco.eu/files/2018-06/Evapco%20LSWA-H_LRW-H%20Bulletin%20251-D_1216.pdf (accessed on 28 January 2022).
- EVAPCO Europe GmbH. ATWB Bulletin. 2018. Available online: https://www.evapco.eu/de/products/closed-circuit-coolers-evaporative/eco-atwb-kuehler-fuer-geschlossenen-kreislauf (accessed on 28 January 2022).
- EVAPCO Europe GmbH. Europäische Wartungs- und Betriebsanleitung. 2019. Available online: https://www.evapco.eu/sites/evapco.eu/files/2019-06/EVAPCO%20eco-Air%20Installation%2C%20Operation%20%26%20Maintenance%20Bulletin%201110A-DE_0619.pdf (accessed on 28 January 2022).
- EVAPCO Europe GmbH. AT Thermal Performance. 2021. Available online: https://www.evapco.eu/sites/evapco.eu/files/2021-09/AT%20Thermal%20Performance%200921%20SI.pdf (accessed on 28 January 2022).
- EVAPCO Europe GmbH. EVAPCO AT Atlas Bulletin. 2021. Available online: https://www.evapco.com/sites/evapco.com/files/2021-09/ATLAS21MRKT%20WEB%200921.pdf (accessed on 28 January 2022).
- EVAPCO Europe GmbH. Evapco Maintenance Instructions Towers OM Bulletin. 2021. Available online: https://www.evapco.eu/sites/evapco.eu/files/2021-12/Evapco%20Maintenance%20Instructions%20Towers%20OM%20Bulletin%20113-D_1221.pdf (accessed on 28 January 2022).
- EVAPCO Europe GmbH. Evapco Product Range Closed Circuit Coolers. 2021. Available online: https://www.evapco.eu/sites/evapco.eu/files/2021-11/Evapco%20Product%20Range%20Closed%20Circuit%20Coolers%20370-E_1121.pdf (accessed on 28 January 2022).
- EWK Kühlturm GmbH. Betriebs- und Wartungsanleitung EWK-A. 2020. Available online: https://www.ewk.eu/descargas/operating-and-maintenance-manuals-web-site/ewk-a-maintenance-manual-en-fr-de.pdf (accessed on 23 January 2022).
- EWK Kühlturm GmbH. Betriebs- und Wartungsanleitung EWK-I. 2020. Available online: https://www.ewk.eu/descargas/operating-and-maintenance-manuals-web-site/ewk-i-maintenance-manual-en-fr-de.pdf (accessed on 23 January 2022).
- EWK Kühlturm GmbH. Kühlturm Typ EWK-C|EWK-Kuehlturm. Available online: https://ewk-kuehlturm.de/kuehlturm-typ-ewk-c/ (accessed on 23 January 2022).
- EWK Kühlturm GmbH. Betriebs- und Wartungsanleitung EWB. 2021. Available online: https://www.ewk.eu/descargas/operating-and-maintenance-manuals-web-site/ewb-maintenance-manual-en-fr-de.pdf (accessed on 23 January 2022).
- EWK Kühlturm GmbH. Betriebs- und Wartungsanleitung EWK. 2021. Available online: https://www.ewk.eu/descargas/operating-and-maintenance-manuals-web-site/ewk-maintenance-manual-en-fr-de.pdf (accessed on 23 January 2022).
- EWK Kühlturm GmbH. Betriebs- und Wartungsanleitung EWK-D. 2021. Available online: https://www.ewk.eu/descargas/operating-and-maintenance-manuals-web-site/ewk-d-maintenance-manual-en-fr-de.pdf (accessed on 23 January 2022).
- EWK Kühlturm GmbH. Kühlturm Typ EWK|EWK-Kuehlturm. Available online: https://ewk-kuehlturm.de/kuehlturm-typ-ewk/ (accessed on 17 March 2023).
- EWK Kühlturm GmbH. Kühlturm Typ EWK-A|EWK-Kuehlturm. Available online: https://ewk-kuehlturm.de/kuehlturm-typ-ewk-a/ (accessed on 23 January 2022).
- EWK Kühlturm GmbH. Kühlturm Typ EWK-D|EWK-Kuehlturm. Available online: https://ewk-kuehlturm.de/kuehlturm-typ-ewk-d/ (accessed on 23 January 2022).
- EWK Kühlturm GmbH. Kühlturm Typ EWK-DC|EWK-Kuehlturm. Available online: https://ewk-kuehlturm.de/kuehlturm-typ-ewk-dc/ (accessed on 23 January 2022).
- EWK-Kühlturm GmbH. Kühlturm Typ EWB|EWK-Kuehlturm. Available online: https://ewk-kuehlturm.de/kuehlturm-typ-ewb/ (accessed on 23 January 2022).
- EWK-Kühlturm GmbH. Kühlturm Typ EWK-I|EWK-Kuehlturm. Available online: https://ewk-kuehlturm.de/kuehlturm-typ-ewk-i/ (accessed on 23 January 2022).
- Frigosystem S.r.l. Produktkatalog Frigosystem—Corema. 2019. Available online: http://www.frigosystem.it/images/FrigosystemCorema2019.pdf (accessed on 22 January 2022).
- Frigosystem S.r.l. ACE. Available online: http://www.frigosystem.it/en/dry-coolers-en/ace (accessed on 22 January 2022).
- Frigosystem S.r.l. Betriebsverhalten Adiabater Hybridkühler. Available online: http://www.frigosystem.it/de/video-de (accessed on 22 January 2022).
- Frigosystem S.r.l. DCS. Available online: http://www.frigosystem.it/en/dry-coolers-en/dcs (accessed on 22 January 2022).
- Friterm A.S. Horizontal and Vertical Type Dry Coolers with Axial Fans. Available online: https://www.friterm.com//Uploads/Document//ccebcc9f-cd4c-4cd6-8e86-5b8649124973.pdf (accessed on 28 January 2022).
- Gohl-KTK GmbH. Produktinformationsblatt ERD. 2021. Available online: https://www.gohl-ktk.de/wp-content/uploads/2021/12/ERD_Produktinformation_de.pdf (accessed on 23 January 2022).
- Gohl-KTK GmbH. Produktinformationsblatt WRD. 2021. Available online: https://www.gohl-ktk.de/wp-content/uploads/2021/12/WRD_Produktinformation_de.pdf (accessed on 23 January 2022).
- Gohl-KTK GmbH. Produktflyer KAHV. 2022. Available online: https://www.gohl-ktk.de/wp-content/uploads/2021/12/KAHV_Flyer-GOHL-KTK_de_21.pdf (accessed on 23 January 2022).
- Gohl-KTK GmbH. Produktinformationen Topaz. 2022. Available online: https://www.gohl-ktk.de/topaz/ (accessed on 23 January 2022).
- JACIR SAS. DT Line 49 Point Operating Performance Table. Available online: https://www.jacir.fr/en/produits/4_/6_hybrid_open_circuit_cooling_tower/17_sim_series_steel_open_hybrid.htm (accessed on 31 January 2022).
- JACIR SAS. VAP Line 49 Point Operating Performance Table. 2018. Available online: https://www.jacir.fr/global/upload/produit/pdf/native/en/49-point-operating-performance-table-for_256.pdf (accessed on 31 January 2022).
- Kielpinski, M. Betriebskostensenkung im Rechenzentrum: Energieeinsparung Durch Innovative Rückkühlung. 2015. Available online: https://docplayer.org/9218686-Betriebskostensenkung-im-rechenzentrum.html (accessed on 24 January 2022).
- Weber, J. Innovative und Nachhaltige Rückkühlung mit Hybriden oder Adiabaten Trockenkühlern. 2016. Available online: http://www.jaeggi-hybrid.ch/fileadmin/sites/jaeggi/ch/Fachartikel/161213_J_Innovative_Rueckkuehlung_JAEGGI.PDF (accessed on 23 December 2021).
- JAEGGI Hybridtechnologie AG. Produktinformationsblatt ADC. 2016. Available online: http://www.jaeggi-hybrid.ch/fileadmin/literature/europe/JAEGGI/ADC/JAEGGI_ADC_Info_DE.pdf (accessed on 24 January 2022).
- JAEGGI Hybridtechnologie AG. Produktinformationsblatt HTK. 2016. Available online: http://www.jaeggi-hybrid.ch/fileadmin/literature/europe/JAEGGI/HTK/JAEGGI_HTK_Info_DE.pdf (accessed on 24 January 2022).
- Weber, J. Effiziente Kühlung von Rechenzentren mit Hybriden Trockenkühlern. Available online: https://www.jaeggi-hybrid.ch/fileadmin/sites/jaeggi/ch/Fachartikel/11-DE_Fachartikel_Effiziente_K%C3%BChlung_von_Rechenzentren.pdf (accessed on 23 December 2021).
- Kielpinski, M.; (Kelvion Holding GmbH, Bochum, Germany). Expertise on the energetic evaluation of drycoolers, design of drycoolers in practice: Telephone conversation on 21 April 2022 (55 min). Personal communication, 2022. [Google Scholar]
- Ostermann, S.; (Kelvion Holding GmbH, Bochum, Germany). Expertise on Design and Electrical Energy Consumption of Hybrid Drycoolers: Telephone Conversation on 20 April 2022 (35 min). Personal communication, 2022. [Google Scholar]
- Kelvion Holding GmbH; (Bochum, Germany). Customer presentation Adiabatic systems: Received by mail on 20 April 2022. Personal communication, 20 April 2022. [Google Scholar]
- Kelvion Holding GmbH; (Bochum, Germany). Installation and maintenance instructions adiabatic systems: Received by mail on 20 April 2022. Personal communication, 2022. [Google Scholar]
- Kelvion Holding GmbH. Kelvion Selection Software. Available online: https://selectrt.kelvion.com/selector/system/?_gl=1*1kgxau5*_ga*OTc5NTkxODEwLjE2NDk0OTgyMzg.*_ga_V0H2NT9J7W*MTY0OTQ5ODIzNy4xLjEuMTY0OTQ5ODI2MC4zNw (accessed on 30 January 2022).
- LU-VE S.p.A.—AIA AB. Produktbroschüre Emeritus. 2017. Available online: https://aia.se/Upload/DocumentManager/emeritus.pdf (accessed on 25 January 2022).
- LU-VE S.p.A.—AIA AB.Produktinformationsblatt Dri-Batic Spray System. 2020. Available online: https://aia.se/_en/Upload/DocumentManager/AIA-Dri-Batic-spray_2020-04-17_eng_small.pdf (accessed on 26 January 2022).
- LU-VE S.p.A.—LU-VE Exchangers. Dry-Coolers. 2020. Available online: https://manuals.luve.it/Dry-Coolers/124/ (accessed on 25 January 2022).
- LU-VE S.p.A.—LU-VE Exchangers. Heat-Exchangers-Production-Range. 2021. Available online: https://manuals.luve.it/Heat-Exchangers-Production-Range/index.html (accessed on 17 April 2023).
- MITA Cooling Technologies S.r.l. PMS-K12-Open-Circuit-Cooling-Towers. 2019. Available online: https://www.mitacoolingtechnologies.com/wp-content/uploads/2021/07/PMS-K12-Open-Circuit-Cooling-Towers-for-Small-Medium-Plants-Catalog-EN.pdf (accessed on 25 January 2022).
- MITA Cooling Technologies S.r.l. PME-E-K12-Open-Circuit-Cooling-Towers. 2021. Available online: https://www.mitacoolingtechnologies.com/wp-content/uploads/2021/07/PME-E-K12-Open-Circuit-Cooling-Towers-for-Medium-Large-Plants_Catalog-EN.pdf (accessed on 25 January 2022).
- MITA Cooling Technologies S.r.l. PMM-Cooling-Towers. 2021. Available online: https://www.mitacoolingtechnologies.com/wp-content/uploads/2021/03/PMM-Cooling-Towers-for-Large-Systems-ENG-1.pdf (accessed on 25 January 2022).
- Multi Kühlsysteme GmbH. Hybride Trockenkühler. Available online: https://www.multi-kuehlsysteme.de/trockenkuehler/hybride-trockenkuehler/ (accessed on 25 January 2022).
- Multi Kühlsysteme GmbH. Kühltürme. Available online: https://www.multi-kuehlsysteme.de/kuehltuerme/ (accessed on 25 January 2022).
- Multi Kühlsysteme GmbH. Trockenkühler für die Trockene und Hybride Kühlung. Available online: https://www.multi-kuehlsysteme.de/trockenkuehler/ (accessed on 25 January 2022).
- Multi Kühlsysteme GmbH. Trockenkühler in Horizontaler Bauform. Available online: https://www.multi-kuehlsysteme.de/trockenkuehler/trockenkuehler-in-horizontaler-bauform/ (accessed on 25 January 2022).
- Multi Kühlsysteme GmbH. Trockenkühler in V-Bauform. Available online: https://www.multi-kuehlsysteme.de/trockenkuehler/trockenkuehler-in-v-bauform/ (accessed on 25 January 2022).
- Refrion S.r.l. Adiabatic Systems. 2018. Available online: http://rms.refrion.com/web/profiles/refrion/images/file/2438125098.pdf (accessed on 28 January 2022).
- SECESPOL Sp. z o.o. D.COOL Dry Cooler. 2020. Available online: https://www.secespol.com/pub/en/uploaddocs/katalogi/secespol-dry-cooler-1-2020-en-web-spread.pdf (accessed on 25 January 2022).
- Secon GmbH. Trockenrückkühler. Available online: https://secon-gmbh.com/assets/uploads/dateien/downloads/09-rueckkuehler-l.pdf (accessed on 25 January 2022).
- SPX Cooling Technologies Inc. Marley CP Cooling Tower: Induced Draft Counterflow Design. 2018. Available online: https://spxcooling.com/wp-content/uploads/uk_SPEC-CP-18-1.pdf (accessed on 1 February 2022).
- SPX Cooling Technologies Inc. Marley CP Kühlturm: Betrieb—Wartung. 2018. Available online: https://spxcooling.com/wp-content/uploads/de_ZUM_Z1045767_DEU_00.pdf (accessed on 2 February 2022).
- SPX Cooling Technologies Inc. Marley MCW Kühlturm: Installation—Betrieb—Wartung. 2019. Available online: https://spxcooling.com/wp-content/uploads/de_Z0582964_E-1.pdf (accessed on 1 February 2022).
- SPX Cooling Technologies Inc. Marley MD Cooling Tower: Installation—Operation—Maintenance. 2019. Available online: https://spxcooling.com/wp-content/uploads/Z0602117_G.pdf (accessed on 1 February 2022).
- SPX Cooling Technologies Inc. Marley MD Kühlturm: Technische Daten und Spezifikationen. 2019. Available online: https://spxcooling.com/wp-content/uploads/de_MD-TS-19A.pdf (accessed on 1 February 2022).
- SPX Cooling Technologies Inc. Marley MH Fluid Cooler: Installation—Operation—Maintenance. 2019. Available online: https://spxcooling.com/wp-content/uploads/Z0920512_E.pdf (accessed on 1 February 2022).
- SPX Cooling Technologies Inc. Marley MH Flüssigkeitskühler: Technische Daten und Spezifikationen. 2019. Available online: https://spxcooling.com/wp-content/uploads/de_MHF-TS-19.pdf (accessed on 1 February 2022).
- SPX Cooling Technologies Inc. Marley NC Stahl-Kühlturm. 2019. Available online: https://spxcooling.com/wp-content/uploads/de_Z0628276_E.pdf (accessed on 1 February 2022).
- SPX Cooling Technologies Inc. Marley NC Stahl Kühlturm: Technische Daten. 2020. Available online: https://spxcooling.com/wp-content/uploads/de_TECH-NC-20.pdf (accessed on 1 February 2022).
- Stefani S.p.A. Scirocco—Dry Cooler Catalogue. 2016. Available online: https://www.stefaniexchangers.com/download/stefani-spa-catalogue-scirocco-dry-cooler-EN.pdf (accessed on 26 January 2022).
- Stefani S.p.A. Zonda—Dry Cooler Catalogue. 2016. Available online: https://www.stefaniexchangers.com/download/stefani-spa-catalogue-zonda-dry-cooler-EN.pdf (accessed on 26 January 2022).
- Stefani S.p.A. Ostro—Dry Cooler Catalogue. 2018. Available online: https://www.stefaniexchangers.com/download/stefani-spa-catalogue-ostro-dry-cooler-EN.pdf (accessed on 26 January 2022).
- Swegon Germany GmbH. Prospekt Wärmetauscher: Verflüssiger und Rückkühler. 2018. Available online: https://www.swegon.com/siteassets/_product-documents/grobklima/prospekt_warmetauscher_2018-01.pdf (accessed on 26 January 2022).
- Thermofin GmbH. Produktdatenblatt Adiabte Vorkühlung. 2020. Available online: https://www.thermofin.de/download.php?download=End-Produktdatenblatt-Adiabate-Vork%C3%BChlung-08-2020 (accessed on 26 January 2022).
- ThermoKey S.p.A. Dry Cooler. 2017. Available online: https://www.thermokey.com/wp-content/uploads/2017/11/ThermoKey-Dry-Cooler_ENG.pdf (accessed on 26 January 2022).
- ThermoKey S.p.A. V—Tower. 2018. Available online: https://www.thermokey.com/wp-content/uploads/2018/10/Brochure-Vhybrid-ENG_web.pdf (accessed on 26 January 2022).


| Analyzed Parameters 1 | Dry | Wet | Hybrid | Operating Points | Reference Object(s) | |
|---|---|---|---|---|---|---|
| DIN 15240 [19] (p. 53) | Pf,el | X | X | ns | example values | |
| EC [14] (p. 40) | ; Pf,el; ; a; | X | X | X | 1 | example values |
| Eurovent [20] (p. 9) | Pf,el | X | 3 | efficiency targets | ||
| Hincke et al. [17] | ; a | X | X | X | variation | example values |
| Qi et al. [21] | X | variation | neural network | |||
| Schlei-Peters [11] | ; Pf,el; | X | variation | modeling | ||
| Schulze et al. [22] | Pf,el; ; | X | variation | simulation | ||
| Wang et al. [12] | ; Pf,el; ; a; | X | variation | experiment + simulation |
| Parameter | Symbol | Unit | |
|---|---|---|---|
| Item Details | name of manufacturer | [-] | [-] |
| name of cooler model | [-] | [-] | |
| type of cooling tower | [-] | [-] | |
| Resource Consumption | fan power 1 | Pf,el | kWel |
| wetting pump power 1 | Pp,el | kWel | |
| specific electricity demand (calculated) 1 | qel | kWel/kWth | |
| freshwater consumption 1 | m3/h | ||
| specific freshwater consumption 1 | w,fresh,i/ | m3/h/kWth | |
| Utility | nominal heat load 1 | kWth | |
| cooling medium (coolant) | [-] | [-] | |
| coolant volume flow rate | m3/h | ||
| coolant inlet temperature | °C | ||
| maximum coolant inlet temperature | °C | ||
| coolant outlet temperature | °C | ||
| minimum coolant outlet temperature | °C | ||
| range z | z | K | |
| Physical Constraints | ambient DBT (DBT) | °C | |
| relative humidity | φ | % | |
| ambient WBT | °C | ||
| Technical Constraints | approach a | a | K |
| switchover point (hybrid) | °C | ||
| fan arrangement | [-] | [-] | |
| flow arrangement | [-] | [-] | |
| area × height (L × W × H) | A·H | mm2·mm | |
| weight | m | kg | |
| thermal capacity per area (calculated) 1 | /A | kWth/m2 | |
| thermal capacity per weight (calculated) 1 | /m | kWth/kg | |
| nominal air volume flow rate 1 | m3/h |
| Operating Point 1 | Dry | Open Wet | Closed Wet 2 | Wetted Hybrid 2 | Sprayed Hybrid 2 | Mats Hybrid 2 |
|---|---|---|---|---|---|---|
| ϑw,i/ϑw,o/ϑD/WBT [°C] | Pel | Pel | Pel | Pel | Pel | Pel |
| 32/27/21 | ns | 0.012–0.018 | ns | ns | 0.020–0.039 | 0.028–0.050 |
| 32/26/21 | ns | 0.013–0.021 | 0.045–0.058 | ns | ns | ns |
| 35/30/24 | ns | 0.012–0.018 | 0.025–0.031 | ns | ns | ns |
| 36/30/21 | ns | ns | ns | 0.045–0.05 | ns | ns |
| 40/35/25 | 0.014–0.029 | ns | ns | ns | ns | ns |
| Operating Point 1 | Dry | Open Wet | Closed Wet | Wetted Hybrid | Sprayed Hybrid 1 | Mats Hybrid 1 |
|---|---|---|---|---|---|---|
| ϑw,i/ϑw,o/ϑWBT [°C] | w,i | w,i | w,i | w,i | w,i | w,i |
| 32/27/21 | 0 | ns | ns | ns | 3.32–4.60 | 2.06–2.69 |
| Parameter | Source | Dry | Open Wet | Closed Wet | Wetted Hybrid | Sprayed Hybrid | Mats Hybrid |
|---|---|---|---|---|---|---|---|
| approach a [K] | this study | 8.5–11.8; 10 | 3.9–6; 5 | 4.5–9.5; 6.5 | 5.3–9.5; 7 | 6–7; 6.5 | ns–7; 6 |
| literature | 7–8 1 8–15 2 | 4 1 4–7 3 | 3 2 | 4–7 3 4–5 4 | 6–8 2 | 5–8 2 | |
| range z [K] | this study | 5–5; 5 | 5–10; 6 | 5–15; 6.5 | 5–7; 6 | 7–15; 10.5 | 5–5; 5 |
| literature | 4–10 5 5–6 3 | 4–10 5 5–6 3 | 4–10 5 5–6 3 | 4–10 5 5–6 3 | 4–10 5 5–6 3 | 4–10 5 5–6 3 | |
| [°C] | this study | 75–95; 90 | 55–78; 68 | 82–91; 85 | ns | ns | 60–95; 78 |
| literature | ns | 85 6 | ns | 40 4 | ns | ns | |
| [°C] | this study | 38.5–41.8 | 24.9–27 | 25.5–30.5 | 26.3–30.5 | 27–28 | ns |
| literature | 40–45 7 | 27–31 7 | 28–35 7 | 28–35 7 | ns | ns | |
| [°C] | this study | - | - | - | 13.5–18; 16 | 18–20; 19.5 | 23–25; 24 |
| literature | - | - | - | 20–25 8 2–18 4 | 20–25 8 26 3 | 20–25 8 | |
| qel [kWel/kWth] | this study | 0.014–0.029 a | 0.012–0.018 b 0.013–0.021 c 0.012–0.018 d | 0.045–0.058 c 0.025–0.031 d | 0.045–0.050 f | 0.020–0.039 a | 0.028–0.050 a |
| literature | 0.045 9 | 0.018–0.021 9 0.014–0.028 b,10 | 0.033–0.040 9 0.031–0.067 e,10 | ns | ns | ns | |
| w,fresh,i [l/h/kWth] | this study | 0 | ns | ns | ns | 3.32–4.60/3.97 | 2.06–2.69/2.25 |
| literature | 2.5–4.5 4 2 7 | 2.5–4.5 4 | 1.6–2.0 4 1.5 7 | ns | ns |
Disclaimer/Publisher’s Note: The statements, opinions and data contained in all publications are solely those of the individual author(s) and contributor(s) and not of MDPI and/or the editor(s). MDPI and/or the editor(s) disclaim responsibility for any injury to people or property resulting from any ideas, methods, instructions or products referred to in the content. |
© 2023 by the authors. Licensee MDPI, Basel, Switzerland. This article is an open access article distributed under the terms and conditions of the Creative Commons Attribution (CC BY) license (https://creativecommons.org/licenses/by/4.0/).
Share and Cite
Wenzel, P.M.; Mühlen, M.; Radgen, P. Free Cooling for Saving Energy: Technical Market Analysis of Dry, Wet, and Hybrid Cooling Based on Manufacturer Data. Energies 2023, 16, 3661. https://doi.org/10.3390/en16093661
Wenzel PM, Mühlen M, Radgen P. Free Cooling for Saving Energy: Technical Market Analysis of Dry, Wet, and Hybrid Cooling Based on Manufacturer Data. Energies. 2023; 16(9):3661. https://doi.org/10.3390/en16093661
Chicago/Turabian StyleWenzel, Paula M., Marc Mühlen, and Peter Radgen. 2023. "Free Cooling for Saving Energy: Technical Market Analysis of Dry, Wet, and Hybrid Cooling Based on Manufacturer Data" Energies 16, no. 9: 3661. https://doi.org/10.3390/en16093661