Abstract
Cities are currently responsible for an important part of energy consumption and greenhouse gas emissions, justifying the need to develop measures to help them become more sustainable. One of those measures can be to address under-utilized assets in cities, such as derelict buildings with high potential for rehabilitation, and the establishment of new residence hubs within cities. Consequently, this work establishes a novel framework for evaluating the impact of rehabilitating these buildings in an urban area in Lisbon, considering the energy consumption associated with the usage of the dwelling as well as the impact on mobility, since it was considered that these buildings will be occupied by people who currently work nearby but live in the outskirts of Lisbon, favouring an urban planning of proximity between home and work. To this extent, a methodology was developed for selecting the buildings to be analysed and the commuting movements to be replaced. Then, buildings were simulated in an urban building energy modelling (UBEM) tool, considering three rehabilitation scenarios, and the required primary energy, CO2 emissions, and costs were calculated. Regarding mobility, three new scenarios were compared with the current scenario. The results obtained confirm the high potential savings from the rehabilitation of derelict buildings and in the best-case scenario—corresponding to the rehabilitation considering envelope insulation, the installation of efficient windows, and the adoption of a heat pump together with a mobility standard targeting 15 min cities—reductions of 76% in primary energy and 84% in CO2 emissions were achieved.
1. Introduction
Currently, more than 50% of the world’s population lives in cities, and this percentage is expected to increase by 2050. Additionally, urban areas now account for 80% of global GDP, as well as 75% of energy consumption and 70% of CO2 emissions [1]. In this sense, cities will play a fundamental role in the energy transition to overturn climate change, with building and mobility sectors being crucial areas to achieve these goals.
Furthermore, most buildings in Europe are far away from carbon neutrality targets, with more than 70% of its building stock considered to be energy inefficient. At the same time, the European Environment Agency [2] argued that built-up areas grew at a higher pace than population, concluding that “over the past 20 years low density suburban development in the periphery of Europe’s cities has become the norm, and the expansion of urban areas in many Eastern and Western European countries has increased by over three times the growth of population” [3]. The urban sprawl increment has serious environmental, economic, and social consequences; it affects natural resources and ecosystem services, and leads to higher costs for provisioning services, such as public transport, resulting in lower social cohesion [4].
Institutions such as European Spatial Development Perspective (ESDP) [5], or sustainability rating systems such as LEED [6], strongly encourage the pursuit of the concept of the ‘compact city’ (or city of short distances) as an approach to controlling the physical expansion of cities, integrating land-use and transport more effectively, and reducing the physical separation of daily activities. Compact neighbourhoods use land and infrastructure efficiently, avoid the fragmentation of wildlife habitats and farmland loss, conserve economic resources, and slow the spread of low-density development across a region’s landscape. Residents enjoy convenient access to shops, services, and public spaces within walking and bicycling distance, and, when people choose to drive, they take shorter automobile trips, saving time and avoiding emissions. Compact development also facilitates access to public transportation. Likewise, the 15 min city concept has gained relevance to enhancing cities’ sustainability [7], as these cities are characterized by their residents being able to go about their daily routines in a radius distance achievable by 15 min on foot or bicycle. The use of soft mobility modes tackles traffic congestion and air pollution (particles), some of the most significant concerns derived from compact cities.
In Lisbon, the urban sprawl has been motivated by the extreme difficulty the Portuguese population faces acquiring or renting houses within the city. Different causes justify this, including: the median sale value per square meter of family dwellings in the city increased by around 76% between 2016 (1875 EUR/m2) and 2021 (3296 EUR/m2) (INE 2022b); long-term housing leases have suffered a reduction of 75% between 2015 and 2020 (supported by the growth of short-renting associated with high levels of tourism); and the purchasing power of foreign investors completely outweighs the purchasing power of Portuguese citizens (the median price of housing purchased by foreign buyers is more than 3 times that of national buyers) [8].
Retrofitting derelict houses constitutes a valuable solution by providing more housing opportunities and taking advantage of the already occupied space for buildings in the city. The rehabilitation of derelict buildings will increase the number of households available in the city centre area and could reduce the market price or be used for lower rent housing mechanisms (already established by the Portuguese state or Lisbon Municipality).
Information on the number of vacant dwellings is only available for some countries in the EU. Housing stock and construction indicators from [9] suggests that the percentage values of vacant dwellings out of the total dwellings in urban areas ranges from 3–4% in Germany to 13–15% in Portugal, Spain, and Slovenia.
Data from the Lisbon City Council indicates that, in 2020, Lisbon had approximately 3000 derelict buildings in the city, corresponding to 7301 dwellings. The state of conservation of these buildings is, for most of them, “bad” or “very bad” (61.6%) [10].
Facing this, cities must adopt different measures to accommodate the expected population increase, and the rehabilitation and reuse of derelict buildings is an effective way to reduce urban sprawl and compacting existing cities [11] by making use of already built areas in the cities.
Background on Urban Regeneration of Derelict Buildings Considering Mobility Actions
Urban energy modelling allows the analysis of different areas of urban policy, such as studying the impact of different intervention measures and helping politicians and other stakeholders to understand the most appropriate measures to reduce energy consumption and achieve carbon reduction goals. Urban building energy modelling (UBEM) is defined as a bottom-up, physics-based approach used to simulate thermal and energy performance for neighbourhoods and cities. The overall goals of UBEM are precisely to provide data-driven insights for different urban-level projects, such as urban planning, retrofits and new neighbourhood development, and carbon reduction strategies, among others [12,13].
In the context of building adaptation projects, different terminologies are used in the literature (e.g., refurbishment, retrofitting, rehabilitation, renovation, among others) and, in practice, causing lack of clarity. In this sense, Shahi [14] developed, in 2020, a definition framework for a precise categorization of building adaptation projects based on an extensive literature review. This study distinguished first, at a high-level, refurbishment from adaptive reuse, as the latter implies a change in a building’s function or use. Then, adaptive reuse can be divided in building conversion or material reuse, whereas refurbishment encompasses retrofitting (associated with energy improvements), renovation (associated with architectural improvements), and rehabilitation (associated with structural improvements).
In 2019, Fonseca [15] developed a model (CEA) for the characterization of energy consumption patterns of buildings at the level of neighbourhoods and municipalities, presenting a practical case for the analysis of energy efficiency measures in buildings and urban planning; showing, for each study area, the energy reductions due to the upgrade of electrical equipment, improvements of the cooling system, and rehabilitation of the building envelope; and also simulating, for a zone, four scenarios with different options of urban development.
In 2017, Chen [16] used CityBES to simulate the impact of five energy conservation measures on commercial buildings and the resulting cost savings, showing that, by applying all measures, you can reduce the energy consumption by 23 to 38%, and that improving HVAC systems or replacing windows is not compensatory in San Francisco, given the city’s mild climate.
Furthermore, there are several studies on the possible impacts from retrofitting derelict buildings and urban regeneration and the reuse of empty urban space to accommodate the population increase in cities. In 2017, Gregório [17] estimated the impact that urban retrofitting has on energy savings in 10 historic neighbourhoods in Portugal, concluding that Lisbon has the greatest potential, achieving energy savings of 7.9 kgoe/m2 of useful area per year.
Berzolla [18] stated in 2022 that, although building retrofit constitutes a valuable step to achieve net zero emissions reduction goals in most municipalities, the current retrofitting rate of 1% is not nearly enough to achieve the full technical potential by 2050, when most communities’ net zero targets are set. The authors integrated UBEM workflows with a complementary retrofit adoption model that is based on U.S. census data and underlying adoption rates from their literature review, and consider home ownership, payback times, and retrofit costs in relationship to household income. Authors tested 13,100 residential buildings in Oshkosh, WI, and found that—even with optimistic adoption rates—projected emissions reductions by 2050 fall below local carbon reduction goals due to less realistic retrofit rates considered when defining the goals.
In 2011, Dulal [19] analysed the impact of urban morphology (housing density) and housing and employment offers to reduce car dependency and greenhouse gas emissions, concluding that, in the long term, adequate urban planning can be very effective through the modal transfer from private car to public transport and pedestrian and cycling mobility, especially for high density building areas. In 2020, Salter [20] used urban building energy modelling (UBEM) tools to compare the relative effectiveness of policies aimed at improving existing technologies at the building level and infill redevelopment. This study concluded that the first has only a moderate impact on energy and emissions reduction, compared to the second. In 2022, Jewell [21] studied the development of an energy infrastructure in the Santo António valley in Lisbon, using an UBEM tool to model energy services at the neighbourhood level, i.e., the heating and cooling, domestic hot water and electricity needs. This study demonstrated the impact of building retrofit on heating needs, showing that the renovation of the building envelope enables reductions of 15% in energy consumption and increases building occupants’ thermal comfort.
In 2018, Kim [22] assessed different typologies of urban vacant land to help policymakers, planners, and designers utilize them to the best advantage. This study was based on a literature review of urban vacant land typologies, a broad field assessment of vacant land in Roanoke (Virginia, USA), and a detailed field assessment of the different types of vacant land to test the new typology. In this way, vacant land in Roanoke was divided in five categories: post-industrial sites, derelict sites, unattended with vegetation, natural sites, and transportation-related sites. For the derelict sites, this study considered that they have potential to be used as community assets, as their redevelopment could improve the property value, lower illegal activities, improving safety, and decrease the municipal budget associated with the maintenance of derelict buildings. In this sense, municipalities can provide incentives, as tax abatements, to encourage the redevelopment of derelict sites.
The literature review shows a considerable amount of research related to vacant buildings. However, the focus is almost exclusively directed to the building itself, not accounting other benefits that may be achieved with the rehabilitation, that could be, for example, mobility related. This work fills this gap by considering a broader approach, where the rehabilitation of the vacant buildings is a step for a more sustainable urban life, based not only on energy efficient retrofit, but also on a proximity urbanism where the inhabitants of these buildings live close to their workplace, in contrast with suburbanization that requires long commutes. Consequently, this work evaluates the combined building and mobility impacts of the retrofit of derelict buildings, considering the operational energy consumption, CO2 emissions, and associated costs.
2. Materials and Methods
To achieve the desired objectives, it was initially necessary to define a framework to select the buildings to be simulated using the UBEM tool (City Energy Analyst (CEA) [23]) and the commuting movements to be replaced. Next, the scenarios to be studied were defined. Finally, the key performance indicators and the quantification of impacts analysed is explained. Figure 1 presents the steps of this framework.
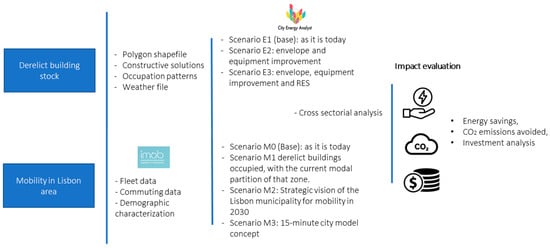
Figure 1.
Methodology: building stock urban simulation and mobility analysis impact.
2.1. Derelict Building Stock Selection
The case study of this work considers 3 parishes in Lisbon (Beato, Marvila, and Parque das Nações). These parishes are heterogeneous when referring to demographics and construction period. Beato and Marvila present more derelict buildings when compared with the newer area of Lisbon (Parque das Nações).
Due to the high number of derelict buildings in Lisbon, a selection must be made. In the shapefile considering these 3 parishes of Lisbon [24], 153 derelict buildings for residential use were identified. It was then necessary to establish a criterion for selecting derelict buildings, since these buildings are widely dispersed throughout the city. In this way, the proposed methodology considered the following conditions:
- The buildings must be in consolidated areas, that is, areas where an urban structure is already defined, since these buildings would be more likely to be rehabilitated. To apply this condition, buildings located in neighbourhoods (national statistical subsections) where the proportion of derelict buildings was greater than 30% were excluded, since these areas have been abandoned, possibly because they do not have the expected conditions for a modern city, e.g., contaminated soils among other reasons.
- The buildings must have a regular format, since in the original georeferenced file several buildings have an irregular shape, some of which having very narrow areas and unrealistic shapes, possibly resulting from errors in the georeferencing of these buildings or again representing old industrial facilities. To this end, we defined the smallest rectangle that must encompass the building, and excluded those where the area of this rectangle is greater than twice the building area of the building. Additionally, buildings polygons with more than 12 vertices were excluded since they would probably correspond to unrealistic shapes.
- Selected buildings must have other derelict buildings in their neighbourhood, in order to promote integrated efforts, which are important to encourage rehabilitation. To apply this condition, we considered only derelict buildings which have 4 or more derelict buildings within a radius of 150 m.
The application of these filters excluded 82% of buildings in the initial set, resulting in 28 buildings to be refurbished.
2.2. Commuting Movements
To select the commuting movements to be replaced, the indicator selection of pendular movements (SMP) was used (Equation (1)) for each zone outside the Lisbon municipality considered in the national survey for mobility IMOB (INE, 2017). These zones defined for each municipality correspond to sets of parishes with similar mobility patterns, according to the IMOB.
The SMP combines the average CO2 emissions (gCO2/Km) of the cars registered in the zones concerned [25] with the car modal share in the trips made from each area to the case study area (where the derelict buildings analysed are located) and with the representativeness of these trips multiplied by the trip length between zones. This value is an approximation, as it only considers the emissions associated with car trips, which are the ones to be avoided by the shift in location of residence.
This study considers replacing trips with high SMP to the case study area, by assuming that those families would be relocated to the derelict buildings to be refurbished. Since there are 44 zones outside the Lisbon municipality, only the five highest emission zones were selected: zone 2 of Mafra municipality; zones 1 and 4 of Sintra municipality; zone 2 of Loures municipality; and zone 1 of Vila Franca de Xira municipality (see Figure 2).
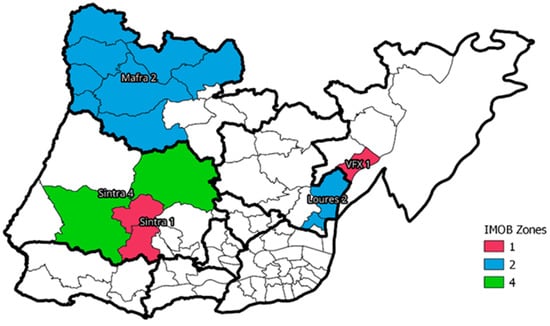
Figure 2.
IMOB zones in Lisbon north metropolitan area.
3. Intervention Scenarios
This section presents the various scenarios considered for buildings retrofit, mobility shift patterns, and their combination (cross-sectorial).
3.1. Buildings
For buildings, three scenarios were studied (as detailed in Table 1), by considering costs, thermal transmission coefficients of envelope constructive solutions, and HVAC and hot water equipment efficiencies taken from [26]):

Table 1.
Building intervention scenarios: thermal coefficient values and equipment efficiencies.
- Scenario E1: it was considered that the characteristics of the existing buildings were maintained (e.g., gross floor area and number of floors). The currently derelict buildings would have only the minimally necessary rehabilitation to become habitable, with no improvements from a thermal point of view in the building envelope. As for the equipment, the adoption of electric heaters per dwelling and a gas heater for DHW was considered for heating.
- Scenario E2: it is considered that the buildings will undergo extensive rehabilitation and retrofit with an increase in the number of floors to the maximum number of floors existing in their neighbourhood, leading to an increase in the number of dwellings (and occupation). The opaque envelope will be thermally insulated, and windows replaced. Electric heaters are replaced by air conditioning.
- Scenario E3: As in the previous case, the buildings will undergo extensive rehabilitation and retrofit with an increase in the number of floors to the maximum existing in their neighbourhood. Higher insulated solutions for the envelope are adopted, as well as better windows, more efficient equipment (for both HVAC and hot water equipment), and a PV system per building (50% of available rooftop area).
These scenarios results are compared with the average values for the Portuguese population, obtained from [27], corresponding to a final energy consumption of 7 MWh annually per dwelling, of which 3.4 MWh are electricity consumption. Only natural gas will be considered as a source for the remaining energy consumption (3.6 MWh). The operating cost, taken from the same reference, is EUR 1079 per year. Primary energy, CO2 emissions, and average cost are 9.4 MWh, 1.4 t CO2, and EUR 1193, respectively per dwelling for an annual period and adopting the same investment cost as the one obtained for the E1 scenario.
For the combined scenarios, these values will be referred to, by ease of language, as scenario E0 (this scenario has no correlation with the derelict buildings analysed, it expresses only the average Portuguese building).
3.2. Mobility
To analyse the impact of the retrofit on mobility four scenarios were studied:
- Scenario M0 (Base): This scenario considers the situation prior to the retrofit of the derelict buildings, where people still live in their respective zones with the modal partition currently adopted there.
- Scenario M1: Considers that the derelict buildings analysed in this work are occupied, with the current modal partition of that zone.
- Scenario M2: The strategic vision of the Lisbon municipality for mobility in 2030 is considered [28], where there is a significant decrease in the car modal share. To achieve this goal, partial replacement of car journeys to other means of transport is necessary; we achieve this by adopting the methodology of [29], where, for various distance ranges, the % of trips that are transferred from the car to other modes of transport is assumed.
- Scenario M3: More ambitious version of the previous scenario, where a greater adoption of the soft transportation modes, such as bicycles and pedestrian mobility, is assumed, bringing the current urban area closer to the 15 min city model concept. Thus, the modal share of the car, bus and metro is reduced by 20%, and these trips are distributed between pedestrian and cycling mobility.
The modal shares associated with the different mobility scenarios are presented in Figure 3, where for scenario M0 the average of the five zones considered is used.
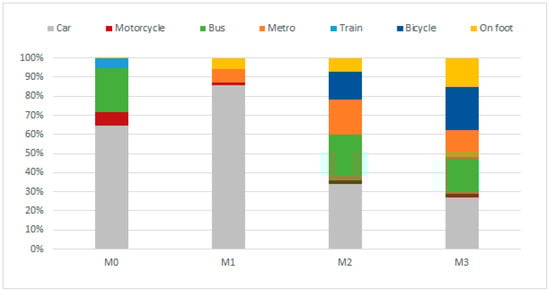
Figure 3.
Modal shares (%) adopted for the different mobility scenarios.
The combination of building and mobility results in 10 new scenarios (mobility scenario M0 cannot be combined with the derelict buildings retrofit scenarios). Finally, mobility scenario M0 is also combined with the average values regarding Portuguese buildings energy consumption. These scenarios will be named, joining the name of the building and mobility scenarios (for example, scenario M1E2 is the combination of scenario M1 for mobility and E2 for the building retrofit).
3.3. Assessment of Impacts
The performance variables aim to evaluate the impact of the previously defined scenarios and were grouped into energy consumption, CO2 emissions, and costs. The cost analysis includes three types of costs: operational, investment, and average costs. Average cost refers to the total cost divided by the solution’s useful life. In this way, for the buildings, a useful life of 20 years was considered for the materials and equipment, while for the mobility, we assumed a useful life of 200,000 km for the car and 20,000 km for the motorcycle.
4. Energy Consumption
4.1. Building Operation
For the buildings, the analysis of annual useful energy (MWh) by type of use and energy source was carried out in the CEA software. The CEA requires inputs concerning buildings shapefile, constructive solutions, HVAC and hot water equipment, use schedules, and meteorological data. The CEA can consider up to three uses per building. Thus, from the IMOB data, the population was analysed by working condition. Since relocation is more attractive for people who work and study, these two cases were considered. In this case, 72.3% of the population sample considered was employed and 27.7% was still studying.
4.2. Commuting Movements
The required energy annually for the commuting movements per capita, considering the energy spent in the use and production of energy source phase, i.e., the primary energy, also corresponds to a performance variable and will be calculated using Equation (2).
where z corresponds to the zone where the inhabitants live, identifies the fraction of the number of inhabitants of each zone who will live in the currently derelict buildings, and m establishes the transportation modes. Thus, is the modal share of each mode of transport for each zone, the distance travelled per trip (km per zone), considered the same for each mode of transport, and is the primary energy consumption in energy per passenger-kilometre per mode of transport (MJ/(pass·km)).
The annual CO2 emissions of the commuting movements will be calculated considering both the vehicle use and energy source production phases (Equation (3)).
where are the vehicle use and energy source production CO2 emissions in gram per passenger-kilometre per mode of transport (g/(pass·km) for each zone and the remaining variables have the meanings previously presented for the primary energy.
Finally, the annual operational, investment, and average cost for mobility per capita will also be considered, (Equations (4)–(6)):
where is the operational cost factor per transportation mode per zone, corresponds to the investment factor per transportation mode, represents the total cost factor per transportation mode and zone, all in euros per passenger-kilometre (EUR/(pass·km)), Tm (km) corresponds to the total kilometres of the useful life of each transport mode, and the remaining variables have the meanings shown in the energy section. Only investment costs for cars and motorcycles were calculated, as the remaining means of transportation do not require investments.
Table 2 indicates the factors for the different transport modes necessary to calculate the primary energy, emissions, and investment costs, except for the emission factor for the car indicated in Table 3. This table also presents the variables xz and dz for the different zones. Finally, Table 4 shows the factors needed to calculate operating costs. These values were obtained based on the work of [29] for the use phase, and, for the production phase, the same primary energy factors and CO2 emissions by final energy were used in as the building section for electricity. For the remaining fuels, data from [30] were considered. The value of the operating cost for the metro, train, and bus was calculated based on the cost of the metropolitan pass in AML (EUR 40 per capita). The factor for the average cost is the sum of the factor for the investment and the operating cost.
Table 2.
Factors for the different modes of transport.
Table 3.
Fraction of inhabitants in scenario M0, distance per trip, and CO2 emissions in the various zones.
Table 4.
Operating cost factor (EUR/pass·km).
We considered for the combined analysis a total number of 179 dwellings, the maximum number of dwellings at the building level. The number of dwellings in each rehabilitated building was determined based on the occupancy rate in persons per square metre from the CEA software: 30 m2/person for multi-residential buildings and 50 m2/person for single-residential buildings. Thus, based on the area of each building, the software was able to calculate its occupancy. In addition, we assumed a figure of 2.25 persons per dwelling based on an analysis of Portuguese census data. In this way, the buildings analysed have on average 203 m2 per floor and 1.9 floors. In scenarios E2 and E3, the average number of floors increases to 3.5. In the case where the rehabilitated buildings do not have as many dwellings, as in scenario E1, which has only 82 housing units, it is considered that the families living in the remaining number of dwellings stay in their original area, with the average housing energy consumption. Since the mobility results are given per capita, it is necessary to pass them to a dwelling basis. Thus, we assumed that 2 of the 2.25 persons per dwelling would be of working age and, therefore, change their mobility pattern.
5. Results
The results are divided between buildings, mobility and combined scenarios.
5.1. Buildings
Figure 4a presents the results of the total and per dwelling annual useful energy (energy that goes towards the desired output of the end-use application [31]) for the different scenarios. It is possible to observe that a large useful energy consumption (13 MWh) in scenario E1 is primarily due to heating needs. This is a consequence of the poor thermal insulation, as the rehabilitation defined did not consider any improvement in the envelope. Thus, the better insulation and windows of the E2 scenario and, especially, the E3 scenario result in a reduction in useful energy for heating. The reduction in useful energy achieved in scenario E3 compared to scenario E2 is of 0.8 MWh, a decrease of 14%. In the total results, the high energy need for heating in scenario E1 is also observed, which makes the useful energy required in this scenario approximately equal to that of scenario E2. However, the first scenario only has 46% of the number of dwellings compared to the second. In scenario E3, a reduction of 141 MWh in useful energy (−13%, compared to E1) is achieved.
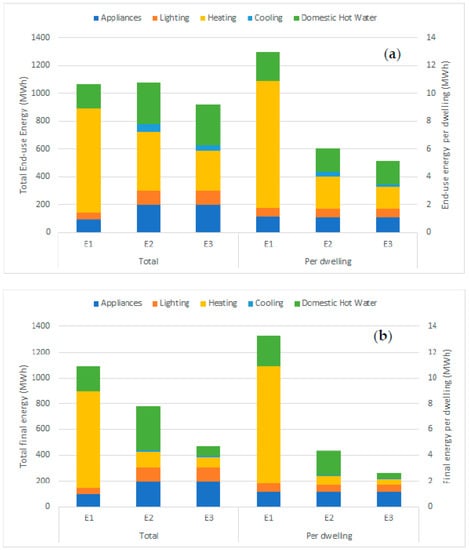
Figure 4.
Useful (a) and final energy (b) by end-use for the buildings scenarios (annual).
Figure 4b displays the annual final energy (consumed by end users [31]) showing that the results previously achieved per dwelling are now amplified. This is due to the adoption of the air conditioning and heat pump (more efficient equipment). Reductions of 9 MWh (−67%) and 11 MWh (−80%) are achieved per dwelling compared to scenario E1. Hence, in addition to the insulation adopted, the choice of equipment is also a relevant factor in the retrofit of these buildings.
Figure 5 presents the final and primary annual energy consumption per source for the different scenarios, showing the total and per dwelling values. The E1 scenario has a high electricity consumption, since it was utilised electric radiators for heating. The consumption of natural gas in this scenario is due only to the domestic hot water needs, as in the E2 scenario, and corresponds to 18% of the energy. The E3 scenario only uses electricity, unlike the E2 scenario where natural gas is the source of 44% of energy. The last scenario has a photovoltaic solar system, allowing reduced dependence on the electricity grid, making up 25% of the electricity consumption, and enabling the sale of the solar surplus.
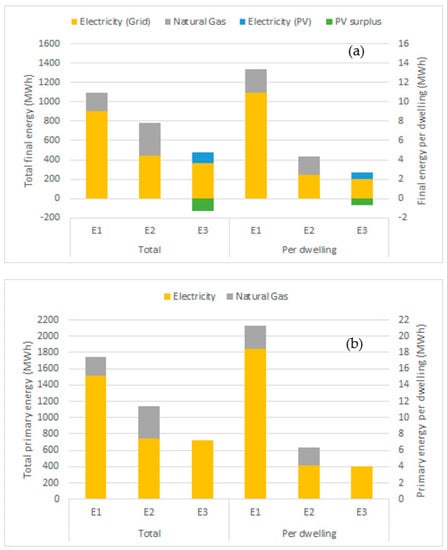
Figure 5.
Final (a) and primary energy (b) by source for the buildings scenarios (annual).
Overall, scenario E1 consumes 1744 MWh of primary energy, while scenarios E2 and E3 consume, respectively, 1141 MWh and 727 MWh, achieving a reduction of 35% and 58%, even though scenarios E2 and E3 have more than twice the housing units as in the E1 scenario.
Compared to the average annual energy consumption per dwelling in Portugal of 7 MWh and 9.4 MWh for the final and primary energy, respectively, there was a significant increase in the first scenario. It should be stated, however, that these reference average consumption values reflect the energy poverty issue that severely affects Portugal [32]. In fact, one of the keys aspects that contributes to Portuguese fuel poverty is related to the low use of acclimatization systems due to economic and behavioural reasons. In this work, better comfort standards were considered, justifying this discrepancy between real and modelled values. Thus, E2 and E3 retrofits are important to not only reduce energy consumption but also increase the current thermal comfort of households.
Table 5 shows the emissions in the different scenarios. Even with the increase in the number of dwellings, the scenarios E2 and E3 allow a considerable reduction of CO2 emitted (also higher in E3 due to the adoption of the photovoltaic solar system).
Table 5.
Carbon dioxide emissions for the buildings scenarios (annual).
Compared to the emissions associated with the average energy consumption in Portugal (1.4 t CO2 per dwelling), the importance of E2 and E3 retrofit options is reinforced.
To complete the analysis, it is necessary to consider the investment cost of the defined retrofits, as well as the operational cost, shown in Table 6. In scenario E1, the investment cost is quite low, since it was considered only necessary to purchase the equipment for space heating and domestic hot water. The photovoltaic solar system contributed to lower operating costs for E3.
Table 6.
Investment, operational and average costs for the buildings scenarios (annual).
The cost adjusted to the number of dwellings reflects the decrease in average cost for the retrofitted E2 and E3 scenarios, representing a reduction of nearly EUR 770 per dwelling per year, a considerable value for many families. Thus, this reinforces, once again, the importance of the adoption of energy-efficient solutions, which allow a reduction in energy costs of households per year. On the negative side, the high investment costs, about EUR 25,000 in scenario E2 and EUR 30,000 in scenario E3 per dwelling, may persuade some families and investors to choose less efficient solutions.
The operational cost associated with energy consumption in Portugal is EUR 1079 per dwelling, thus showing that E2 and E3 retrofits not only reduce energy and emissions, but also reduce energy bills. The average cost is EUR 1193, however, it is important to reinforce once again that the comfort standards adopted are different. Thus, the cost of E2 and E3 retrofits may be higher than the current costs; however, higher energy comfort within the dwelling will also be obtained.
Table 7 summarizes the results obtained at the building level and shows the price paid for energy and emissions reduced.
Table 7.
Energy, emissions, and costs for the building’s scenarios.
It can be concluded that scenario E3 has the best cost–benefit ratio, both in terms of energy and emissions, despite having an average cost slightly higher than the E2 scenario. Given the competitiveness between these two scenarios in relation to costs, it may be important to create aid mechanisms that favour the adoption of the scenario E3 solutions in order to guide cities towards more energy efficient and low-carbon options. It is also interesting to note that scenario E3 allows a reduction of approximately 16% in the cost per energy saved compared to the E2 scenario, while the reduction of the cost for avoided emissions is around 28%.
5.2. Mobility
The annual primary energy consumed per capita on daily commuting is shown in Table 8. The M0 scenario, corresponding to the current scenario, was the scenario with the highest consumption, as would be expected given the distance of travel and the great dependence on the car in these commuting movements. The M1 scenario already presents a very significant reduction in energy consumption (−76%), which might not be expected, as this scenario increases the car dependence for the home–work path. Thus, the distance from commuting movements represents a great contribution to energy consumption. In the M2 scenario, the adoption of more sustainable and efficient transportation allowed an even greater reduction in energy consumption, with a decrease of 0.6 MWh compared to the previous scenario (−35%), and 6.2 MWh compared to scenario M0 (−85%). In scenario M3, there was a reduction of three percentage points from the previous scenario, i.e., a saving of 88% of energy compared to the base scenario. The reduction for this last scenario compared to the M1 scenario was 47%, and 18% for the M2 scenario, showing that the adoption of the 15 min cities model can reduce almost to half the energy associated with the current mobility scenario in Lisbon 3.
Table 8.
Primary energy per capita and CO2 avoided for the mobility scenarios (annual).
Table 9 presents annual emissions per capita for the different mobility scenarios. As it can be seen, it is also in the current scenario where emissions are higher, for the same reasons indicated earlier for the primary energy. The adoption of more efficient transport modes and 15 min cities reduces the emissions significantly. It is noteworthy that, even in the M1 scenario, emissions already show a very significant reduction (−76%), demonstrating the impact of an urban planning focused on the proximity between home and work. In relation to this scenario, there is a reduction of 136 kg of CO2 per capita (−36%) for scenario M2 and a reduction of 184 kg of CO2 per capita (−49%) for scenario M3. In this last scenario, there is a reduction of 48 kg of CO2 emitted (−20%), compared to scenario M2.
Table 9.
Investment, operational and average cost per capita for the mobility scenarios (annual).
Finally, the annual costs per capita associated with each scenario are shown in Table 8. The required investment increased in scenario M1, though decreasing in the remaining scenarios, relative to scenario M0. This is due to the modal share of individual motor vehicles, i.e., cars and motorcycles, since only these have an investment cost associated. On the other hand, the operating cost presents a decreasing trend in the different scenarios, the much higher value in the M0 scenario being noteworthy. This scenario, even with, on average, a modal share of individual motor vehicles lower than the M1 scenario, has a much longer distance to travel, which corresponds to higher fuel expenditures. For the mobility costs, contrary to what occurs with the results at the building level, there is not an inverse proportionality between the operational cost and the necessary investment, as the scenario that has the lowest operational cost has also the lowest investment cost.
The average cost, calculated considering the investment distributed over the car/motorcycle’s life, also shows a behaviour similar to the operating cost. Thus, for scenario M1, even with a higher acquisition cost than scenario M0, the reduction in operational cost is of such magnitude that it corresponds to a 73% decrease in the average cost. The remaining scenarios, which have a greater decrease in the modal share of the car, are also able to reduce the average cost by 12 percentage points for the M2 scenario, and by 15 percentage points for the M3 scenario, compared to the M1 scenario.
Thus, it is possible to realize that the reduction of commuting distance, as well as the adoption of sustainable transport modes, enables not only a reduction in energy and emissions, but also the cost associated with mobility. It is noteworthy that these gains are higher in the M3 scenario, showing the potential of the 15 min city model and the adoption of active transportation means, which has other positive externalities, such as the increase in physical exercise performed, contributing to a healthier lifestyle.
Table 10 presents the results for the price paid for energy and emissions avoided. Thus, the most economically effective scenario to reduce energy and emissions is the M3 scenario, closely followed by the M2 scenario, whose adoption would already have substantial gains compared to the M1 scenario.
Table 10.
Cost per energy savings and emissions avoided.
Hence, it is important to develop measures enabling this more concentrated urbanism, starting with that analysed in this work; that is, the rehabilitation and retrofit of the derelict buildings allowing an increase in the housing supply, among other measures aimed at reducing the cost of buying or renting near working areas. Measures with the objective of improving the modal share of bicycles and pedestrian mobility must also be developed to achieve sustainable cities.
5.3. Combined Scenarios
Table 11 presents all the variables of interest for the combined scenarios by dwelling. For each column, a darker colour corresponds to the best-case scenario. The higher primary energy consumption corresponds to the M1E1 scenario, followed by M0E0, M2E1, M3E1, where in the base scenario (M0E0), there is a significant reduction in the building energy consumption and an increase in the mobility component. This scenario has also the highest CO2 emissions. For costs, scenario M1E3 is the one with the highest investment cost, closely followed by scenario M1E2, while lower investments costs are observed for M0E0 scenarios and the set of E1 scenarios. Similarly, to the emissions, the adoption of any of the combined scenarios results in a reduction in the average and operational cost compared to the base scenario (M0E0). Table 11 also shows the cost per energy saved and avoided emissions. The M3E3 scenario has the best cost–benefit ratio in both indicators, achieving a reduction of 76% in the primary energy consumed and 84% in the CO2 emissions. Hence, this scenario is the most appropriate for the sustainable development of cities.
Table 11.
Energy, emissions, and costs for the combined scenarios per dwelling (annual).
5.4. Potential City-Wide Impacts
Currently, in Lisbon, there are 7301 dwellings located in derelict buildings [10]. Thus, following the assumptions and results of this work, the rehabilitation and retrofit of all these housing units would result, for the building component, in a primary energy consumption of about 560 TJ annually according to the standards of scenario E1, 170 TJ for the retrofit standards in scenario E2, and 100 TJ if the solutions of scenario E3 were adopted. Similarly, for carbon dioxide emissions, annual savings are estimated at 10 kt, 17 kt, 6 kt, and 2 kt for the E0, E1, E2, and E3 scenarios, respectively.
As for mobility, the primary energy spent on commuting, considering the same distance per trip from Lisbon 3 (4 km/trip), would be, for the scenarios M1, M2, and M3, approximately 90 TJ, 60 TJ, and 45 TJ, respectively. Applying the same assumptions to the M0 standard energy consumption would be of 400 TJ. However, in this scenario the zones with higher CO2 contributions (high SMP) were selected and, therefore, the value may be an overestimation of the average primary energy spent in AML. As for emissions, the adoption of the M0, M1, M2, and M3 standards would result in a carbon dioxide emission of 23 kt, 5 kt, 3,5 kt, and 2,5 kt, respectively. Similarly, the value for the M0 scenario may be an overestimation. Still, the difference for the M1 scenario is significant, highlighting a great potential for energy and emissions savings. Reducing the weight of the car in commuting movements and adopting the 15 min city model allows these gains to amplified.
To combine the effects of mobility and buildings, it is necessary to add the values of the considered patterns. Thus, if the E3 scenario and M3 mobility pattern are combined, a total primary energy consumption of 150 TJ and 5 kt of CO2 emitted are achieved, compared to the M0E0 scenario, with a primary energy consumption of 600 TJ and CO2 emissions of 30 kt. Thus, the rehabilitation and retrofit of vacant buildings enables the reduction of energy consumption by up to 450 TJ and CO2 emissions by 25 kt, a reduction of 2.5% compared to the 18,000 TJ of total primary energy consumed in Lisbon by the buildings and transport sectors and the 1 Mt of CO2 associated with this consumption [33].
6. Conclusions
This work evaluates the impact of the rehabilitation and retrofit of derelict buildings in Lisbon, considering that they will be inhabited by people who currently work nearby to those buildings, but live in the city outskirts and have a considerably polluting commuting movement. The first step consisted of the selection of the derelict buildings and of the commuting movements to be replaced; hence, a methodology was developed for this purpose. Then, the different intervention scenarios were defined, and the primary energy, CO2 emissions, and associated costs for both mobility and buildings were calculated.
Thus, for buildings, annual primary energy consumption values per dwelling of 21.3 MWh, 6.4 MWh, and 4.1 MWh were obtained for scenarios E1, E2, and E3, respectively. In terms of annual CO2 emissions, results of 2.4 t, 0.9 t, and 0.3 t were obtained in the same order, with an average cost of operation of EUR 2740, EUR 1969, and EUR 1972 per year. These results are comparable with the average national energy consumption, CO2 emissions, and cost, estimated at 9.4 MWh, 1.4 t, and EUR 1193, respectively. It is of crucial relevance to highlight the fact that the reinforcement of structural elements was not considered in both scenarios 2 and 3, in which we proposed to increment the existing numbers of floors. Although out of scope of this work, the feasibility analysis for each retrofit process must be assessed and the costs may alter the comparison between scenarios.
For mobility, the annual per capita energy consumption achieved was 7.3 MWh, 1.7 MWh, 1.1 MWh, and 0.9 MWh, respectively, for scenarios M0, M1, M2 and M3, with emissions of CO2 per capita per year of 1568 kg, 373 kg, 237 kg and 189 kg following the same order and an average cost of EUR 3036, EUR 824, EUR 452, and EUR 366. Currently, considering both sectors, there is an annual consumption of 24 MWh of primary energy, 4.5 t CO2 emitted, and an average cost of EUR 7300 per dwelling. The adoption of the most ambitious scenario for building retrofit and mobility would allow for annual results of 5.8 MWh for primary energy, 0.7 t CO2 emitted, and EUR 2700 for the average cost, thus achieving significant reductions in all variables of interest.
Considering all the results achieved, for buildings and mobility, the scenario with the highest cost–benefit ratio is the third scenario. As a result, it is also the combination of these two scenarios (M3E3) that has the best cost–benefit ratio.
At the Lisbon city level, if all the derelict buildings were rehabilitated and retrofitted with the E3 standard and its inhabitants adopted the M3 mobility standard, it would be possible to reduce primary energy consumption by around 450 TJ per year and carbon dioxide emissions by 25 kt per year, which corresponds to a reduction of 2.5% compared to the current energy consumption and CO2 emitted.
Thus, it is concluded that the adequate retrofitting of derelict buildings in Lisbon has a great potential to reduce energy and emissions as well as operational cost. However, the initial investment is quite significant, so it is important to create policies that facilitate it. Policies supporting passive retrofit measures, efficient HVAC and DHW equipment, and renewable energy systems already exist in Portugal, such as those endorsed by Fundo Ambiental. In the case of the rehabilitation of buildings intended to lower rent housing mechanisms, socio-economic parameters should be included to avoid gentrification problems.
Added to these, we demonstrate that there are significant gains in mobility, achieved by promoting the home–work proximity that contributes to the sustainable development of cities, as well as the adoption of more sustainable transportations means and the concept of 15 min cities. Thus, it is important to have public transport alternatives that can be competitive with the use of cars, and encourage the adoption of active modes, such as cycling with the creation of new dedicated cycle lanes, and pedestrian mobility, as well as reducing housing costs inside the city. Additionally, mobility criteria should be included in the attribution of lower rent housing mechanisms, namely establishing a maximum radius for employment location, giving preference to people working nearby.
Author Contributions
Conceptualization, P.L., P.B. and R.G.; Methodology, P.L., P.B. and R.G.; Software, P.L.; Formal analysis, P.L., P.B. and R.G.; Investigation, P.L.; Data curation, P.L.; Writing—original draft, P.L., P.B. and R.G.; Writing—review & editing, P.B. and R.G. All authors have read and agreed to the published version of the manuscript.
Funding
This work was supported by Fundação para a Ciência e Tecnologia through IN+ UIDP/EEA/50009/2020—IST-ID, funded by Project C-TECH—Climate Driven Technologies for Low Carbon Cities, grant number POCI-010247-FEDER-045919, LISBOA-01-0247-FEDER-045919, co-financed by the ERDF—European Regional Development Fund through the Operational Program for Competitiveness and Internationalization—COMPETE 2020, the Lisbon Portugal Regional Operational Program—LISBOA 2020 and by the Portuguese Foundation for Science and Technology—FCT under MIT Portugal Program. This work was also developed as part of the Project BE.Neutral—Agenda de Mobilidade para a neutralidade carbónica nas cidades, contract number 35, funded by the Resilience and Recovery Plan (PRR) through the European Union under the Next Generation EU.
Data Availability Statement
Restrictions apply to the availability of data, since data was obtained as part of Project C-TECH—Climate Driven Technologies for Low Carbon Cities.
Conflicts of Interest
The authors declare no conflict of interest. The funders had no role in the design of the study; in the collection, analyses, or interpretation of data; in the writing of the manuscript; or in the decision to publish the results.
Nomenclature
| AML | Lisbon Metropolitan Area |
| DHW | Domestic hot water |
| HVAC | Heating, ventilation and air-conditioning |
| IMOB | Mobility Survey (Portuguese: Inquérito à mobilidade) |
| PV | Photovoltaic Panels |
| UBEM | Urban building energy modelling |
References
- IEA. Empowering Cities for a Net Zero Future: Unlocking Resilient, Smart, Sustainable Urban Energy Systems; IEA: Paris, France, 2021; Available online: https://www.iea.org/reports/empowering-cities-for-a-net-zero-future (accessed on 1 October 2022).
- European Environment Agency. Urban Sprawl in Europe—The Ignored Challenge; European Environment Agency: Copenhagen, Denmark, 2006. [Google Scholar]
- Smiraglia, D.; Salvati, L.; Egidi, G.; Salvia, R.; Giménez-Morera, A.; Halbac-Cotoara-zamfir, R. Toward a New Urban Cycle? A Closer Look to Sprawl, Demographic Transitions and the Environment in Europe. Land 2021, 10, 127. [Google Scholar] [CrossRef]
- European Environment Agency. Urban Sprawl in Europe: Joint EEA-FOEN Report; European Environment Agency: Copenhagen, Denmark, 2016. [Google Scholar] [CrossRef]
- European Commission. European Spatial Development Perspective: Towards Balanced and Sustainable Development of the Territory of the European Union; Office for Official Publications of the European Communities: Luxembourg, 1999. [Google Scholar]
- USGBC. LEED v4 for Building Design and Construction; USGBC: Washington, DC, USA, 2019. [Google Scholar]
- Moreno, C.; Allam, Z.; Chabaud, D.; Gall, C.; Pratlong, F. Introducing the “15-minute city”: Sustainability, resilience and place identity in future post-pandemic cities. Smart Cities 2021, 4, 93–111. [Google Scholar] [CrossRef]
- Lorga, M.; Januário, J.F.; Cruz, C.O. Housing Affordability, Public Policy and Economic Dynamics: An Analysis of the City of Lisbon. J. Risk Financ. Manag. 2022, 15, 560. [Google Scholar] [CrossRef]
- OECD. HM1.1. Housing Stock and Construction; Organisation for Economic Co-operation and Development: Paris, France, 2022; Available online: http://oe.cd/ahd (accessed on 1 October 2022).
- Rito, A. Lisboa Tem Quase Três Mil Edifícios Devolutos. Expresso. 2020. Available online: https://expresso.pt/economia/2020-08-09-Lisboa-tem-quase-tres-mil-edificios-devolutos (accessed on 1 October 2022).
- ESPON. Reuse of Spaces and Buildings; ESPON: Luxembourg, 2020; Available online: https://www.espon.eu/sites/default/files/attachments/Policy%20Brief%20Reuse%20of%20spaces%20and%20buildings.pdf (accessed on 1 October 2022).
- Ang, Y.Q.; Berzolla, Z.M.; Reinhart, C.F. From concept to application: A review of use cases in urban building energy modeling. Appl. Energy 2020, 279, 115738. [Google Scholar] [CrossRef]
- Hong, T.; Chen, Y.; Luo, X.; Luo, N.; Lee, S.H. Ten questions on urban building energy modeling. Build. Environ. 2020, 168, 106508. [Google Scholar] [CrossRef]
- Shahi, S.; Esnaashary Esfahani, M.; Bachmann, C.; Haas, C. A definition framework for building adaptation projects. Sustain. Cities Soc. 2020, 63, 102345. [Google Scholar] [CrossRef] [PubMed]
- Fonseca, J.A.; Schlueter, A. Integrated model for characterization of spatiotemporal building energy consumption patterns in neighborhoods and city districts. Appl. Energy 2015, 142, 247–265. [Google Scholar] [CrossRef]
- Chen, Y.; Hong, T.; Piette, M.A. Automatic generation and simulation of urban building energy models based on city datasets for city-scale building retrofit analysis. Appl. Energy 2017, 205, 323–335. [Google Scholar] [CrossRef]
- Gregório, V.; Seixas, J. Energy savings potential in urban rehabilitation: A spatial-based methodology applied to historic centres. In Energy and Buildings; Elsevier Ltd.: Amsterdam, The Netherlands, 2017; Volume 152, pp. 11–23. [Google Scholar] [CrossRef]
- Berzolla, Z.; Ang, Y.Q.; Reinhart, C. Combining Urban Building Energy Models with Retrofit Adoption Models for Time-Dependent Carbon Emission Projections and Equity Implications. 2022. Available online: https://aceee2022.conferencespot.org/event-data/pdf/catalyst_activity_32962/catalyst_activity_paper_20220810191710249_9d77b1c0_0bc8_497d_985d_0eb710121823 (accessed on 1 October 2022).
- Dulal, H.B.; Brodnig, G.; Onoriose, C.G. Climate change mitigation in the transport sector through urban planning: A review. In Habitat International; Elsevier Ltd.: Amsterdam, The Netherlands, 2011; Volume 35, pp. 494–500. [Google Scholar] [CrossRef]
- Salter, J.; Lu, Y.; Kim, J.C.; Kellett, R.; Girling, C.; Inomata, F.; Krahn, A. Iterative ‘what-if’ neighborhood simulation: Energy and emissions impacts. Build. Cities 2020, 1, 293–307. [Google Scholar] [CrossRef]
- Jewell, A.; Schüler, N.; Cajot, S.; Gomes, R.; Silva, C.S.; Marechal, F.M.A. Designing a District Energy Infrastructure—A Case-Study in Lisbon. Front. Sustain. Cities 2022, 4, 863787. [Google Scholar] [CrossRef]
- Kim, G.; Miller, P.A.; Nowak, D.J. Urban vacant land typology: A tool for managing urban vacant land. Sustain. Cities Soc. 2018, 36, 144–156. [Google Scholar] [CrossRef]
- Fonseca, J.A.; Nguyen, T.A.; Schlueter, A.; Marechal, F. City Energy Analyst (CEA): Integrated framework for analysis and optimization of building energy systems in neighborhoods and city districts. Energy Build. 2016, 113, 202–226. [Google Scholar] [CrossRef]
- MIT Portugal. C-Tech: Climate Driven Technologies for Low Carbon Cities; 2020. Available online: https://www.mitportugal.org/research/flagship-projects/c-tech-climate-driven-technologies-for-low-carbon-cities (accessed on 1 October 2022).
- Londublis. Light Vehicles in Portugal; Londublis: Lisbon, Portugal, 2021. [Google Scholar]
- DGEG. Custos-Padrão Máximos por Tecnologia; DGEG: Lisbon, Portugal, 2016.
- DGEG. Consumo de Energia no Setor Doméstico. 2020. Available online: https://www.dgeg.gov.pt/media/cdhltpyw/dgeg-aou-icesd-2020.xlsx (accessed on 1 October 2022).
- Câmara Municipal de Lisboa. MOVE Lisboa. 2020. Available online: https://www.lisboa.pt/fileadmin/cidade_temas/mobilidade/documentos/BrochuraMOVE_2030.pdf (accessed on 1 October 2022).
- Belga, C. Desempenho Energético, Ambiental e Económico para Deslocações Urbanas Multimodais em Diferentes Gamas de Distância; Instituto Superior Técnico: Lisboa, Portugal, 2021; Available online: https://fenix.tecnico.ulisboa.pt/downloadFile/844820067128584/DISSERTACAOMestrado-CarolinaBelga.pdf (accessed on 1 October 2022).
- Joint Research Centre (JCR). JEC Well-To-Wheels Report; Joint Research Centre: Brussels, Belgium, 2020. [Google Scholar] [CrossRef]
- Ritchie, H. Primary, Secondary, Final, and Useful Energy: Why Are There Different Ways of Measuring Energy?-Our World in Data. Our World in Data. 2022. Available online: https://ourworldindata.org/energy-definitions (accessed on 1 October 2022).
- ZERO. Pobreza Energética: A Epidemia Silenciosa. 2022. Available online: https://zero.ong/pobreza-energetica/ (accessed on 1 October 2022).
- Lisboa E-Nova; IST; CML. Matriz Energética Lisboa. 2016. Available online: https://www.lisboaenova.org/images/stories/MatrizEnergetica2014/matriz_energetica_lisboa_2014_af_edrevista_digital.pdf (accessed on 1 October 2022).


Disclaimer/Publisher’s Note: The statements, opinions and data contained in all publications are solely those of the individual author(s) and contributor(s) and not of MDPI and/or the editor(s). MDPI and/or the editor(s) disclaim responsibility for any injury to people or property resulting from any ideas, methods, instructions or products referred to in the content. |
© 2023 by the authors. Licensee MDPI, Basel, Switzerland. This article is an open access article distributed under the terms and conditions of the Creative Commons Attribution (CC BY) license (https://creativecommons.org/licenses/by/4.0/).