
Impact of the Air Filtration in the Nacelle on the Wind Turbine Performance
 ,
,  , , and
Abstract
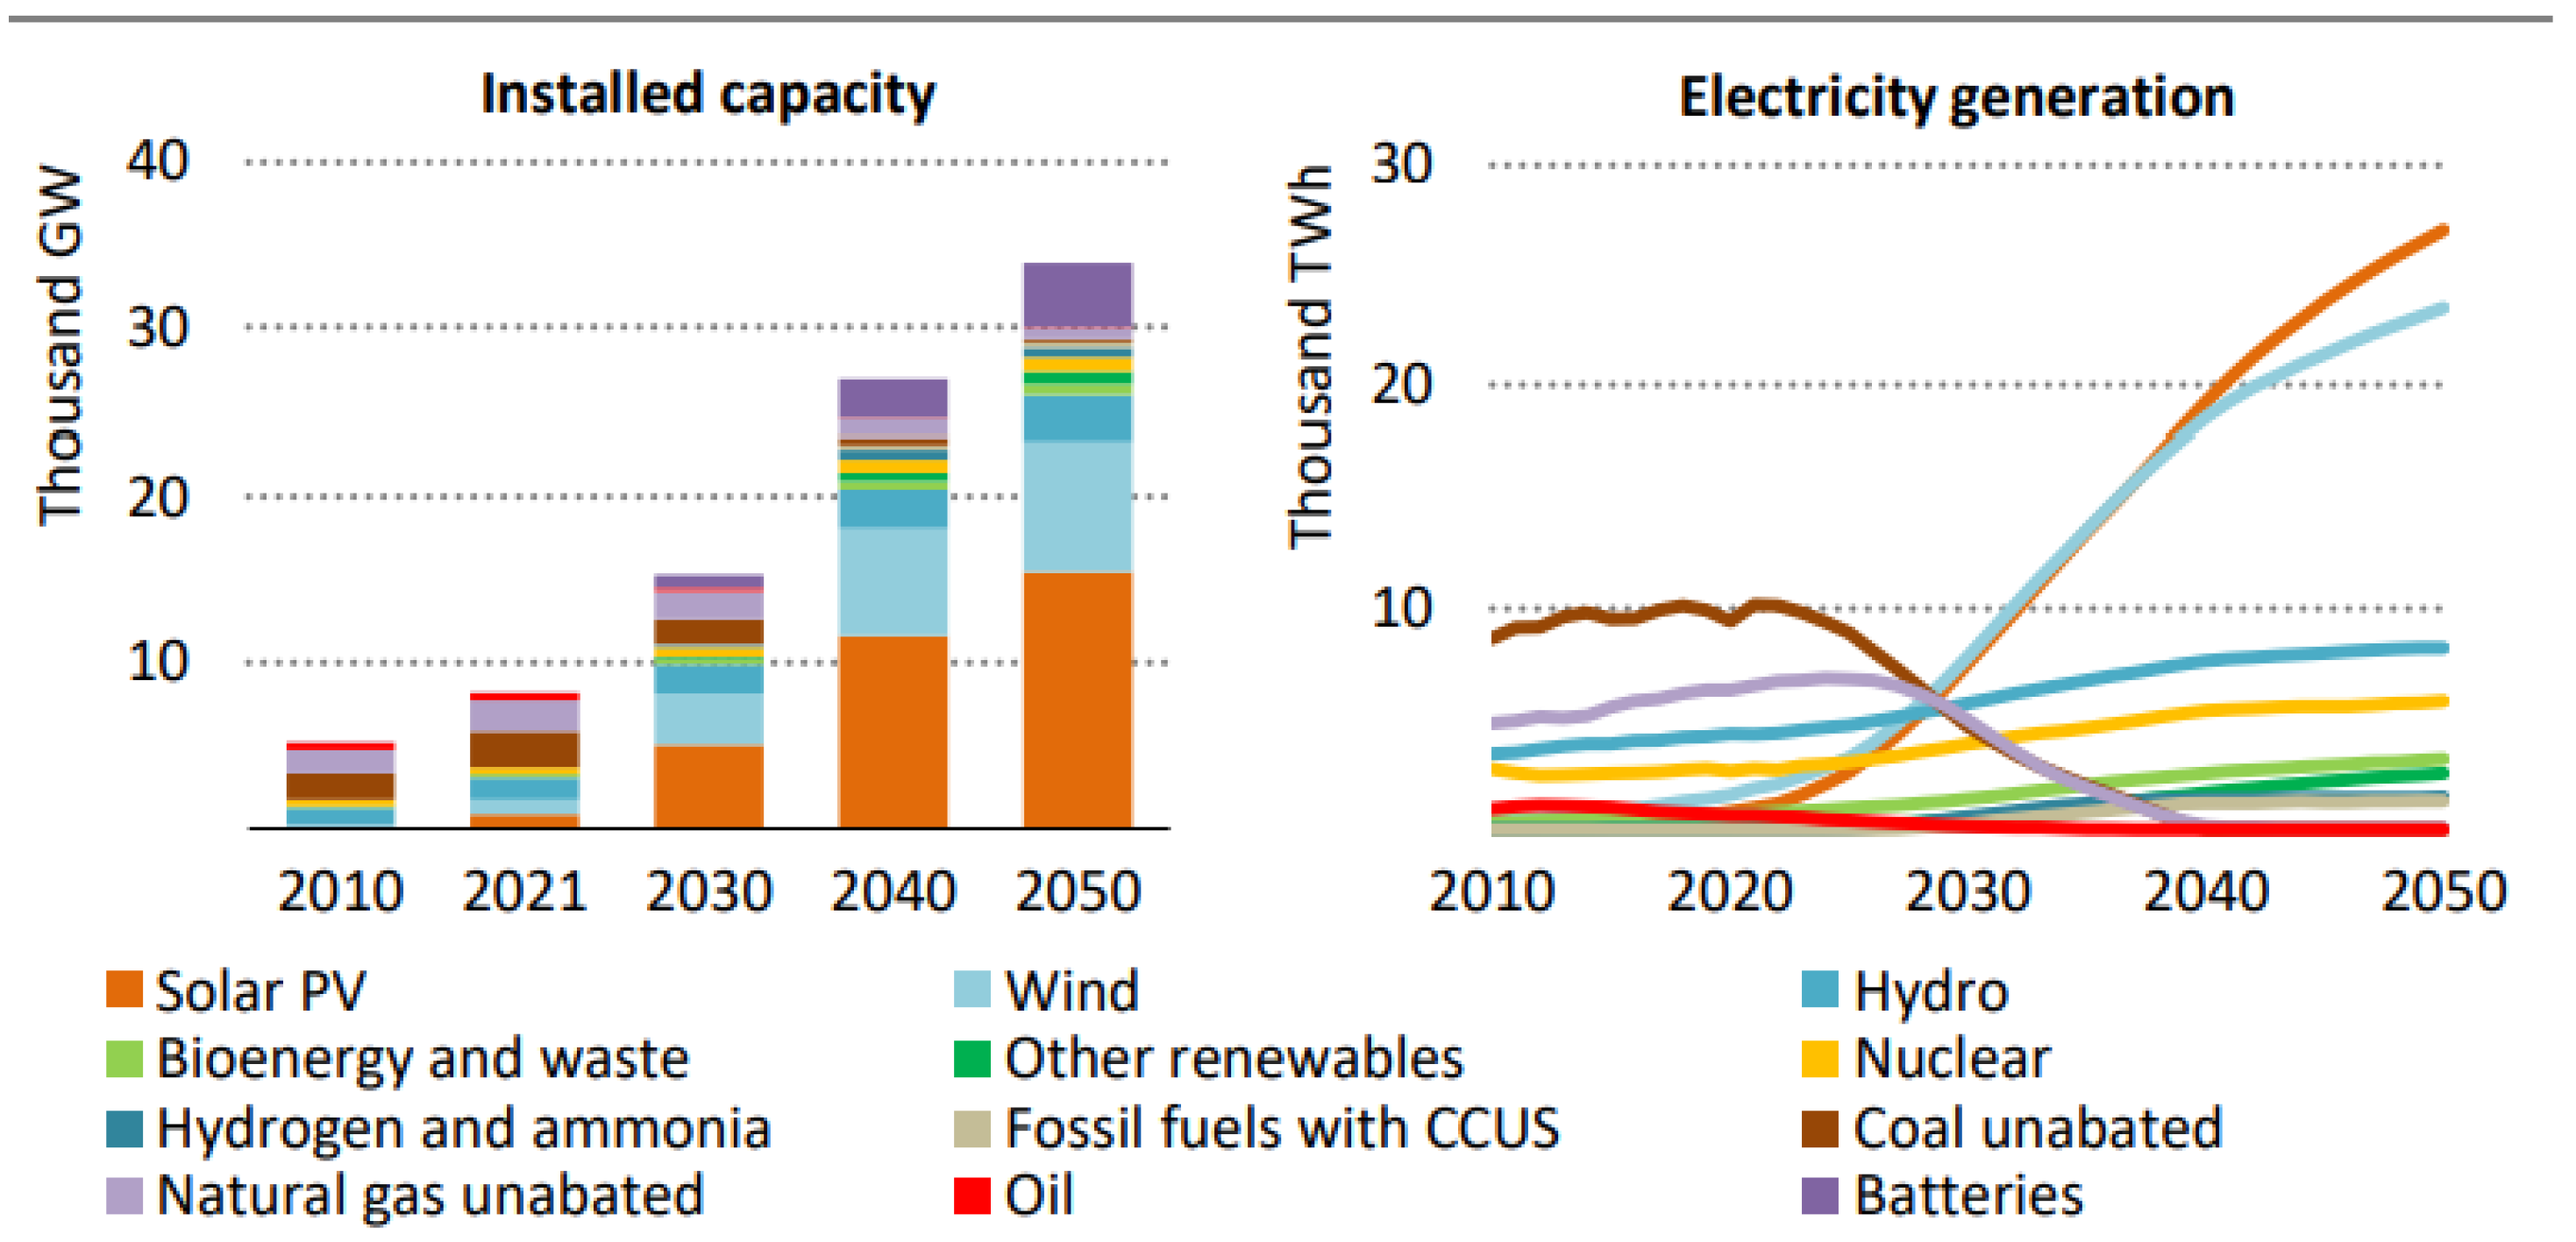
:1. Introduction
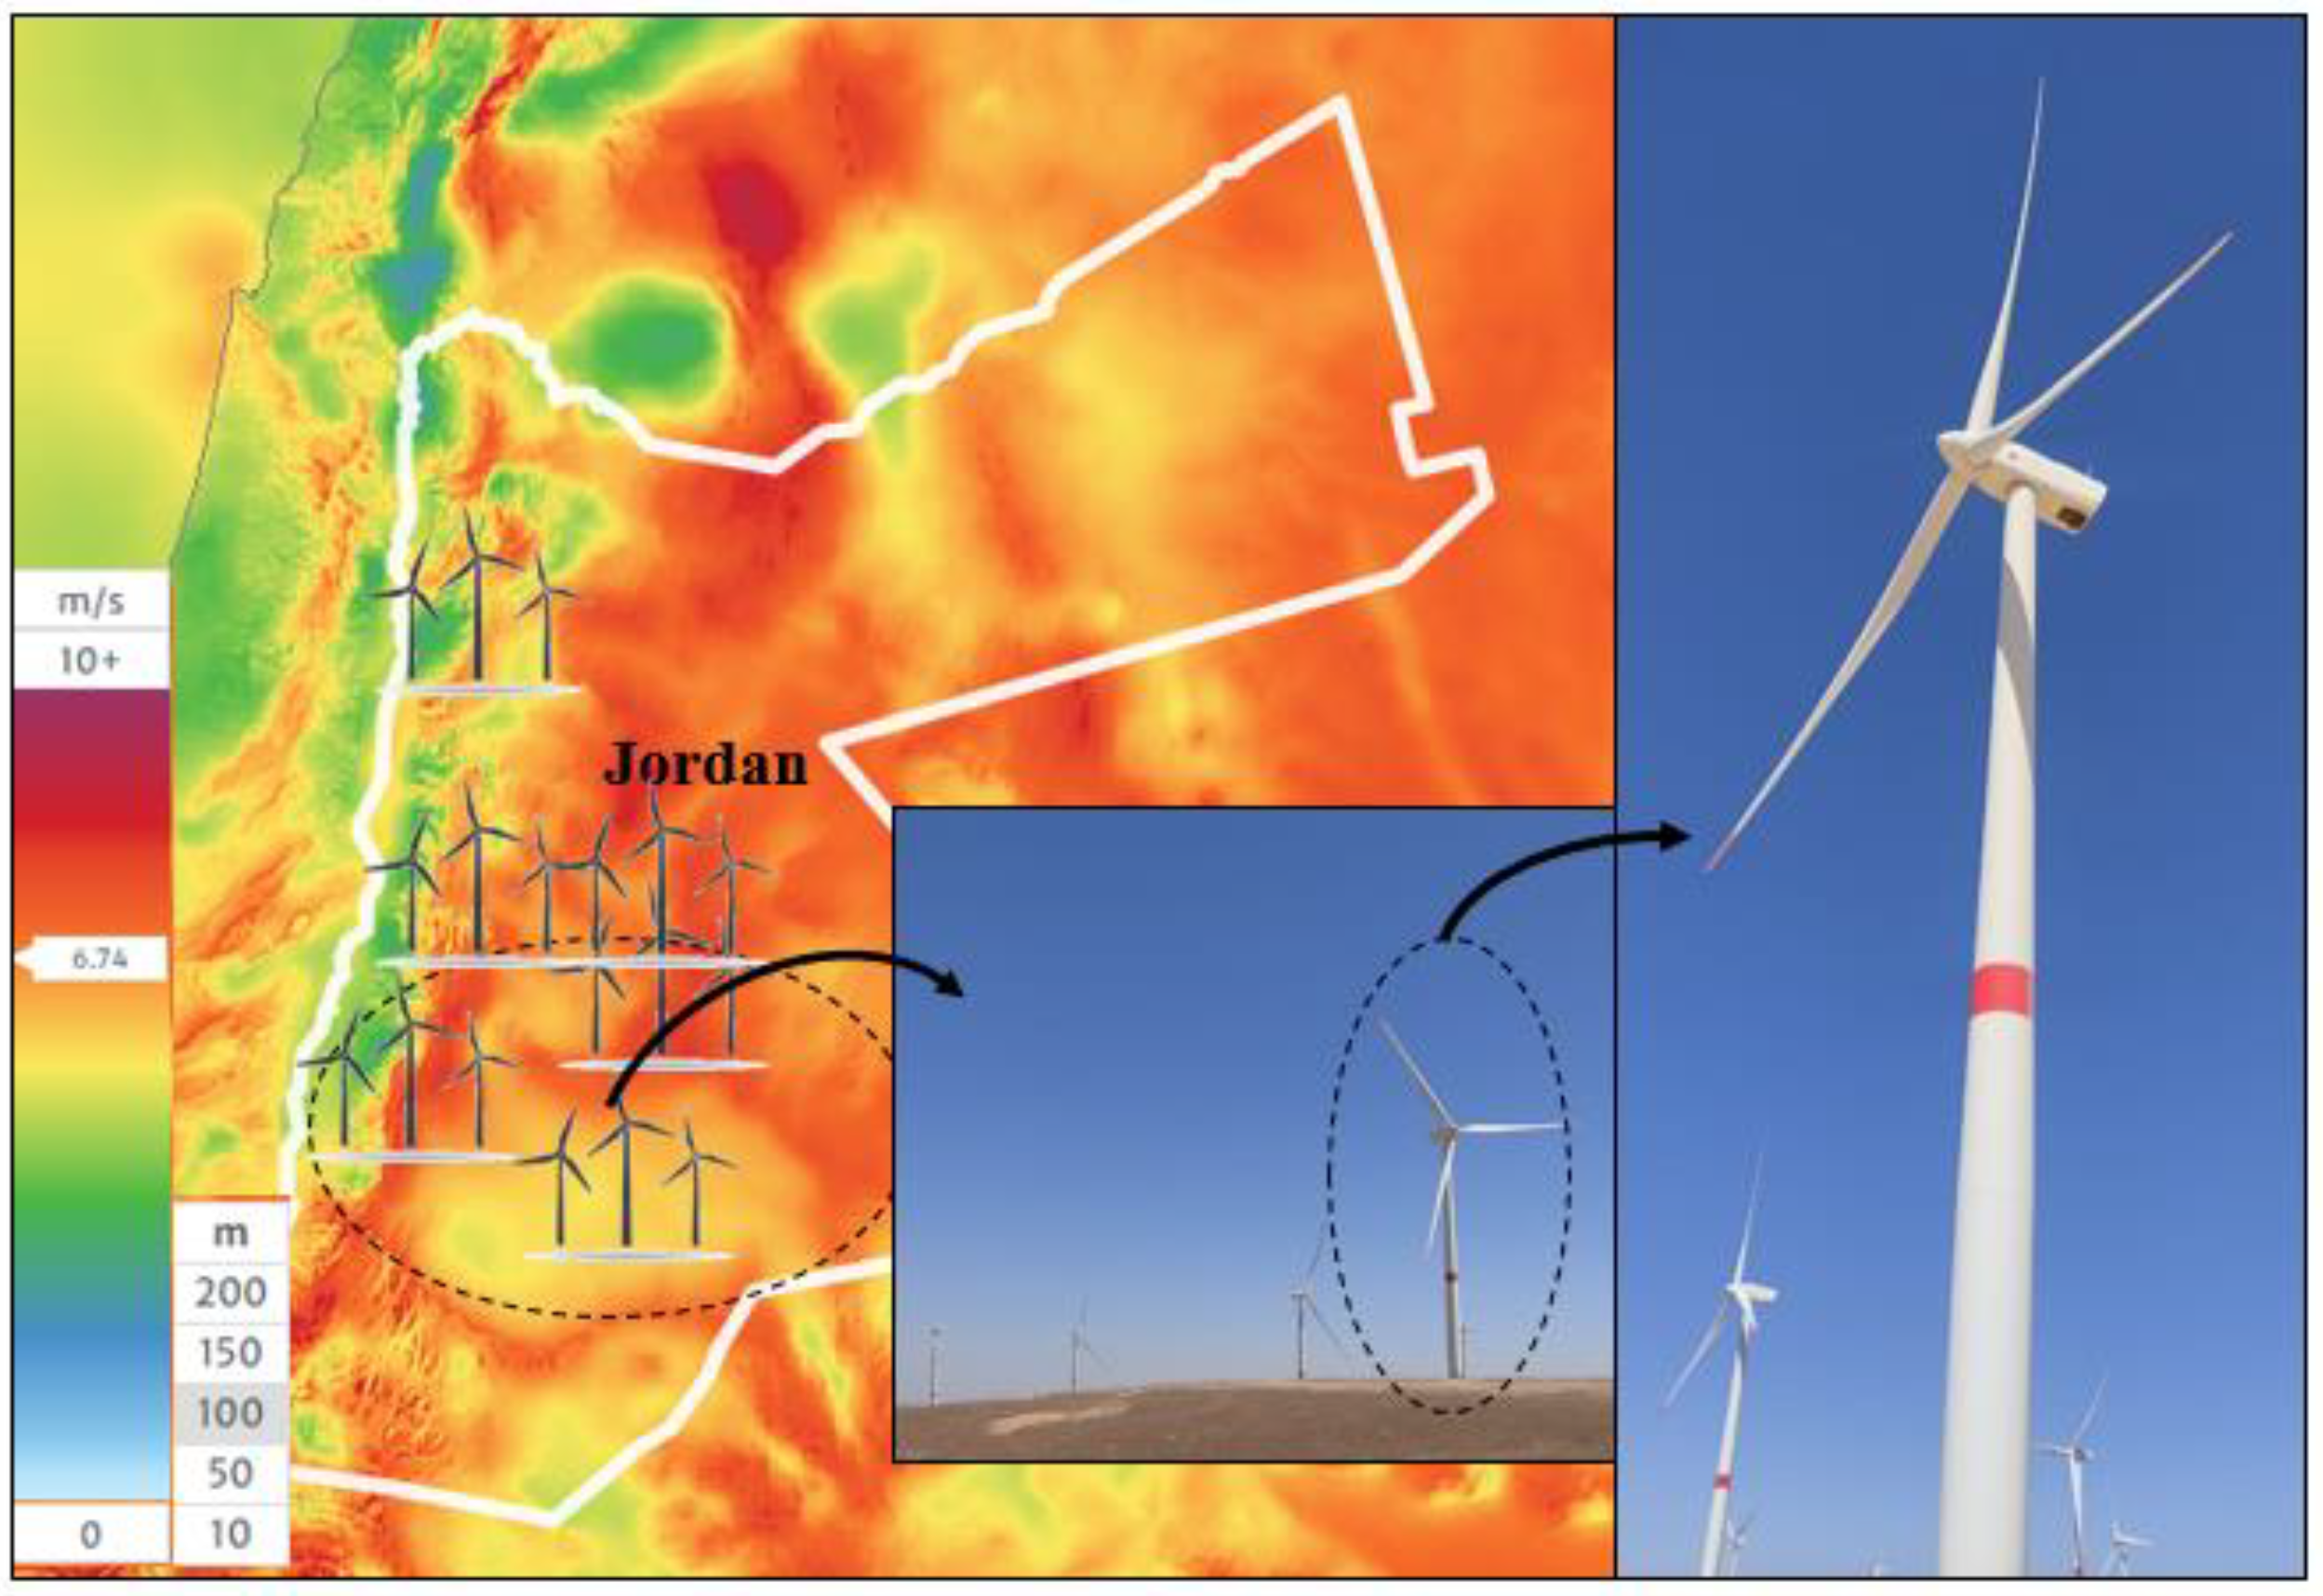
2. Wind Power Plants in Jordan
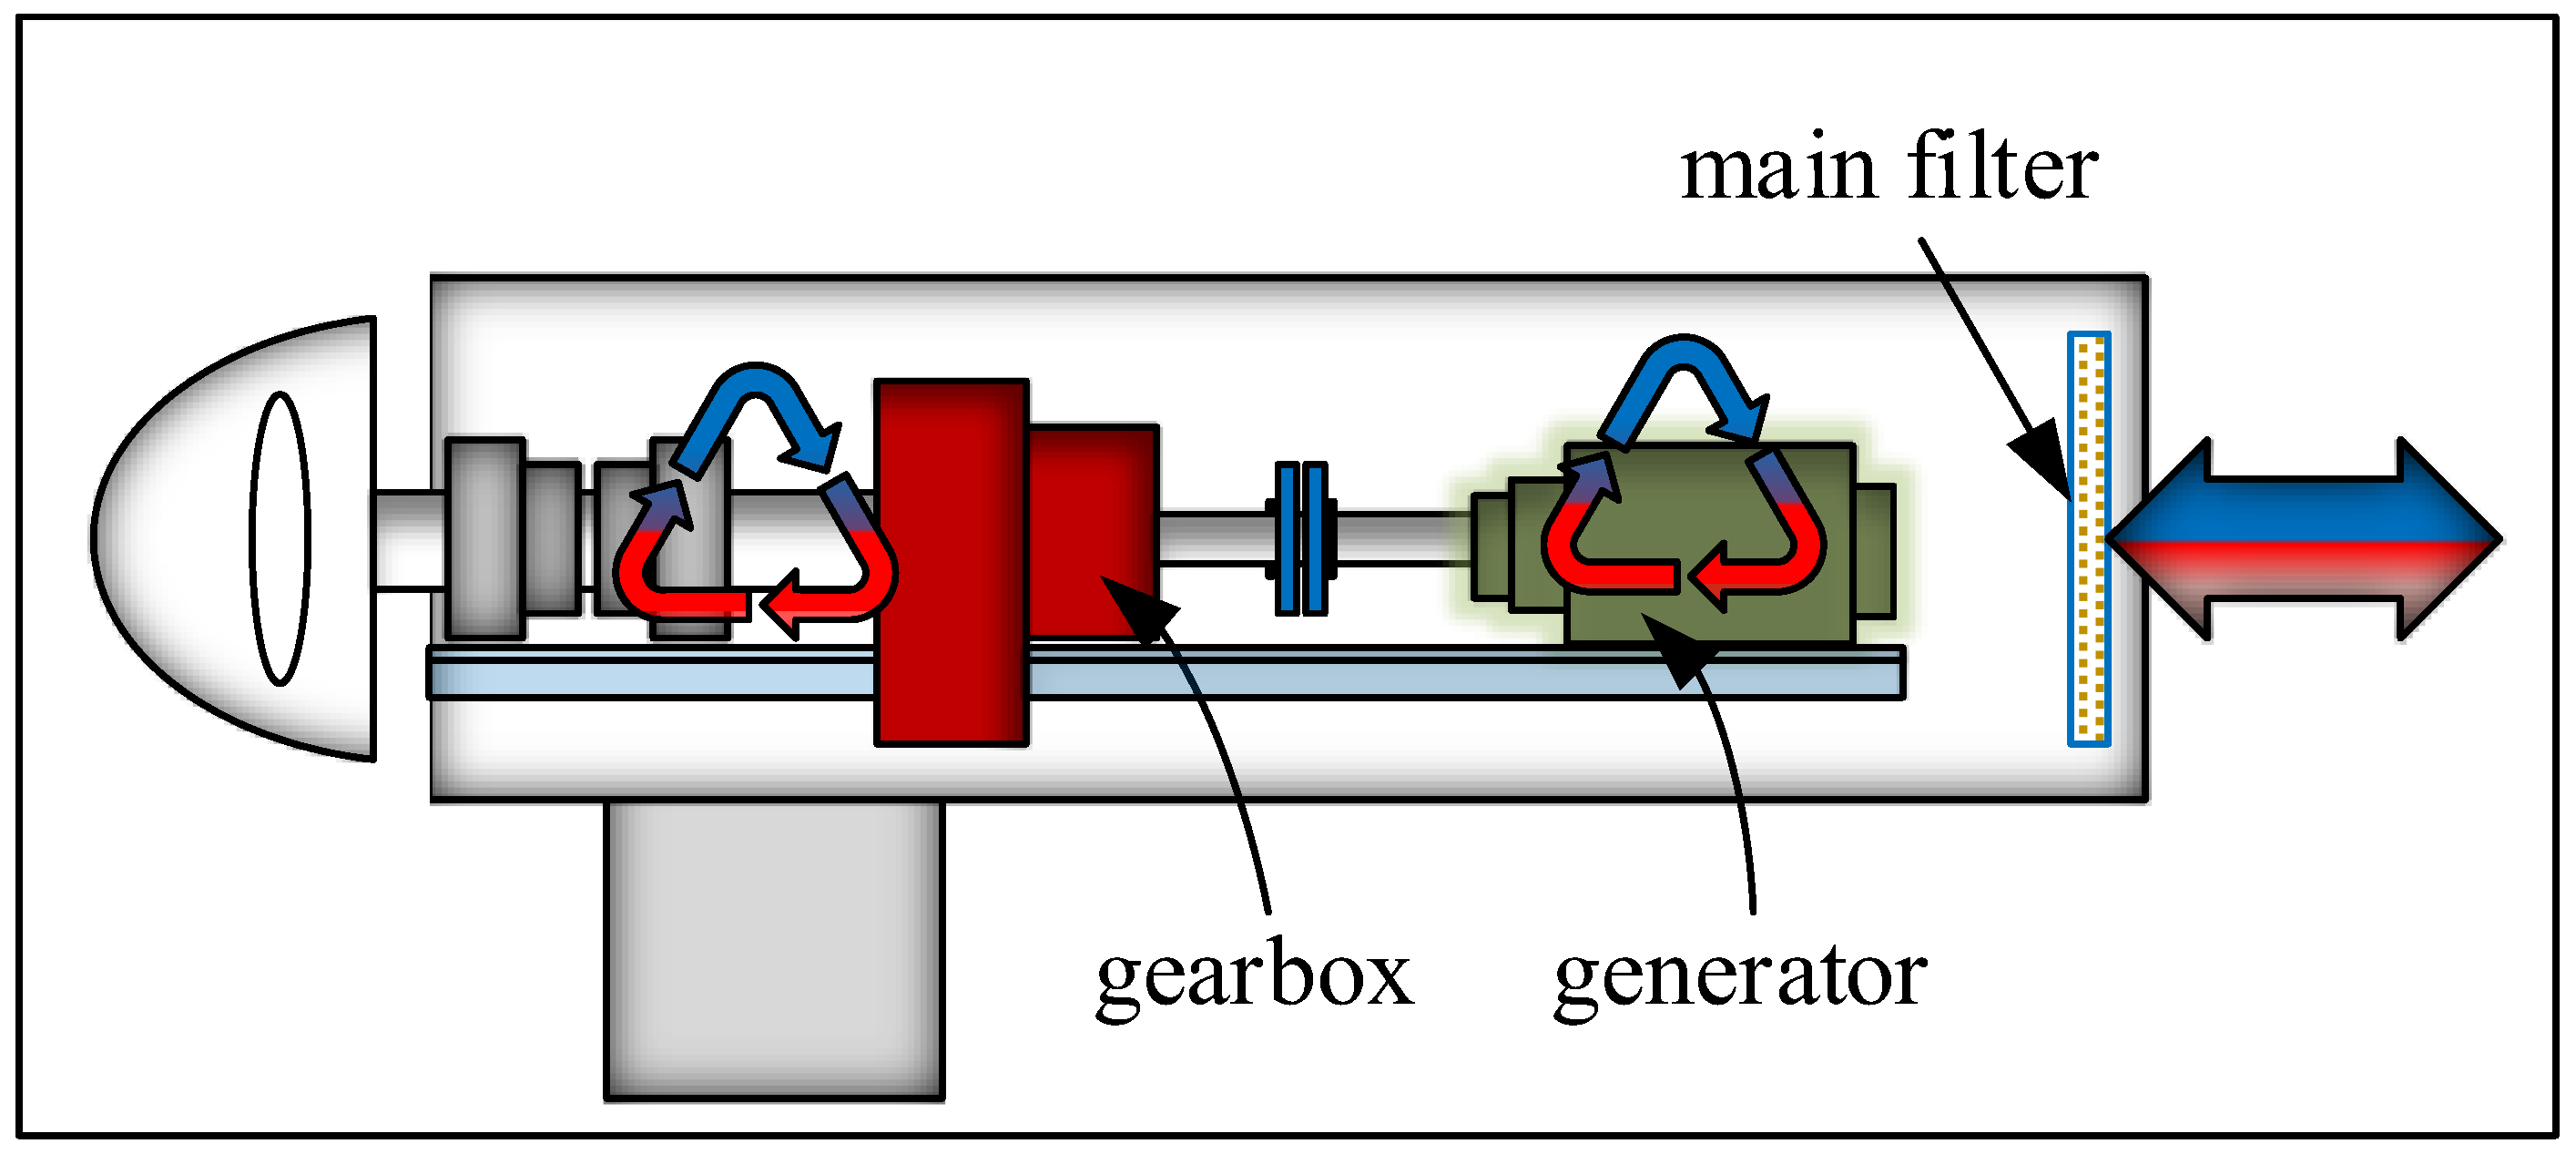
3. Problem Background
4. Methodology and the Experimental Work
5. Results and Discussion
5.1. Dust Analysis
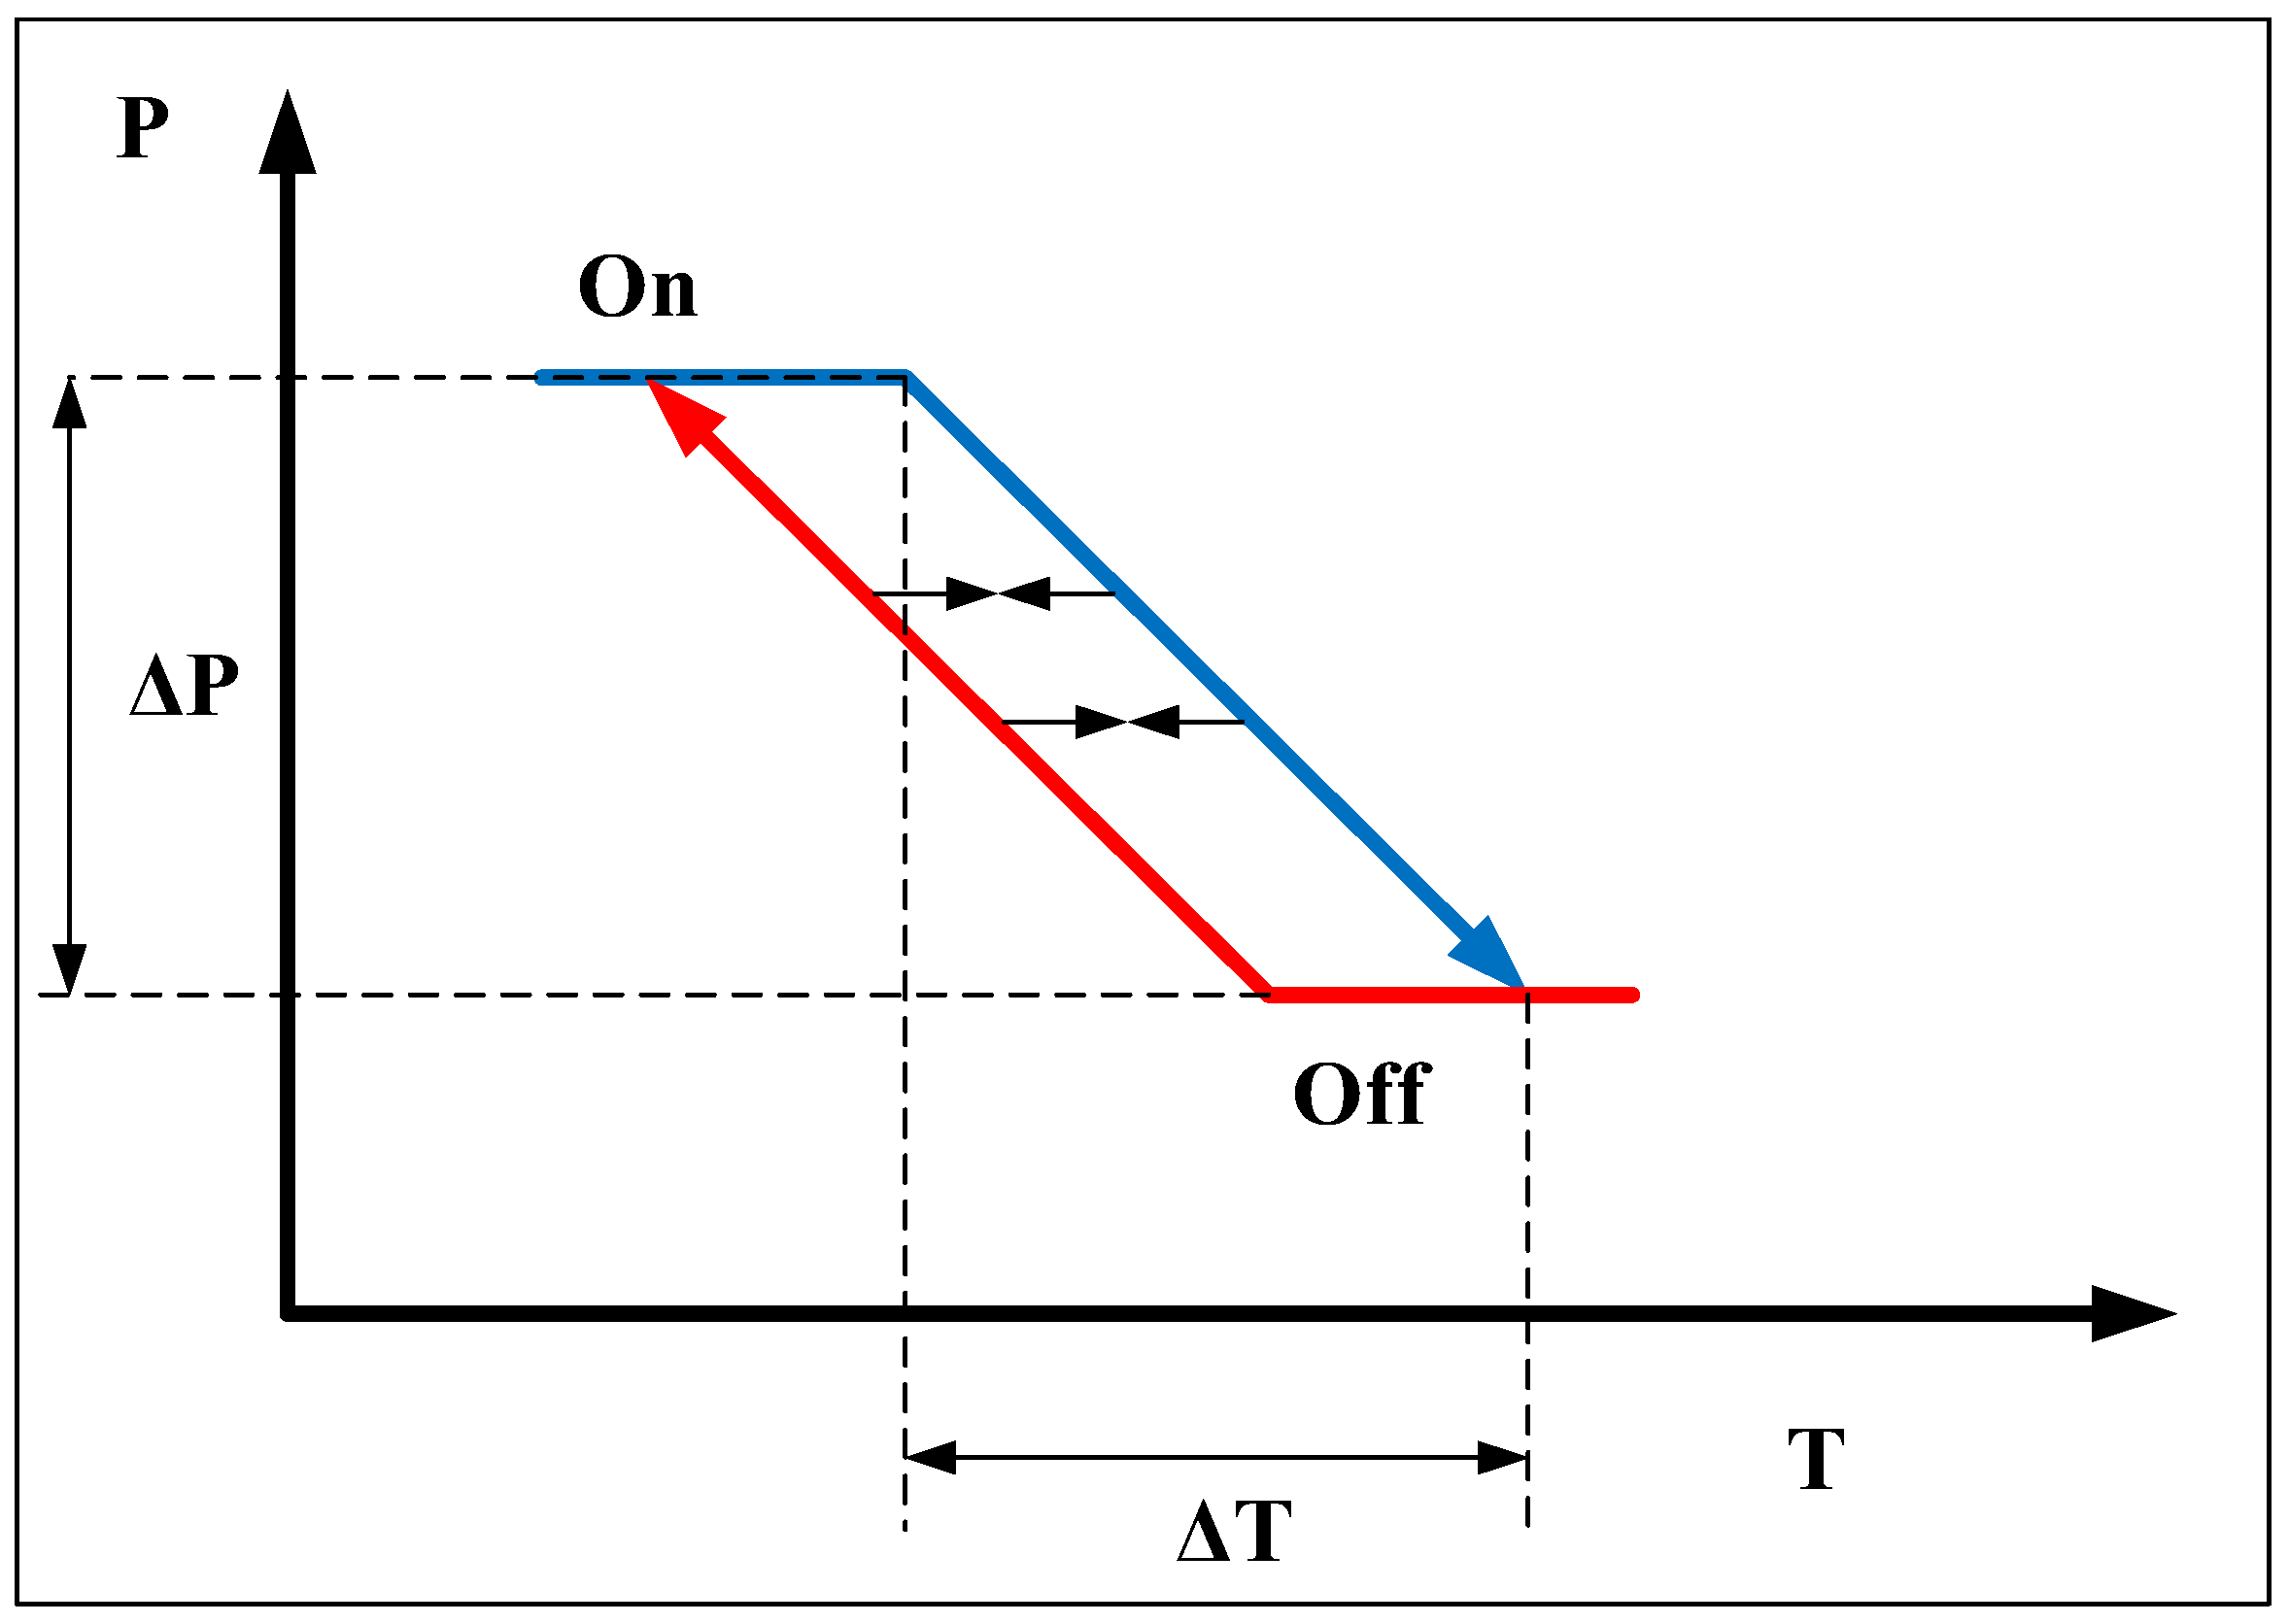
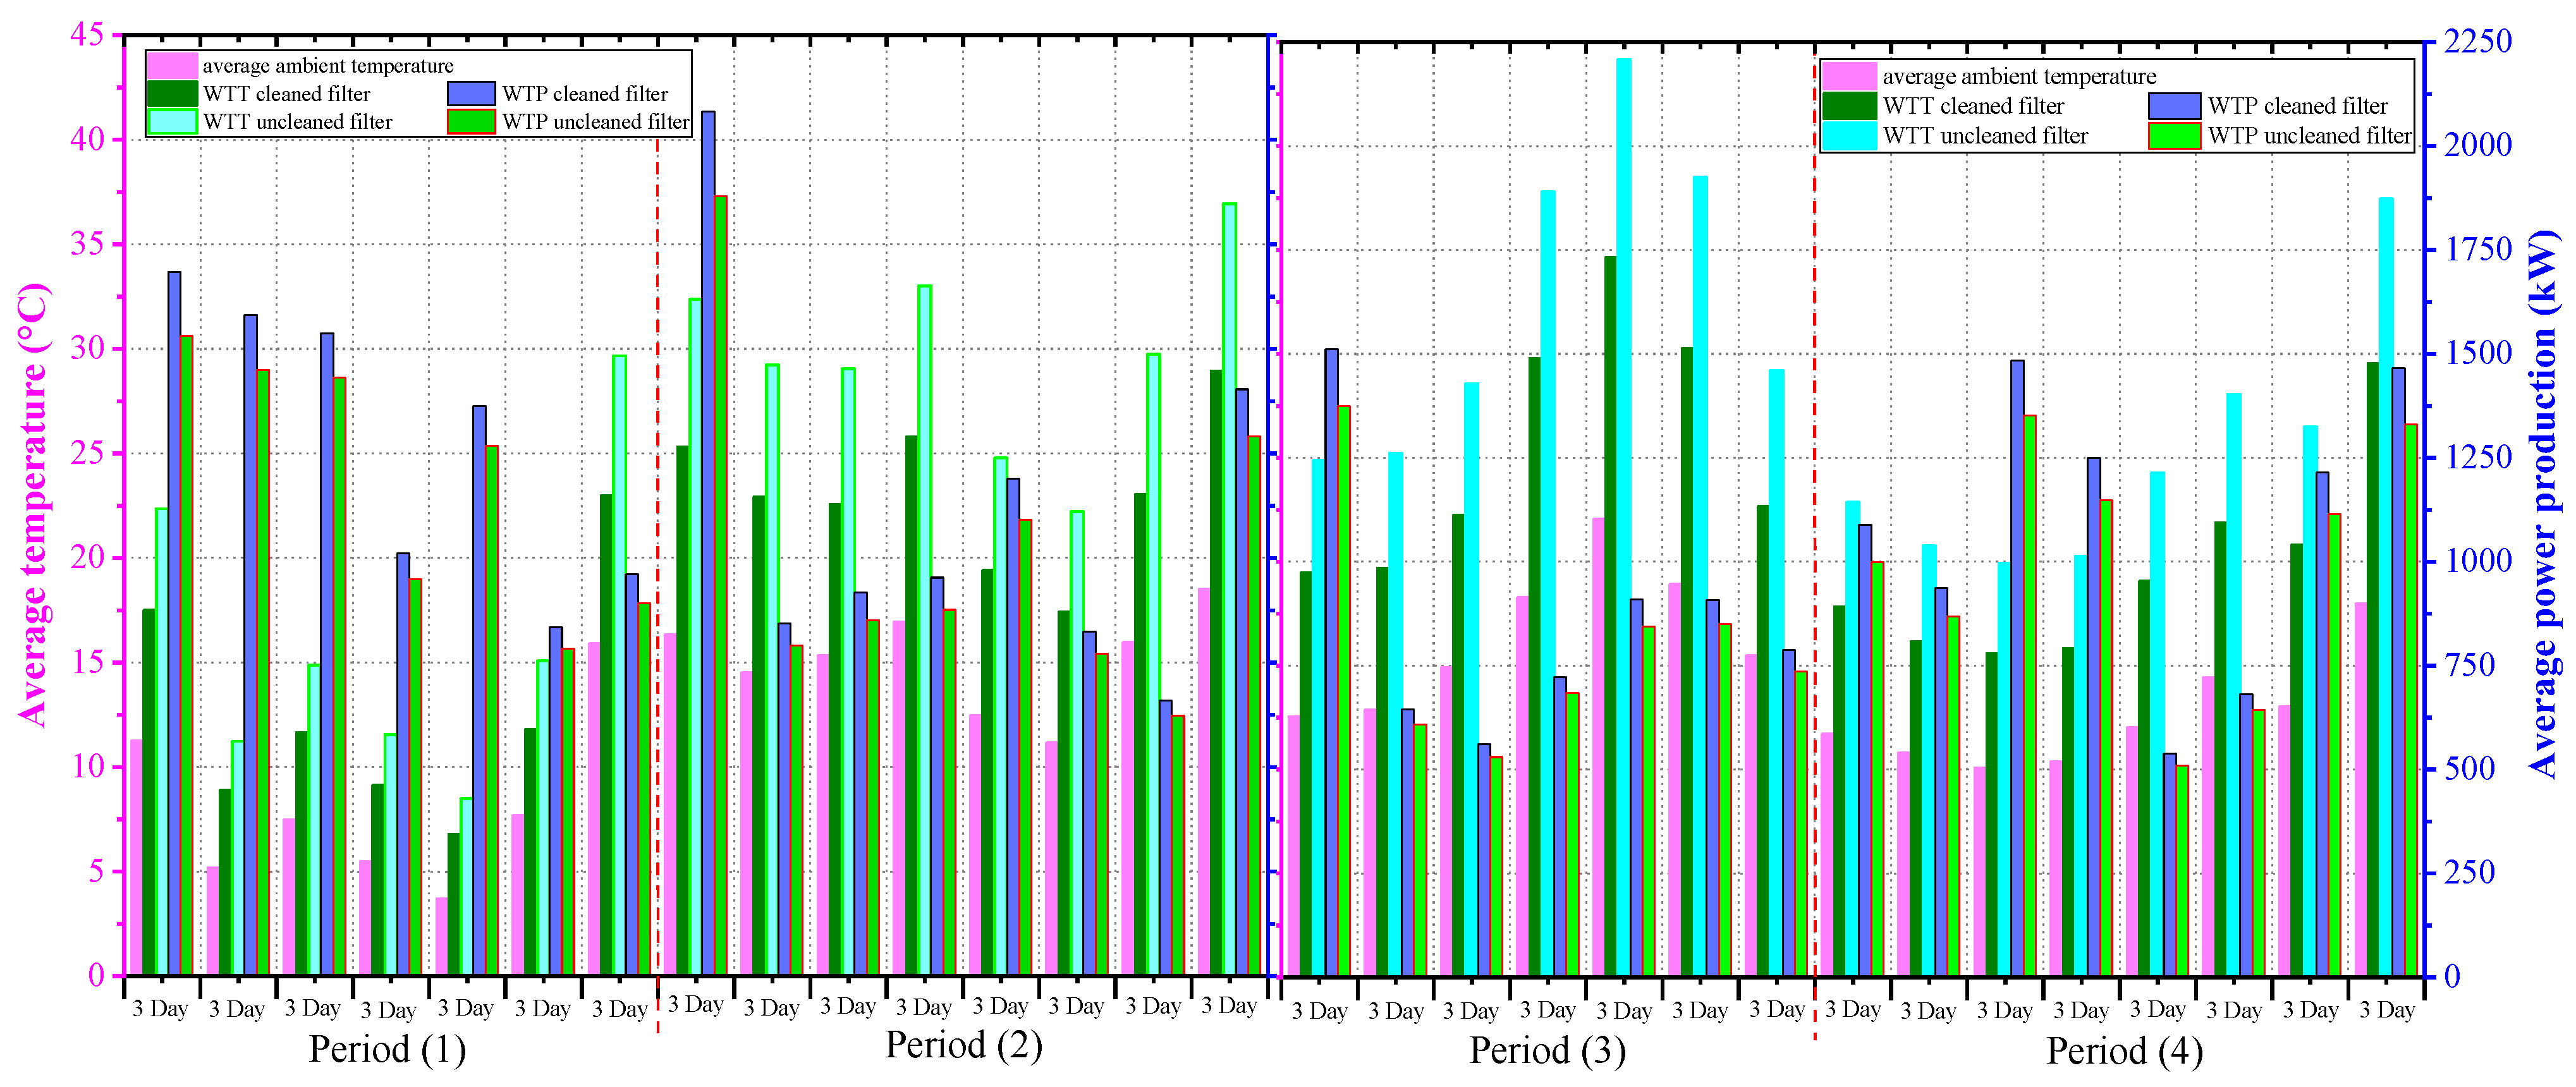
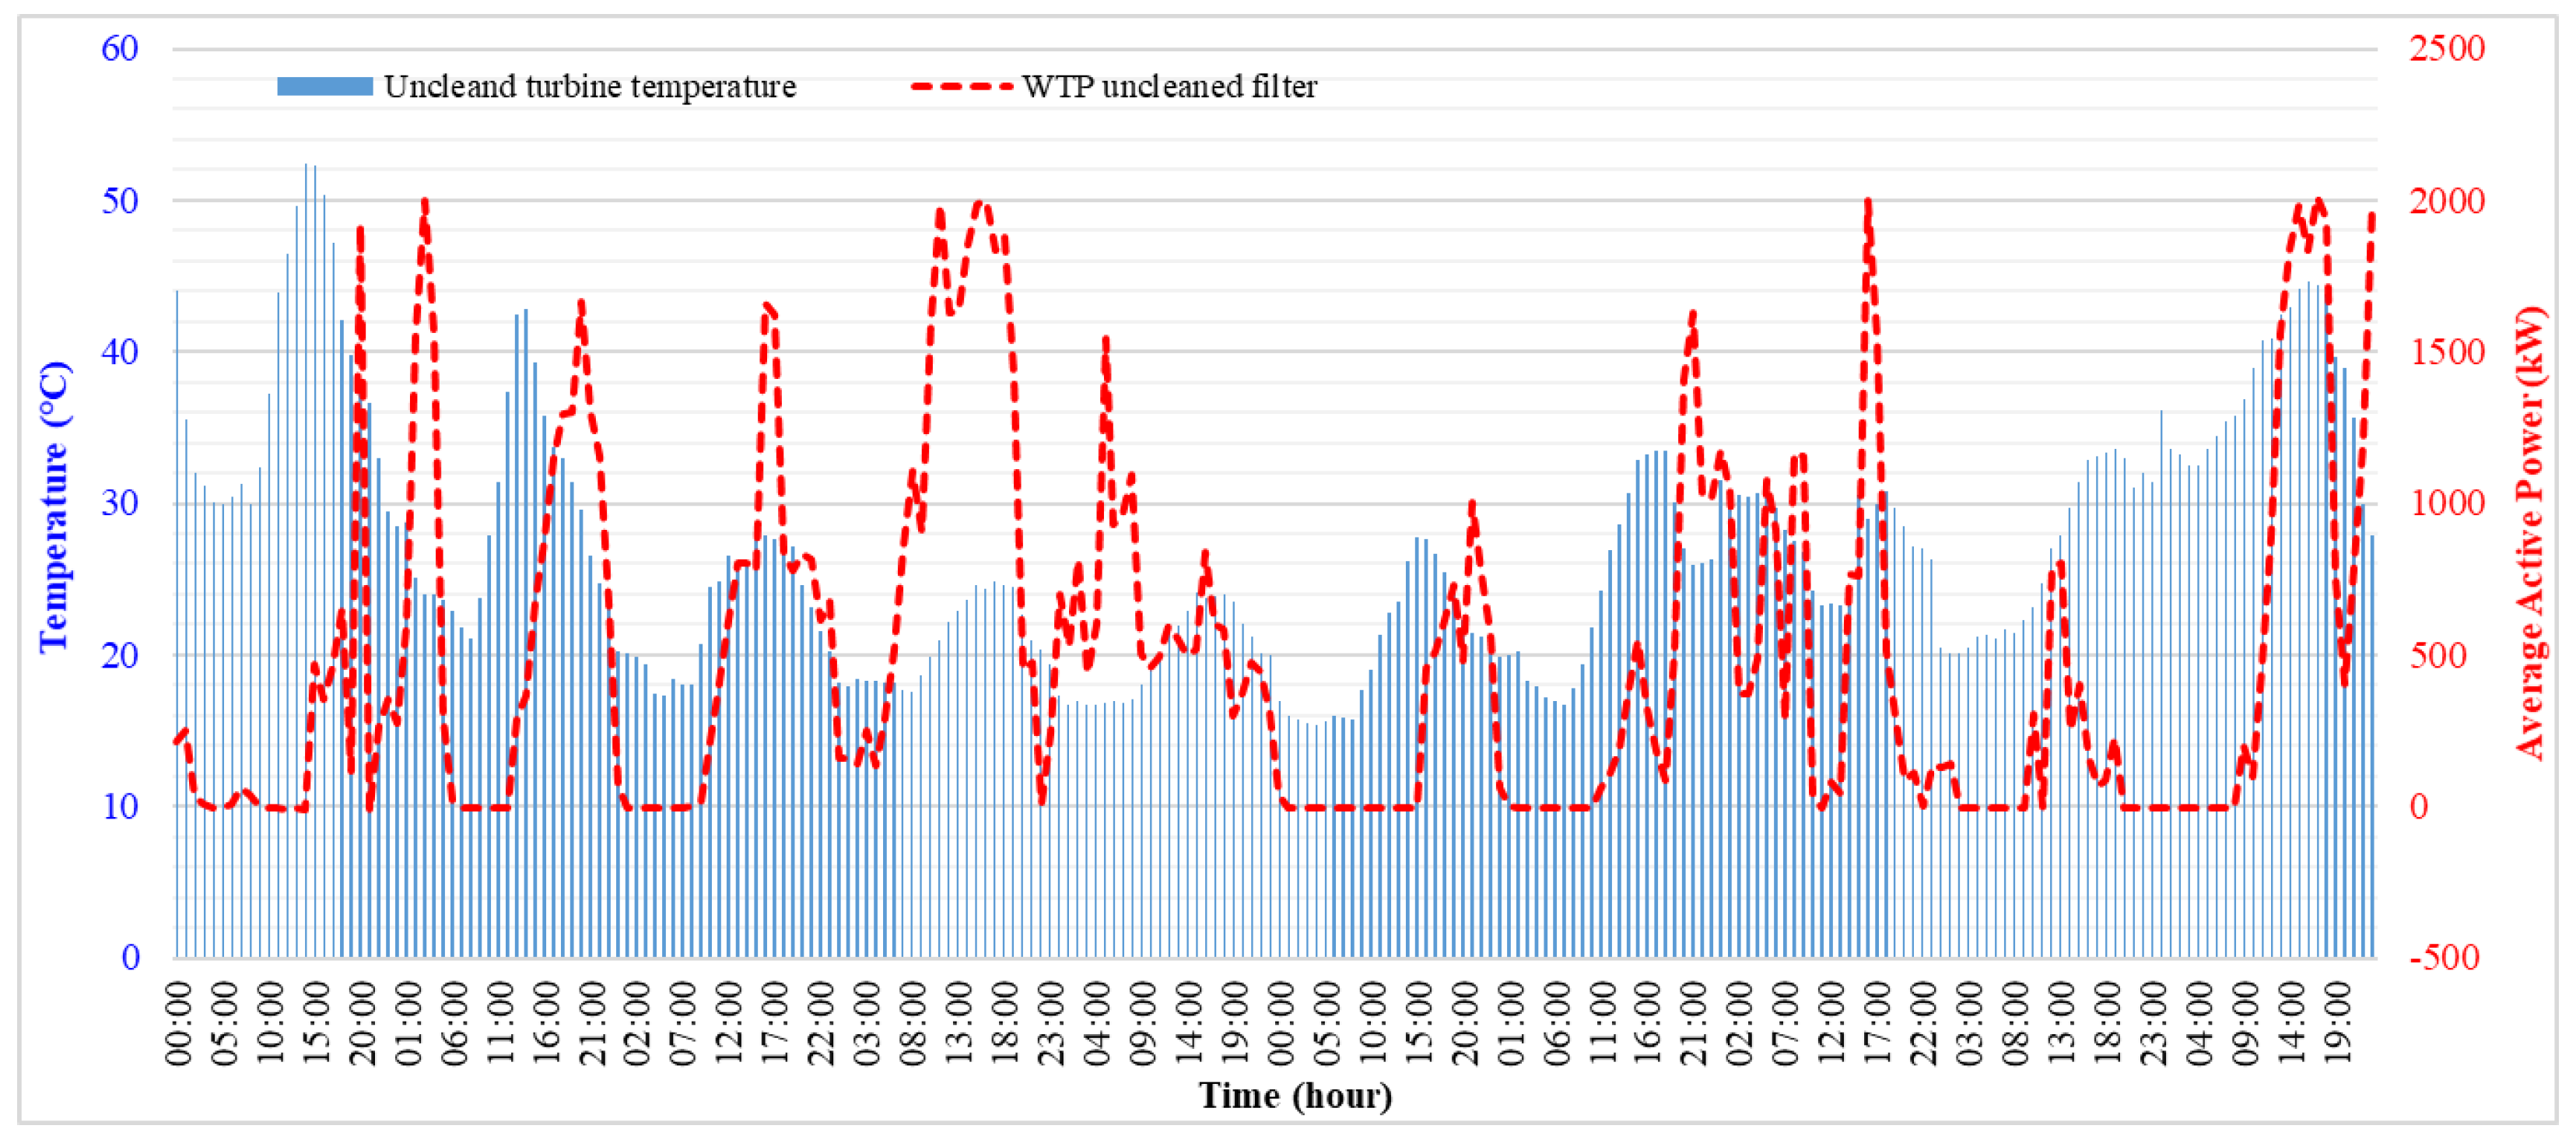
5.2. The Impact of Temperature on Wind Turbine Productivity
6. Conclusions
Author Contributions
Funding
Data Availability Statement
Conflicts of Interest
References
- MEMR. Ministry of Energy and Mineral Resources (MEMR): Annual Reports; MEMR: Jakarta, Indonesia, 2020.
- Qazi, A.; Hussain, F.; Rahim, N.A.; Hardaker, G.; Alghazzawi, D.; Shaban, K.; Haruna, K. Towards sustainable energy: A systematic review of renewable energy sources, technologies, and public opinions. IEEE Access 2019, 7, 63837–63851. [Google Scholar] [CrossRef]
- Gomaa, M.R.; Rezk, H.; Mustafa, R.J.; Al-Dhaifallah, M. Evaluating the environmental impacts and energy performance of a wind farm system utilizing the life-cycle assessment method: A practical case study. Energies 2019, 12, 3263. [Google Scholar] [CrossRef]
- International Energy Agency (IEA). World Energy Outlook 2022; International Energy Agency (IEA): Paris, France, 2022. [Google Scholar]
- Marashli, A.; Alfanatseh, E.; Shalby, M.; Gomaa, M.R. Modelling single-effect of Lithium Bromide-Water (LiBr–H2O) driven by an evacuated solar tube collector in Ma’an city (Jordan) case study. Case Stud. Therm. Eng. 2022, 37, 102239. [Google Scholar] [CrossRef]
- Ababneh, M.; Kakish, W.; Mohareb, O.A.; Etier, I. Investigation of wind energy in Jordan. In Proceedings of the International Conference and Exhibition on Green Energy and Sustainability for Arid Regions and Mediterranean Countries ICEGES, Amman, Jordan, 10–12 November 2009. [Google Scholar]
- Ullah, Z.; Hassanin, H.; Cugley, J.; Alawi, M.A. Planning, Operation, and Design of Market-Based Virtual Power Plant Considering Uncertainty. Energies 2022, 15, 7290. [Google Scholar] [CrossRef]
- Ullah, Z.; Hassanin, H. Modeling, optimization, and analysis of a virtual power plant demand response mechanism for the internal electricity market considering the uncertainty of renewable energy sources. Energies 2022, 15, 5296. [Google Scholar] [CrossRef]
- Fuskele, V.; Baredar, P.; Sarviya, R.M.; Lal, S.; Awasthi, S. Wind turbine nacelle cooling systems: A review. Wiley Interdiscip. Rev. Energy Environ. Sci. Technol. 2022, 11, e456. [Google Scholar] [CrossRef]
- Jiang, Y.J. Wind turbine cooling technologies. Wind Power Gener. Wind Turbine Des. 2010, 613–640. [Google Scholar] [CrossRef]
- Al-Khayat, M.; Al-Rasheedi, M.; Gueymard, C.A.; Haupt, S.E.; Kosović, B.; Al-Qattan, A.; Lee, J.A. Performance analysis of a 10-MW wind farm in a hot and dusty desert environment. Part 2: Combined dust and high-temperature effects on the operation of wind turbines. Sustain. Energy Technol. Assess. 2021, 47, 101461. [Google Scholar] [CrossRef]
- Zhang, F.; Chen, M.; Zhu, Y.; Zhang, K.; Li, Q. A Review of Fault Diagnosis, Status Prediction, and Evaluation Technology for Wind Turbines. Energies 2023, 16, 1125. [Google Scholar] [CrossRef]
- Khalfallah, M.G.; Koliub, A.M. Effect of dust on the performance of wind turbines. Desalination 2007, 209, 209–220. [Google Scholar] [CrossRef]
- Khakpour, Y.; Bardakji, S.; Nair, S. Aerodynamic performance of wind turbine blades in dusty environments. In Proceedings of the ASME International Mechanical Engineering Congress and Exposition, Seattle, DC, USA, 11–15 November 2007; pp. 483–491. [Google Scholar]
- Jian, S.; Xiaoqian, M.; Shuying, C.; Huijing, G. Review of the cooling technology for high-power wind turbines. In Proceedings of the 5th International Conference on Advanced Design and Manufacturing Engineering, Shenzhen, China, 19–20 September 2015; pp. 19–20. [Google Scholar]
- Zhou, D.; Blaabjerg, F.; Lau, M.; Tonnes, M. Thermal profile analysis of doubly-fed induction generator based wind power converter with air and liquid cooling methods. In Proceedings of the 2013 15th European Conference on Power Electronics and Applications (EPE), Lille, France, 2–6 September 2013; pp. 1–10. [Google Scholar]
- Mahdi, M.; Smaili, A. Numerical investigations of the thermal behavior of a HAWT nacelle using ANSYS FLUENT. Energy Procedia 2017, 141, 394–398. [Google Scholar] [CrossRef]
- Khalilzadeh, S.; Nezhad, A.H. Using waste heat of high capacity wind turbines in a novel combined heating, cooling, and power system. J. Clean. Prod. 2020, 276, 123221. [Google Scholar] [CrossRef]
- López Rolo, A. Study of the Refrigeration and Air Filter Systems of Wind Turbine Nacelles in the Desert. Bachelor’s Thesis, Universidad Carlos III de Madrid, Getafe, Spain, 2019. [Google Scholar]
- Xydis, G.; Pechlivanoglou, G.; Nayeri, N.C. Wind turbine waste heat recovery—A short-term heat loss forecasting approach. Challenges 2015, 6, 188–201. [Google Scholar] [CrossRef]
- Hutten, I.M. Handbook of Nonwoven Filter Media; Elsevier: Amsterdam, The Netherlands, 2007. [Google Scholar]
- Wang, H.-C.; Kasper, G. Filtration efficiency of nanometer-size aerosol particles. J. Aerosol Sci. 1991, 22, 31–41. [Google Scholar] [CrossRef]
- Lee, K.; Liu, B. Theoretical study of aerosol filtration by fibrous filters. Aerosol Sci. Technol. 1982, 1, 147–161. [Google Scholar] [CrossRef]
- Edelman, L. Air filtration: Air filter media—An industry evolves. Filtr. Sep. 2008, 45, 24–26. [Google Scholar] [CrossRef]
- Bortolassi, A.; Guerra, V.; Aguiar, M. Characterization and evaluate the efficiency of different filter media in removing nanoparticles. Sep. Purif. Technol. 2017, 175, 79–86. [Google Scholar] [CrossRef]
- Smaili, A.; Tahi, A.; Massfon, C. Thermal analysis of wind turbine nacelle operating in Algerian Saharan climate. Energy Procedia 2012, 18, 187–196. [Google Scholar] [CrossRef]
- Feng, Z.; Pan, W.; Zhang, H.; Cheng, X.; Long, Z.; Mo, J. Evaluation of the performance of an electrostatic enhanced air filter (EEAF) by a numerical method. Powder Technol. 2018, 327, 201–214. [Google Scholar] [CrossRef]
- Feng, Z.; Long, Z.; Yu, T. Filtration characteristics of fibrous filter following an electrostatic precipitator. J. Electrost. 2016, 83, 52–62. [Google Scholar] [CrossRef]
- Park, J.H.; Yoon, K.Y.; Noh, K.C.; Byeon, J.H.; Hwang, J. Removal of PM2. 5 entering through the ventilation duct in an automobile using a carbon fiber ionizer-assisted cabin air filter. J. Aerosol Sci. 2010, 41, 935–943. [Google Scholar] [CrossRef]
- Park, J.H.; Yoon, K.Y.; Hwang, J. Removal of submicron particles using a carbon fiber ionizer-assisted medium air filter in a heating, ventilation, and air-conditioning (HVAC) system. Build. Environ. 2011, 46, 1699–1708. [Google Scholar] [CrossRef]
- Marar, Y. Renewable Energy Program in Jordan; Ministry of Energy Mineral Resources, The Hashemite Kingdom of Jordan: Amman, Jordan, 2019. [Google Scholar]
- Troen, I.; Lundtang Petersen, E. European Wind Atlas; Routledge: Oxford, UK, 1989. [Google Scholar]
- Abu-Rumman, G.; Khdair, A.I.; Khdair, S. Current status and future investment potential in renewable energy in Jordan: An overview. Heliyon 2020, 6, e03346. [Google Scholar] [CrossRef] [PubMed]
- Thomas, D.; Penicot, P.; Contal, P.; Leclerc, D.; Vendel, J. Clogging of fibrous filters by solid aerosol particles experimental and modelling study. Chem. Eng. Sci. 2001, 56, 3549–3561. [Google Scholar] [CrossRef]
- Xiang, J.; Weschler, C.J.; Mo, J.; Day, D.; Zhang, J.; Zhang, Y. Ozone, electrostatic precipitators, and particle number concentrations: Correlations observed in a real office during working hours. Environ. Sci. Technol. 2016, 50, 10236–10244. [Google Scholar] [CrossRef]
- Shi, B.; Ekberg, L. Ionizer Assisted Air Filtration for Collection of Submicron and Ultrafine Particles Evaluation of Long-Term Performance and Influencing Factors. Environ. Sci. Technol. 2015, 49, 6891–6898. [Google Scholar] [CrossRef]
- Feng, Z.; Long, Z.; Mo, J. Experimental and theoretical study of a novel electrostatic enhanced air filter (EEAF) for fine particles. J. Aerosol Sci. 2016, 102, 41–54. [Google Scholar] [CrossRef]
- Alewine, K.; Chen, W. A review of electrical winding failures in wind turbine generators. IEEE Electr. Insul. Mag. 2012, 28, 8–13. [Google Scholar] [CrossRef]
- Shalby, M.; Abuseif, A.; Gomaa, M.R.; Salah, A.; Marashli, A.; Al-Rawashdeh, H. Assessment of Dust Properties in Ma’an Wind Farms in Southern Jordan. Jordan J. Mech. Ind. Eng. 2022, 16, 645–652. [Google Scholar]
- Vojtesak, M.J.; Traxler, K.M.; Gilford, M.T.; Martin, K.P.; Hepburn, G. SWANEA (Southwest Asia-Northeast Africa) A Climatological Study. Volume 4. The Mediterranean Coast and Northeast Africa; Air Force Environmental Technical Applications Center Scott Afb Il: Fort Belvoir, VA, USA, 1991. [Google Scholar]
- Hubert, W.E.; Hull, A.N.; Morford, D.R.; Englebretson, R.E. Forecasters handbook for the Middle East/Arabian Sea; Ocean Data Systems Inc.: Monterey, CA, USA, 1983. [Google Scholar]
- Al-Qudah, B. Soils of Jordan. In Soil Resources of Southern and Eastern Mediterranean Countries; CIHEAM-IAMB: Bari, Italy, 2001; pp. 127–141. [Google Scholar]
- Vachon, W. Long-term O&M costs of wind turbines based on failure rates and repair costs. In Proceedings of the Proceedings WINDPOWER, American Wind Energy Association Annual Conference, Portland, OR, USA, 2–5 June 2002. [Google Scholar]
- Lemming, J.K.; Morthorst, P.E.; Hansen, L.; Andersen, P.D.; Jensen, P.H. O and M costs and economical life-time of wind turbines. In Proceedings of the 1999 European Wind Energy Conference and Exhibition, 1–5 March 1999; pp. 387–390. [Google Scholar]
- WInd, L. Wind and Hydropower Technologies Program. Available online: https://www.nrel.gov/docs/fy04osti/34916.pdf (accessed on 15 January 2023).


| No. | Wind Energy Farms | Location | Database Capacity (MW) |
|---|---|---|---|
| 1. | Hofa Wind Farm | Irbid | 0.225 |
| 2. | Ibrahimyah Wind Farm | Irbid | 0.32 |
| 3. | Tafila Wind Farm | Tafila | 117 |
| 4. | Ma’an Wind Farm | Ma’an | 80 |
| 5. | Fujeij Wind Farm | Ma’an/Fujeij | 89.1 |
| 6. | Rajef Wind Farm | Ma’an/Rajef | 86.1 |
| 7. | Shobak Wind Farm | Ma’an/Shobak | 45 |
| 8. | Abur Wind Farm | Tafila/Abur | 51.75 |
| 9. | Air Force Wind Farm | Mafraq | 10 |
| Chemical Element | Height < 1 m at Ground Level | Height > 100 m at Wind Turbine Nacelle Level |
|---|---|---|
| Calcium (Ca) | 57.33% | 85.83% |
| Silicon (Si) | 20.63% | 6.11% |
| Iron (Fe) | 11.17% | 2.20% |
| Weeks | Average Ambient Temperature (°C) | Average Wind Speed (m/s) | Cleaned Turbine | Uncleaned Turbine | Concentration Rate (μg/m3) | ||
|---|---|---|---|---|---|---|---|
| Average Turbine Temperature (°C) | Average Power Production (kW) | Average Turbine Temperature (°C) | Average Power Production (kW) | ||||
| 1st period | 8.09 | 8.37 | 12.67 | 1281.6 | 14.71 | 1186.17 | 22.5 |
| 2nd period | 14.67 | 7.72 | 22.34 | 1064.35 | 26.03 | 980.89 | 33.5 |
| 3rd period | 16.69 | 7.06 | 25.96 | 931.17 | 30.15 | 864.63 | 73 |
| 4th period | 12.55 | 8.11 | 19.59 | 1082.27 | 22.74 | 995.67 | 14 |
Disclaimer/Publisher’s Note: The statements, opinions and data contained in all publications are solely those of the individual author(s) and contributor(s) and not of MDPI and/or the editor(s). MDPI and/or the editor(s) disclaim responsibility for any injury to people or property resulting from any ideas, methods, instructions or products referred to in the content. |
© 2023 by the authors. Licensee MDPI, Basel, Switzerland. This article is an open access article distributed under the terms and conditions of the Creative Commons Attribution (CC BY) license (https://creativecommons.org/licenses/by/4.0/).
Share and Cite
Shalby, M.; Gomaa, M.R.; Salah, A.; Marashli, A.; Yusaf, T.; Laimon, M. Impact of the Air Filtration in the Nacelle on the Wind Turbine Performance. Energies 2023, 16, 3715. https://doi.org/10.3390/en16093715
Shalby M, Gomaa MR, Salah A, Marashli A, Yusaf T, Laimon M. Impact of the Air Filtration in the Nacelle on the Wind Turbine Performance. Energies. 2023; 16(9):3715. https://doi.org/10.3390/en16093715
Chicago/Turabian StyleShalby, Mohammad, Mohamed R. Gomaa, Ahmad Salah, Abdullah Marashli, Talal Yusaf, and Mohamd Laimon. 2023. "Impact of the Air Filtration in the Nacelle on the Wind Turbine Performance" Energies 16, no. 9: 3715. https://doi.org/10.3390/en16093715