Article

The Evolution of Energy Management Maturity in Organizations Subject to Mandatory Energy Audits: Findings from Italy

by
Annalisa Santolamazza
1,*,
Vito Introna
1,
Vittorio Cesarotti
1 and
Fabrizio Martini
2
1
Department of Enterprise Engineering, “Tor Vergata” University of Rome, 00133 Rome, Italy
2
DUEE-SPS-ESE Laboratory, Italian National Agency for New Technologies, Energy and Sustainable Economic Development (ENEA), Lungotevere Thaon di Revel, 76, 00196 Rome, Italy
*
Author to whom correspondence should be addressed.
Energies 2023, 16(9), 3742; https://doi.org/10.3390/en16093742
Submission received: 4 April 2023 / Revised: 17 April 2023 / Accepted: 19 April 2023 / Published: 27 April 2023

Abstract

:
Promoting energy efficiency is a key element of the strategic commitment of the European Community. Prominent among the binding measures established by the 2012 Energy Efficiency Directive to further this vision is the requirement for large companies to conduct energy audits every four years. After receiving the second cycle of energy audit reports in December 2019, a new description of the energy situation of Italian companies was made available. This presented the previously inaccessible possibility of comparing the two situations reported in 2015 and 2019 to assess the development of energy efficiency practices in organizations subject to the legislative obligation of energy audits in the country. To this end, in collaboration with the Italian National Agency for New Technologies, Energy and Sustainable Economic Development (ENEA), a project was initiated with the aim of developing the tools and methodologies necessary to assess in more detail the evolution that has occurred in the four years since 2015. In this paper, the findings of the analysis conducted on a significant sample of companies in Italy are presented. Through the design of a maturity model to assess the degree of progress achieved in a company’s energy management, the results of the two situations were analyzed. The analysis was deepened by assessing the progress achieved in different aspects of Energy Management: “Strategic Approach”, “Awareness, Competence, and Knowledge”, “Methodological Approach”, “Organizational Structure”, “Energy Performance Management and Information System”, and “Best Practices”. Furthermore, the observed variations were statistically tested using a pairwise t-test to make statistical inferences about the maturity of the total population of Italian enterprises under legislative obligation. The results have shown an increase in overall energy management maturity in each maturity dimension.

Graphical Abstract

1. Introduction

Energy efficiency promotion, the utilization of renewable sources, and pollutant emission reduction are crucial components of the European Community strategy. In October 2012, the Energy Efficiency Directive (EED) was established with the aim of achieving a 20% reduction in energy use before 2020 [1], energy efficiency target uploaded by the 2018/2002 directive to 32.5% by 2030 (relative to 1990 levels) [2], defining a balanced collection of binding measures and recommendations. The EED created a framework of measures to promote energy efficiency and ensure that European goals are met, as well as facilitate future advancements in energy efficiency after 2020. Article 8 of the framework requires affected companies to conduct energy audits. Large and/or energy-intensive organizations must provide these audits every four years and include details such as facility location, corporate characteristics, manufacturing processes, and finished products. In 2014, the Italian government implemented the EED through Legislative Decree No. 102/2014, expanding the requirement to include energy-intensive enterprises. The Italian National Agency for New Technologies, Energy and Sustainable Economic Development (ENEA) is responsible for managing and implementing the EED framework in Italy and uses the “Audit102” web portal to collect energy audits.
Energy audits are deemed the first step in increasing energy efficiency within an organization [3,4]. An energy audit, according to the European technical standard EN 16247, is a systematic and comprehensive analysis of the energy performance of an organization, equipment, systems, or processes. The purpose of the energy audit is to identify energy savings opportunities and propose solutions to improve energy efficiency, reduce energy consumption, and reduce greenhouse gas emissions. The energy audit process typically includes a preliminary phase to gather information about the facility and stakeholders’ objectives, field work to collect data, analysis to identify areas of energy waste and inefficiency, identification of energy saving opportunities and recommendations, and reporting [5]. The results of an energy audit can help owners and managers make informed decisions about investing in energy-efficient upgrades and can ultimately lead to significant energy and cost savings [4,6].
In this context, the present paper reports relevant research findings aimed at gaining insight into the current situation and the changes undergone by companies subject to the legislative obligation of conducting mandatory energy audits. Indeed, a research project was conducted in collaboration with ENEA, with the aim of developing the necessary tools and methodologies to assess in more detail the evolution that has occurred in Italian companies subject to mandatory energy audits.
In particular, in the present paper, the following research questions have been asked:
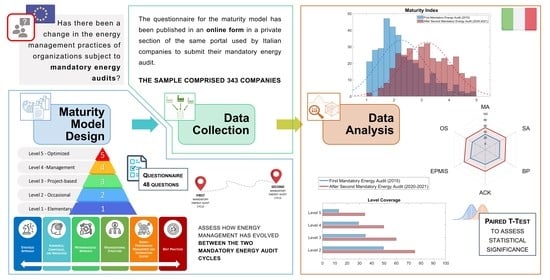
  • RQ1: Has there been a change in the energy management practices of organizations subject to mandatory energy audits in the timeframe between the two mandatory energy audit cycles?
  • RQ2: In reference to organizations subjected to mandatory energy audits, which energy management areas have undergone changes in the timeframe between the two mandatory energy audit cycles?
The novelty of this study lies in both the topic and the specifics of the research. Indeed, to the authors’ knowledge, it is the first time that organizations subject to mandatory energy audits have been analyzed in terms of the evolution of their energy management good practices, focusing on aspects such as the development of energy monitoring system [7,8], the implementation of EnPIs (Energy Performance Indicators) [9], and awareness and training programs for personnel [9]. Moreover, the significance of the research also lies in the scope of the analysis since it regards data from over 340 organizations which led mandatory energy audits, with varying initial conditions and dimensions.
The structure of the paper is as follows: Section 2 introduces the background, describing the use of maturity models to evaluate energy management aspects; Section 3 describes the research methodology used; Section 4 presents the findings; Section 5 presents the discussions; finally, Section 6 concludes the paper, highlighting the main results and interesting insights for future developments.

2. Background

The tool chosen as the most suitable to be able to evaluate the change of energy management practices in companies is the Maturity Model. In fact, maturity models are widely used to assess the organizational status of the company in a specific area and support the identification of potential areas for improvement. The concept of corporate maturity was conceived in 1979 by Philip Crosby in the work titled “Quality is free” [10] with the purpose of providing a tool for corporate management to measure, and therefore control, the degree of quality management in the organization. The proposed instrument was the “Quality Management Maturity Grid (QMMG)’. Subsequent to its first formulation, the concept of maturity has evolved over time, thanks to the interest of both academics and practitioners. Nowadays, the sectors in which maturity models are applied have expanded, from project management to security management and sustainability [11]. For example, a 2012 literature review identified 237 articles regarding the research on maturity models, covering more than 20 different domains [12].
Becker, Knackstedt, and Pöppelbuß provided a clear definition of a maturity model in 2009 [13]: “A maturity model consists of a sequence of maturity levels for a class of objects. It represents an anticipated, desired, or typical evolution path of these objects shaped as discrete stages”. Therefore, a maturity model is used to represent an evolutionary path for certain entities that may be represented by organizations or processes [13,14].
Maturity models are also tools suitable for the knowledge transfer process, since they can define a specific improvement path based on an assessment of current conditions and their comparison with relevant best practices [15]. They can often be configured in self-assessment mode, allowing professionals and organizations to identify key areas for improvement and actions to be taken.
Moreover, maturity models can be defined by different levels (or stages) of maturity and by several structuring dimensions. Dimensions give a systematic representation of the field of interest and should be defined so that they are distinct and representative of all aspects of the activity/process for which maturity is being evaluated [16]. Therefore, maturity models can be one-dimensional, multi-dimensional, or even hierarchical through the use of subdimensions [17].
Finally, the main characteristics common to all maturity models are as follows [11]:
  • Model structure—this can be “continuous” or “in stages”. For models in stages, each maturity level is considered as the basis for the next level. In continuous models, the approach to improvement is based on the development of processes’ capacities and is ongoing and flexible [11,16,17].
  • Methodology of analysis—this refers to the manner used to evaluate the organization’s maturity.
  • Reference to international standards—this can be beneficial for an organization that already has applied an international standard to choose to use a maturity model that is based on the same standard but, in contrast, other organizations could benefit more from using a maturity model not tailored to a specific standard.
  • Mode of assessment—this refers to the operational procedures used to conduct the evaluation. Most models are characterized by the presence of questionnaires with closed questions or grids. The number of questions is a compromise between a thorough evaluation and the aim to appeal to even less structured and less experienced organizations. Moreover, the possibility of self-assessment is an effective way to allow even less aware organizations to obtain an overall assessment of their maturity.
  • Results of the assessment—this refers to the differences in terms of results provided. They may vary according to the degree of detail of the assessment (e.g., a simple number or a more structured report). Often, the results of the assessments are supported by graphical tools to better convey the concept.
During the past decade, various models have been developed to evaluate the maturity of organizations in energy management. These models differ in terms of their structure, analysis methodology, reference to international standards, mode of assessment, results of assessment, and domain. The most widely used model structure is staged, which is easier for less mature organizations to understand. However, Carbon Trust developed both a staged and a continuous structured model in 2011 [18]. Moreover, different assessment methods have been used, such as workshops [19], interviews [20,21,22], and questionnaires. The last typology is the most used since it enables organizations to self-assess their performance independently, with varying degrees of depth (i.e., the number of questions ranges from 15–20 [23,24,25] to 40–60 [11,18,26]). Furthermore, most models analyze single sites, but Finnerty et al. have focused their attention on evaluating the maturity of multisite organizations, defining a self-guided assessment comprising sections for both the specific site and the overall organization [27,28]. Çoban and Onar had a similar focus but used a fuzzy methodology to implement the assessment [29]. Moreover, Wehner et al. defined a maturity model from a staged structure for the energy efficiency initiatives adopted by logistics service providers [30], while Benedetti et al. have focused on the management of specific energy assets such as compressed air systems [15]. Finally, Jin et al. recently proposed a maturity model to analyze the Chinese situation as well as that of other emerging economies [31].
While different attempts to define models to assess the maturity of organizations in energy management can be identified in the scientific literature, in this article, as described by the following section, a new specific maturity model was defined in collaboration with ENEA to evaluate how the dissemination of best practices in energy management has evolved in companies submitted to mandatory energy audits [32].

3. Research Methodology

3.1. Summary of the Research Methodology

The research methodology used to evaluate the development of energy management aspects in Italian companies, required to conduct mandatory energy audits, involved a series of steps.
Firstly, a maturity model was designed to assess the changes in critical characteristics of energy management in these companies. Subsequently, maturity assessment questionnaires were delivered and collected from a significant sample of companies. The collected data was then analyzed using main statistical tools, such as descriptive statistics and inferential statistics, to identify patterns and trends in the data. Overall, this methodology enabled the researchers to gain a comprehensive understanding of the evolution of energy management practices in Italian companies and to draw meaningful conclusions based on the analysis of the collected data (Figure 1).

3.2. Design of the Energy Management Maturity Model

The definition of the maturity model followed these methodological steps: definition of the structure of the model, definition of analysis methodology, and definition of assessment procedures. The most common structure found for the models examined was the staged one, which was evaluated as the most suitable to allow one to carry out an assessment of the evolution of maturity in the energy management of companies.
The proposed model was based on a model already developed by the authors, which has, however, been heavily modified to make it suitable for the purpose of the project, taking into account legislative and regulatory changes, changing the number of maturity dimensions, questions, and associated answers [11].
It was decided to use 5 levels, the most common in existing models, as a good compromise between the need for differentiation and the ease in the recognition of the actual behaviors:
  • Level 1—Elementary
Energy consumption is not considered relevant. In the organization, the energy performance of the organization has never been evaluated.
  • Level 2—Occasional
There is a tentative interest in the organization towards the issue of energy consumption. Generally, there is a lack of adequate commitment and support from above, and energy efficiency is pursued in an occasional manner. The preliminary collection of consumption data and energy costs might start.
  • Level 3—Project-based
A first strategy is identified and targets are set. Typical of this stage is the execution of an energy audit or the identification of specific opportunities for improvement. The collection and evaluation of energy data is systematized.
  • Level 4—Management
The company is led toward the development of an Energy Management System with an adequate information system and monitoring and the development of a plan of activities to achieve efficiency targets.
  • Level 5—Optimized
Inside the organization, an Energy Management System is present and continuously optimized, with the support of top management and the full involvement of the entire organization. In the case of a model in stages it is necessary to establish the operational mode to assess within the companies the achievement of different maturity levels (e.g., whether to reference to dimensions, targets, or processes such as the processes of ISO 50001).
In the proposed model, key aspects of energy management within an organization have been defined and used to create 6 dimensions. Each level may contain aspects related to the different dimensions of maturity. Below, the six maturity dimensions identified are listed (Figure 2):
  • Strategic approach (i.e., energy policy, measurable objectives, responsibilities, and action plan) (SA);
  • Awareness, competence, and knowledge (i.e., knowledge of the energy market, self-generation systems, capability to manage relationships with energy suppliers and services, equipment and materials providers, knowledge of the energy consumption structure of the site, analytical and statistical tools and methods of financial analysis) (ACK);
  • Methodological approach (i.e., the consistency, continuity, and systematization of planned actions) (MA);
  • Organizational structure (i.e., relations within the organization and the approach used to define and coordinate tasks) (OS);
  • Energy performance management and Information Systems (i.e., measurement system, data collection, analysis and reporting, energy performance indicator definition) (EPMIS);
  • Best practices (i.e., standardization and optimization of activities and processes that have an impact on the energy performance of the organization, such as maintenance and usage of machines and systems, purchase, design, and plant modifications, risks and opportunities assessment) (BS).
The assessment method chosen for the proposed maturity model was the self-assessment guided through a questionnaire. The reasons for this are related to the intention to reduce the risk of misunderstandings due to personal interpretations that could skew the results of the assessment while also enabling remotely data collection via web platform to promote data collection. For each level, a number of questions associated with each dimension have been identified, resulting in a total of 48 questions:
  • 12 questions for Level 2;
  • 14 questions for Level 3;
  • 15 questions for Level 4;
  • 7 questions for Level 5.
Since the first level is an elementary stage, it is not associated with any questions. From levels 2 to 5, questions are associated with a series of responses to characterize the specific level (the number of responses is equal to 4 for the first three levels, from second to fourth, while it is equal to 2 for the last level). Each question is also associated with maturity dimensions, as displayed in Table 1.
The organization that answers the questionnaire must choose the answer that better reflects their situation. The answers are defined so that if an answer is true, the previous ones are true. As a result, the score for each response can be calculated cumulatively. In order to enable companies to assess how their approach to energy management has evolved in the years between the two mandatory energy audit cycles, two answers are given for each question:
  • The first one, representative of the situation prior to the conduction of the energy audit (2015);
  • The second one, representative of the situation after the conduction of the second mandatory energy audit (2020–2021).
The presentation of the results is achieved through three indicators:
  • The global maturity index, a number between 1 and 5, which summarizes the overall level of maturity of the organization;
  • The degree of coverage of the different levels;
  • The development of maturity in different dimensions.
Thus, in accordance with the definition of the model, for every indicator two evaluations are made: the first representative of the situation before the conduction of the first energy audit and the second representative of the situation after the conduct of the second energy audit cycle.
To improve the effectiveness of the model, its first draft was tested on a small sample of companies by first letting each company answer the questions autonomously and then establishing an interview with it. Thus, it was possible to verify the adequacy of the results obtained and the ability of the tool to capture the changes undergone by the companies over the years and identify the causes. Moreover, the questionnaire was shared during several meetings with trade associations and ENEA. Their feedback was collected to assess the comprehensibility of the questions and the reliability of the results.
To provide benefits to the companies undergoing the maturity assessment, we decided to create a report describing the results of the analysis, highlighting the variation in global maturity index and each maturity level and dimension, also suggesting the most crucial areas to prioritize for their energy management improvement.

3.3. Data Collection

In the first months of 2021, with the collaboration of ENEA, the questionnaire for the maturity model was published in online form in a private section of the same portal used by Italian companies to submit their mandatory energy audit (https://audit102.enea.it/, accessed on 20 March 2023). The delivery and collection of the maturity assessment questionnaires was a success, making it possible to establish relevant results.
The number of companies in the database thus developed was 411 at the end of 2021. Of this initial sample, 68 companies were discarded for two main reasons:
  • Companies that did not answer all the questions in the questionnaire;
  • Companies that carried out the questionnaire by answering for the “first audit cycle” referring to a closer timeframe.
Thus, the sample analysed comprised 343 companies.
In Figure 3 it is possible to observe the distribution of the companies in the sample in relation to the main economic sectors (that is, the NACE code [33]).

3.4. Data Analysis

To analyze the results of the maturity questionnaire given to the sample of Italian companies, the main descriptive statistics were selected with the aim of identifying the following information [34]: distribution, mean, and standard deviation.
Subsequently, inferential statistics tools were used to expand the study.
For each company, having obtained two non-independent values for all the different maturity parameters defined in the construction of the maturity questionnaire (one relating to the situation prior to the first energy audit in 2015 and one relating to the current situation), a statistical test for paired data was carried out. The aim was to assess whether in the period between the first mandatory energy audit and the second mandatory energy audit cycle the performance in terms of energy management had improved in Italian companies. Therefore, it was investigated whether it was possible to assess in a statistically significant manner that, for the parameters quantified by the maturity questionnaire, the average of the population represented by Italian companies that have undergone mandatory energy audits in compliance with the legislative obligation had increased.
First of all, the difference for each of the pairs of paired observations was calculated. The hypothesis to be tested statistically is as follows:
H 0 : μ 2 μ 1 = δ 0 v a r i a b l e   n o t   i n c r e a s e d
H 1 : μ 2 μ 1 = δ > 0 v a r i a b l e   i n c r e a s e d
with μ 2 e μ 1 , respectively, the average values of the examined maturity index relative to the situation after the second audit cycle (2020–2021) and relative to the situation before the first energy audit cycle (2015).
If the test resulted in the rejection of the null hypothesis ( H 0 : δ 0 ) it would be possible to conclude that from 2015 to the following situation, the specific maturity indicator examined for companies subjected to mandatory energy audit has improved with a significance level of 5%. Therefore, this test was carried out by analysing differences between the situation before the 2015 energy audit cycle and the situation after the second mandatory energy audit cycle, in relation to different variables:
  • Global maturity index;
  • Degree of coverage of maturity levels;
  • Level of coverage of maturity dimensions.
Finally, to further explore the analysis and identify which specific aspects have changed more significantly and which, on the contrary, have remained more stable over the years, the variation of each individual question of the questionnaire was observed to assess how much individual requirements have been met.
It should be noted that to be able to exercise statistical inference to draw statistically valid conclusions about the entire population of companies that have complied with the legislative obligation, the following assumptions are valid (in relation to the analysis of paired data) [23,24]:
  • The sample of companies is assumed to be statistically representative of at least the entire population of companies subject to the legislative obligation;
  • Subjects (in this case companies) must be independent. The measurements of one subject must not influence the measurements of the others;
  • Paired measurements must be obtained from the same subject;
  • The measured differences must have a normal distribution, or the central limit theorem must still be valid (sample size > 30–40 elements).

4. Results

4.1. Analysis of the Global Maturity Index

Figure 4 shows the comparison of the global maturity index distributions at the time of the first audit (2015) and now (2021), after the second deadline of the legislative obligation. As can be seen, the distribution of the maturity index has changed, moving to the right, signifying an increase in the overall level of maturity of companies in energy management. In Figure 5 the distribution of the change in the overall maturity index is also shown. Specifically, in the first cycle, the average value of the maturity index of the companies in the sample was 2.27 (with a standard deviation of 0.85), while thereafter the average value was 3.19 (with a standard deviation of 0.88).
In order to verify the actual statistical significance of the observed variation, a paired t-test was then carried out in relation to the maturity index found in the two observed situations.
A t-test was performed for paired data to assess whether it was possible to conclude that the population of companies in 2021 had a higher average overall maturity index than previously in 2015. The p-value resulting from the analysis is less than 0.001 (2.68 × 10−72), so it is possible to conclude that the maturity index of the companies subjected to the legislative obligation has increased in these years with a significance level of 0.05.

4.2. Analysis of Maturity Levels

The analysis can be deepened by looking at how different levels of maturity have evolved (Figure 6). Each level has increased in coverage by an average of 20–25%.
Figure 7 compares the box plots of degree of coverage of the individual levels in 2015 and after the second round of energy audits (2020–2021).
In Figure 8 a summary of the comparisons of maturity level coverage in 2015 and after the second cycle of mandatory energy audits (2020–2021) is shown.
To verify the actual statistical significance of the apparent variation observed, a paired t-test was performed on variations in the degree of coverage of the levels. The results are reported in Table 2.
As shown in Table 2, all p-values resulting from paired t-test were less than 0.001, so it is possible to conclude that all maturity levels coverage for companies subjected to the legislative obligation have increased in these years with statistical significance.

4.3. Analysis of Maturity Dimensions

The analysis continues by examining the variations found in the different dimensions of maturity. On average, all dimensions increased by about 20% in their coverage (Figure 9).
Figure 10 compares box plots of the degree of coverage of the different dimensions in 2015 and after the second round of energy audits (2021).
Observing the variation of the dimensions in the sample (Figure 10), it can be seen that the dimensions relating to “Energy Performance Management and Information Systems” and “Strategic Approach” are the dimensions that have seen the greatest change in the sample.
Figure 11 shows a summary of comparisons between the coverage levels of Maturity Dimensions in 2015 and after the second round of energy audits (2020–2021).
To verify the actual statistical significance of the apparent variation observed, a paired t-test was carried out concerning the variations in the degree of coverage of the maturity dimensions. The results are reported in Table 3.
As shown by Table 3, all p-values resulting from paired test-t were less than 0.001, so it is possible to conclude that all maturity dimensions coverage for companies subjected to the legislative obligation increased in these years with statistical significance.
In general, all maturity dimensions also showed significant improvements, demonstrating an overall improvement in the practices with which companies that have complied with the energy audits obligation manage energy.

4.4. Analysis of the Individual Requirements (Analysis for Each Question)

After finding an actual change in the level of coverage of all levels of maturity management and dimensions, we proceeded to investigate further.
In order to identify which specific aspects have changed more significantly and which, on the contrary, have remained more stable over the years, we have proceeded to analyze in detail the variation of answers for each question, observing how the individual requirements of the maturity dimensions are being satisfied.
It is possible to compare the initial and current situation of energy management in relation to the “Awareness, Competence, Knowledge” dimension in Italian companies, observing the most widespread answers for each question (Figure 12).
  • Lev 2—Question 03: promotion of energy efficiency within the organization.
In the past, the organization had conducted promotional activities in a sporadic or ad hoc manner to raise staff awareness. However, currently, systematic ad hoc initiatives are being implemented both internally and externally to the organization, ensuring that all staff are aware of the importance of energy efficiency.
  • Lev 2—Question 10: technical knowledge of the energy aspects of personnel responsible for energy management.
Previously, the level of technical knowledge varied among different companies. Some companies had no specific knowledge or training, while others had almost sufficient knowledge. Currently, the situation is still variable. Some companies have limited and heterogeneous knowledge but are expecting to activate a training program soon. For other companies, the level of knowledge is adequate and they maintain it through periodic training activities.
  • Lev 3—Question 16: technical training (energy procurement, energy production/transformation, energy use, innovative technologies) offered to personnel responsible for energy management.
Previously, there was a lack of adequate specific training: some companies were about to start a training program, while others had covered only a few topics or trained only some of the concerned staff. Currently, the situation is quite similar, with some companies starting a training program or only covering main issues.
  • Lev 3—Question 17: type of management training (economic-financial evaluation of energy projects, energy audits, methods and tools for consumption analysis, information systems for energy management, energy management systems) offered to energy management personnel.
Previously, the situation was very varied: the staff had not yet received adequate specific training, were about to start a training program, or the training had covered only some topics or only part of the staff concerned. Currently, a training program is about to start or the training has covered only some issues or only part of the staff concerned.
  • Lev 4—Question 35: operational training on energy management (good practices related to energy use, maintenance, etc.).
Previously, there was no initiative in the direction of operational training or a training plan had been defined but had not yet been started. Currently, the situation is variable, with some companies having a formal training plan that is not yet complete, covering only some roles or aspects, while others have not started any initiative in this direction.
  • Lev 4—Question 40: organization awareness.
Previously, the organization had not adequately addressed the awareness of its commitment to energy efficiency by staff and their role and responsibilities in achieving the objectives. However, currently, some companies are carrying out a series of activities to fully achieve this aspect, while for others, it is still not adequately addressed.
  • Lev 5—Question 45: continuous training on energy efficiency.
In the past, only a few companies evaluated the training needs of their employees, planned, implemented, and periodically verified the effectiveness of training activities for energy management. Furthermore, only a few companies had planned to update their training programs periodically with respect to technological innovations. Currently, this happens more frequently than in the past, but it is still limited. The analysis highlights that there is still a wide margin for improvement in personnel training. The development of an energy management system can help organizations pay more attention and systematicity to training on energy issues.
It is possible to compare the initial and current situation of energy management in relation to the “Best Practices” dimension in Italian companies, observing the most widespread answers to the questionnaire for each question (Figure 13).
  • Lev 2—Question 11: use of incentive tools in the energy field available to the organization to promote the financing of energy efficiency interventions.
In the past, companies were generally interested in promoting energy efficiency interventions but had not evaluated specific tools such as “Energy Efficiency Certificates”. Now, some companies are fully aware of these tools and systematically consider their suitability when assessing the feasibility of efficiency projects. However, there is still room for improvement in this area to help companies turn energy audit opportunities into real savings.
  • Lev 2—Question 12: self-production of energy.
Previously, some companies had not addressed self-production of energy, while others had conducted preliminary or structured analyses. Today, most companies have conducted at least a preliminary analysis and will undertake interventions if the assessment of costs and benefits is positive.
  • Lev 3—Question 25: search for energy efficiency opportunities (e.g., through energy audits).
In the past, energy efficiency opportunities identified through energy audits had not led to the implementation of good practices for the use or maintenance of utilities and energy systems. Now, some companies have implemented new procedures for at least one of these functions, indicating greater confidence in audit tools and a willingness to identify feasible improvement interventions related not only to system modifications but also to methods of use and maintenance.
  • Lev 3—Question 26: risk analysis related to energy supply.
Before, some companies had never done this type of analysis, while others had done it but were struggling to act further. Now, the situation is varied, with some companies still not conducting this analysis, while others have taken preventive measures and developed emergency plans in case of energy supply interruption. This highlights a weakness in the companies’ approach to analyzing energy supply risks and offers room for improvement.
  • Lev 4—Question 32: identification and planning of good practices for the use of the organization’s plants and machinery.
Previously, some companies had no initiatives in this area, while others had good practices for some activities but were not well-documented or implemented regularly. Few companies were starting to systematically identify good practices.
Currently, there are good practices for some relevant activities that are not always documented or implemented regularly. Some companies are in the process of systematically and thoroughly identifying good practices for all relevant activities that significantly impact energy use. There is room for improvement which can be achieved through the development of an energy management system.
  • Lev 4—Question 33: identification and planning of good practices for the implementation of maintenance activities of the organization’s plants and machinery.
Both previously and currently, good practices exist for some relevant activities, but are not always documented or implemented regularly. Some companies are in the process of systematically and thoroughly identifying good practices for all relevant activities that significantly impact energy use. The same considerations as in the previous point apply.
  • Lev 4—Question 34: identification and planning of good practices for the implementation of the design and purchase of plants, machinery, and services.
Previously, some companies had no initiatives in this area, while others only had good practices for some activities, sometimes not well documented or implemented regularly. Few companies were starting to systematically identify good practices.
Currently, some companies have systematically and thoroughly identified good practices for all relevant activities that significantly impact energy use and they are regularly checked and updated. However, there is still room for improvement.
  • Lev 4—Question 41: risk assessment and opportunities for energy performance.
Previously, some companies had never conducted an energy risk analysis, while others were still in the process of developing it. Currently, more companies have conducted a preliminary risk analysis and established related preventive and corrective actions.
  • Lev 5—Question 48: research implementation and updating of good practices for the organization’s significant energy-related activities (source/service acquisition, design, installation, modifications, use, and maintenance of machinery and equipment).
Previously, only a few companies systematically researched, documented, and implemented good practices that were consistently followed by all employees. Fewer companies regularly reviewed and updated these good practices for continuous improvement based on suggestions from staff at all levels of the organization.
Currently, this happens more frequently than before, but still to a limited extent.
It is possible to compare the initial and current situation of energy management in relation to the “Energy Performance Management and Information Systems” dimension in Italian companies, observing the most widespread answers for each question (Figure 14).
  • Lev 2—Question 07: analysis of cost and consumption data.
In the past, companies only conducted occasional analysis of cost and consumption trends over time in case of anomalies or, for more energy-conscious companies, setting targets to follow. Today, companies periodically compare current and historical data to identify anomalies and set targets based on benchmark data. Some companies also conduct specific analyses on cost and consumption ratios and specific consumption in case of anomalies. This shift represents a significant improvement from an occasional to a systemic approach to energy performance control.
  • Lev 2—Question 08: data collection for energy source costs and consumption.
Previously, companies collected data on energy source costs and consumption annually or in each billing period. Nowadays, companies collect and report data several times a year and some companies even identify and report additional information necessary for understanding the consumption data (i.e., production units and working hours). This represents a significant improvement from previous practices.
  • Lev 2—Question 09: energy tariff analysis methods.
Previously, companies compared rates of different suppliers and conducted rate checks annually to identify the best rate for at least some energy sources, sometimes with the help of external professionals. Today, this practice is common for all main energy sources and the person responsible for the purchase selects the appropriate tariff structure with input from other managers (i.e., production manager). This reflects an increased attention to the choice of tariff.
  • Lev 3—Question 20: development of an energy measurement system.
Previously, some companies had no system to collect data on energy consumption, while others had at least defined methods for collecting data and set up a permanent measurement system for the main functional areas. Nowadays, at least the data collection has been defined and a permanent data collection and recording system has been set up for the main functional areas. Some companies have even established a detailed permanent data collection and recording system that covers the main significant processes and uses. This improvement is correlated with the attention paid to the measurement of consumption data in the recommendations of the second mandatory audits issued by ENEA.
  • Lev 3—Question 21: measurement of energy drivers.
Previously, some companies had not addressed the issue of identifying energy drivers, while others had carried out systematic analyses to identify them, but only for measurement points. Nowadays, the most relevant energy drivers have been measured, but only a few companies have proceeded to introduce them into the permanent measurement system with consumption energy. This indicates companies’ interest in understanding the causes of variation in energy consumption over time.
  • Lev 3—Question 22: analysis of energy consumption data.
Previously, data analysis was performed only at the global system level, seldom deepening the analysis. Today, at least the contribution of main functional areas and the temporal trend of consumption for each measurement point are periodically analyzed. More established companies conduct a periodic analysis that systematically takes into account consumption recorded with respect to monitored energy drivers. This represents a significant improvement that serves as the basis for understanding energy consumption dynamics and identifying anomalies and opportunities to reduce consumption.
  • Lev 3—Question 23: Energy Performance Indicators (EnPIs).
In the past, some companies did not use any energy performance indicators while others had specific EnPIs for main functional areas. Nowadays, almost all companies use global-level EnPIs, which consider energy drivers that affect performance. Some companies also use specific EnPIs for the main functional areas and energy processes/uses. Significant improvement can easily be related to the requirement of evaluating energy performance indicators defined by mandatory energy audits.
  • Lev 4—Question 30: energy consumption forecasting.
Previously, there was usually no consumption forecasting methodology or global consumption was predicted based solely on historical data. Currently, global consumption is predicted using historical data or forecast models that consider energy drivers (e.g., multivariable regression analysis). Although the improvement is limited in this case, the ability to predict consumption using complex models is crucial for organizations to maintain control over energy performance.
  • Lev 4—Question 31: periodic consumption control.
In the past, some companies did not carry out consumption checks, while others experimented with control strategies for significant functional areas/systems in terms of energy consumption. Nowadays, periodic checks based on historical consumption are carried out and some companies are experimenting with control based on consumption forecasting through models that consider energy drivers. This improvement aligns with the previous point.
  • Lev 5—Question 42: the information system for energy management.
Previously, only a few companies had an adequate information system for energy management that covered all areas/systems/services relevant to energy purposes, was integrated with the company’s information system, and was subject to periodic reviews and adjustments. Nowadays, this is more common, but still to a limited extent.
It is possible to compare the initial and current situation of energy management in relation to the “Methodological Approach” in Italian companies, observing the most common answers to the questionnaire for each question (Figure 15).
  • Lev 2—Question 04: regarding attitude towards energy efficiency opportunities.
Previously, the situation was very diverse: opportunities were not frequently sought, but there was a general interest if they were randomly identified. However, now opportunities are taken more promptly when there is a positive quantitative assessment of the related costs and benefits, or whenever they arise.
  • Lev 3—Question 18: energy audits frequency.
Previously, the situation was varied, with some companies never conducting audits and others conducting them with a frequency of 4 years. Currently, energy audits are conducted periodically with a frequency greater than that required by law.
  • Lev 3—Question 19: energy saving opportunities periodically identified (e.g., through energy audits).
Previously, the situation was diverse: many companies had never identified savings opportunities, while others had done so, but only with a summary cost/benefit assessment and, occasionally, a technical-economic feasibility analysis. Now, opportunities are reported in a list that provides a description and a summary cost/benefit assessment for each of them and sometimes an implementation plan is prepared for positively evaluated opportunities for which there is financial availability. This new approach is a direct consequence of the practices introduced with energy audit.
  • Lev 4—Question 27: development of an energy management plan.
Previously, activities were not always defined. Currently, activities are defined but are not always formalized and shared outside of the people responsible for implementation.
  • Lev 4—Question 36: non-conformities management.
Previously, there was no initiative in this direction or at most there were methods of managing non-conformities applied in an infrequent or irregular manner. Currently, non-conformities are managed in a regular and adequate manner.
  • Lev 4—Question 37: internal audits (inspections).
Previously, the situation was diverse: some companies had never conducted any, but for others, the management of internal audits almost always took place on a regular and adequate basis. Currently, internal audits are performed on a regular and adequate basis.
  • Lev 4—Question 38: energy management system (e.g., according to ISO 50001 standard).
Previously, most of the time there was no real Energy Management System, or work was underway to develop it. Currently, there is either no real Energy Management System or there is a management system that is fully and continuously implemented over time. This indicates that in several companies, the growing sensitivity to energy management has led to the decision to develop a real management system, even if there is more room for improvement.
  • Lev 5—Question 47: visibility of the organization.
It can be said that both previously and currently, few companies have been perceived and taken as a point of reference in the field of energy management. However, the work of these companies in this area is often cited as best practice and there are requests for presentations of their energy management system. This result seems to indicate that even organizations that have introduced the energy management system perceive they have further room for growth.
It is possible to compare the initial and current situation of energy management in relation to the “Organizational Structure” dimension in Italian companies, observing the most widespread answers to the questionnaire for each question (Figure 16).
  • Lev 2—Question 06: the Energy Manager.
Before, the situation varied in terms of the existence of an Energy Manager within companies. Some companies did not have one, while others had one informally or separately from the rest of the company. Currently, some companies have a formal energy manager, but not all, which sometimes limits their ability to involve staff from other areas as needed. This is still a significant improvement, but there is room for further progress.
  • Lev 3—Question 14: sharing of the energy issues within the organization.
Previously, most managers recognized the importance of energy management, but some saw it outside of their responsibilities, while others were only reactive when involved in specific projects. Nowadays, most managers are convinced of its importance and are proactive in reducing consumption or encouraging others to do so. This is a fundamental change as it requires the full participation of the organization for significant and continuous improvements.
  • Lev 3—Question 15: operational participation of the organization.
Previously, the Energy Manager operated autonomously within the organization. Now, the Energy Manager works with external experts and has varying degrees of systematic involvement with other managers within the organization. This is a crucial improvement in line with the previous point.
  • Lev 3—Question 24: internal communication.
In the past, there was little to no contact between the Energy Manager and the departments/areas that used energy, or only ad hoc meetings were held with representatives of different areas. Currently, meetings are held with representatives from various areas with varying degrees of consistency, depending on the company. Improved communication is a crucial step towards greater involvement of the entire organization.
  • Lev 4—Question 29: responsibility and tasks for energy management within the organization.
Previously, there was little awareness of the impact of different roles on energy consumption, and only a few key figures were identified, but without specific tasks and responsibilities. Now, some companies have identified the key figures and their impact on energy consumption and defined specific tasks and responsibilities to achieve energy efficiency. This is another crucial improvement in line with the previous points.
  • Lev 5—Question 44: attitude of the organization in energy management.
Previously, only a few companies viewed energy management as a strategic element and implemented measures to continuously and efficiently. Now, more companies view energy management as important, but it still happens to a limited extent.
  • Lev 5—Question 46: external communication on energy management.
Previously, only a few companies considered it important to disclose information on their energy performance and established an external communication plan. Today, more companies do so, but it is still limited.
It is possible to compare the initial and current situation of energy management in relation to the “Strategic Approach” dimension in Italian companies, observing the most common answers to the questionnaire for each question (Figure 17).
  • Lev 2—Question 01: the issue of an organization’s energy consumption.
Previously, some companies did not prioritize energy management and only took occasional measures to address it. Today, the importance placed on energy management is growing in companies, but there is still room for improvement in the systematic reduction in consumption and costs.
  • Lev 2—Question 02: the organization’s energy policy.
Previously, some companies did not have an energy policy, while others, while having it, did not share it widely. Now, most companies have an energy policy, but its dissemination and adoption are still variable, indicating a need for improvement.
  • Lev 2—Question 05: organization’s investment policies.
Previously, energy-saving investments were only considered if they were significantly cheaper than investments in the organization’s core business. Now, there is greater awareness of the importance of energy-saving investments, but not all companies evaluate them on the same level as core business investments.
  • Lev 3—Question 13: energy goals set by the organization.
Previously, energy goals were either nonexistent or established only at a global level. Now, some companies have defined specific energy goals for different levels and areas of the organization, indicating significant improvement with room for growth.
  • Lev 3—Question 23: energy performance indicators (EnPIs).
Previously, some companies did not use any EnPI, while others defined some specific EnPIs for the main functional areas. Today, most companies use EnPIs at the global level, with some using more specific indices for functional areas and energy processes.
  • Lev 4—Question 28: management control over the organization’s energy performance.
Previously, management only periodically checked energy costs against the budget, without much discussion. Now, some companies periodically discuss energy performance reports to verify goal achievement and define improvement action plans, demonstrating greater emphasis on understanding the relationship between budget trend and company actions.
  • Lev 4—Question 39: review of the Energy Management System (EMS).
Previously, management did not have direct involvement in the periodic review of EMS, but this was planned for the near future. Now, some companies have involved management in EMS review, but the timing and review methods are still not standardized, indicating significant room for improvement.
  • Lev 5—Question 43: alignment of the energy management system with the strategic objectives of the organization.
Previously, only a few companies periodically defined and described the organization’s energy-related strategic objectives at various levels, with the drive for the entire organization to work towards achieving them and producing measurable results. More companies are doing so, but to a limited extent, indicating a need for improvement.

4.5. Correlation Analysis between Global Maturity Index and Its Initial Value

Following the analyses conducted, an additional statistical analysis is reported to determine if there is a correlation between the final global maturity index and its initial value (i.e., first mandatory audit cycle), in order to understand if the initial level of maturity can influence its development. A preliminary analysis was conducted through the correlation diagram in Figure 18.
The dotted line identifies companies that have not undergone any variations in their global maturity index. The entire area above the line is widely occupied, although it can be observed that the number of companies that achieved indexes up to 3.5–4 starting from 1–2 is higher compared to those with bigger increases for the same starting range, as expected.
Moreover, the existence of correlation between the improvement of the overall maturity indicator and its initial level has been investigated through a statistical analysis.
The verification of the existence of correlation could be quantitatively conducted through the measurement of the main performance parameters (linear correlation coefficient R or Pearson’s index, R2 and observed p-value). The resulting p-value for the analysis was less than 0.001; therefore, it can be concluded that there was a negative correlation between the improvement of the overall maturity indicator and its initial level, indicating that energy management maturity has increased more over the years for initially less advanced companies, who have been able to take advantage of the opportunity given by energy audits to improve this aspect.
Considering that the practices corresponding to the systematic use of energy audit generally coincide with the practices corresponding to maturity level 3 of the model, it is interesting to note how even companies starting from non-elementary levels have had improvements, thus consolidating the good practices related to the use of such a tool.

5. Discussion

From the analysis it emerged that on average, companies that have complied with the obligation of mandatory energy audit have increased the maturity in their energy management.
Indeed, by examining the changes that have taken place and taking into account the significance of the different levels of maturity, it can be inferred that on average, Italian companies conducting mandatory energy audits have made progress in consolidating their approach to energy consumption. Specifically, focusing on the maturity possessed by the organizations, there has been a shift away from an “Occasional” or “Project-based” approach towards a more systemic approach, where companies are developing their own strategies for reducing energy consumption and costs by setting specific objectives and using energy audits’ tools. However, when it comes to organizations starting from a higher maturity level, such as “Management”, there is a wide range of progress. Although in 2015 there were fewer companies actively working towards developing a comprehensive energy management system, there is now a growing interest among companies, though this interest is at different stages of development. This consideration is also supported by the correlation analysis between the variation of maturity index and its initial value, which indicates that initially less advanced companies have generally achieved the greatest improvements.
Moreover, looking at the changes that have occurred in terms of maturity dimensions, the two most developed dimensions have been “Strategic Approach” and “Energy Performance Management and Information System”, which are also the ones with the highest initial values.
The improvement in the “SA” dimension shows the growth of support from top management in the development of actions pertaining energy efficiency, which could be the result of the fact that the audit obligation has brought the energy issue to the attention of management. On the other hand, the improvement in the “EPMIS” dimension highlights the general improvement in the measurement system for collecting, analysing, and reporting all the organisation’s energy performance data. This result could be easily explained by the need to collect reliable data to carry out the energy audit and by the stimulus to the development of the measurement system provided by the guidelines formulated by ENEA in view of the second cycle of mandatory energy audits and the percentage coverage thresholds of the measurement and/or monitoring plans indicated therein.
On the other hand, the analysis of single requirements shows that generally there is still lack in terms of preparation and training for energy management personnel and organizational awareness on the topic (“ACK” dimension), identification, and implementation of operational procedures for design, maintenance, and purchase and other such activities with impact on energy efficiency (“BP” dimension) and internal communication and clear responsibility for energy management personnel in the organization (“OS” dimension). In particular, it appears that the less developed requirements are the one associated with maturity levels 4 and 5. Indeed, this happens also for the “MA” dimensions, where the answers showed how organizations lack the structure and managing activities typically associated to the presence of an energy management system. It can be noted that all these practices and characteristics which appear to still be underdeveloped are not aspects that are not hugely affected by an energy audit execution.
Actually, the identified areas of improvement are usually achieved through the development of an energy management system; therefore, in order to achieve further progress, it is important to promote the stabilization of the observed improvement.
To foster energy audits benefits and take the first steps in this direction, organizations could enact several measures. For example, during the efficiency opportunity identification phase of the energy audit, personnel participation could be fostered to ensure the identification of the largest number of efficiency measures and their importance while also increasing the organization’ awareness on the theme. The detailed list of identified measures should also be kept and reviewed. Moreover, organization could be made part of the data analysis phase, thus improving their knowledge of analysis tools in order to foster their independent future use for both control and budgeting activities [35].

6. Conclusions

In this paper, the findings of an analysis on the evolution of energy management in organizations subject to mandatory energy audits have been described.
To start, a maturity model was created to evaluate how energy management practices changed in companies. The questionnaires were distributed to a significant number of companies to assess the variation of their maturity level. The analysis conducted on this significant sample of companies (343 enterprises) confirmed the model’s ability to discriminate different realities in terms of maturity and identify areas in which improvement has occurred. The data collected were analyzed using statistical techniques to gain a thorough understanding of how energy management practices have evolved in Italian companies and draw meaningful conclusions from the data analysis. For all observed variations (global maturity index, each level coverage, and each dimension coverage), their statistical significance was demonstrated, highlighting the increase in all energy management maturity areas. The average value of the global maturity index of the companies in the sample varied from 2.27 to 3.19, whereas each maturity level increased its coverage, on average, by at least 20% (up to 24% for Levels 2 and 3) and each maturity dimension increased its coverage up to 20%, on average.
Furthermore, the possible correlation between the improvement of the global maturity index and the initial maturity level was also analyzed to understand whether the initial maturity level could influence its development. A statistically significant relationship was observed, with the largest improvements obtained by companies starting from a more elementary maturity level at the onset of the obligation. This finding is reasonable considering that these companies, being in more elementary situations in terms of maturity, could easily take advantage of the opportunity provided by mandatory energy audits to evolve towards energy efficiency.
Moreover, it should be noted that the energy maturity requirements most improved are the ones that can be more affected by an energy audit execution such as EnPIs establishment and control, energy measurement campaign and information system, and efficiency opportunity identification.
In conclusion, the level of energy management maturity of companies which have undergone mandatory energy audits has increased, thus suggesting the positive contribution provided by this measure. The findings from the maturity model can support the legislator’s assessment, identifying areas where it could be more useful to develop supportive policies.
In relation to the results described, two limitations should be noted. The adhesion to the compilation of the questionnaire by organization subject to mandatory energy audit was voluntary. Another possible limitation of the study lies in the choice of the self-assessment tool, which leaves companies free to autonomously evaluate the answers to be included in the questionnaire.
Further development of this study could see the replication of the analysis on other countries, analyzing the differences among European organizations and investigating the possible correlation to specific national legislative actions. Moreover, it would be important to repeat the assessment of the evolution of maturity indicators after the third mandatory energy audit cycle. Finally, further research will investigate the evaluation of the variation of EnPIs and their correlation with the variation of the maturity indicator.

Author Contributions

Conceptualization and methodology, A.S. and V.I.; formal analysis, A.S.; writing—original draft preparation, A.S.; writing—review and editing, A.S., V.I., F.M. and V.C.; visualization, A.S.; supervision and project administration, V.I.; funding acquisition, F.M. All authors have read and agreed to the published version of the manuscript.

Funding

This work is part of the Electrical System Research (PTR 2019–2021), implemented under Programme Agreements between the Italian Ministry for Economic Development and ENEA, CNR, and RSE S.p.A.

Data Availability Statement

Data is contained within the article.

Conflicts of Interest

The authors declare no conflict of interest.

References

  1. Directive 2012/27/EU of the European Parliament and of the Council of 25 October 2012 on Energy Efficiency, Amending Directives 2009/125/EC and 2010/30/EU and Repealing Directives 2004/8/EC and 2006/32. OJ 2012, L315/1, 1–56. Available online: https://eur-lex.europa.eu/eli/dir/2012/27/oj (accessed on 22 March 2023).
  2. Directive (EU) 2018/2002 of the European Parliament and of the Council of 11 December 2018 Amending Directive 2012/27/EU on Energy Efficiency (Text with EEA Relevance). 2018, Volume 328. Available online: https://eur-lex.europa.eu/eli/dir/2018/2002/oj (accessed on 22 March 2023).
  3. Herce, C.; Biele, E.; Martini, C.; Salvio, M.; Toro, C. Impact of Energy Monitoring and Management Systems on the Implementation and Planning of Energy Performance Improved Actions: An Empirical Analysis Based on Energy Audits in Italy. Energies 2021, 14, 4723. [Google Scholar] [CrossRef]
  4. Schleich, J. Do Energy Audits Help Reduce Barriers to Energy Efficiency? An Empirical Analysis for Germany. IJETP 2004, 2, 226. [Google Scholar] [CrossRef]
  5. EN 16247-1:2022; Energy Audits—Part 1: General Requirements. European Committee for Standardization (CEN): Brussels, Belgium, 2022.
  6. European Investment Bank; Revoltella, D.; Kalantzis, F. How Energy Audits Promote SMEs’ Energy Efficiency Investment; Publications Office of the European Union: Luxembourg, 2019; ISBN 978-92-861-4228-4. [Google Scholar]
  7. Bonfá, F.; Benedetti, M.; Ubertini, S.; Introna, V.; Santolamazza, A. New Efficiency Opportunities Arising from Intelligent Real Time Control Tools Applications: The Case of Compressed Air Systems’ Energy Efficiency in Production and Use. In Proceedings of the Energy Procedia, Hong Kong, China, 22–25 August 2018; Elsevier Ltd.: Amsterdam, The Netherlands, 2019; Volume 158, pp. 4198–4203. [Google Scholar]
  8. Salvatori, S.; Benedetti, M.; Bonfà, F.; Introna, V.; Ubertini, S. Inter-Sectorial Benchmarking of Compressed Air Generation Energy Performance: Methodology Based on Real Data Gathering in Large and Energy-Intensive Industrial Firms. Appl. Energy 2018, 217, 266–280. [Google Scholar] [CrossRef]
  9. ISO 50001:2018; Energy Management Systems—Requirements with Guidance for Use 2018. International Organization for Standardization (ISO): Geneva, Switzerland, 2018.
  10. Crosby, P.B. Quality Is Free: The Art of Making Quality Certain; McGraw-Hill: New York, NY, USA, 1979. [Google Scholar]
  11. Introna, V.; Cesarotti, V.; Benedetti, M.; Biagiotti, S.; Rotunno, R. Energy Management Maturity Model: An Organizational Tool to Foster the Continuous Reduction of Energy Consumption in Companies. J. Clean. Prod. 2014, 83, 108–117. [Google Scholar] [CrossRef]
  12. Wendler, R. The Maturity of Maturity Model Research: A Systematic Mapping Study. Inf. Softw. Technol. 2012, 54, 1317–1339. [Google Scholar] [CrossRef]
  13. Becker, J.; Knackstedt, R.; Pöppelbuß, J. Developing Maturity Models for IT Management. Bus. Inf. Syst. Eng. 2009, 1, 213–222. [Google Scholar] [CrossRef]
  14. Mettler, T.; Rohner, P.; Winter, R. Towards a Classification of Maturity Models in Information Systems. In Management of the Interconnected World; D’Atri, A., De Marco, M., Braccini, A.M., Cabiddu, F., Eds.; Physica-Verlag HD: Heidelberg, Germany, 2010; pp. 333–340. ISBN 978-3-7908-2403-2. [Google Scholar]
  15. Benedetti, M.; Bonfà, F.; Bertini, I.; Introna, V.; Salvatori, S.; Ubertini, S.; Paradiso, R. Maturity-Based Approach for the Improvement of Energy Efficiency in Industrial Compressed Air Production and Use Systems. Energy 2019, 186, 115879. [Google Scholar] [CrossRef]
  16. Fraser, P.; Moultrie, J.; Gregory, M. The Use of Maturity Models/Grids as a Tool in Assessing Product Development Capability. In Proceedings of the IEEE International Engineering Management Conference, Cambridge, UK, 18–20 August 2002; IEEE: Cambridge, UK, 2002; Volume 1, pp. 244–249. [Google Scholar]
  17. Lahrmann, G.; Marx, F. Systematization of Maturity Model Extensions. In Global Perspectives on Design Science Research; Winter, R., Zhao, J.L., Aier, S., Eds.; Springer: Berlin/Heidelberg, Germany, 2010; pp. 522–525. [Google Scholar]
  18. Carbon Trust Energy Management—A Comprehensive Guide to Controlling Energy Use. In Energy Management—A Comprehensive Guide to Controlling Energy Use; Association for Decentralised Energy: London, UK, 2011.
  19. Ngai, E.W.T.; Chau, D.C.K.; Poon, J.K.L.; To, C.K.M. Energy and Utility Management Maturity Model for Sustainable Manufacturing Process. Int. J. Prod. Econ. 2013, 146, 453–464. [Google Scholar] [CrossRef]
  20. Qiang, R.; Jiang, Y. Enterprise Energy Saving and Emission Reduction Level Assessment Research Based on the Capability Maturity Model. In Proceedings of the 2009 International Conference on Management and Service Science, Beijing, China, 20–22 September 2009; IEEE: Beijing, China, 2009; pp. 1–5. [Google Scholar]
  21. Curry, E.; Conway, G.; Donnellan, B.; Sheridan, C.; Ellis, K. A Maturity Model for Energy Efficiency in Mature Data Centres. In Proceedings of the SMARTGREENS 2012—1st International Conference on Smart Grids and Green IT Systems, Porto, Portugal, 19–20 April 2012; pp. 263–267. [Google Scholar]
  22. Curry, E.; Conway, G.; Donnellan, B.; Sheridan, C.; Ellis, K. Measuring Energy Efficiency Practices in Mature Data Center: A Maturity Model Approach. In Proceedings of the Computer and Information Sciences III—27th International Symposium on Computer and Information Sciences, Paris, France, 3–4 October 2012; ISCIS 2012. pp. 51–61. [Google Scholar]
  23. EDF Climate Corps EDF Smart Energy Diagnostic Survey. 2015. Available online: http://edfclimatecorps.org/edf-smart-energy-best-practices-survey (accessed on 20 March 2023).
  24. Jovanović, B.; Filipović, J. ISO 50001 Standard-Based Energy Management Maturity Model—Proposal and Validation in Industry. J. Clean. Prod. 2016, 112, 2744–2755. [Google Scholar] [CrossRef]
  25. Prashar, A. Energy Efficiency Maturity (EEM) Assessment Framework for Energy-Intensive SMEs: Proposal and Evaluation. J. Clean. Prod. 2017, 166, 1187–1201. [Google Scholar] [CrossRef]
  26. O’Sullivan, J. Energy Management Maturity Model (EM3)—A Strategy to Maximize the Potential for Energy Savings through EnMS; Sustainable Energy Authority of Ireland: Dublin, Ireland, 2012. [Google Scholar]
  27. Finnerty, N.; Sterling, R.; Coakley, D.; Keane, M.M. An Energy Management Maturity Model for Multi-Site Industrial Organisations with a Global Presence. J. Clean. Prod. 2017, 167, 1232–1250. [Google Scholar] [CrossRef]
  28. Finnerty, N.; Sterling, R.; Coakley, D.; Contreras, S.; Coffey, R.; Keane, M.M. Development of a Global Energy Management System for Non-Energy Intensive Multi-Site Industrial Organisations: A Methodology. Energy 2017, 136, 16–31. [Google Scholar] [CrossRef]
  29. Çoban, V.; Onar, S.Ç. Energy Management Maturity Model Based on Fuzzy Logic. In Intelligent and Fuzzy Techniques in Big Data Analytics and Decision Making; INFUS 2019. Advances in Intelligent Systems and Computing; Kahraman, C., Cebi, S., Cevik Onar, S., Oztaysi, B., Tolga, A., Sari, I., Eds.; Springer: Cham, Switzerland, 2020; Volume 1029. [Google Scholar]
  30. Wehner, J.; Taghavi Nejad Deilami, N.; Altuntas Vural, C.; Halldórsson, Á. Logistics Service Providers’ Energy Efficiency Initiatives for Environmental Sustainability. IJLM 2022, 33, 1–26. [Google Scholar] [CrossRef]
  31. Jin, Y.; Long, Y.; Jin, S.; Yang, Q.; Chen, B.; Li, Y.; Xu, L. An Energy Management Maturity Model for China: Linking ISO 50001:2018 and Domestic Practices. J. Clean. Prod. 2021, 290, 125168. [Google Scholar] [CrossRef]
  32. Santolamazza, A.; Introna, V.; Cesarotti, V.; Martini, F.; Toro, C. Proposal of an Energy Management Maturity Model to Assess the Progress Achieved through Mandatory Energy Audit Application in the Eu Energy Efficiency Directive Context. In Proceedings of the Summer School Francesco Turco, Bergamo, Italy, 9–11 September 2020. [Google Scholar]
  33. EUROSTAT NACE Rev. 2; Office for Official Publications of the European Communities: Luxembourg, 2008; ISBN 978-92-79-04741-1.
  34. Montgomery, D.C.; Runger, G.C. Applied Statistics and Probability for Engineers; John Wiley & Sons, Inc.: Hoboken, NJ, USA, 2018. [Google Scholar]
  35. Cesarotti, V.; Di Silvio, B.; Introna, V. Energy Budgeting and Control: A New Approach for an Industrial Plant. Int. J. Energy Sect. Manag. 2009, 3, 131–156. [Google Scholar] [CrossRef]
Figure 1. Summary of the research methodology used.
Energies 16 03742 g001
Figure 2. Representation of six maturity dimensions of the maturity model.
Energies 16 03742 g002
Figure 3. Display of the most represented NACE codes in the collected sample.
Energies 16 03742 g003
Figure 4. Comparison of the distribution of the global maturity index in 2015 and after the second round of energy audits (2020–2021).
Energies 16 03742 g004
Figure 5. Distribution of the difference in the overall maturity index between the two instances (first audit cycle vs. second audit cycle).
Energies 16 03742 g005
Figure 6. Comparison of level of coverage of the individual levels in 2015 and after the second round of energy audits (2021).
Energies 16 03742 g006
Figure 7. Box-plot comparison of the degree of coverage of the individual levels in 2015 and after the second round of energy audits (2020–2021).
Energies 16 03742 g007
Figure 8. Summary of comparisons of maturity levels’ coverage in 2015 and after the second round of energy audits (2021): (a) distribution comparison for Level 2 coverage; (b) distribution comparison for Level 3 coverage; (c) distribution comparison for Level 4 coverage; (d) distribution comparison for Level 5 coverage.
Energies 16 03742 g008
Figure 9. Comparison of level of coverage of the individual dimensions in 2015 and after the second round of energy audits (2020–2021).
Energies 16 03742 g009
Figure 10. Box-plot comparison of the level of coverage of the individual dimensions in 2015 and after the second round of energy audits (2020–2021).
Energies 16 03742 g010
Figure 11. Summary of comparisons of maturity dimensions’ coverage in 2015 and after the second round of energy audits (2020–2021): (a) distribution comparison for Methodological Approach; (b) distribution comparison for Strategic Approach; (c) distribution comparison for Best Practices; (d) distribution comparison for Awareness, Competence, Knowledge; (e) distribution comparison for Energy Performance Management and Information Systems; (f) distribution comparison for Organizational Structure.
Energies 16 03742 g011aEnergies 16 03742 g011b
Figure 12. Box-plot of sample answers for each question—Dimension “Awareness, Competence, Knowledge”.
Energies 16 03742 g012
Figure 13. Box-plot of sample answers for each question—Dimension “Best Practices”.
Energies 16 03742 g013
Figure 14. Box-plot of sample answers for each question—Dimension “Energy Performance Management and Information Systems”.
Energies 16 03742 g014
Figure 15. Box-plot of sample answers for each question—Dimension “Methodological Approach”.
Energies 16 03742 g015
Figure 16. Box-plot of sample answers for each question—Dimension “Organizational Structure”.
Energies 16 03742 g016
Figure 17. Box-plot of sample answers for each question—Dimension “Strategic Approach”.
Energies 16 03742 g017
Figure 18. Scatter plot for the correlation between the initial and final global maturity index.
Energies 16 03742 g018
Table 1. Association of each question of the maturity model and maturity dimensions.
Maturity DimensionAssociated Questions
Methodological ApproachLevel 2: Q04
Level 3: Q18; Q19
Level 4: Q27; Q36; Q37; Q38
Level 5: Q47
Strategic ApproachLevel 2: Q01; Q02; Q05
Level 3: Q13; Q23
Level 4: Q28; Q39
Level 5: Q43
Best PracticesLevel 2: Q11; Q12
Level 3: Q25; Q26
Level 4: Q32; Q33; Q34; Q41
Level 5: Q48
Awareness, Competence, KnowledgeLevel 2: Q03; Q10
Level 3: Q16; Q17
Level 4: Q35; Q40
Level 5: Q45
Energy Performance Management and Information SystemsLevel 2: Q07; Q08; Q09
Level 3: Q20; Q21; Q22; Q23
Level 4: Q30; Q31
Level 5: Q42
Organizational StructureLevel 2: Q06
Level 3: Q14; Q15; Q24
Level 4: Q29
Level 5: Q44; Q46
Table 2. Statistical analysis of the coverage of maturity levels for the sample: mean value and standard deviation of each maturity level with respect to the first and second mandatory energy audits and p-value for the t-test for the variations between two periods for each maturity level.
Maturity LevelMandatory Energy Audit CycleMeanStandard Deviationp-Value for t-Test
Level 2First49.5924.456.52 × 10−80
Second75.0018.96
Level 3First34.9024.005.88 × 10−75
Second59.8922.42
Level 4First29.3622.664.96 × 10−58
Second49.8424.96
Level 5First13.2925.696.62 × 10−35
Second34.4934.23
Table 3. Statistical analysis of the coverage of maturity dimensions for the sample: mean value and standard deviation of each maturity dimension with respect to both the first and second mandatory energy audits and the p-value for the t-test for the variations between two periods for each maturity dimension.
Maturity DimensionMandatory Energy Audit CycleMeanStandard Deviationp-Value for t-Test
MA 1First31.9222.651.71 × 10−63
Second54.1522.67
SA 1First36.1723.541.24 × 10−69
Second60.2323.55
BP 1First34.8922.229.20 × 10−69
Second56.2822.25
ACK 1First30.0225.044.88 × 10−66
Second53.3925.05
EPMIS 1First37.6922.251.52 × 10−70
Second62.0422.27
OS 1First30.2226.012.84 × 10−62
Second53.9826.04
1 MA: Methodological Approach; SA: Strategic Approach; BP: Best Practices; ACK: Awareness, Competence, Knowledge; EPMIS: Energy Performance Management and Information Systems; OS: Organizational Structure.
Disclaimer/Publisher’s Note: The statements, opinions and data contained in all publications are solely those of the individual author(s) and contributor(s) and not of MDPI and/or the editor(s). MDPI and/or the editor(s) disclaim responsibility for any injury to people or property resulting from any ideas, methods, instructions or products referred to in the content.

