
Technical Analysis of the Large Capacity Grid-Connected Floating Photovoltaic System on the Hydropower Reservoir


Abstract
:1. Introduction
2. Technical Analysis of the FPV System
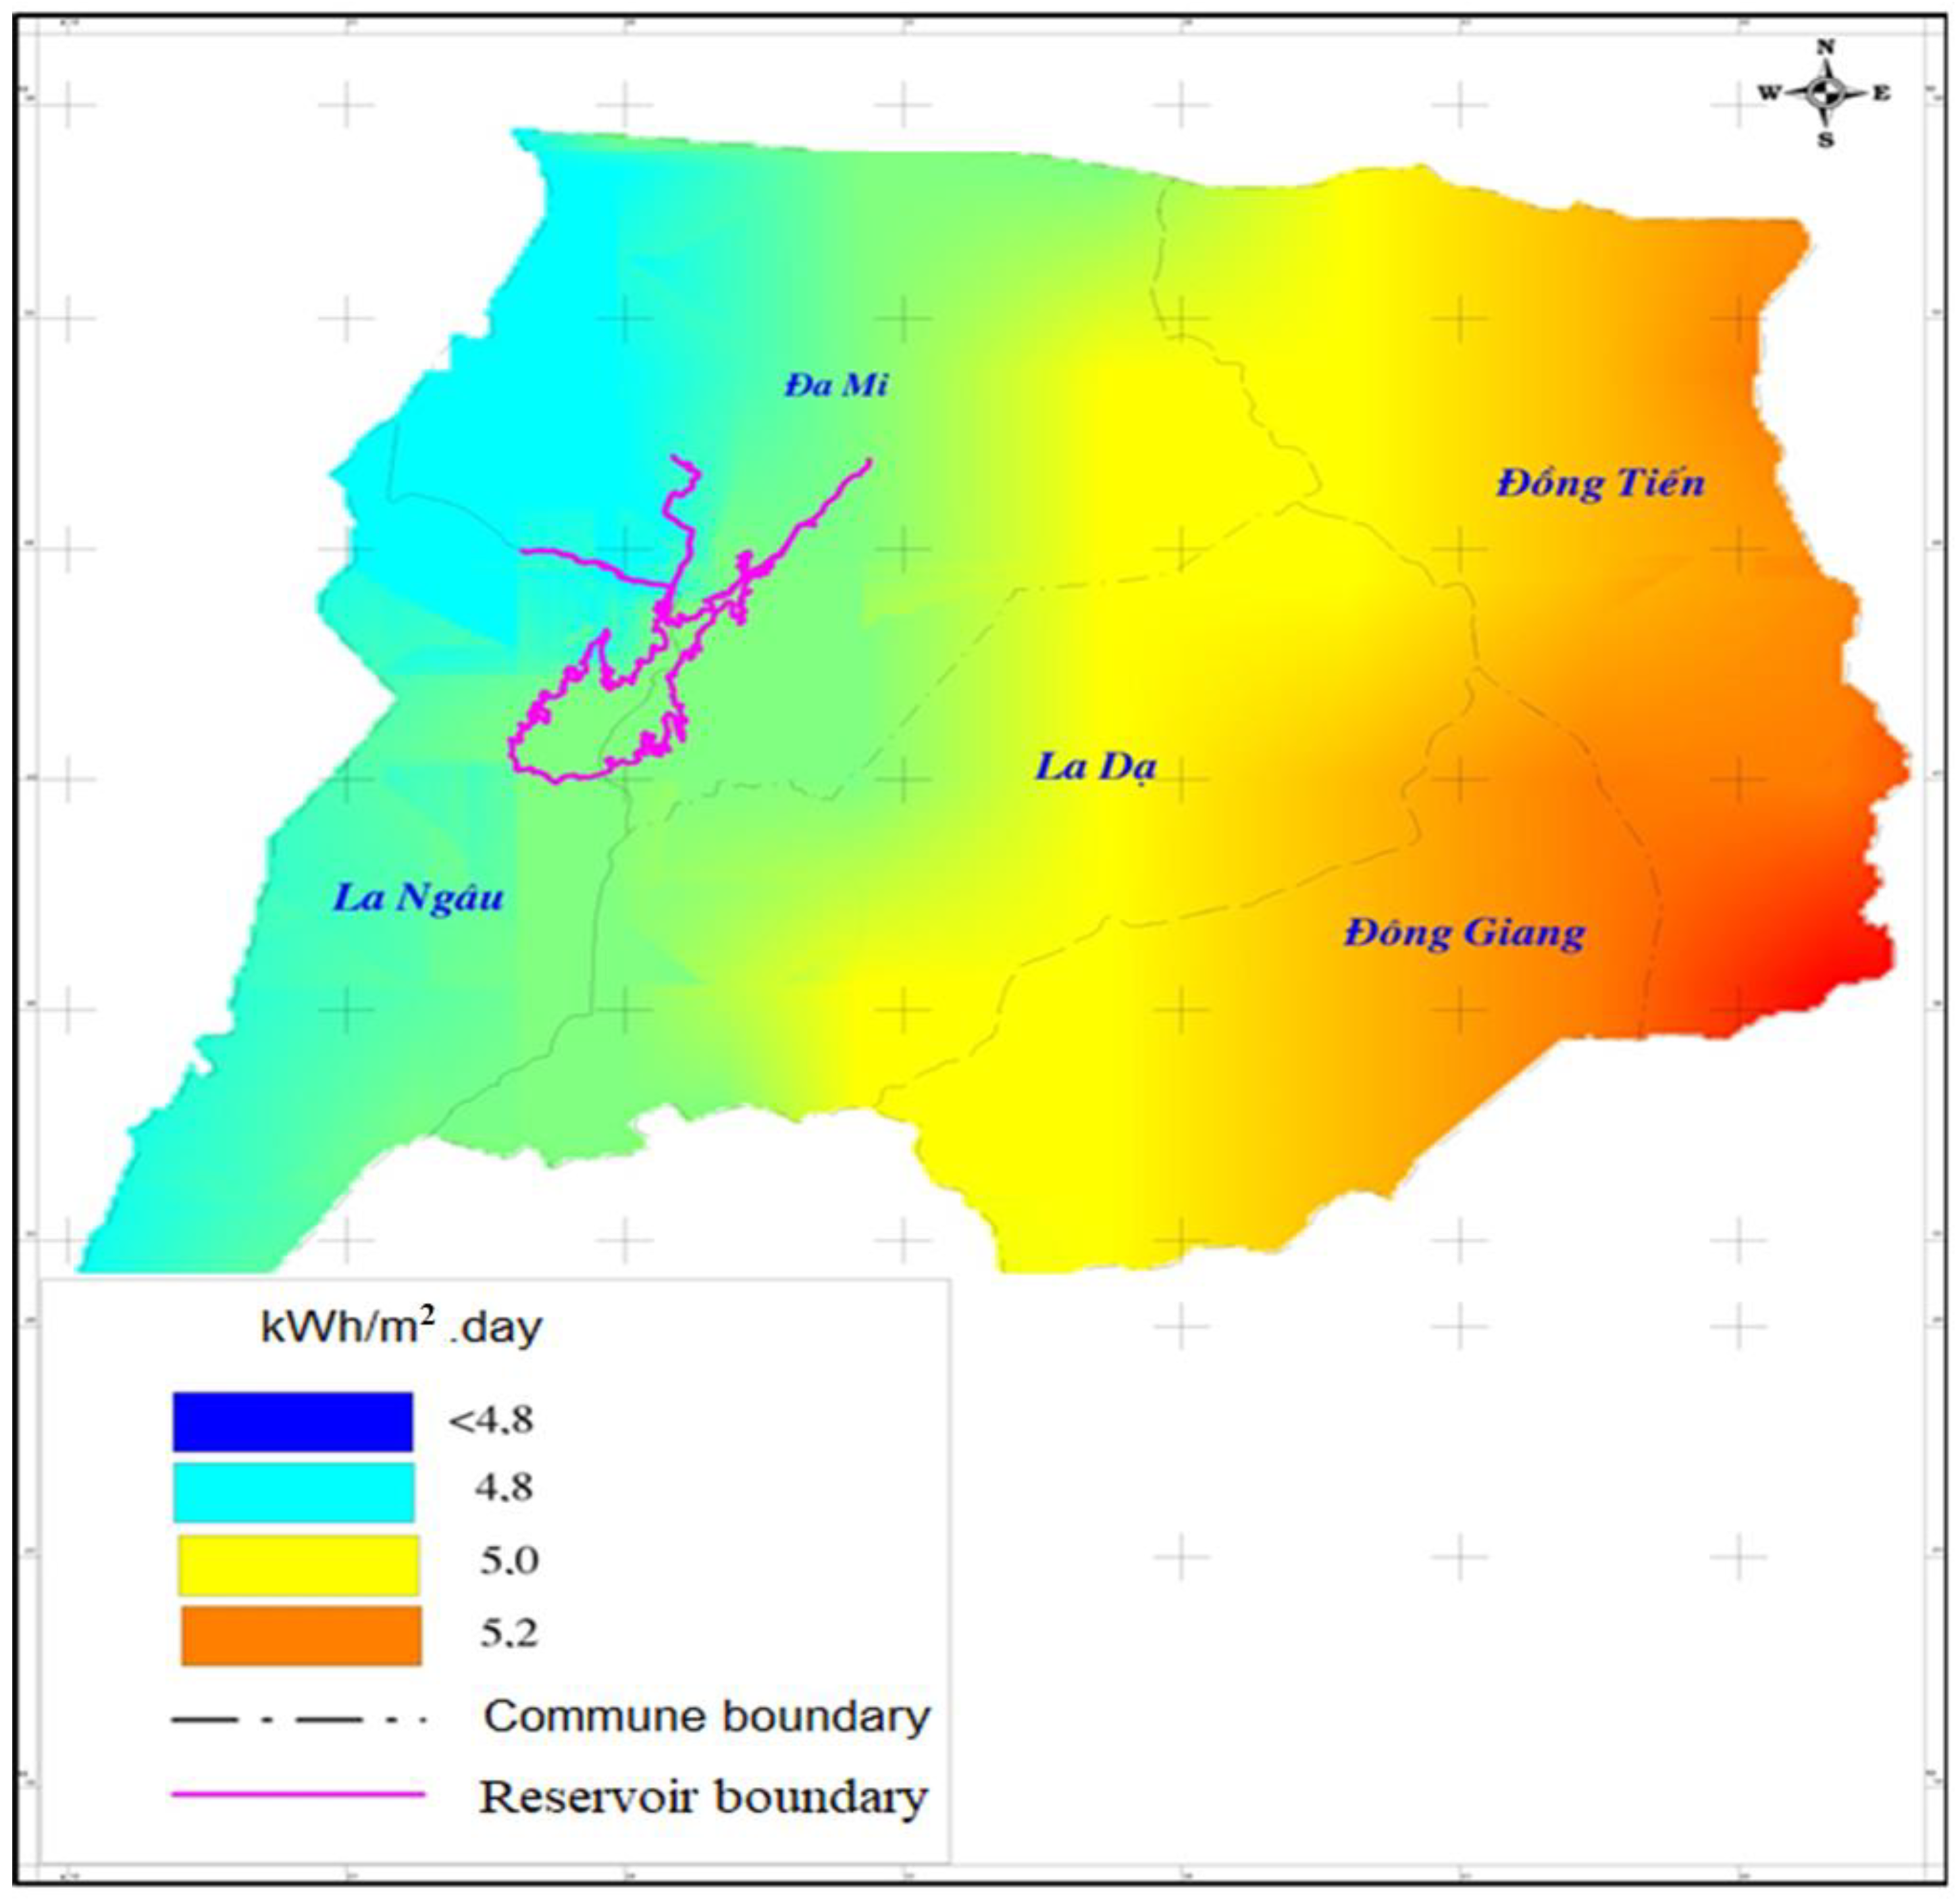
2.1. Solar Radiation Data at the Plant Area
- TS: Average hourly meteorological value, measured from 1 July 2006 to 28 February 2017;
- TMY P50: Typical meteorological value in the year of probability P50, calculated from the series 1 January 2007–31 December 2016;
- TMY P90: Typical meteorological value in the year of probability P90, calculated from the series 1 January 2007–31 December 2016;
- In which the data string includes:
- GTI: Global tilted irradiance (Wh/m2)—Tilted angle 12°, South-facing;
- GHI: Global horizontal irradiation (Wh/m2);
- DHI: Diffuse horizontal irradiation (Wh/m2);
- SE: The altitude angle (degrees);
- SA: Sun’s azimuth (degrees);
- WD: Wind direction (degrees);
- TEMP: Air temperature at 2 m (°C);
- WS: Wind speed at a height of 10 m (m/s).
2.2. The Grid-Connected FPV System
- Photovoltaic module (PV module): each photovoltaic module consists of many photovoltaic cells (PV cells); the PV modules will be connected in series (string or panel) and parallel (array or system) to achieve the required DC output power;
- Inverter: a powerful electronic device that converts DC current into AC current;
- Step-up transformers: depending on the capacity scale and regional utility grid conditions, the voltage can be changed appropriately (for example, 22 kV, 35 kV, 110 kV, 220 kV). High voltage levels will need two levels of transformers;
- Floatation system (pontoon or mounting system): with the solution of installing modules on the water, the rack system is replaced by a water-base floating system;
- Structural system: connecting the floatation system and supporting the PV panels;
- Mooring system: consists of mooring lines anchored to the anchoring blocks at the reservoir bottom and the above pontoon bridge system to ensure stability during operation, subsequent construction, and operation;
- Infrastructure for utility grid connection: the substation, including protection, metering, and controlling equipment.
2.2.1. PV Module
2.2.2. Matching PV Arrays and Inverters
Total Installed Capacity of Inverter
Main Parameters of Inverter
2.2.3. Calculation of Choosing Medium Voltage Transformer
- DC input power of the inverter;
- The required power factor of PV power is 0.95;
- Inverter efficiency is 0.985.
- Connection diagram: 1 inverter connects 1 transformer; transformer capacity is 2500 kVA, a total of 17 transformers;
- Total capacity of transformers: 42.5 MVA.
- Rated high voltage 22 kV.
- Rated low voltage 600 Vac.
3. FPV Plant Design
3.1. Installed Design for PV Modules
3.1.1. Module Tilt Angle
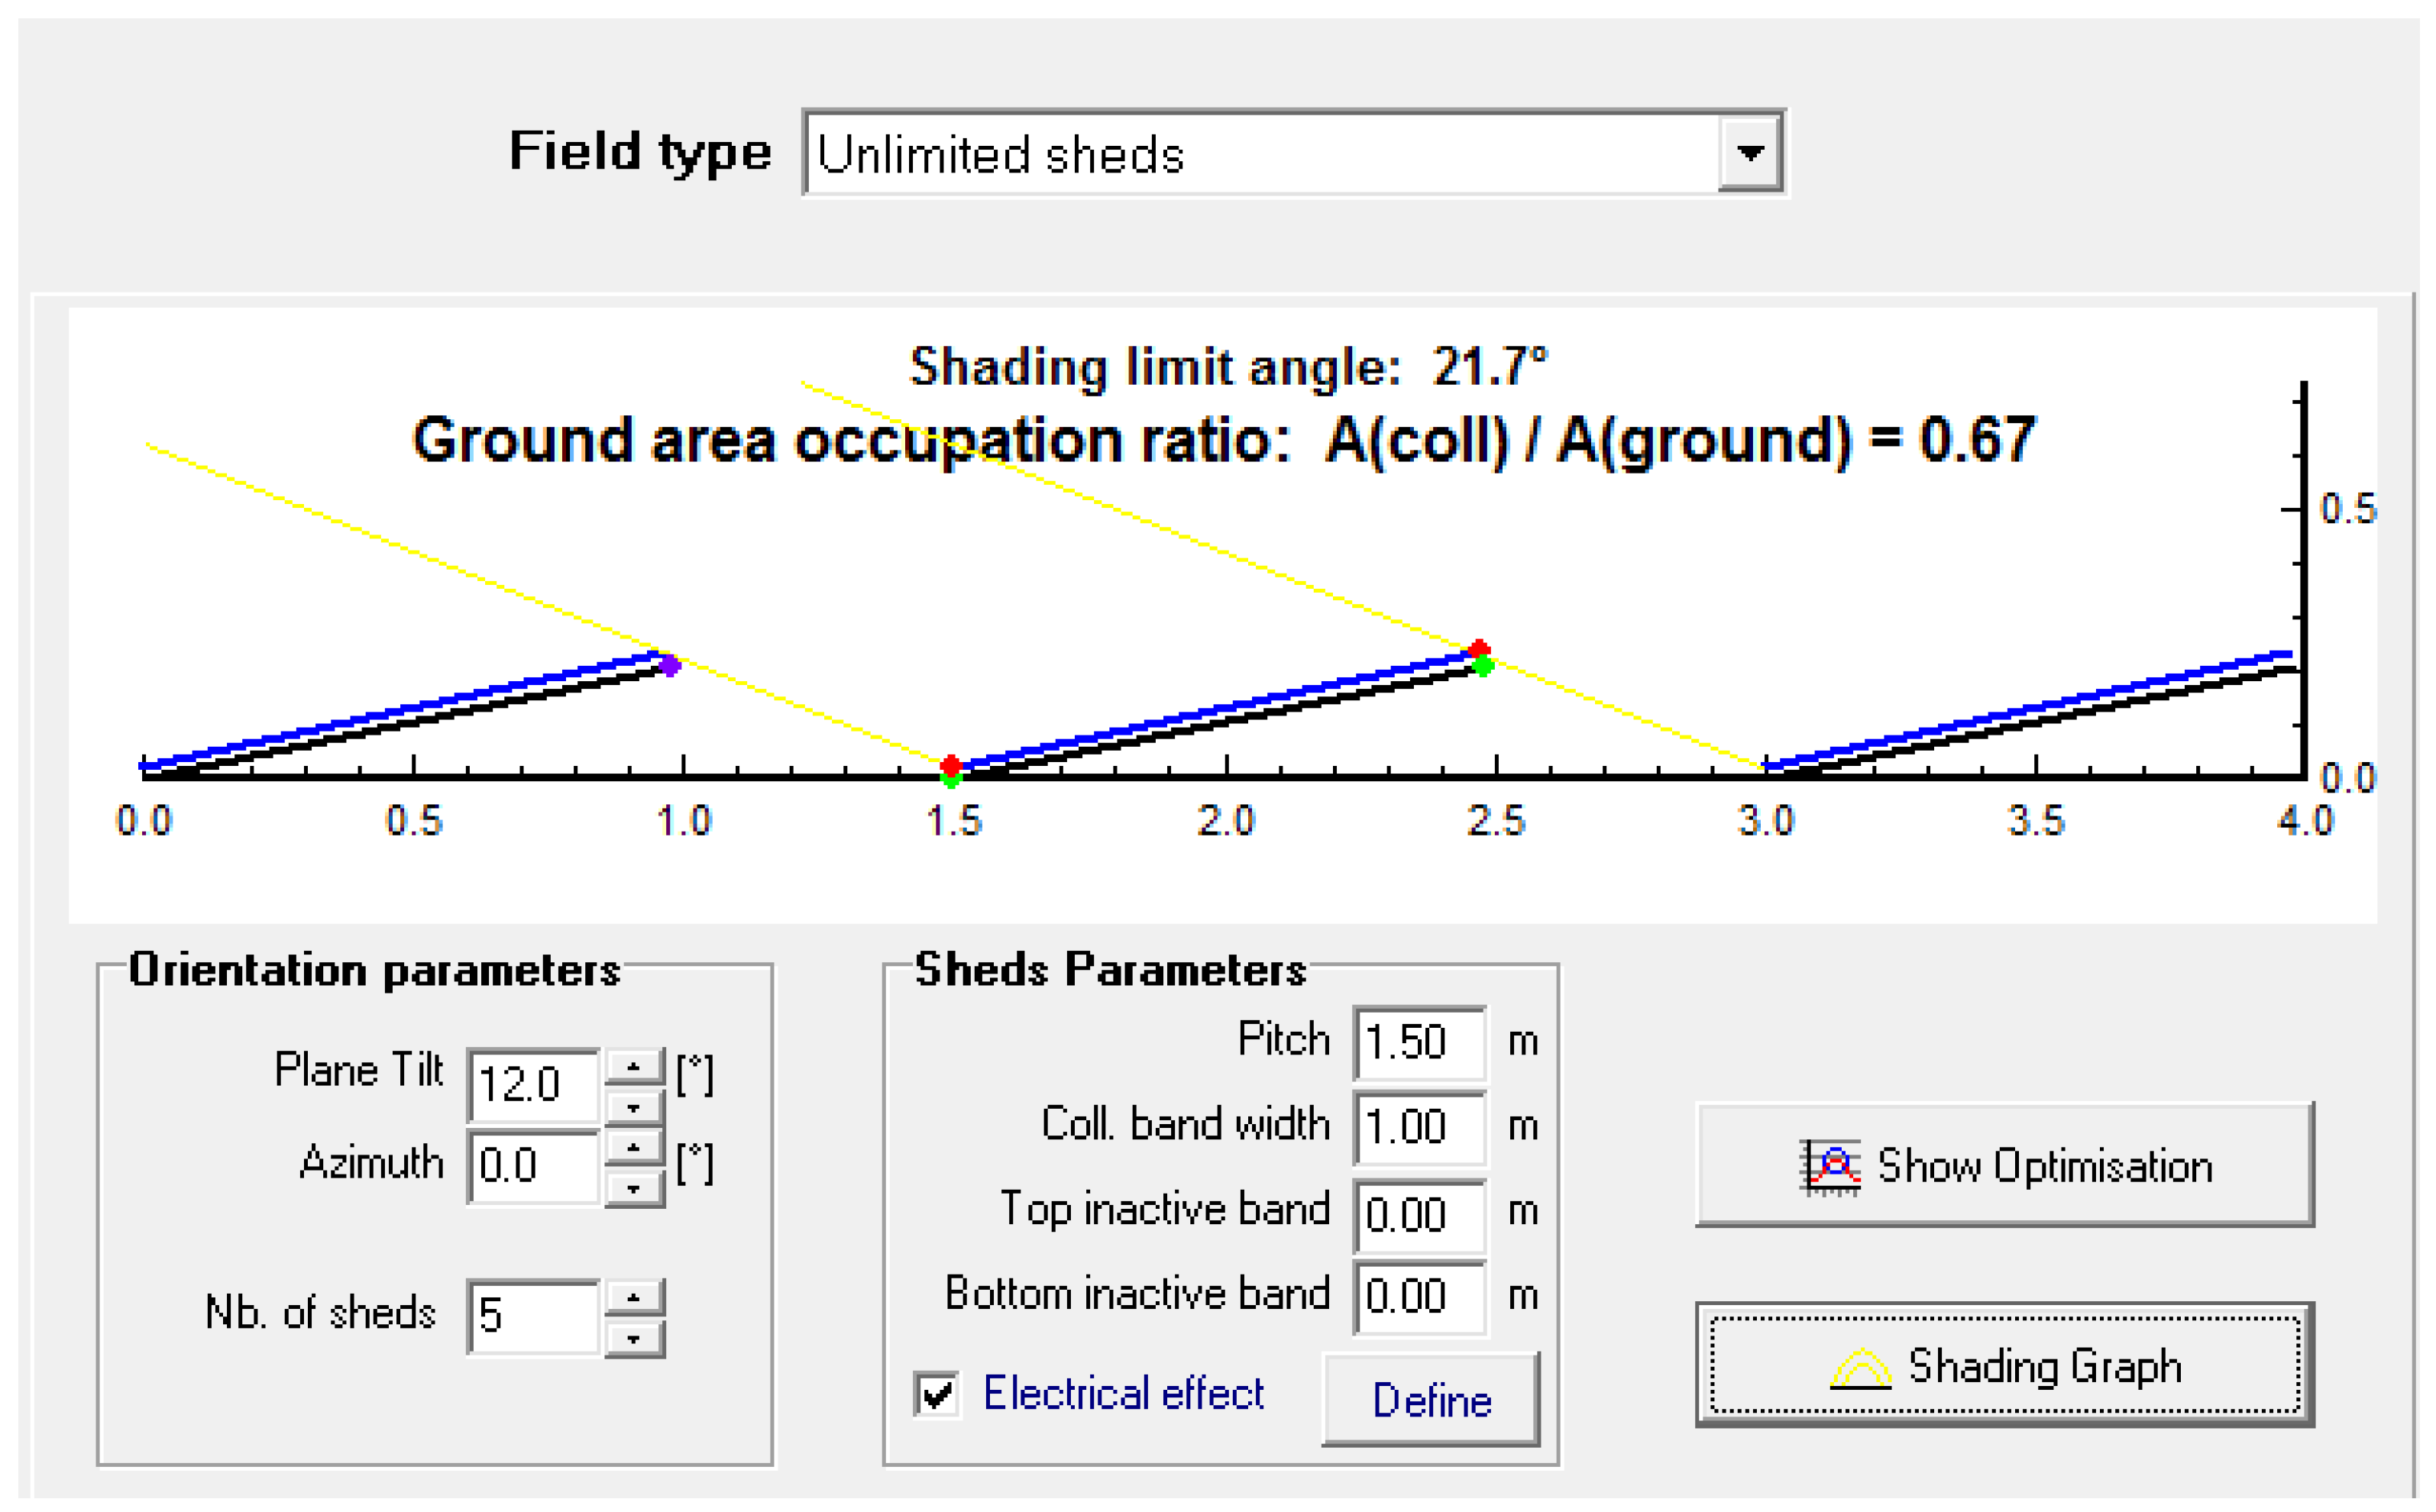
3.1.2. Install the Modules
- Width of 1 row of rack: 1 m (equals to the width of 1 module);
- Pitch distance (between 2 lower edges of 2 adjacent module rows): 1.5 m;
- Tilt angle: 12°;
- Shading limit angle: 21.7°;
- Ground Coverage Ratio—GCR: 67%.
3.2. DC Electrical Part Design
3.2.1. Minimum Number of Modules in Series
3.2.2. Maximum Number of Modules in Series
3.2.3. Maximum Number of Parallel PV Strings into an Inverter
3.2.4. Calculation of PV Array/Inverter Capacity
- Rated PV arrays capacity (STC): 47.5 MWp;
- Maximum PV arrays capacity (50 °C): 46,476 MW;
- Rated inverters capacity (AC): 42.5 MWac;
- PV/inverter ratio: 1.12;
- Overload loss ratio (total output): 0.0%.
- Inverter 1–6: each inverter includes 272 PV strings and 17 combiner boxes with 16 input conduits;
- Inverter 7–17: each inverter includes 288 PV strings and 18 combiner boxes with 16 input conduits;
3.3. AC Electrical Part Design
- Inverter station A:
- Including 7 inverters connected to 7 transformers 0.6/22 kV;
- The 22 kV distribution system has an electrical connection diagram of two busbars with segments, including seven routes to the 0.6/22 kV transformer, two routes to the 110 kV substation, and two segmentation compartments;
- Inverter station A:
- Including 10 inverters connected to 10 transformers 0.6/22 kV;
- The 22 kV distribution system has an electrical connection diagram of 2 busbars with segments, including 10 routes to 0.6/22 kV transformer, two routes to 110 kV substations, and two segmentation compartments.
4. The Layout of PV Modules—Inverter—Floatation System—Floating Bridge System
4.1. Site Conditions
- The maximum wind speed with a frequency of 2%: 11.3 m/s at an altitude of 3 m above the water surface;
- The reservoir is well-ventilated, without large trees or cliffs covering it;
- Reservoir surface area: 609.6 ha at normal water level rise;
- Farming activities on the reservoir: Yes;
- Type of water: River water, clean, unpolluted;
- Reservoir water depth: Average (59 m), Min (58 m), Max (62.5 m);
- Elevation of reservoir water level: Average (324 m), Min (323 m), Max (327.4 m), the water level fluctuation is small (max: 4.5 m); this is the main advantage that Da Mi hydropower reservoir was selected to research and propose to invest in the construction of an FPV plant.
4.2. The Layout of a PV Array and a Combiner Box
4.3. The Layout of All PV Arrays and Inverter
- The rocky snout protruding into the reservoir is located at the coordinates of 11.47° north latitude and 107.846° east longitude. This position has the lowest elevation of about 326 m, and the terrain is relatively favorable for leveling the ground; it is guaranteed to be above the max elevation of reservoir water level (327.4 m). This location was chosen to place inverter station A;
- The floating island in the middle of the reservoir is located at coordinates 11.253° North latitude, 107.846° East longitude. This floating island location is about 700 m from the inverter station A, with a peak elevation of 335 m. This location was chosen to place inverter station B; it is guaranteed to be higher than the max elevation of the reservoir water level.
- Area A: connected to inverter station A, with a total area of about 18.2 hectares for floating installation and an installed capacity of about 19 MWp. Inverter station A has an area of 13 × 30 m and will install seven inverters 2500 kVA and seven step-up transformers 2.5 MVA;
- Area B: connected to inverter station B, with a total area of about 27.3 hectares for floating installation and an installed capacity of about 28.5 MWp. Inverter station B has an area of 15 × 30 m and will install 10 inverters with 2500 kVA and 10 step-up transformers with 2.5 MVA.
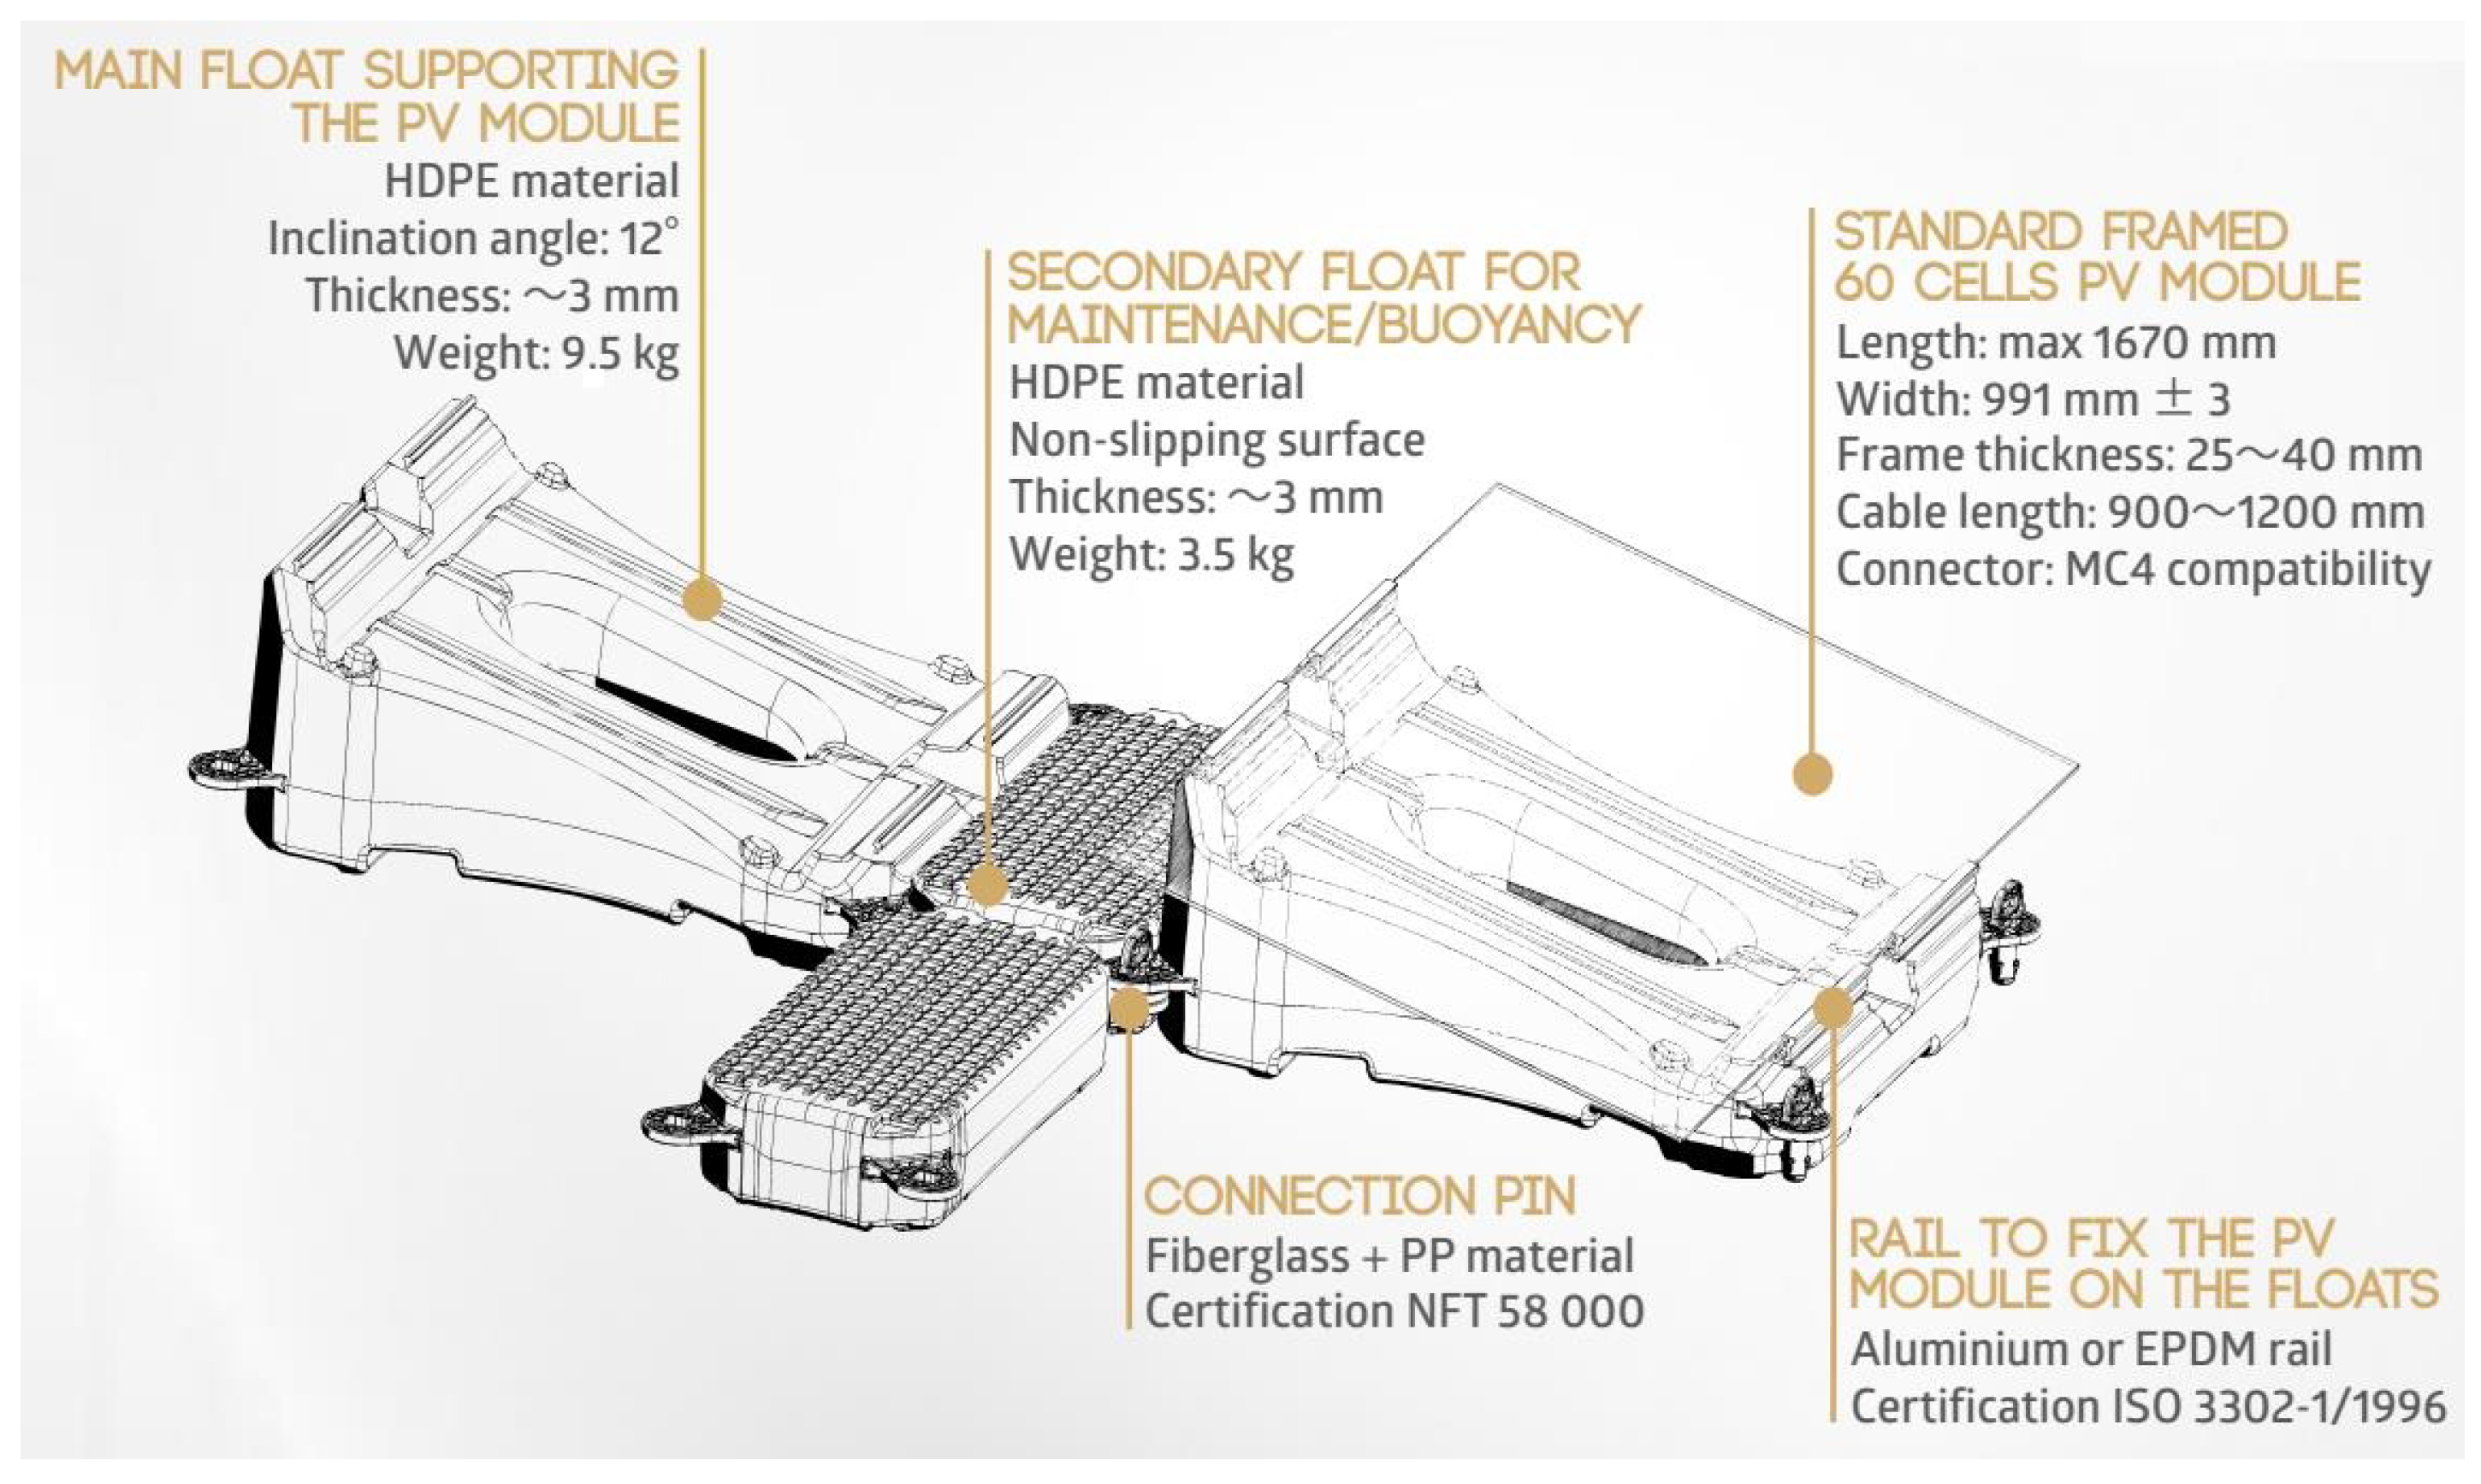
4.4. The Layout of the Floatation System (Pontoon) and Structural System
4.5. The Layout of the Floating Bridge System
5. Results
5.1. Simulation Results
- Plant geographical location;
- Typical meteorological data (from SolarGIS source);
- Environment conditions: albedo, lowest ambient temperature, and highest operation temperature;
- Module installation configuration: tilt angle, azimuth, distance;
- System design: selection of panels, inverter for calculating the number of devices, capacity, and wiring;
- Declare loss values: temperature loss, AC and DC conductor loss, dirt, irradiation, PV quality, system difference, self-use, and attenuation factor;
- Declare shading based on a topographic map.
5.2. Operation Results
- The real electricity production of the plant in the first year (from 1 June 2019 to 31 May 2020) reached 74.18 million kWh with a real PR of 83.40%, which is 4.19 million kWh higher than the design electricity production of 69.99 million kWh with design PR of 81.43%, equivalent to 105.95%;
- The real electricity production of the plant in the second year (from 1 June 2020 to 31 May 2021) reached 71,293 million kWh, about 1794 million kWh higher than the design, equivalent to 102.58%. However, the Da Mi FPV power plant had to cut out 2.94 million kWh of real electricity production due to an excess of the national power grid from November 2020 to 31 May 2021.
6. Conclusions
Author Contributions
Funding
Data Availability Statement
Conflicts of Interest
References
- Sweeney, J.C. Climate Change. Int. Encycl. Hum. Geogr. 2009, 147–155. [Google Scholar] [CrossRef]
- Bemana Ngueouele, Y. Modélisation des Injections de Puissance d’un Système PV sur un Réseau Public; Institut International d’Ingénierie de l’Eau et de l’Environnement: Ouagadougou, Burkina Faso, 2012. [Google Scholar]
- Ali, S.; Taweekun, J.; Techato, K.; Waewsak, J.; Gyawali, S. GIS based site suitability assessment for wind and solar farms in Songkhla, Thailand. Renew. Energy 2019, 132, 1360–1372. [Google Scholar] [CrossRef]
- Pawar, S.; History, M. Harmonic analysis of high penetration PV system on distribution network. Int. J. Appl. Eng. Res. 2019, 6, 401–408. [Google Scholar]
- Setiawan, F.; Dewi, T.; Yusi, S. Sea Salt Deposition Effect on output and Efficiency Losses of the Photovoltaic System. A case study in Palembang, Indonesia. J. Phys. Conf. Ser. 2019, 1167, 012028. [Google Scholar] [CrossRef]
- Acharya, M.; Devraj, S. Floating Solar Photovoltaic (FSPV): A Third Pillar to Solar PV Sector? In TERI Discussion Paper ETC India Project; The Energy and Resources Institute: New Delhi, India, 2019; p. 68. [Google Scholar]
- Campana, P.E.; Wästhage, L.; Nookuea, W.; Tan, Y.; Yan, J. Optimization and assessment of floating and floating-tracking PV systems integrated in on- and off-grid hybrid energy systems. Sol. Energy 2019, 177, 782–795. [Google Scholar] [CrossRef]
- Malvoni, M.; Leggieri, A.; Maggiotto, G.; Congedo, P.M.; De Giorgi, M.G. Long term performance, losses and efficiency analysis of a 960 kWP photovoltaic system in the Mediterranean climate. Energy Convers. Manag. 2017, 145, 169–181. [Google Scholar] [CrossRef]
- Aoun, N.; Bouchouicha, K. Estimating daily global solar radiation by day of the year in Algeria. Eur. Phys. J. Plus. 2017, 132, 1–12. [Google Scholar] [CrossRef]
- Aoun, N.; Bouchouicha, K.; Bailek, N. Seasonal performance comparison of four electrical models of mono crystalline PV module operating in a harsh environment. IEEE J. Photovolt. 2019, 9, 1057–1063. [Google Scholar] [CrossRef]
- Do Sacramento, E.M.; Carvalho, P.C.M.; De Araújo, J.C.; Riffel, D.B.; Da Cruz Corrêa, R.M.; Neto, J.S.P. Scenarios for use of floating photovoltaic plants in Brazilian reservoirs. IET Renew. Power Gener. 2015, 9, 1019–1024. [Google Scholar] [CrossRef]
- Tahri, F.; Tahri, A.; Oozeki, T. Performance evaluation of grid connected photovoltaic systems based on two photovoltaic module technologies under tropical climate conditions. Energy Convers. Manag. 2018, 165, 244–252. [Google Scholar] [CrossRef]
- Malvoni, M.; Kumar, N.M.; Chopra, S.S.; Hatziargyriou, N. Performance and degradation assessment of large-scale gridconnected solar photovoltaic power plant in tropical semi-arid environment of India. Sol. Energy 2020, 203, 101–113. [Google Scholar] [CrossRef]
- Lare, Y.; Sagna, K.; Razak Ali-Tagba, A. Optimal Design and Performance Analysis of a Grid Connected Photovoltaic System in Togo. Am. J. Energy Res. 2021, 9, 56–74. [Google Scholar] [CrossRef]
- IEC 61724; Photovoltaic System Performance Monitoring—Guidelines for Measurement, Data Exchange and Analysis. 1st ed. International Electrotechnical Commission: London, UK, 1998.
- Kumary, S.V.S.; Oo, V.A.A.M.T.; Shafiullah, G.M.; Stojcevski, A. Modelling and Power Quality Analysis of a Grid-Connected Solar PV System. In Proceedings of the Australasian Universities Power Engineering Conference (AUPEC), Perth, Australia, 28 September–1 October 2014. [Google Scholar]
- Piana, V.; Kahl, A.; Saviozzi, C.; Schumann, R. Floating PV in mountain artificial lakes: A checklist for site assessment. Renew. Energy Environ. Sustain. 2021, 6, 4. [Google Scholar] [CrossRef]
- Nagananthini, R.; Nagavinothini, R. Investigation on floating photovoltaic covering system in rural Indian reservoir to minimize evaporation loss. Int. J. Sustain. Energy 2021, 40, 781–805. [Google Scholar] [CrossRef]
- Sahu, A.; Yadav, N.; Sudhakar, K. Floating photovoltaic power plant: A review. Renew. Sustain. Energy Rev. 2016, 66, 815–824. [Google Scholar] [CrossRef]
- Trapani, K.; Millar, D.L. Proposing Offshore Photovoltaic (PV) Technology to the Energy mix of the Maltese Islands. Energy Convers. Manag. 2013, 67, 18–26. [Google Scholar] [CrossRef]
- Liu, H.; Krishna, V.; Lun Leung, J.; Reindl, T.; Zhao, L. Field experience and performance analysis of floating PV technologies in the tropics. Prog. Photovolt. Res. Appl. 2018, 26, 957–967. [Google Scholar] [CrossRef]
- Nguyen, N.-H.; Le, B.-C.; Bui, T.-T. Benefit Analysis of Grid-Connected Floating Photovoltaic System on the Hydropower Reservoir. Appl. Sci. 2023, 13, 2948. [Google Scholar] [CrossRef]
- Perez, M.; Perez, R.; Ferguson, C.R.; Schlemmer, J. Deploying effectively dispatchable PV on reservoirs: Comparing floating PV to other renewable technologies. Sol. Energy 2018, 174, 837–847. [Google Scholar] [CrossRef]
- Cazzaniga, R.; Rosa-Clot, M.; Rosa-Clot, P.; Tina, G.M. Integration of PV floating with hydroelectric power plants. Heliyon 2019, 5, e01918. [Google Scholar] [CrossRef] [Green Version]
- Pimentel Da Silva, G.D.; Branco, D.A.C. Is floating photovoltaic better than conventional photovoltaic? Assessing environmental impacts. Impact Assess. Proj. Apprais. 2018, 36, 390–400. [Google Scholar] [CrossRef]
- Junianto, B.; Dewi, T.; Sitompul, C.R. Development and Feasibility Analysis of Floating Solar Panel Application in Palembang, South Sumatra Development and Feasibility Analysis of Floating Solar Panel Application in Palembang, South Sumatra. J. Phys. Conf. Ser. 2020, 1500, 012016. [Google Scholar] [CrossRef]
- Ferrer-Gisbert, C.; Ferrán-Gozálvez, J.J.; Redón-Santafé, M.; Ferrer-Gisbert, P.; Sánchez-Romero, F.J.; Torregrosa-Soler, J.B. A new photovoltaic floating cover system for water reservoirs. Renew. Energy 2013, 60, 63–70. [Google Scholar] [CrossRef] [Green Version]
- Spencer, R.S.; Macknick, J.; Aznar, A.; Warren, A.; Reese, M.O. Floating Photovoltaic Systems: Assessing the Technical Potential of Photovoltaic Systems on Man-Made Water Bodies in the Continental United States. Environ. Sci. Technol. 2019, 53, 1680–1689. [Google Scholar] [CrossRef]
- Yadav, N.; Gupta, M.; Sudhakar, K. Energy assessment of floating photovoltaic system. In Proceedings of the 2016 International Conference on Electrical Power and Energy Systems (ICEPES), Bhopal, India, 14–16 December 2016; pp. 264–269. [Google Scholar]
- Sasmanto, A.A.; Dewi, T. Eligibility Study on Floating Solar Panel Installation over Brackish Water in Sungsang, South Sumatra. EMIT Int. J. Eng. Technol. 2020, 8, 240–255. [Google Scholar] [CrossRef]
- Dörenkämper, M.; Wahed, A.; Kumar, A.; de Jong, M.; Kroon, J.; Reindl, T. The cooling effect of floating PV in two different climate zones: A comparison of field test data from The Netherlands and Singapore. Sol. Energy 2021, 214, 239–247. [Google Scholar] [CrossRef]
- Azmi, M.S.M.; Othman, M.Y.H.; Ruslan, M.H.H.; Sopian, K.; Majid, Z.A.A. Study on electrical power output of floating photovoltaic and conventional photovoltaic. AIP Conf. Proc. 2013, 1571, 95–101. [Google Scholar]
- Lake, J.; Paš, S.; Akšamovíc, A.; Avdakovíc, S. Floating Solar Plants on Artificial Accumulations—Example of Jablanica Lake. In Proceedings of the 2018 IEEE International Energy Conference (ENERGYCON), Limassol, Cyprus, 3–7 June 2018. [Google Scholar]
- Ravichandran, N.; Ravichandran, N.; Panneerselvam, B. Performance analysis of a floating photovoltaic covering system in an Indian reservoir. Clean Energy 2021, 5, 208–228. [Google Scholar] [CrossRef]
- Silvério, N.M.; Barros, R.M.; Tiago Filho, G.L.; Redón-Santafé, M.; Santos, I.F.S.d.; Valério, V.E.d.M. Use of floating PV plants for coordinated operation with hydropower plants: Case study of the hydroelectric plants of the São Francisco River basin. Energy Convers. Manag. 2018, 171, 339–349. [Google Scholar] [CrossRef]
- Rosa-Clot, M.; Tina, G.M.; Nizetic, S. Floating photovoltaic plants and wastewater basins: An Australian project. Energy Procedia 2017, 134, 664–674. [Google Scholar] [CrossRef]
- Farfan, J.; Breyer, C. Combining Floating Solar Photovoltaic Power Plants and Hydropower Reservoirs: Virtual Battery of Power Great Global Potential Combining Floating Solar Photovoltaic Plants and the 15th International Symposium on District Heatin. Energy Procedia 2018, 155, 403–411. [Google Scholar] [CrossRef]
- Tina, G.; Cazzaniga, R.; Rosa-Clot, M.; Rosa-Clot, P. Geographic and technical floating photovoltaic potential. Therm. Sci. 2018, 22, 831–841. [Google Scholar] [CrossRef] [Green Version]
- Muhammad, A.; Muhammad, U.; Abid, Z. Potential of floating photovoltaic technology in Pakistan. Sustain. Energy Technol. Assess. 2021, 43, 100976. [Google Scholar] [CrossRef]
- Kougias, I.; Bódis, K.; Jäger-Waldau, A.; Monforti-Ferrario, F.; Szabõ, S. Exploiting existing dams for solar PV system installations. Prog. Photovolt. Res. Appl. 2016, 24, 229–239. [Google Scholar] [CrossRef] [Green Version]
- Cox, M. The State of Floating Solar: Bigger Projects, Climbing Capacity, GreenTech Media, New Markets; Wood Mackenzie: London, UK, 2019. [Google Scholar]
- Solar, W.; Generation, P. Volts from the Blue—Is Combined Floating Solar and Hydro the Energy Solution for ASEAN? Land-Scarce ASEAN Countries Are Perfectly Positioned to Benefit from Cost-Competitive Waterborne Solar Power Generation; IEEFA: Lakewood, OH, USA, 2020; pp. 1–24. [Google Scholar]
- Stiubiener, U.; Carneiro da Silva, T.; Trigoso, F.B.M.; Benedito, R.d.S.; Teixeira, J.C. PV power generation on hydro dam’s reservoirs in Brazil: A way to improve operational flexibility. Renew. Energy 2020, 150, 765–776. [Google Scholar] [CrossRef]
- Choi, Y.-K.; Lee, N.-H.; Lee, A.-K.; Kim, K.-J. A study on major design elements of tracking-type floating photovoltaic systems. Int. J. Smart Grid Clean Energy 2014, 3, 70–74. [Google Scholar] [CrossRef] [Green Version]
- Kim, S.-H.; Lee, Y.-G.; Seo, S.-H.; Joo, H.-J.; Yoon, S.-J. Structural Design and Installation of Tracking-type Floating PV Generation System. Compos. Res. 2014, 27, 59–65. [Google Scholar] [CrossRef] [Green Version]
- Lee, A.-K.; Shin, G.-W.; Hong, S.-T.; Choi, Y.-K. A study on development of ICT convergence technology for tracking-type floating photovoltaic systems. Int. J. Smart Grid Clean Energy 2013, 3, 80–87. [Google Scholar] [CrossRef]
- Bhardwaj, B.; Bhardwaj, N. Hydrokinetic-Solar Hybrid Floating Renewable Energy Generation System to Explore Hydro and Solar Power Potential Worldwide. In Proceedings of the 2nd International Conference on Large-Scale Grid Integration of Renewable Energy in India, New Delhi, India, 4–6 September 2019; pp. 4–8. [Google Scholar]
- World Bank Group; ESMAP; SERIS. Where Sun Meets Water (Vol.1): Floating Solar Handbook for Practitioners; World Bank Group; Energy Sector Management Assistance Program (ESMAP); Solar Energy Research Institute of Singapore (SERIS): Washington, DC, USA, 2019. [Google Scholar]
- Kumar, M.; Kumar, A. Experimental validation of performance and degradation study of canal-top photovoltaic system. Appl. Energy 2019, 243, 102–118. [Google Scholar] [CrossRef]
- Abdelal, Q.; Floating, P.V. An assessment of water quality and evaporation reduction in semi-arid regions. Int. J. Low-Carbon Technol. 2021, 16, 732–739. [Google Scholar] [CrossRef]
- Taye, B.Z.; Nebey, A.H.; Workineh, T.G. Design of floating solar PV system for typical household on Debre Mariam Island. Cogent Eng. 2020, 7, 1829275. [Google Scholar] [CrossRef]
- Durkovíc, V.; Durišíc, Ž. Analysis of the potential for use of floating PV power plant on the skadar lake for electricity supply of aluminium plant in Montenegro. Energies 2017, 10, 1505. [Google Scholar] [CrossRef] [Green Version]
- Sukarso, A.P.; Kim, K.N. Cooling effect on the floating solar PV: Performance and economic analysis on the case of west Java province in Indonesia. Energies 2020, 13, 2126. [Google Scholar] [CrossRef]
- Pringle, A.M.; Handler, R.M.; Pearce, J.M. Aquavoltaics: Synergies for dual use of water area for solar photovoltaic electricity generation and aquaculture. Renew. Sustain. Energy Rev. 2017, 80, 572–584. [Google Scholar] [CrossRef] [Green Version]
- Cazzaniga, R.; Cicu, M.; Rosa-Clot, M.; Rosa-Clot, P.; Tina, G.M.; Ventura, C. Floating photovoltaic plants: Performance analysis and design solutions. Renew. Sustain. Energy Rev. 2018, 81, 1730–1741. [Google Scholar] [CrossRef]
- Haas, J.; Khalighi, J.; Fuente, A.D.; Gerbersdorf, S.U.; Nowak, W.; Chen, P. Floating photovoltaic plants: Ecological impacts versus hydropower operation flexibility. Energy Convers. Manag. 2020, 206, 112414. [Google Scholar] [CrossRef]
- Vreeburg, J. Potential impact of fl oating solar panels on water quality in reservoirs; pathogens and leaching. Water Pract. Technol. 2020, 15, 807–811. [Google Scholar]
- Chico Hermanu, B.A.; Santoso, B.; Suyitno, W.; Rian, F.X. Design of 1 MWp floating solar photovoltaic (FSPV) power plant in Indonesia. AIP Conf. Proc. 2019, 2097, 030013. [Google Scholar]
- Redón Santafé, M.; Torregrosa Soler, J.B.; Sánchez Romero, F.J.; Ferrer Gisbert, P.S.; Ferrán Gozálvez, J.J.; Ferrer Gisbert, C.M. Theoretical and experimental analysis of a floating photovoltaic cover for water irrigation reservoirs. Energy 2014, 67, 246–255. [Google Scholar] [CrossRef]
- Sharma, G.S.; Mahela, O.P.; Hussien, M.G.; Khan, B.; Padmanaban, S.; Shafik, M.B.; Elbarbary, Z.M.S. Performance Evaluation of a MW-Size Grid-Connected Solar Photovoltaic Plant Considering the Impact of Tilt Angle. Sustainability 2022, 14, 1444. [Google Scholar] [CrossRef]
- Zubair, M.; Bilal Awan, A.; Ghuffar, S.; Butt, A.D.; Farhan, M. Analysis and Selection Criteria of Lakes and Dams of Pakistan for Floating Photovoltaic Capabilities. J. Sol. Energy Eng. 2020, 142, 1–11. [Google Scholar] [CrossRef]
- Razykov, T.M.; Ferekides, C.S.; Morel, D.; Stefanakos, E.; Ullal, H.S.; Upadhyaya, H.M. Solar photovoltaic electricity: Current status and future prospects. Sol. Energy 2011, 85, 1580–1608. [Google Scholar] [CrossRef]
- Green, M.A.; Emery, K.; Hishikawa, Y.; Warta, W.; Dunlop, E.D. Solar cell efficiency tables (version 39). Prog. Photovolt. Res. Appl. 2012, 20, 12–20. [Google Scholar] [CrossRef]
- Masters, G. The solar resource. In Renewable and Efficient Electric Power Systems, 1st ed.; John Wiley & Sons: Hoboken, NJ, USA, 2004. [Google Scholar]
- Skoplaki, E.; Palyvos, J.A. On the temperature dependence of photovoltaic module electrical performance: A review of efficiency/power correlations. Sol. Energy 2009, 83, 614–624. [Google Scholar] [CrossRef]
- Kalogirou, S.A.A.; Tripanagnostopoulos, Y. Hybrid PV/T solar systems for domestic hot water and electricity production. Energy Convers. Manag. 2006, 47, 3368–3382. [Google Scholar] [CrossRef]
- Zsiborács, H.; Pályi, B.; Pintér, G.; Popp, J.; Balogh, P.; Gabnai, Z.; Pető, K.; Farkas, I.; Baranyai, N.H.; Bai, A. Technical-economic study of cooled crystalline solar modules. Sol. Energy 2016, 140, 227–235. [Google Scholar] [CrossRef] [Green Version]
- Jordan, D.C.; Kurtz, S.R. Photovoltaic Degradation Rates—An Analytical Review. Prog. Photovoltaic. Res. Appl. 2013, 21, 12–29. [Google Scholar] [CrossRef] [Green Version]
- Sharma, R.; Gidwani, L. Grid connected solar PV system design and calculation by using PV*SOL premium simulation tool for campus hostels of RTU Kota. In Proceedings of the 2017 International Conference on Circuit, Power and Computing Technologies (ICCPCT), Kollam, India, 20–21 April 2017; pp. 1–4. [Google Scholar] [CrossRef]
- Ahmed, O.A.; Habeeb, W.H.; Mahmood, D.Y.; Jalal, K.A.; Sayed, H.K. Design and Performance Analysis of 250 kW Grid-Connected Photovoltaic System in Iraqi Environment Using PVsyst Software. Indones. J. Electr. Eng. Inform. 2019, 7, 415–421. [Google Scholar]
- Chandel, S.S.; Sharma, V. Performance analysis of a 190 kWp grid interactive solar photovoltaic power plant in India. Energy 2013, 55, 476–485. [Google Scholar]
- Kandasamy, C.P.; Prabu, P.; Niruba, K. Solar potential assessment using PVSYST software. In Proceedings of the 2013 International Conference on Green Computing, Communication and Conservation of Energy (ICGCE), Chennai, India, 12–14 December 2013; pp. 667–672. [Google Scholar]
- Labed, S.; Lorenzo, E. The impact of solar radiation variability and data Discrepancies on the design of PV systems. Renew. Energy 2004, 29, 1007–1022. [Google Scholar] [CrossRef]
- Trapani, K.; Millar, D.L. The thin flm flexible floating PV (T3F-PV) array: The concept and development of the prototype. Renew Energy 2014, 71, 43–50. [Google Scholar] [CrossRef]
- Antonio Luque, S.H. Handbook of Photovoltaic Science and Engineering; John Wiley & Sons: Hoboken, NJ, USA, 2003. [Google Scholar]
- Zsiborács, H.; Baranyai, N.H.; Vincze, A.; Pintér, G. An Economic Analysis of the Shading Effects of Transmission Lines on Photovoltaic Power Plant Investment Decisions: A Case Study. Sensors 2021, 21, 4973. [Google Scholar] [CrossRef] [PubMed]
- The German Energy Society. Planning and Installing Photovoltaic System—A Guide for Installers, Architets and Engineers, 2nd ed.; Routledge: London, UK, 2008. [Google Scholar]
- Teixeira, L.E.; Caux, J.; Beluco, A.; Bertoldo, I.; Louzada, J.A.S.; Eifler, R.C. Feasibility study of a hydro PV hybrid system operating at a dam for water supply in southern Brazil. J. Power Energy Eng. 2015, 3, 70. [Google Scholar] [CrossRef] [Green Version]
- Solomin, E.; Sirotkin, E.; Cuce, E.; Selvanathan, S.P.; Kumarasamy, S. Hybrid Floating Solar Plant Designs: A Review. Energies 2021, 14, 2751. [Google Scholar] [CrossRef]
- Karpouzoglou, T.; Vlaswinkel, B.; Van Der Molen, J. Effects of large-scale floating (solar photovoltaic) platforms on hydrodynamics and primary production in a coastal sea from a water column model. Ocean Sci. 2020, 16, 195–208. [Google Scholar] [CrossRef] [Green Version]
- Nazir, C.P. Coastal power plant: A hybrid solar-hydro renewable energy technology. Clean Energy 2018, 2, 102–111. [Google Scholar] [CrossRef]
- Mayville, P.; Vijay, N.; Pearce, J.M. Distributed manufacturing of after market flexible floating photovoltaic modules. Sustain. Energy Technol. Assess. 2020, 42, 100830. [Google Scholar] [CrossRef]
- Sahu, A.K.; Sudhakar, K. Effect of UV exposure on bimodal HDPE floats for floating solar application. J. Mater. Res. Technol. 2019, 8, 147–156. [Google Scholar] [CrossRef]


| Study Sites | Researchers & Methodology | Technical Data | Remarks on Technical Evaluation |
|---|---|---|---|
| The PV systems on the canals in Gujarat, India. | Manish Kumar and Arun Kumar [49] used a single-diode PV model was developed to characterize the PV modules. | The performance and degradation analysis of the world’s first commercial multi-crystalline silicon-based 10 MWp canal-top PV system. | The annual average performance ratio and degradation rate of 10 MWp canal-top PV systems are found to be 77.85% and 1.93 ± 0.28%/year, respectively. |
| Floating solar panels in Palembang, South Sumatra, Indonesia. | Benny Junianto et al. [26] compared two 100 Wp polycrystalline PV panels. | One system is installed on the river, and another one is installed on the ground. Data is taken for seven days. | The passive cooling of the FPV system can reduce surface temperature by 2 °C and increase the output power (51.6 W) compared to a GPV system (42.9 W). |
| Floating solar panels in agricultural irrigation ponds in semi-arid regions. | Qasem Abdelal [50] compared the theoretical evaluation of evaporation to observed evaporation values. | The combined method is the Penman equation relating evaporation to net radiation absorbed by the water body, wind speed, vapor pressure values, and a number of other factors. | The power produced by the floating system was higher than that produced by land mounted 55% of the time. The water quality results are in favor of using the FPVs. Evaporation reduction of 60% over the whole duration. |
| Tana is the largest lake in Ethiopia, Debre Mariam Island. | Biniyam Zemene Taye et al. [51] designed a floating System. | The data were collected from NASA. | The generated power output is 294.8 kW of the FPV system, whereas 289.9 kW is generated by GPV (increases 4.9 kW). |
| A PV panel over brackish water in Sunsang Estuary, South Sumatra. | Andri Agus Sasmanto et al. [30] proposed an experiment that compares the output of FPV to GPV panels. | The PV panel utilized in this study is polycrystalline with 100 Wp each. One is floated in the estuary, and another one is ground mounted. | The electricity generated by FPV systems are 11.89 W higher on average compared to the ground mounting. On average, the efficiency of FPV panels is 4% higher than that of ground installation. |
| Two zones: a temperate maritime climate (the Netherlands) and a tropical climate (Singapore). | Maarten Dörenkämper et al. [31] has used PVsysts version 6.86. Data have been retrieved using the global climatological database Meteonorm version 7.2. | System (56 kWp) design parameters in PVsyst for the two modeled locations. | The best performing FPV systems showed 3.2 °C (Netherlands) and 14.5 °C (Singapore) lower temperatures compared to the ground or rooftop. The energy yield of FPV systems compared to PV systems, is up to 3% in the Netherlands and up to 6% in Singapore. |
| At the western corner of Tengeh Reservoir (1° N, 103° E), Singapore. | Haohui Liu et al. [21] moderate large-scale deployment to utility PV plants (500 recorded parameters). | The 1 MWp consists of a variety of different commercially available floating solutions and PV system configurations. | Lower than that onshore by about 1 °C to 3 °C, the FPV are 5 °C to 10 °C lower than rooftop. The albedo on water is only 5% to 7% vs. albedo on the rooftops 13%. The system PRs range from 80% to 90%, up to 10% higher than typical rooftop systems. |
| In the Balkans, the southeast part of Europe. | Vladan Durković et al. [52] used the NREL solar insolation database to ascertain. | An innovative azimuth angle control method and total installed power of 90 MWp, consisting of 18 plants installed power of 5 MWp each. | The concept of the control of an Azimuth angle FPPP provides a production 27.68% higher than the usual conceptual solutions of the FPPP. |
| The weather conditions found in the Brazilian semi-arid region. | Elissandro Monteiro et al. [11] used the electrical parameters of two polycrystalline PV modules and PVSYST. | The use of cooled FPV modules in a fraction of the area occupied by three reservoirs—Castanhão, Orós, and Banabuiú—in the Brazilian semi-arid region. | Efficiency gain varies from 9.52 to 14.5%. These values are close to 11% found in Korea [21] and higher than 8% found in Japan [20]. |
| Karasur Village, India. | Ankit Kumar Singh et al. [35] used the 3D software SketchUp Pro 2015 along the array omatic_v1.11 component. | 2 MW FPV plant can be implemented in different phases as it requires a decent capital cost, including the maintenance cost. | The high average annual energy yield of 2658 MWh is around 7.5% higher efficiency than the land-based system. It can save 6000 tons of CO2 during its life span of 25 years. |
| Around West Java Province, Korea. | Adimas Pradityo Sukarso and Kyung Nam Kim [53] utilized remote sensing results to predict FPV efficiency and measure energy yield. | Creating 1 MW of solar PV system is approximately 1.527 acres. An 8 °C consistent annual temperature difference between water and ground surface temperature. | FPV efficiency was also shown to be 0.61% higher than GPV in terms of prediction. FPV resulted in 3.37 cents/kWh lower leveled cost of electricity (LCOE) and 6.08% higher IRR compared to GPV. |
| The first 20 largest hydroelectric power plants (HPPs) in the world. | Raniero Cazzaniga et al. [24] analyzed the advantages of coupling FPV plants with HPP. | The experience in China Longyangxa Basin and its connected PV plant are examined together with the suggestion to install an FPV whose rated power is equal to HPP-rated power. | The cost of an FPV is comparable to a GPV and is further reduced. The worldwide HPP basins surface covered by FPV would only be 2.4%, but the increase in energy production would be 35.9%, the Full Load Hours from 3539 to 4800 h. |
| Aquaculture is most sustainable when integrated with multiple species. | Adam M. Pringle et al. [54] analyzed the potential for floatovoltaic-aquaculture or aqua-voltaic systems. | A review of the theoretical and experimental work of FV and aquaculture, which provides the backbone of this aqua-voltaic concept. | FPV has been shown to reduce evaporation by up to 85%. The floating tracking cooling concentrating systems resulted in an annual efficiency increase of 30% and a cost comparative to ground arrays. |
| Two different experimental setups in Pisa (Italy) and in the Suvereto (Livorno, Italy). | R. Cazzaniga et al. [55] are based on simulation models and experimental findings in the last 8 years. | The 30 kW in the Pisa platform (with tracking, cooling, reflectors, as well as a GPV installation for comparison) and the 200 kWp in the Suvereto platform with a tracking system. | In floating plants in Pisa and Suvereto, two cooling and tracking effects have been measured, and experimental gaining up to 30% in energy. For dry climate regions, tracking systems together with flat reflector systems can lower the kWh cost. |
| FPV system covering 30% of the total area of Vaigai reservoir in India. | R. Nagananthini and R. Nagavinothini [18] developed the numerical model of the FPV. | A capacity of 1.14 MW generates 1.9 GWh of energy at its optimum tilt angle. | Saving 42,731.56 m3 of water annually and 44,734.62 tons of CO2. Reducing the CO2 emission annually, 13.09% higher than the non-tracking system. The energy yield by 13.39% and 8.99% under portrait and landscape orientations, respectively. |
| In Tamil Nadu, India. | Nagananthini Ravichandran et al. [34] numerically analyzed various tilt angles, mounting systems, and tracking mechanisms. | The demonstrative FPV plant in this study is also analyzed from various angles in order to assess its potential power generation. | The potential CO2 saving by an FPV system with tracking is 135,918.87 tCO2, 12.5% higher than that of a fixed-mount FPV system. |
| Jablanica reservoir with 13 km2 HPP Jablanica with 180 MW. | Sedin Pašalić et al. [33] analyze the possibility of building an FPV plant. | A modular installation with a 3 MW basic module was proposed. It was considered to have an adapter to the network via the 20 kV/220 kV transformer. | On a surface of 380,250 m2, there could be installed a PV plant with a power of 30 MW. This area amounts to less than 3% of the surface of the reservoir. |
| Global energy systems. | Javier Farfan and Christian Breyer [37] used the database to compile all known water reservoirs for which the water level can be controlled. | For the 2134 reservoirs marked with hydropower, only 1768 list a number for the reported area. The rest of the unspecified area was estimated according to a global average volume-to-surface ratio; area is a vital factor for FPV potential calculation. | FPV can provide significantly more electricity (6270 TWh in total) than HPP from reservoirs (2510 TWh in total) at a coverage rate of 25%. The estimated 6.3% additional water available through evaporation prevention can increase hydropower generation (about 142.5 TWh, assuming 90% hydropower efficiency). |
| HPP plants of the São Francisco River Basin. | Naidion Motta Silvério et al. [35] used PVSyst software. | A 1 MWp plant to obtain normalized energy. | FPV plants suggest a significant increase in output, varying from 51.2% to 105.6%, for the hybrid power plants. |
| Rapel Reservoir, an HPP plant in central Chile. | J. Haas et al. [56] simulated two models: the hydrodynamics of a water body and an optimization tool for hydropower scheduling. | The framework is applied to the Rapel Reservoir, which was constructed in 1968 for power generation (380 MW, about 75 m of head). It is a dendritic and temperate reservoir with a storage capacity of 400 Mm3, composed of three sub-basins. | Fractions below 40% have little or no effect on both microalgal growth and hydropower revenue. Covers (40–60%), algal blooms are avoided because of the reduction of light in the reservoir. A large cover can eradicate algal blooms entirely and result in severe economic hydropower losses. |
| In southwest Netherlands. | D. Mathijssen et al. [57] based on the Analysis of Microbiological Safety of Drinking water. | The water storage reservoirs of Evides, with an area of approx. 8 km2 could potentially generate about 200 GWh of power on a yearly basis. | A water storage reservoir was concluded from a worst-case QMRA analysis that 10–30% of the reservoirs can be covered. |
| Three reservoirs in Indonesia. | Chico Hermanu B. A. et al. [58] did Modeling and simulating for FSPV design. | The 1 MWp FSPV design is arranged on four inverters, with each having a 250 kWp capacity spread over four blocks and 20 strings. | The potential of abundant water reservoirs in Indonesia is one of the keys to providing clean and environmentally friendly energy with a large capacity. |
| In South Africa. | Ioannis Kougias et al. [40] used the PVGIS tool to support the methodology. | The development of FPV systems on the downstream face of existing dams. | Ten dams have been selected, and the capacity is estimated at 42 MWp and expected to produce annual electricity of 72 GWh. |
| In Brazil | Uri Stiubiener et al. [43] analyzed the feasibility of changing the hydro-thermal model with the hydro-solar model. | The 30 largest HEPPs were identified. Only the six greatest reservoir surfaces, for each one, the authors assumed a working hypothesis that a PV-FPP would be installed on the reservoir surface. | Using 10% of the surface, the HEPP reservoirs can accommodate PV-FPP supplying demand during peak irradiation times and balancing grids with hydro-power during low/no irradiation times. |
| Parameter | TS | TMY P50 | TMY P90 |
|---|---|---|---|
| GHI (kWh/m2) | 1856 | 1777 | 1690 |
| DHI (kWh/m2) | 865 | 894 | 918 |
| GTI (kWh/m2)—tilted angle 12°, South-Facing | 1895 | - | - |
| Air temperature at 2 m (°C) | 24.5 | 24.6 | 24.4 |
| Month | SolarGIS | Meteonorm | NASA | ||
|---|---|---|---|---|---|
| TS | TMY P50 | TMY P90 | |||
| 1 | 153 | 146 | 141 | 154 | 170 |
| 2 | 168 | 159 | 158 | 155 | 168 |
| 3 | 186 | 178 | 172 | 174 | 193 |
| 4 | 180 | 172 | 168 | 150 | 180 |
| 5 | 174 | 162 | 161 | 157 | 164 |
| 6 | 148 | 144 | 136 | 150 | 144 |
| 7 | 144 | 138 | 133 | 156 | 144 |
| 8 | 151 | 147 | 135 | 153 | 133 |
| 9 | 133 | 136 | 118 | 129 | 135 |
| 10 | 143 | 140 | 121 | 136 | 144 |
| 11 | 137 | 129 | 123 | 126 | 145 |
| 12 | 139 | 125 | 124 | 137 | 153 |
| year | 1856 | 1777 | 1690 | 1777 | 1874 |
| Technologies | p-Si | m-Si | HIT | a-Si | CdTe | CIGS/CIS |
|---|---|---|---|---|---|---|
| Efficiency | 13–17% | 16–21% | 18–20% | 6–9% | 8–16% | 8–14% |
| Temperature coefficient | −0.45%/°C | −0.45%/°C | 0.29%/°C | −0.21%/°C | −0.25%/°C | −0.35%/°C |
| PV Module | Capacity (Wp) | Efficiency (%) | Number of Modules | Yield (MWh/Year) | Total Area of Modules (ha) |
|---|---|---|---|---|---|
| 60 cell—poly | 255 | 15.58 | 186,264 | 69,259 | 30.49 |
| 260 | 15.89 | 182,688 | 69,345 | 29.90 | |
| 265 | 16.19 | 179,256 | 69,288 | 29.34 | |
| 270 | 16.50 | 175,920 | 69,287 | 28.79 | |
| 275 | 16.80 | 172,728 | 69,391 | 28.27 | |
| 280 | 17.11 | 169,632 | 69,292 | 27.77 | |
| 300 | 15.46 | 158,340 | 69,428 | 30.72 | |
| 72 cell—poly | 305 | 15.72 | 155,740 | 69,609 | 30.22 |
| 310 | 15.98 | 153,220 | 69,552 | 29.73 | |
| 315 | 16.23 | 150,800 | 69,381 | 29.26 | |
| 320 | 16.49 | 148,440 | 69,340 | 28.80 | |
| 325 | 16.75 | 146,160 | 69,500 | 28.36 | |
| 330 | 17.01 | 143,940 | 69,519 | 27.93 | |
| 335 | 17.26 | 141,800 | 69,569 | 27.51 |
| Electrical Characteristics | Temperature Characteristics | ||
|---|---|---|---|
| Type | (m-Si) or (p-Si) | Nominal operating cell Temp. NOCT | 45 ± 2 °C |
| Rated power Pmpp | >330 Wp | Temp. coefficient of Pmax | −0.40%/°C |
| Rated voltage Umpp | 37.8 V | Temp. coefficient of VOC | −0.30%/°C |
| Rated current Impp | 8.74 A | Temp. coefficient of ISC | 0.06%/°C |
| Open circuit voltage UOC | 46.9 V | ||
| Short circuit current ISC | 9.14 A | ||
| Conversion efficiency | 17% | ||
| Operating temperature range | −40 ÷ 85 °C | ||
| Max. system voltage (IEC standard) | 1500 VDC | ||
| Max. rated string current fuse | 15 A | ||
| Power error | 0 ÷ 3% | ||
| Month | 0 h | 1 h | 2 h | 3 h | 4 h | 5 h | 6 h | 7 h | 8 h | 9 h | 10 h | 11 h |
|---|---|---|---|---|---|---|---|---|---|---|---|---|
| 1 | 0 | 0 | 0 | 0 | 0 | 0 | 1.52 | 12.39 | 22.93 | 31.12 | 36.51 | 39.19 |
| 2 | 0 | 0 | 0 | 0 | 0 | 0 | 2.88 | 12.96 | 23.73 | 32.20 | 38.01 | 40.68 |
| 3 | 0 | 0 | 0 | 0 | 0 | 0 | 3.29 | 14.11 | 24.56 | 32.76 | 38.07 | 40.51 |
| 4 | 0 | 0 | 0 | 0 | 0 | 0.30 | 5.30 | 15.26 | 24.66 | 32.32 | 36.97 | 39.35 |
| 5 | 0 | 0 | 0 | 0 | 0 | 0.61 | 5.63 | 15.02 | 24.08 | 30.74 | 35.39 | 36.76 |
| 6 | 0 | 0 | 0 | 0 | 0 | 0.44 | 4.70 | 13.59 | 22.60 | 29.86 | 34.32 | 36.35 |
| 7 | 0 | 0 | 0 | 0 | 0 | 0.47 | 4.08 | 13.25 | 22.35 | 29.51 | 34.24 | 36.44 |
| 8 | 0 | 0 | 0 | 0 | 0 | 0 | 4.37 | 14.41 | 24.63 | 32.41 | 36.12 | 37.71 |
| 9 | 0 | 0 | 0 | 0 | 0 | 0.23 | 5.58 | 15.90 | 24.60 | 31.84 | 37.15 | 39.04 |
| 10 | 0 | 0 | 0 | 0 | 0 | 0.34 | 6.68 | 17.44 | 27.05 | 33.99 | 38.02 | 39.64 |
| 11 | 0 | 0 | 0 | 0 | 0 | 0 | 5.56 | 17.18 | 26.67 | 33.54 | 37.47 | 38.94 |
| 12 | 0 | 0 | 0 | 0 | 0 | 0 | 3.61 | 14.56 | 23.54 | 32.36 | 37.31 | 39.08 |
| Year | 0 | 0 | 0 | 0 | 0 | 0.61 | 6.68 | 17.44 | 27.5 | 33.99 | 38.07 | 40.68 |
| Month | 12 h | 13 h | 14 h | 15 h | 16 h | 17 h | 18 h | 19 h | 20 h | 21 h | 22 h | 23 h |
| 1 | 39.16 | 36.37 | 30.08 | 20.48 | 8.83 | 1.01 | 0 | 0 | 0 | 0 | 0 | 0 |
| 2 | 40.65 | 37.77 | 31.59 | 22.75 | 13.03 | 2.70 | 0 | 0 | 0 | 0 | 0 | 0 |
| 3 | 40.24 | 37.27 | 31.55 | 23.12 | 12.79 | 2.93 | 0 | 0 | 0 | 0 | 0 | 0 |
| 4 | 39.19 | 36.03 | 29.48 | 20.86 | 11.32 | 1.93 | 0 | 0 | 0 | 0 | 0 | 0 |
| 5 | 36.44 | 32.75 | 25.54 | 17.69 | 9.49 | 1.84 | 0 | 0 | 0 | 0 | 0 | 0 |
| 6 | 35.75 | 32.02 | 25.09 | 16.18 | 9.45 | 2.15 | 0 | 0 | 0 | 0 | 0 | 0 |
| 7 | 36.33 | 33.44 | 25.88 | 18.72 | 9.66 | 2.58 | 0 | 0 | 0 | 0 | 0 | 0 |
| 8 | 37.50 | 34.44 | 28.26 | 20.45 | 10.61 | 2.34 | 0 | 0 | 0 | 0 | 0 | 0 |
| 9 | 37.98 | 35.28 | 28.11 | 19.57 | 10.13 | 2.01 | 0 | 0 | 0 | 0 | 0 | 0 |
| 10 | 38.43 | 33.90 | 26.96 | 17.67 | 6.72 | 0.51 | 0 | 0 | 0 | 0 | 0 | 0 |
| 11 | 37.42 | 33.40 | 26.65 | 16.98 | 7.31 | 0.38 | 0 | 0 | 0 | 0 | 0 | 0 |
| 12 | 37.80 | 31.67 | 23.61 | 13.92 | 5.27 | 0.31 | 0 | 0 | 0 | 0 | 0 | 0 |
| Year | 40.65 | 37.77 | 31.59 | 23.12 | 13.03 | 2.93 | 0 | 0 | 0 | 0 | 0 | 0 |
| DC Input | AC Output | ||
|---|---|---|---|
| Voltage range, MPPT (25 °C) | 850–1425 V | Rated power (25 °C/50 °C) | 2500 kVA/2250 kVA |
| Max. system voltage (VOC) | 1500 V | Rated output voltage | 440–660 V |
| Max. input current (25 °C) | 3000 A | Rated frequency | 50 Hz |
| Max. open circuit current | 4300 A | Max. output current | 2624 A |
| Power factor adjustment range | 0.8 (late to early phase) | ||
| Max. conversion efficiency (AC/DC) | 98.6% | ||
| Technical Parameters | Value |
|---|---|
| Rated input voltage | 0.6 kV |
| Rated output voltage | 22 kV |
| Rated capacity | 2500 kVA |
| Rated input current | 2.410 A |
| Rated output current | 66 A |
| Parameters | 1 PV String | 1 Combiner Box | 1 Inverter | The Whole Plant |
|---|---|---|---|---|
| DC Rated power | 9.9 kWp | 158.4 kWp | 2794 kWp | 47,500 kW |
| AC Rated power | - | - | 2500 kVA | |
| Number of inverters | - | - | 1 | 17 |
| Number of combiner boxes | - | 1 | 17.64 | 300 |
| Number of modules in a series | 30 | |||
| Number of parallel PV strings | - | 16 | 282.2 | 4798 |
| Number of modules | 30 | 480 | 8467.05 | 143,940 |
| Rated current Impp | 8.74 A | 139.8 A | 2466 A | - |
| Short circuit current Isc | 9.14 A | 146.2 A | 2580 A | - |
| Category Costs | Prefabricated Float Option | Assembled Float Option | |
|---|---|---|---|
| USD | VNĐ | VNĐ | |
| Shopping | 13,300,000 | 297,055,500,000 | 649,324,350,000 |
| Transportation and installation (10%) | 1,330,000 | 29,705,550,000 | 64,932,435,000 |
| Total | 14,630,000 | 326,761,050,000 | 714,256,785,000 |
| Parameters | Results |
|---|---|
| Number of modules 72 cell—330 Wp | 143,940 |
| Number of inverters 2500 kW | 17 |
| Installed capacity (energy capacity) | 47,500 kWp |
| Area of modules (suitable area) | 279,294 m2 |
| Power output in the first year (generation) | 69,990 MWh |
| PR (Performance ratio) | 81.43% |
| Typical power output of the plant | 1473 kWh/hWp/year |
Disclaimer/Publisher’s Note: The statements, opinions and data contained in all publications are solely those of the individual author(s) and contributor(s) and not of MDPI and/or the editor(s). MDPI and/or the editor(s) disclaim responsibility for any injury to people or property resulting from any ideas, methods, instructions or products referred to in the content. |
© 2023 by the authors. Licensee MDPI, Basel, Switzerland. This article is an open access article distributed under the terms and conditions of the Creative Commons Attribution (CC BY) license (https://creativecommons.org/licenses/by/4.0/).
Share and Cite
Nguyen, N.-H.; Le, B.-C.; Nguyen, L.-N.; Bui, T.-T. Technical Analysis of the Large Capacity Grid-Connected Floating Photovoltaic System on the Hydropower Reservoir. Energies 2023, 16, 3780. https://doi.org/10.3390/en16093780
Nguyen N-H, Le B-C, Nguyen L-N, Bui T-T. Technical Analysis of the Large Capacity Grid-Connected Floating Photovoltaic System on the Hydropower Reservoir. Energies. 2023; 16(9):3780. https://doi.org/10.3390/en16093780
Chicago/Turabian StyleNguyen, Nghia-Hieu, Bao-Chi Le, Le-Ngoc Nguyen, and Thanh-Trung Bui. 2023. "Technical Analysis of the Large Capacity Grid-Connected Floating Photovoltaic System on the Hydropower Reservoir" Energies 16, no. 9: 3780. https://doi.org/10.3390/en16093780