Abstract
This paper addresses the conditions behind energy-related carbon dioxide (CO2) emissions in Poland following its accession to the European Union. The study analyzed some energy, fossil fuel, economic, and environmental indicators, such as energy use, CO2 emissions, driving factors, decoupling elasticity status, and decoupling effort status. It relied on the Kaya identity and Logarithmic Mean Divisia Index (LMDI) in determining the drivers of CO2 emissions. As shown by the results, between 2004 and 2020, energy consumption in Poland grew at an average annual rate of 0.8%, while fossil fuel carbon emissions declined at 0.7% per year. Energy intensity was found to be the key force behind the reduction in CO2 emissions, whereas rapid economic growth was the main driver of CO2 emissions. While other factors, i.e., carbon intensity, energy mix, and population, also contributed to reducing the emissions, they had a much smaller—if not marginal—effect. In turn, the decoupling elasticity analysis showed that Poland mostly witnessed strong decoupling states, which means a strong decoupling of CO2 emissions from economic growth. Furthermore, it follows from the decoupling effort analysis that strong decoupling effort statuses prevailed throughout the study period, suggesting that the changes in the considered factors significantly contributed to reducing CO2 emissions. However, both the decoupling elasticity indices and the decoupling effort indices revealed the presence of an adverse trend. The above means that Poland witnessed a decline both in the strength of decoupling CO2 emissions from economic growth and in the efficiency of policies and measures designed to reduce CO2 emissions.
1. Introduction
One of the major environmental challenges facing humanity today is the progressing global warming resulting from increased atmospheric emissions of greenhouse gases (GHGs), especially including carbon dioxide (CO2), which contributes more than 60% to the greenhouse effect [1,2]. As confirmed by a number of publications, human economic activity is the key source of GHGs. In addition, CO2 emissions are strongly related to the use of fossil fuels and economic growth [3,4,5].
The need to counteract climate change caused by excessive GHG emissions and to implement sustainable development principles is an increasingly urgent matter expressly addressed in Sustainable Development Goals (SDGs) and in the Paris climate agreement entered into in 2015 by 195 countries at the United Nations Framework Convention on Climate Change [6]. The key goal provided for therein is to limit global warming to 1.5–2.0 °C by the end of this century [7]. Meeting that objective requires a considerable reduction in GHG emissions, which, however, is not easy, because their growth is strictly related to economic development. Therefore, the core issue in today’s debates within political and academic communities is the degree to which emissions can be decoupled from economic growth [8].
Decoupling emissions from economic growth is believed to be the key path of sustainable development that prevents environmental degradation with no adverse effects on economic development. However, it is extremely difficult to entirely decouple emissions from economic growth. It would be only possible in a situation where an increase in economic performance is accompanied by an absolute quantitative drop in emissions. The scenario of compatibility between economic growth and reduced emissions is possible both theoretically and practically, as illustrated by numerous examples. In order for this to happen, innovative technologies must be deployed together with an effective economic and fiscal policy, adequate legal regulations, education efforts, and a reorientation of lifestyle focused on implementing the principles of low-carbon living. However, it does not mean that decoupling emissions from growth—as one of the key paths to sustainable development—is not called into question. It is surrounded by different controversies, with negative economic growth being viewed as an enabler of environmental goals. In addition, these controversies gave rise to a broad debate on new terms such as “green growth”, “de-growth” and “agrowth” [8]. “Green growth”, a strategy promoted by the OECD, is designed to support economic growth and development while ensuring that natural assets continue to provide environmental resources and services upon which depends social well-being. Moreover, it is supposed to have a catalyzing effect on investments and innovations, which will provide a basis for sustainable growth and drive new economic opportunities [9,10,11]. In turn, “de-growth” calls into question the necessity of economic growth and proposes a shift toward a post-growth society that values social and environmental well-being over economic growth. Supporters of this concept argue that seeking continuous economic growth is an unsustainable process that contributes to environmental degradation, social disparities, and political instability. They propose alternative forms of economic organization and production that give priority to sustainable growth and to human equality and well-being. Generally, “de-growth” is defined as a fair reduction of production and economic consumption that ensures that the use of resources and waste remains within safe limits of the ecosystem [12,13,14,15]. The above makes “de-growth” clearly focused on a purposeful reduction of economic activity and material wealth [14]. Conversely, the objective of “agrowth” is to attain economic growth while reducing environmental impacts and increasing social well-being. It emphasizes the need to reduce the use of materials and to invest in renewable energies, sustainable infrastructure, and more equitable economic practices. Its supporters argue that economic growth and environmental sustainability can reinforce each other instead of being viewed as incompatible goals. “Agrowth” is a certain alternative to “green growth” and “de-growth”. As emphasized by van den Bergh [12], it is better to be agnostic about growth and implement a strategy that uses GDP only as an indicator (because GDP growth is neither the ultimate goal nor a means to achieve it). He also indicates that the “agrowth” strategy would allow the identification of more policy areas that may improve well-being and environmental conditions [12].
Generally, even though each of these three approaches supports the concern for environmental sustainability, they differ in how they view the role of economic growth in attaining that goal. “Green growth” supporters suggest that economic growth can be sustainable, whereas advocates of “de-growth” propose a fundamental shift away from seeking economic growth. On the other hand, supporters of “agrowth” seek both economic growth and environmental sustainability through a combination of political interventions and changes to economic practices [12,13,14].
Decoupling is at the core of the debate on sustainable growth, which is expressed by a considerable number of research projects launched to investigate the decoupling trends and to identify the factors that affect them. However, as Lundquist [8] emphasizes, the potential for a total decoupling of emissions remains unclear despite extensive research efforts. The results of empirical studies on emissions decoupling differ between the countries, periods, pollution types, and accounting methods. In addition, they depend on the views on each country’s potential for decoupling. However, generally, the key conclusion is that the current levels of decoupling indicators are below what is needed to enable sustainable growth [8].
In some emerging economies, the growth rate of CO2 emissions between 1990 and 2020 was noticeably above the worldwide average [16]. For instance, it was 492.6, 435.8, 285.1, 219.4, and 317.9% in China, India, Turkey, Brazil, and Iran, respectively [16]. In turn, Poland saw a 35.7% decline in CO2 emissions (without LULUCF), from 472.0 million tons in 1989 (base year) to 303.5 million tons in 2020, and a nearly 17% drop in emissions per capita, from 9.2 to 7.7 t [16,17]. Despite the considerable reduction in CO2 emissions, the most recent per capita statistics for Poland continue to be above the European Union average level of 6.1 t. Poland remains one of the largest CO2 emitters and is ranked second (2020) after Germany [18]. These emissions mostly come from the energy sector, an important and complex part of the national economy. In addition, Poland largely depends on coal in addressing its energy demand (coal-fired power stations account for most of the national production of electricity). In addition to coal, Poland owns large reserves of natural gas used in producing both electricity and heat. Despite the quite dynamically developing sector of renewables—in which wind and solar energy have an increasingly greater share in national production of electricity—fossil fuels continue to be the main source of energy and thus the main source of greenhouse gas emissions.
In view of the above, based on 2004–2020 data (a period where the Polish economy witnessed rapid development), this paper investigates the contribution of adjustments to the energy mix, technological progress, economic growth, and population change to CO2 emissions. Second, in addition to analyzing CO2 emissions, trends, and causative factors, the next part of the paper addresses the decoupling status, the decoupling effort, and the efficiency of economic growth and CO2 emission policies by decomposing the decoupling indicator with a combination of the LMDI method and the Tapio model.
This study contributes to research on relationships between carbon emissions and economic growth in two major aspects. First, this paper built a comprehensive consistent framework by combining the Kaya identity, the Tapio decoupling model, and the LMDI method to investigate the relationship between CO2 emissions and economic growth in Poland, the second largest carbon emitter in the EU. Second, the Tapio decoupling model was chosen to identify the decoupling states. The study additionally assessed the effectiveness of efforts made to achieve decoupling using the decoupling effort method. For the purposes of the study, the following research hypotheses were adopted:
H1.
The key determinants of CO2 emissions in Poland are the energy intensity and the economic activity.
H2.
The decarbonization processes of the Polish economy have a weak link to changes in emissions intensity and the energy mix.
H3.
The post-accession period was dominated by a strong decoupling of CO2 emissions from economic growth in Poland.
H4.
Carbon reduction policies and measures implemented in Poland are becoming less and less effective.
According to the author’s knowledge, this study is the first attempt to comprehensively analyze decomposition and decoupling in Poland and may help formulating scientific and practical policies for carbon mitigation in Poland and other countries. Finally, the results of this analysis can contribute to a broader debate on the Polish energy policy, whose instruments should place greater focus on significantly reducing the use of fossil fuels in energy production and on intensifying the efforts made to accelerate the development of renewables.
2. Literature Review
There is ample literature on decoupling growth from emissions CO2. This topic sparks growing interest from scientists because of the increasing global warming mostly caused by CO2 emissions, which threaten the global climate and considerably affect both the environment and human health [19,20]. The decoupling of economic development from carbon dioxide emissions has become the subject matter of a number of studies, especially in the last decades [21,22]. The OECD and Tapio models are the most widely used among the variety of decoupling approaches [2,22,23,24]. In the vast literature on decoupling processes, most studies focus on identifying the decoupling states between CO2 emissions and economic growth and on examining the factors affecting the decoupling states. However, it can also be noted that relatively few publications deal with measuring the efforts that have been made to achieve decoupling and the effectiveness of those efforts [25]. Assessing the decoupling effort significantly extends the research scope as it allows the identification of the effects of policies put in place to mitigate the impacts of CO2 emissions. In addition, it reflects their strengths and weaknesses while making it easier to amend them and achieve decoupling.
Research on decoupling processes is conducted from different angles and at different levels of data aggregation, e.g., at the global, regional, country group, country, sector, and sub-sector levels.
2.1. Studies on Decoupling Process in Country Groups
Chen et al. [2] used the Tapio model to examine the decoupling relationships between influencing factors and CO2 emissions in OECD countries from 2001 to 2015. The results indicate that the decoupling states between fossil fuel CO2 intensity, energy mix, energy intensity, GDP per capita, population size, and CO2 emissions during that period are recessive decoupling, weak negative decoupling, and strong decoupling. In turn, Dai et al. [26] examined the occurrence of decoupling between economic growth and energy-related CO2 emissions in BRICS countries from 1995 to 2014. It follows from their research that Brazil, Russia, and South Africa experienced five decoupling statuses during the study period. However, only three of them occurred in China and India. Moutinho et al. [27] used the Tapio model and the decoupling effort analysis in a study investigating the underlying driving forces behind energy-related per capita CO2 emissions over the 1993–2017 period in a panel of 16 South American countries. Their study found that this group of countries shifted from the weak decoupling state to the strong decoupling state after the signing of the Kyoto Protocol. In addition, it demonstrated that “strong decoupling” was mainly achieved due to a group of economic drivers, with the negative changes in energy intensity and in domestic investment playing the strongest role in reducing CO2 emissions per capita. In turn, Zhang et al. [28] analyzed the decoupling elasticity between carbon dioxide, GDP, and energy consumption in China and ASEAN countries over the period 1990–2014. As shown in their study, in light of the Tapio model, only three decoupling statuses occurred during the considered period, i.e., weak decoupling, expansive coupling, and expansive negative decoupling. Ozturk et al. [29] examined the decoupling of CO2 emissions from economic growth for Pakistan, India, and China over the period 1990–2014. The results of the Tapio elasticity analysis showed that these countries experienced a decoupling of environmental impacts from economic growth. However, relatively speaking, it was a costly negative decoupling in Pakistan, mostly weak decoupling and costly coupling in India, and a weak decoupling in China over many years. In addition, the decoupling elasticity analysis showed that energy intensity was a key enabler of decoupling in these countries, while population, wealth, and energy mix undermined its progress. In turn, Li and Jiang [30] attempted to study the impact of R&D on reducing environmental pressures based on an empirical analysis of the world’s six largest carbon emitters. The main results from the Tapio model and the LMDI technique showed that over the period 1996–2014, the developed countries enjoyed better and more stable decoupling statuses than developing ones. Another conclusion is that the effect of per capita R&D expenditure was the main inhibitor of decoupling CO2 emissions from economic development. However, the energy intensity effect and R&D efficiency effect related to technological progress were the main driving forces for the decoupling process.
2.2. Studies on Decoupling Process in EU Countries
A number of studies have also been carried out in EU countries. Papież et al. [31] analyzed the impact of EU energy policy on decoupling GHG emissions from economic growth between 1996 and 2017. They relied on the Tapio model in carrying out two types of greenhouse gas measurements, i.e., production-based and consumption-based accounting. Although the results show a decoupling of emissions from economic growth in almost all countries, regardless of the type of GHG measurement, it occurs faster in the case of production-based emissions. As regards EU countries (EU-15), the decoupling processes were analyzed by Madaleno and Moutinho [32], who examined the decoupling states and decoupling effort in the context of changes in the evolution of carbon emissions over the period 1995–2014. The study showed that the most significant CO2 reductions occurred in the years following the signing of Kyoto commitments due to a negative and significant impact of carbon intensity of petroleum products, energy intensity, and conversion efficiency. Furthermore, the authors found that the effects of flexibility and of the decoupling effort were not controlled for by internal CO2 factors. In addition, the drivers of CO2 emissions from electricity generation and decoupling processes in the EU were analyzed by Karmellos et al. [33]. According to their results, in the last five years of the study period (2000–2018), a significant number of EU countries moved into a state of strong decoupling, implying successful implementation of relevant energy and environmental policies. Further research among EU countries was carried out by Diakoulaki and Mandaraka [34]. They used the decomposition method to explain the changes in industrial CO2 emissions and to comparatively assess the progress made in EU-14 countries in decoupling emissions from industrial growth between 1990 and 2003. The decomposition results they obtained were further used to assess the real efforts undertaken in each country and their effectiveness. On these grounds, the authors concluded that most EU countries made an important (although not always sufficient) decoupling effort, but no significant progression was observed in the post-Kyoto period.
2.3. Studies on Decoupling Process in Other Countries
Wang et al. [35] compared the decoupling efficiency between China and the U.S. They quantified the decoupling statuses using the Tapio index and decomposed the decoupling index to explore the driving factors behind the decoupling using the LMDI technique. They found that in most years between 2000 and 2014, China experienced expansive coupling and weak decoupling, whereas the U.S. mostly saw weak and strong decoupling. Moreover, the authors proved that income and population had a restrictive effect on decoupling, whereas energy intensity and energy mix effects promoted the decoupling process. In addition, the carbon intensity effect exerted negative and positive effects on decoupling in China and the U.S., respectively. Changes in decoupling processes and energy-related CO2 emissions in the U.S. were also analyzed by Jiang and Li [36]. In light of the decoupling effort ratio, they found that the lack of decoupling prevailed in most of the surveyed years of the 1990–2014 period, whereas strong decoupling was the least frequent state. In turn, Wang and Wang [25] analyzed the decoupling states and the effectiveness of decoupling efforts in the U.S. from 1998 to 2015. Their study used the Tapio model and the decoupling effort model. The analysis of decoupling efforts revealed that energy intensity, R&D intensity and efficiency, and sectoral CO2 intensity contributed to decoupling economic growth from carbon emission, whereas investment intensity, population size, and sectoral energy structure did not. Freitas and Kaneko [37] used the OECD method to investigate the incidence of decoupling between growth rates in economic activity and CO2 emissions from energy consumption in Brazil between 2004 and 2009. In general, they identified various periods of relative decoupling in Brazil but also noted that the decoupling processes did not occur smoothly. Based on the Tapio model, Wang et al. [38] presented a new way to study the change in decoupling rates in China, making it possible to answer the question, why does the decoupling rate change over time? Their research found that only three states of CO2–GDP decoupling (weak and expansive decoupling and negative expansive decoupling) occurred during the studied period. In addition, the researchers showed that the energy–GDP decoupling effect played a significant role in changing the CO2–GDP decoupling rate, followed by the energy–fossil decoupling effect. In contrast, the CO2–energy decoupling effect played a small role in changing the CO2–GDP decoupling rate. Zhang and Da [39] implemented the Tapio index to examine the decoupling relationship between CO2 emissions and growth in China between 1996 and 2010. The results indicate that a relative decoupling effect between CO2 emissions and economic growth was recorded in most years during the study period. This suggests that the reduction effect of CO2 emission inhibitors was less than the driving effect of economic growth, and the economy grew with increased carbon emissions. Xu et al. [40] used the Tapio model in decomposing the indicator of the decoupling of fossil energy CO2 emissions from economic growth in China over the period 1995–2012. Their research showed that decoupling varied due to changes in economic growth and energy intensity between different sub-periods. The economic output effect significantly boosted the decoupling, whereas the energy intensity effect strongly decreased it. In turn, a comparative analysis across different sectors and sub-sectors revealed that industrial growth determined the status of decoupling CO2 emissions from economic growth. In addition, energy-intensive sub-sectors strongly contributed to the decoupling of CO2 emissions, whereas non-energy-intensive ones had a relatively slight impact on it. In turn, Engo [41] used the Tapio model to assess the decoupling and determinants that influenced the relationship between growth and CO2 emissions in Cameroonian industrial and service sectors between 1990 and 2015. The findings showed that Cameroon experienced weak decoupling throughout the research period because weak negative decoupling, strong negative decoupling, and strong decoupling were witnessed in most years, whereas strong decoupling was recorded in only three periods. Roinioti and Koroneos [42] used the decomposition technique and the decoupling index in identifying the driving forces of energy-related CO2 emissions in the Greek economy between 2003 and 2013. Their research shows that the effects of decoupling varied over time. Weak decoupling was experienced in most years, whereas strong decoupling was recorded in only three periods. Moreover, as a result of the recession, no decoupling was found in the last years of the considered period. Yasmeen and Tan [43] used the Tapio method in analyzing the decoupling relation between environmental degradation, energy use, and economic progress in Pakistan based on data from 1972–2017. Based on the decoupling analysis, they identified the decoupling linkage between energy use and CO2 emissions (growth negative decoupling). Conversely, a weak decoupling relation was noticed between CO2 emissions and economic development. Furthermore, a similar weak decoupling relationship was identified to exist between energy consumption and economic progress.
2.4. Studies on Decoupling Process in Transport Sector
Much research has also been undertaken on the transport sector. Tapio [44] presented a theoretical framework for decoupling and applied it in analyzing the relationships between GDP, traffic volumes, and CO2 emissions from transport in EU countries from 1970 to 2001. Aggregate data showed a shift from expansive negative decoupling to expansive coupling in passenger transport and a shift from weak decoupling to expansive negative decoupling in freight transport. In addition, he discovered a weak decoupling of transport CO2 emissions from GDP. Next, Engo [45] examined the decoupling relationship between energy-related CO2 emissions and growth in the Cameroonian transportation sector between 1990 and 2016. The decoupling rates were decomposed into five factors with four fuels consumed in this sector. The results derived from the Tapio model showed that only four decoupling states emerged in the surveyed years, i.e., weak and strong decoupling, weak negative decoupling, and strong negative decoupling. However, scale effects, the energy mix effect, and the energy intensity effect precluded decoupling, while the economic structure effect played an important role in decoupling. In the transport sector, similar research was also conducted by Zhao et al. [46], who analyzed the main drivers of energy-related CO2 emissions in Guangdong, China’s richest and most populous province. The results showed that in general, the decoupling level between transport output and CO2 emissions during the period 1995–2012 was relatively low. In addition, the optimization of the tertiary industry structure was the main inhibitor of CO2 increase. However, the province experienced rapid growth of GDP per capita and population, which was more powerful at boosting CO2 and resulted in the elasticity index rising directly. Moreover, the research shows that reducing energy intensity can be one of the most important ways to increase the decoupling effort. In turn, Li et al. [47] examined the relationship between the development of the transport sector and its CO2 emissions from the perspective of 30 Chinese provinces. The results indicated that underdeveloped provinces were more likely to present a weak decoupling state than developed and coastal zones. The researchers also found that income was the major influential factor limiting the development of decoupling in the transport sector and that the population size played a very small negative role in the development of decoupling.
2.5. Studies on Decoupling Process in Agriculture
Decoupling processes have also been explored in the agricultural sector. Han et al. [48] studied the interactions between agricultural CO2 emissions and growth in 30 Chinese provinces from 1997 to 2015. Based on these data, the coupling and decoupling effects of CO2 emissions and the underlying driving factors were examined using the Tapio model. From these studies, it appears that at the regional basis, the degree of coupling between CO2 emissions and growth was high in the central region of China and low in the western region. At the provincial scale, the coupling effects of CO2 emissions exhibited four levels: minimal, low, moderate, and high coupling. In turn, in most other provinces, CO2–growth relations indicated a weak decoupling state. Linkages between development and energy-driven agricultural CO2 emissions was also studied by Hossain and Chen [49]. Their results showed that the agricultural sector of Bangladesh was strongly and weakly decoupled from agricultural growth in most years of the period 1990–2017. Research in agriculture was also carried out by Huang and Zhang [50] in Heilongjiang, China’s largest grain-producing province. The study estimated its grain-production-induced CO2 emissions and examined the nexus between this production and emissions between 2000 and 2018, using decoupling and decomposition methods. The decoupling analysis showed that weak decoupling occurred for half of the study period; however, the decoupling and coupling states occurred alternately, and there was no definite evolving path from coupling to decoupling. In turn, Liu and Feng [51] attempted to explain the mechanism behind the decoupling of economic growth and CO2 emissions in the agricultural sector in mainland China from 2005 to 2016. The results obtained from the Tapio model showed that the decoupling efficiency was not perfect. Their study found that the most important factors affecting the decoupling status were investment and investment efficiency, and the major obstacle was investment in productivity growth being greater than investments in energy saving and carbon reduction. In addition, the decoupling status and investment orientation of decoupling activities varied across regions. At the national level, the dominant decoupling status changed from weak to expansive. Luo et al. [52] also studied the decoupling of carbon emissions from agricultural growth in China from 1997 to 2014. Their results indicate that decoupling in the agricultural sector generally followed a favorable trend. Strong negative decoupling prevailed in the early years of the studied period, while weak or strong decoupling was recorded in subsequent years.
2.6. Studies on Decoupling Process in Spatial Units
A significant number of studies on decoupling process have been carried out in Chinese provinces and counties. Based on the Tapio model and the LMDI method, Huang et al. [53] analyzed the evolution of energy-related CO2 emissions as well as the decoupling relationship and its driving factors in the Qinghai province between 1997 and 2017. The results indicated that this relationship was represented by four types: weak and strong decoupling, expansion negative decoupling, and expansion coupling. Among them, strong decoupling was achieved in only five sub-periods. Qin et al. [54] used the Tapio index to decompose the driving forces of decoupling and measured the states of the sector’s decoupling from CO2 emissions in the Chinese province of Xinjiang between 2000 and 2017. These studies found the occurrence of four decoupling states in this period, i.e., weak decoupling, expansive coupling, expansive negative decoupling, and strong negative decoupling. Most industries in this province failed to reach the ideal decoupling state, with GDP per capita elasticity having the main inhibitory effect on the decoupling of CO2 emissions. In turn, energy intensity elasticity was a major driver of decoupling. Based on the Tapio model, Shi et al. [55] analyzed the decoupling status of CO2 emissions from economic growth in 16 districts of Beijing during the period of 2006–2017. Their decoupling states demonstrated some phased improvement characteristics. In 2017, over 93% of districts achieved a decoupling state (whether strong or weak); 37% of districts achieved strong decoupling, the most desirable state. The authors believe these favorable changes to be caused by urban functional zones and the transformation of the industrial structure, as well as by the direct impact of the national environmental policy. In turn, You et al. [56] analyzed the decoupling relationship between coal-related CO2 emissions and economic growth in China from national and provincial perspectives between 1997 and 2016 through the Tapio index. The results reflect the inverted “U” shape of the decoupling curve and demonstrate that the vast majority of provinces achieved a strong decoupling of economic growth from coal-related carbon emissions by 2016. Furthermore, they prove that activity and energy intensity effects were the prevailing forces driving and curbing the increase in the decoupling rate, respectively. Wang et al. [57] used the decoupling effort indicator to examine the contribution of factors that influenced energy-related CO2 emissions in the Chinese province of Jiangsu from 1995 until 2009. The findings show that during the period considered, strong decoupling was recorded only twice, and a weak decoupling effect prevailed in most of the remaining time intervals.
2.7. Studies on Decoupling Process in Other Sectors and Sub-Sectors
The decoupling analyses have also been frequently applied to a number of other sectors and sub-sectors of the Chinese economy. Li et al. [58] studied the decoupling relationship and its influencing factors between economic growth and CO2 emissions in China in the manufacturing and household sectors between 1996 and 2012. The results showed that the decoupling status of the manufacturing sector remained mainly at the level of weak decoupling, while that of households generally indicated strong decoupling. Luo et al. [59] exploited the Tapio method to analyze the decoupling processes in 28 Chinese industries between 2002 and 2017. In these sectors, economic growth and CO2 emissions were slowly decoupling. In addition, researchers proved that energy intensity promoted the decoupling, whereas economic growth had an opposite effect. Other factors showed little impact on the decoupling of CO2 emissions. Wang et al. [60] constructed a decoupling effort index for the Chinese iron and steel industry. Based on the results, they found that the decoupling efforts of the industry gradually changed from weak to strong and that environmental regulations and technological developments particularly contributed to decoupling. In turn, Wan et al. [61] used the Tapio method in investigating the decoupling relationship between CO2 emissions and growth of the equipment manufacturing industry in China from 2000 to 2014. Based on the results, the authors found this relationship to be weak, which means the industry grew faster than carbon emissions. The indicators of the industry’s decoupling effort were all below 1.0, suggesting that weak decoupling prevailed during the study period. Meanwhile, Wu et al. [62] used the Tapio model to investigate the decoupling relationship between economic output and CO2 in the Chinese construction industry from 2005 to 2015. Their results indicate that there existed an expansive decoupling relationship between growth and construction-related CO2 emissions in most Chinese provinces during these years. The researchers also found that economic output played the most significant role in inhibiting the decoupling at both the national and provincial levels, while indirect carbon intensity was the main driver for promoting nationwide decoupling. In turn, Wang et al. [63] explored the decoupling relationship between CO2 emissions and power generation of the Chinese power sector and the driving factors of the decoupling index at provincial level between 2000 and 2019 using the Tapio and LMDI methods. The decoupling analysis showed that five provinces achieved decoupling, and most provinces were in expansive coupling states in this period. The decomposition analysis also indicated that per capita GDP and population size were responsible for inhibiting the decoupling process, whereas thermal power generation efficiency and electricity intensity promoted it. In turn, Yang et al. [64] used the LMDI method and the Tapio index to analyze the decoupling elasticity and effort index of industrial growth and CO2 emissions in China from 1996 to 2015. They found that industry-related CO2 emissions increased about 1.5 times during the study period, with the manufacturing sector contributing the most, followed by the transport sector. Furthermore, their research found that the manufacturing sector witnessed a reverse U of decoupling progression, moving from strong decoupling to weak decoupling and then turning back to strong decoupling. In addition, they noted that expansive decoupling and strong negative decoupling emerged in the construction, transport, and commercial sectors; provinces with high energy demand and heavy industry were able to achieve strong decoupling, while those with lower energy demand witnessed a clear trend toward decoupling.
In summary, there is extensive literature on decoupling growth from emissions CO2 in which the research was conducted from a variety of perspectives and at different levels of data aggregation. The literature review also shows that the Tapio method is the most often used of the various decoupling approaches, with most studies limited to identifying states of decoupling between emissions and growth. In addition, the literature studies clearly indicate that few publications deal with measuring the efforts that have been made to achieve decoupling and the effectiveness of those efforts. This work adopts an integrated method framework to better understand the decoupling process of CO2 emissions and economic growth in the long run covering 2000–2014. This paper utilizes Tapio’s decoupling indicators and decoupling effort indices to examine the decoupling between economic development and carbon emissions in Poland, i.e., one of the largest CO2 emitters in the EU. Then, in the decoupling analysis, an LMDI decomposition technique extended by Kaya identity is introduced into the decoupling system in order to construct a model allowing the identification and analysis of the contribution of selected factors of the decoupling process.
3. Materials and Methods
3.1. LMDI Decomposition Analysis
The starting point for these analyses is the Kaya identity [65], which links anthropogenic CO2 emissions to demographic and economic parameters and technological aspects of energy [66]. Accordingly, total emissions can be expressed as the product of four factors, i.e., population, GDP per capita, energy intensity, and CO2 content of energy consumption. Both the equation itself and its extended versions are widely used in analyzing and simulating global CO2 emissions under the policy for fighting against global warming. In view of these analyses, the identification of driving forces behind energy-related CO2 emissions in Poland relied on the Index Decomposition Analysis (IDA), which exhibits completeness (does not leave a residual term) and zero-value robustness, passes the time-reversal test [42,67,68,69], and offers a broader variety of indices, their forms, and mathematical specifications [67]. Considering these properties, the study used the weighted logarithmic mean Divisia index (LMDI) developed by Ang et al. [68]. It is the most widely adopted and broadly recommended IDA method, which proved its efficiency in a number of research projects addressing energy and emissions [70]. This paper decomposed CO2 emissions in Poland using a five-factor model underpinned by the Kaya identity and the LMDI method in the following form:
Using the designations , , , , and , Equation (1) can be written as follows:
Equation (1) links CO2 emissions to the consumption of fossil fuels (FE), total supply of primary energy (E), economic activity measured as GDP per capita (GDP), and population size (POP). It provides a basis for identifying five determinants of carbon dioxide emissions:
means CO2 emissions per unit of fossil fuels (coal, oil, natural gas), i.e., measures the impact of emission intensity, and reflects technological and qualitative changes and the restructuring of the fuel mix.
means the impact of fossil fuel intensity, i.e., indicates the share of energy derived from fossil fuels in primary energy consumption, and indirectly reflects the penetration effect of emission-free energies.
measures the impact of energy intensity of economic activity whose levels depend on energy use efficiency and economic structure.
represents the impact of economic growth or, in other words, the impact of the increase in wealth measured as gross domestic product per capita.
means the population size whose growth entails an increase in energy consumption and in CO2 emissions.
The indicators used in Equation (2) enable the analysis of changes in carbon dioxide emissions from energy use in the context of impacts of five changing factors, i.e., emission intensity , substitution (structure) of fossil fuels , energy intensity , economic growth , and population size . Using the additive specification, the changes in CO2 emissions in the context of impact of those changing factors can be presented as
The use of LMDI translates into the following formulas (Equations (4)–(8)) that specify the impact of each factor on changes in CO2 emissions:
where is the logarithmic average of two positive numbers, defined as
3.2. Decoupling Elasticity Model
The decoupling elasticity index , developed by Tapio [44] to assess the sensitivity of GDP to changes in CO2 emissions, was used in identifying the decoupling states as per the formula below:
In addition, the decomposition results (Equation (3)) can be combined with the decoupling index (Equation (10)) to determine the impact of each factor on the relationship between economic growth and CO2 emissions. It was measured by decomposing as follows [32,71]:
where εCI, εES, εEI, εGP, and εP are the decoupling elasticity values of carbon intensity, energy structure, energy intensity, economic growth, and population growth, respectively. The decoupling states between economic growth and CO2 emissions can be split in eight categories, as shown in Table 1.

Table 1.
Descriptions of decoupling elasticity states (adapted from Tapio [44]).
3.3. Decoupling Effort Model
The analysis also used the decoupling effort index, which allows the tracking of the reduction in CO2 emissions in the context of implementing various policies focused on adjusting the economic structure and improving energy efficiency [25,61,64] and—as emphasized by Madaleno and Moutinho [32]—in the context of use efficiency of funds disbursed under European commitments. The structure of this index (ΔCO2,Z) takes account of all efforts other than economic growth (ΔGP) that either directly or indirectly restrict CO2 emissions [32,61,64,71], as described by the following equation:
Then, the decoupling effort index (δ), which represents the degree of the decoupling effort between year t and year t − 1, can be expressed by the following function:
where δ is the total decoupling effort index, and δCI, δES, δEI, and δP mean the impact of changes in emission intensity, energy mix, energy intensity, and population size, respectively, on reducing CO2 emissions [27,61]. The meaning of different decoupling effort indices is shown in Table 2. Positive economic growth (ΔGP > 0) and δ ≥ 1 mean strong decoupling, i.e., a situation where the decoupling efforts of four factors are greater than emission growth caused by the economic effect. This is the most beneficial scenario for both economic development and environmental protection [32]. Conversely, when ΔGP > 0 and 0 < δ < 1, weak decoupling takes place. In this case, the decoupling efforts of the four factors are weaker than the effects of economic growth. In turn, ΔGP > 0 and δ < 0 mean negative decoupling, caused by the fact that as economic growth increases CO2 emissions, so do the other factors. In the case of negative economic growth (ΔGP < 0), there is recessive decoupling caused by a decline in both GDP per capita and CO2 emissions.
Table 2.
Descriptions of decoupling effort states (adapted from Diakoulaki and Mandaraka [34]).
3.4. Data
The analysis relied on three data sources spanning from 2004 to 2020, i.e., from the moment Poland joined the European Union. The first one contained data on the volume and structure of CO2 emissions from fuel (coal, oil, and gas) combustion, published by the International Energy Agency [72]. The second source was Eurostat, the EU’s Statistical Office, which provided information on energy consumption, energy mix, and population size [73,74]. The third source was the World Bank [16], which provided information on Polish economic progress, measured with the gross domestic product (GDP, at constant 2015 USD).
4. Results and Findings
4.1. Trajectory of Energy Use, CO2 Emissions, and Changes in GDP
Table 3 and Figure 1 show the changes in the level and structure of energy use in Poland between 2004 and 2021. It follows from this information that the total energy consumption in Poland grew at an average annual rate (ΔR) of 0.8% over the study period. As a consequence, it went up from 3800–3858 PJ (2004–2006) to 4301–4426 PJ (2018–2020), i.e., by ca. 14%. In turn, it can be noticed that the analysis period witnessed quite important changes in consumption levels of particular energies, resulting in a restructuring of the energy mix. As Table 3 suggests, although coal was the main source of energy in Poland throughout the period considered, its importance declined steadily (ΔR = −1.5%). In 2004–2014, coal-derived energy amounted to an average of ca. 2270 PJ, but it was ca. 2050 PJ in 2015–2019, and only 1842 PJ in 2020 (the pandemic period). These trends translated into considerable changes in the energy mix. The share of coal energy declined from 59–62% (2004–2007) to 43% (2020). Conversely, the changes in the consumption of energy derived from oil and natural gas seem to follow an opposite trend. The supply of these energies grew at the same rate (ΔR = 2.6%), and their share in total energy supply went up from 21.9 to 29.4% and from 12.4 to 16.5%, respectively. From the perspective of emissions, these are generally favorable trends—Poland saw a gradual shift from high-emission energies to lower-carbon sources. As shown in Table 4 and Figure 2, CO2 emissions from coal combustion dropped at an average annual rate of 2.2%, going down by nearly 30% between 2004 (221.5 Mt) and 2020 (156.3 Mt). However, at the same time, oil and natural gas-derived emissions grew at a comparable rate (of ΔR = 2.1% and ΔR = 2.3%, respectively), translating into a generally slow reduction in total CO2 emissions from fossil fuels. Indeed, total emissions declined at an annual average rate of barely 0.7% over the study period. As a consequence, the level recorded in 2020 (266 Mt CO2) was only ca. 11% lower than that witnessed in 2004 (300 Mt CO2). The above means that changes in the fossil fuel mix are not enough to radically reduce CO2 emissions and must be more tightly related to the development of other energy sources. In Poland, the development of nuclear energy and renewables is of crucial importance. However, nuclear energy—as an alternative to fossil fuels—is only at the conceptual stage and therefore cannot be expected to affect the restructuring of energy supply (and the resulting reduction in emissions) in the medium term. Conversely, considerable and untapped resources of energy can be provided by renewables (RE). Although the supply of RE went up from ca. 180 PJ (2004–2005) to ca. 450 PJ (2020), i.e., increased 2.5 times, and demonstrated the highest average growth rate (ΔR = 5.9%), the data in Table 1 also show a clear slowdown in that favorable trend. After 2015, the RE supply grew at a much slower rate (ΔR = 2.8%), and their share in total energy supply fluctuated slightly, falling into a narrow interval of 9.4–10.4%. Accelerating the development of RE in Poland will be a tremendous challenge in the years to come. The Directive of the European Parliament and of the Council of 2021 sets forth a binding target of 32% for the amount of RE in the Union’s final energy consumption by 2030 [75]. This means that as part of the plan for climate goals, the share of RE in final gross energy consumption would need to increase to 40% by 2030 to enable attaining the Union’s goal for reducing gaseous emissions. However, as it is unrealistic for Poland to reach that level within 10 years, the national Ministry of Climate and Environment declared that the share of RE in the final gross energy consumption would grow to 21% by 2030 [76]. This is much below the level planned for the EU (40%) but nearly twice what was recorded in 2020.
Table 3.
Total energy supply and structure in Poland from 2004 to 2020 (PJ, total energy = 100) 1.
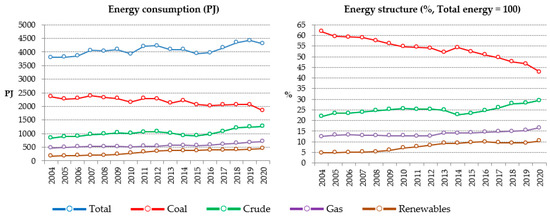
Figure 1.
Total energy supply (PJ) and structure (%) in Poland from 2004 to 2020.
Table 4.
Emissions from fossil fuel combustion in Poland in 2004–2020 (Mt CO2 eq.) 1.
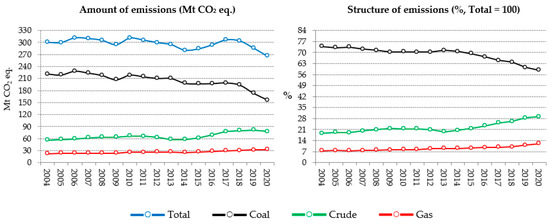
Figure 2.
Amount and structure of emissions from fossil fuel combustion in Poland in 2004–2020 (Mt CO2 eq.; %).
In the context of the main objective of this analysis, it is also essential to indicate the trend followed by the relationship between CO2 emissions and economic growth. As shown in Figure 3, the sluggish reduction in CO2 emissions contrasts sharply with rapid economic growth. In 2004, the Polish GDP was “only” USD 316 billion and grew to USD 556 billion in 2020, i.e., by nearly 76% [16]. Such rapid economic growth was the consequence of a high annual average growth rate of 3.6% between 2004 and 2020. Note that over this period, a decline in GDP was only recorded in 2020 and was caused by the economic downturn brought by pandemic-related adverse developments. In other years, even during the global financial crisis (2008–2009), the Polish economy progressed on the path of steady economic development. The above also shows that CO2 emissions can be reduced with no detrimental effect on economic growth, i.e., it is possible to reduce the former while stimulating the latter.
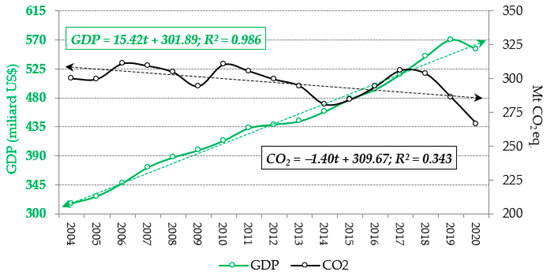
Figure 3.
GDP growth versus emissions from fossil fuels combustion in Poland in 2004–2020.
4.2. Decomposition Analysis
This section presents the results of the LMDI decomposition, which served as a basis for analyzing the key conditions affecting the volume of CO2 emissions in Poland as per the methodology presented earlier. Changes in CO2 emissions were considered in a 17-year perspective (2004–2020, i.e., after Poland’s accession to the EU) and in the context of five factors (Equations (1) and (2)). The decomposition was preceded by an analysis of changes in these factors over the study period.
According to the data shown in Table 5 and Figure 4, the factors changed at different paces over the study period and therefore differed in their impacts on changes in CO2 emissions. It can be observed that emission (carbon) intensity (CI) remained very stable across the study period. In most years, the volume of CO2 emissions from fossil fuels was ca. 80 kt/toe; a relatively smaller level (ca. 75 kt/toe) was recorded at the end of the analysis. The small extent of these changes is also corroborated by descriptive statistics. Each year, the emission intensity deviated only slightly from the average of 79 kt/toe, and the average annual growth rate (ΔR) was only −0.44%. These low levels clearly suggest that the carbon intensity remained virtually unchanged between 2004 and 2020.
Table 5.
Changes in the factors of the decomposition model for Poland from 2004 to 2020 1,2.
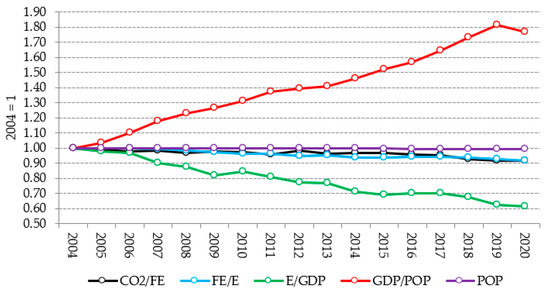
Figure 4.
Pace of changes in factors of the decomposition model for CO2 emissions from fossil energy in Poland from 2004 to 2020 (2004 = 1).
Similar conclusions can be drawn from the analysis of changes in the share of energy derived from fossil fuels in total energy supply (ES). According to Table 5, that factor also remained quite stable (0.88–0.96 TJ/TJ) and thus exhibited little variation over time (∆R = −0.55%). It is worth noting that it remained virtually constant (0.88–0.90 TJ/TJ) from 2014, which means that in practice, no changes occurred in the energy mix. The above also suggests that renewable energies continue to be of minor importance in Poland, and their penetration is a sluggish process.
From the perspective of statistical metrics used (∆R = –3.11%), much greater changes were recorded in energy intensity (EI), which dropped from 11–12 PJ (in 2004–2008) to ca. 7.5 PJ (in 2019–2020), i.e., by 35%. However, a more detailed insight into the Table 5 data suggests that a considerable drop in energy intensity occurred only in 2014–2020 when the energy consumption per GDP unit decreased to 7.5–8.5 PJ.
In turn, the GDP per capita (GP) is the factor that changed the most over the study period. The average annual economic growth rate per capita was as high as 3.71%; as a consequence, the values recorded in 2019–2020 (14.64–15.01 USD thous. per capita) were as much as ca. 76% greater than those seen in 2004–2005 (8.27–8.57 USD thous. per capita). In Poland, the rapid growth of the GDP per capita was mostly due to growth in the GDP. Indeed, as shown in Table 5, the Polish population (P) varied only to a marginal extent (∆R = −0.04%) and fell within the narrow interval of 38.19–37.96 million throughout the study period.
The direction and pace of changes in factors covered by the decomposition model, as presented above, clearly show that the factors considerably differed in the direction and strength of impact they had on carbon dioxide emissions in Poland (which is corroborated by the results of CO2 emissions decomposition). It can be noticed (Table 6 and Figure 5) that despite the extremely slow reduction in emission intensity (ΔCI), its changes between 2004 and 2020 contributed to a reduction in CO2 emissions. A slight drop in the emission intensity caused a nearly 23 Mt total reduction in CO2 emissions over that period. The Table 6 data also suggest that this factor had a restrictive effect on emissions in ten sub-periods, especially in those where the decline in CO2 emissions per energy unit was relatively faster (2004–2005, 2007–2008, 2011–2020, 2012–2013, and 2017–2018). The data presented above also show that even a relatively small drop in the emission intensity translated into a significant reduction in emissions. However, considering the structure of deviations, it can be easily seen that the emission intensity did not exert any significant impact on changes in CO2 emissions. Compared with other factors, it had a relatively small share in the total variation (ΔCO2), with 87.4% over the entire study period.
Table 6.
Decomposition of changes in fossil energy CO2 emissions in Poland between 2004 and 2020.
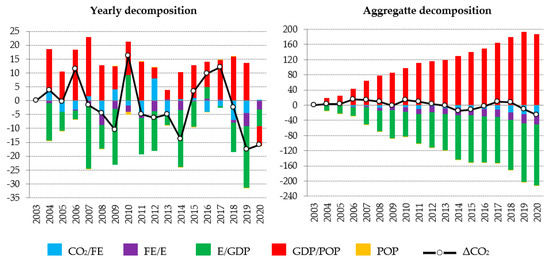
Figure 5.
Yearly and aggregate decomposition of changes in fossil energy CO2 emissions in Poland between 2004 and 2020.
Similar conclusions can be drawn from the impact analysis of the energy mix (ΔES) on CO2 emissions. The decomposition results prove that aggregate changes in that factor generally had a restrictive effect on emissions (ΔES = −27.80 Mt CO2). However, just like in the case of emission intensity, changes in the energy mix also played a relatively small role in reducing carbon dioxide. In the entire period from 2004 to 2020, its average share in total variation (ΔCO2) was 106.2%, i.e., only slightly more than that of the carbon intensity (87.4%).
In turn, changes in energy intensity (ΔEI) can be observed to be a strong determinant of changes in CO2 emissions. The data presented in Table 6 suggest that a significant reduction in energy consumption per GDP unit brought CO2 emissions down by a total of 160.16 Mt over the study period, and the importance of that factor is strongly emphasized by its contribution to the total variation in emissions (nearly 612%). In light of the decomposition results, favorable changes in energy intensity were of key importance to reducing growth in CO2 emissions virtually throughout the study period, except for two sub-periods, i.e., 2009–2010 and 2015–2016, where Poland experienced an increase in energy intensity (though to a small degree).
Conversely, the next factor, GDP per capita (ΔGP), contributed the most to the increasing CO2 emissions in Poland over the study period. On an aggregate basis (2004–2020), rapid growth in GDP per capita resulted in increasing CO2 emissions by as much as 186.68 Mt, which translated to it having the greatest contribution to the total variation in emissions (ΔGP = −712.9%). This made economic growth the factor with the strongest negative impact on reducing CO2 emissions in Poland in the study period. In addition, as emphasized earlier, the dynamic growth in the GDP per capita was only marginally related to changes in the population size. Indeed, the Polish population declined to a small extent (from 38.2 million to 38 million), i.e., by less than 1%. The marginal (though having a beneficial effect on emissions reduction) changes in the population size translated into favorable, though also marginal, changes in carbon dioxide emissions. In light of the decomposition results, the population factor (ΔP) can be viewed as accountable for reducing CO2 emissions by 2.02 Mt, which in relative terms means a share of only 7.7% in reducing Polish CO2 emissions between 2004 and 2020.
4.3. Decoupling Analysis Results
This section presents the results of the decoupling analysis, which was combined with the results of the LMDI decomposition in order to examine the relationship between CO2 emissions on one side and fossil fuel CO2 emission intensity, energy intensity, GDP per capita, and population size on the other. The investigation into these dependencies was underpinned by the Tapio’s decoupling elasticity model [44] and the decoupling effort model [34].
4.3.1. Decoupling Elasticity Analysis
The decoupling states (calculated as per Equation (11)) between the CO2 emission intensity of fossil energy, energy structure, energy intensity, GDP per capita, and population size on one side and CO2 emissions in Poland on the other between 2004 and 2020 are shown in Table 7 and Figure 6. It follows from the analysis that aggregated decoupling elasticity indices were negative, which generally is indicative of a strong decoupling of economic growth from the amount of CO2 emissions. In the years of strong decoupling, the elasticity index varied broadly, with the highest levels being recorded in 2011–2014 (−1.384 and −1.511) and the relatively lowest in 2004–2007 (−0.036 and –0.078). In turn, when considering the factors separately, it may be noticed that they differed quite importantly in the strength (and, though to a smaller degree, in the direction) of their impact on the overall decoupling index. However, what the data generally show is that strong decoupling states were mostly determined by the energy intensity (εEI) and economic growth per capita (εGP). In the case of energy intensity, the decoupling elasticity value (εEI) fell into the interval of −0.632 (2004–2005) to −3.542 (2011–2012), and its average level in years of strong decoupling was −1.420. In turn, as regards economic growth per capita, the values of decoupling elasticity (εGP) varied moderately (0.947–0.995), with an average level of 0.973 in years of strong decoupling. Compared with these two, other factors generally had a much smaller or marginal impact on the decoupling processes. Although their changes contributed to strong decoupling, their effect was not as powerful as that of energy intensity and GDP per capita. This is because the decoupling elasticity for emission intensity (εCI = −0.096), energy mix (εES = −0.231), and population change (εP = −0.003) was negative in years of strong decoupling.
Table 7.
Decoupling elasticity indices, and decoupling states for Poland (annual changes) 1,2.
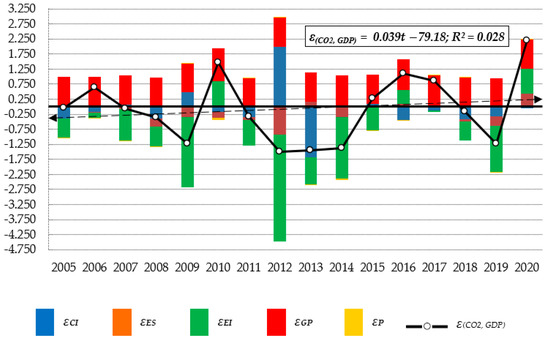
Figure 6.
Decoupling elasticity indices in Poland in 2005–2020.
While other decoupling states were also witnessed between 2004 and 2020, they were either sporadic or much less frequent than strong decoupling. In two sub-periods (2005–2006 and 2014–2015), a weak decoupling state was recorded as a consequence of rapid economic growth combined with a small increase in CO2 emissions. In turn, the last sub-period covered by the analysis (2019–2020) saw recessive decoupling. It was caused by a decline in the GDP and a reduction in emissions, with the GDP decreasing much slower than CO2 emissions. The data shown in Table 7 also suggest that other identified decoupling states were extremely rare. The expansive negative decoupling state was recorded only once (2009–2010) and was caused by CO2 emissions growing faster than the GDP. In turn, the expansive coupling state was experienced in 2015–2016 and 2016–2017 due to the emissions and GDP growing at a similar rate. The presence of these states was determined by different factors. In the case of the relatively beneficial weak decoupling state, positive values of overall decoupling indices (0.627 and 0.286) were due to a considerable weakening of favorable changes in emission intensity (εCI), energy structure (εES), and energy intensity (εEI), accompanied by a stable and important role of economic growth per capita (εGP) and marginal changes in the population size (εP). In turn, the expansive coupling state recorded in 2015–2016 and 2016–2017 demonstrated quite similar characteristics. The common trait of these sub-periods was the negative impact exerted on the decoupling processes by adverse changes in the energy mix (εES), growth in energy intensity (εEI) in 2015–2016 or the lack of progress in that respect in 2016–2017 and the slowdown in the reduction of fossil fuel emissions (εCI).
Compared with these rare decoupling states, a truly disadvantageous state was witnessed the last year of the analysis. The recessive decoupling state recorded in 2020 was mostly determined by two factors, i.e., the energy mix (εES = 0.435) and the energy intensity (εEI = 0.827). Given the relatively stable GDP per capita (εGP) and marginal impacts of emission intensity (εCI) and population size (εP), these factors largely determined the high positive level of the overall index () and thus the recessive nature of the decoupling.
In summary, strong decoupling states prevailed in Poland between 2004 and 2020. The overall decoupling index for the whole period () also suggests that it was a time dominated by processes of strong decoupling of CO2 emissions from economic growth. When comparing the impacts of five factors on these processes, it may be concluded that they were mostly determined by growth in the GDP per capita (εGP = 0.988) and the reduction in energy intensity (εEI = −0.835). Against that background, the impacts of emission intensity (εCI = −0.153) and energy mix (εES = −0.154) were much weaker (though also positive), whereas the changes in population size played a marginal role (εP = −0.011). Note, however, that the linear trend (Figure 6) reflects a negative trend followed by the overall decoupling elasticity index (0.039t). In light of the trend’s parameters, the overall decoupling elasticity was increasing, mostly due to growth in εES and εEI. It means that the decoupling of CO2 emissions from economic growth was becoming weaker, and that the beneficial decoupling processes may come to a halt if the energy mix is not radically restructured and if less energy-intensive technologies are not developed.
4.3.2. Decoupling Effort Analysis
The decoupling effort indices for Poland for the period 2004 to 2020 are derived using Equation (13), as shown in Table 8 and Figure 7. On a yearly basis, the indices show that the Polish economy usually exhibited good performance because strong or weak decoupling was recorded in most years. To be more specific, strong decoupling (δ = 1.036–2.540) occurred in 10 and weak decoupling (δ = 0.142–0.712) occurred in 3 out of 16 years. In years of strong decoupling, the relatively high levels of δ were determined to a varying degree by each factor. However, the general finding from the results was that changes in energy intensity (δEI = 1.428) and in the energy mix (δES = 0.321) were, on average, the strongest determinants of the overall decoupling effort index in these years and varied within the following intervals: 0.154–3.959 (δEI) and −0.159–0.871 (δES). While other factors also generally had a boosting effect on δ, their impact was clearly smaller. In years of strong decoupling, their average decoupling effort indices were much lower, with 0.045 for carbon intensity (δCI) and 0.002 for changes in population size (δP). In addition, the impact of these factors varied strongly over time (Table 8). The decoupling index for carbon intensity (δCI) fluctuated heavily from −2.288 (2011–2012) to 2.287 (2012–2013), while that for population size (δP) ranged from −0.023 (2010–2011) to 0.034 (2013–2014), which additionally shows its small importance.
Table 8.
Decoupling effort indices for Poland (annual changes) 1,2.
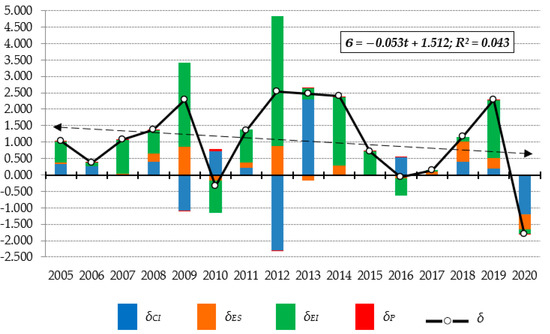
Figure 7.
Decoupling effort indices in Poland in 2005–2020.
In the three years of weak decoupling, it can be noticed, too, that the overall decoupling effort indices (0.142–0.712) were determined to a varying degree by each factor, and the direction of their impact varied over time (Table 8 and Figure 7). However, generally, these decoupling states largely resulted from minor changes in the emission intensity, energy mix, and population size and—especially in 2005–2006 and 2016–2017—from a relatively slow progress in reducing energy intensity. This is corroborated both by the decoupling indices recorded in those years and by their average levels for weak decoupling states (δCI = 0.078, δES = 0.028, δEI = 0.299, and δP = 0.004, respectively)
Growing negative decoupling states occurred twice (2009–2010 and 2015–2016) over the analysis period. In those years, the considered factors had a small total contribution to reducing CO2 emissions (ΔCO2,Z = 0.610–4.230), and the absence of the decoupling effect was mostly caused by the negative trend followed by the energy mix (δES) and energy intensity (δEI). The total negative impact of these factors was not offset by the reduction in emission intensity (δCI) and in population size (δP). As a consequence, the overall decoupling indices were negative (−0.352 and −0.066), and thus, the decoupling effect did not occur.
The results also show that recessive decoupling (δ = −1.815) was witnessed in the last sub-period (2019–2020) because of a decline in both the GDP and CO2 emissions. It was caused by the negative impacts of all factors, as indicated by the values of all decoupling indices. It can also be noticed that the emissions factor (δCI = −1.197) contributed the most to the emergence of that decoupling state.
To summarize, during the years 2004–2020, Poland mostly experienced strong decoupling effort states, which is consistent with the positive average level of the overall decoupling effort index for the whole period (δ = 0.160) and suggests that—generally—changes in the considered factors considerably contributed to reducing CO2 emissions. However, the conclusion from comparing the influence of each factor on the decoupling processes is that they were primarily determined by energy intensity (δEI = 0.786) over the study period. Against that background, the impacts of emission intensity (δCI = 0.181) and energy mix (δES = 0.182) were much weaker (though also positive), whereas the changes in population size played a marginal role (δP = 0.011). Note, however, that just like in the case of decoupling elasticity, changes in the overall decoupling effort index also follow a negative linear trend (Figure 7). In light of the trend’s parameters, it was decreasing (−0.053t), mostly due to the downward trend followed by δEI and δCI, with the other factors (δES, δP) playing a much smaller role. Generally, it means that the four factors together had a diminishing impact on reducing CO2 emissions. It also suggests that the CO2 reduction policies and measures implemented in Poland were becoming less and less efficient and must be amended.
5. Conclusions and Policy Implications
This study attempted to determine the strength and direction of the impact of selected factors on energy-related CO2 emissions in Poland after its accession to the EU. The relationships were examined in the context of impacts of the energy mix, fossil fuel CO2 intensity, energy intensity, GDP per capita, and population size. This study contributed to research on the relationships between carbon emissions and economic growth in two major aspects. First, this paper built a comprehensive consistent framework by combining the Kaya identity, the Tapio decoupling model, and the LMDI method to investigate the relationship between CO2 emissions and economic growth in Poland. Second, the study additionally assessed the effectiveness of the efforts made to achieve decoupling using the decoupling effort method. In addition, this study is the first attempt to comprehensively analyze decomposition and decoupling in Poland and may help in formulating scientific and practical policies for carbon mitigation in Poland. Based on the empirical results, the main findings of this paper were as follows:
- (1)
- In light of the results brought by the decomposition analysis, the energy intensity effect and the effect of economic activity were the key determinants of CO2 emissions in Poland, both on an aggregate basis and in the vast majority of the years covered by the study. The energy intensity effect contributed the most to reducing CO2 emissions. The reduction in the energy intensity over that period translated into 160 Mt of total reduction in emissions, which suggests that more efficient technical and technological solutions were put in place. Conversely, economic growth contributed the most to increasing CO2 emissions in Poland. On an aggregate basis (2004–2020), the rapid growth in the GDP per capita entailed an increase in fossil fuel CO2 emissions by as much as over 187 Mt.
- (2)
- Compared with the impacts of energy intensity and economic growth, changes in emission intensity and energy mix contributed much less to decarbonization processes. Over the study period, the small but generally beneficial decline in emission intensity and the generally favorable changes in the energy mix reduced CO2 emissions by as little as 23 Mt and 28 Mt, respectively. The weak impact these factors had on reducing CO2 emissions in the Polish economy was mostly due to the extremely high (though declining) consumption of coal and lignite in energy production and to the sluggish development of renewables.
- (3)
- In light of the decomposition results, population change played a very limited role in determining the amount of carbon dioxide emissions because the Polish population varied to a small extent during the study period (declined by less than 1%). As a consequence, the marginal (though having a beneficial effect on emissions reduction) changes in population size translated into favorable, though also marginal, changes in carbon dioxide emissions. On an aggregate basis, the population factor is accountable for an extremely small reduction (2 Mt) in CO2 emissions.
- (4)
- Strong decoupling states prevailed in Poland between 2004 and 2020, which suggested that it was a period dominated by processes of strong decoupling of CO2 emissions from economic growth. The processes were mostly determined by growth in the GDP per capita (which increased carbon emissions) and a reduction in energy intensity (which decreased them). Also recorded was a beneficial, though considerably smaller, impact of changes in emission intensity and energy mix. In turn, changes in population size played a marginal role. Note, however, the presence of a negative linear trend followed by the overall decoupling elasticity index. In light of the trend’s parameters, the index was increasing, mostly due to the favorable changes in energy structure and energy intensity becoming slower at the end of the study period. It means that the decoupling of CO2 emissions from economic growth becomes weaker and that the beneficial decoupling processes may come to a halt if the energy mix is not radically restructured and if less energy-intensive technologies are not developed.
- (5)
- On a yearly basis, the decoupling effort indices showed that the Polish economy usually exhibited good performance in the study period because strong or weak decoupling was recorded in most years. These decoupling states were mostly determined by the energy intensity. Compared with it, the carbon intensity and energy mix had a significantly smaller (though also positive) impact on the decoupling processes, whereas that of the population change was marginal. In addition, just like in the case of decoupling elasticity, changes in the overall decoupling effort followed a negative trend due to the decline in energy intensity and carbon intensity becoming considerably slower at the end of the study period. Other factors also contributed to it but to a much lesser degree. Generally, it means that all factors together had a diminishing impact on reducing CO2 emissions. It also suggested that carbon reduction policies and measures implemented in Poland become less and less efficient and must be amended.
The results of this analysis indicate that a reduction in CO2 emissions may coexist with economic growth. However, it order for this process to continue, political decision-makers must consistently develop and effectively implement new instruments that promote CO2 reduction. As regards Poland, the decisions in the following areas are of core importance:
- (1)
- Develop, implement, and stabilize a long-term development strategy for the energy sector. The strategy must be realistic while taking account of the EU policy for counteracting and mitigating climate change. In Poland, successive energy policies have been so far prepared by changing governments, and the proposed action lines very often failed to leverage earlier national achievements. Such an instability adversely affects the sustainable development of the Polish energy sector.
- (2)
- Step up action on reducing the intensity of CO2 emissions through the optimization of the energy mix. The optimization should first focus on the energy sector that uses the highest-emission fuels (coal) as the main source of energy. However, the use of coal should be significantly reduced (and ultimately eliminated) in the energy sector and beyond, including in households that largely rely on coal in addressing their energy needs.
- (3)
- Make renewable energies go mainstream. As regards renewables, it is particularly important to establish a stable administrative, legal, and financial framework and to ensure the smooth operation of the monitoring system for the renewable energy sub-sector. Without removing these barriers, the plan to double the share of renewables in final energy consumption by 2030 may prove to be unfeasible. Moreover, one of the major barriers to the development of renewable energies is the poor condition of transmission networks. It means the need to incur considerable investment in the construction of new renewables-ready networks.
- (4)
- Due to unstable output, the development of the renewables sector must be combined with the development of nuclear energy, which provides a stable source of power. The parallel development of all possible low-carbon and carbon-free sources of energy can result in synergies and thus may considerably contribute to meeting the goals of sustainable development. An important role in pursuing these goals can be played by the nuclear program, which will enhance national energy security while helping stabilize electricity prices and bringing environmental benefits. In addition, the development of nuclear energy could become an entrepreneurship booster and a driving force behind a new innovative scientific discipline.
- (5)
- Energy efficiency and carbon reduction should be strictly related to promoting, implementing, and raising awareness of the principles of low-emission living. The minimization of the impacts of climate change requires accelerated change in lifestyles and in the organization of societies, institutions, and infrastructures. There is broad evidence that emissions grow as a consequence of today’s lifestyle and cannot be reduced without changing consumption and behavior patterns [77,78,79]. These changes should be viewed as an integral part of the carbon reduction strategy, especially as regards energy use in households and the use of vehicles and commercial aviation.
- (6)
- The national policy for carbon reduction should take account of regional conditions. The regional energy policy and low-carbon management efforts at the regional and local government levels should be strictly linked to the relevant European and national policies. This means the need to take account of the regions’ economic, social, and energy-related particularities. It also means that the development of a powerful regional and local monitoring system must be accelerated because otherwise, the efficiency of the national energy policy will be compromised.
Funding
This research received no external funding.
Data Availability Statement
Data available in a publicly accessible repository that does not issue DOIs Publicly available datasets were analyzed in this study. This data can be found here: https://data.worldbank.org/indicator/NY.GDP.MKTP.KD, https://di.unfccc.int/time_series, https://www.eea.europa.eu/data-and-maps/data/data-viewers/greenhouse-gases-viewer, https://www.iea.org/data-and-statistics/data-product/greenhouse-gas-emissions-from-energy-highlights, https://appsso.eurostat.ec.europa.eu/nui/show.do?dataset=nrg_bal_c&lang=en.
Conflicts of Interest
The author declares no conflict of interest.
References
- Ozturk, I.; Acaravci, A. CO2 emissions, energy consumption and economic growth in Turkey. Renew. Sustain. Energy Rev. 2010, 14, 3220–3225. [Google Scholar] [CrossRef]
- Chen, J.; Wang, P.; Cui, L.; Huang, S.; Song, M. Decomposition and decoupling analysis of CO2 emissions in OECD. Appl. Energy 2018, 231, 937–950. [Google Scholar] [CrossRef]
- Jiang, Z.; Ding, Z.; Zhang, H.; Cai, W.; Liu, Y. Data-driven ecological performance evaluation for remanufacturing process. Energy Convers. Manag. 2019, 198, 111844. [Google Scholar] [CrossRef]
- Wang, X.; Yan, L. Driving factors and decoupling analysis of fossil fuel related-carbon dioxide emissions in China. Fuel 2022, 314, 122869. [Google Scholar] [CrossRef]
- Lv, J.; Gu, F.; Zhang, W.; Guo, J. Life cycle assessment and life cycle costing of sanitary ware manufacturing: A case study in China. J. Clean. Prod. 2019, 238, 117938. [Google Scholar] [CrossRef]
- COP21. Paris Agreement under the United Nations Framework on Climate Change, 2015. Available online: https://unfccc.int/sites/default/files/english_paris_agreement.pdf (accessed on 1 December 2022).
- IPPC. Intergovernmental Panel on Climate Change. Global Warming of 1.5 °C. Special Report. 2018. Available online: https://www.ipcc.ch/sr15/ (accessed on 1 December 2021).
- Lundquist, S. Explaining events of strong decoupling from CO2 and NOx emissions in the OECD 1994–2016. Sci. Total Environ. 2021, 793, 148390. [Google Scholar] [CrossRef] [PubMed]
- OECD. Sustainable Development: Indicators to Measure Decoupling of Environmental Pressure from Economic Growth. Paris, France, 2022. Available online: https://www.oecd.org/officialdocuments/publicdisplaydocumentpdf/?cote=sg/sd (accessed on 1 December 2021).
- OECD. Green Growth Indicators 2014. In OECD Green Growth Studies; OECD Publishing: Paris, France, 2014. [Google Scholar] [CrossRef]
- OECD. Green Growth Indicators 2017. In OECD Green Growth Studies; OECD Publishing: Paris, France, 2017. [Google Scholar] [CrossRef]
- Van den Bergh, J.C.J.M. Environment versus growth—A criticism of “degrowth” and a plea for “a-growth”. Ecol. Econ. 2011, 70, 881–890. [Google Scholar] [CrossRef]
- Kallis, G. In Defence of Degrowth. Ecol. Econ. 2011, 70, 873–880. [Google Scholar] [CrossRef]
- Van den Bergh, J.C.J.M.; Kallis, G. Growth, A-Growth or Degrowth to Stay within Planetary Boundaries? J. Econ. Issues 2012, 46, 909–920. [Google Scholar] [CrossRef]
- Schneider, F.; Kallis, G.; Martinez-Alier, J. Crisis or Opportunity? Economic Degrowth for Social Equity and Ecological Sustainability. J. Clean. Prod. 2010, 18, 511–518. [Google Scholar] [CrossRef]
- World Bank Data. World Bank National Accounts Data, and OECD National Accounts Data Files. 2023. Available online: https://data.worldbank.org/indicator/NY.GDP.MKTP.KD (accessed on 1 December 2021).
- UNFCCC. United Nations Framework Convention on Climate Change (2023) Greenhouse Gas Inventory Data 2023. Available online: https://di.unfccc.int/time_series (accessed on 1 December 2021).
- EEA Greenhouse Gases. 2023. Available online: https://www.eea.europa.eu/data-and-maps/data/data-viewers/greenhouse-gases-viewer (accessed on 1 December 2021).
- Wang, Q.; Su, M. Drivers of decoupling economic growth from carbon emission—An empirical analysis of 192 countries using decoupling model and decomposition method. Environ. Impact Assess. 2020, 81, 106356. [Google Scholar] [CrossRef]
- Li, R.; Jiang, R. Moving low-carbon construction industry in Jiangsu Province: Evidence from decomposition and decoupling models. Sustainability 2017, 9, 1013. [Google Scholar] [CrossRef]
- Pao, H.T.; Chen, C.C. Decoupling strategies: CO2 emissions, energy resources, and economic growth in the Group of Twenty. J. Clean. Prod. 2019, 206, 907–919. [Google Scholar] [CrossRef]
- Wang, Q.; Zhao, M.; Li, R. Decoupling sectoral economic output from carbon emissions on city level: A comparative study of Beijing and Shanghai, China. J. Clean. Prod. 2019, 209, 126–133. [Google Scholar] [CrossRef]
- Wu, Y.; Zhu, Q.; Zhu, B. Decoupling analysis of world economic growth and CO2 emissions: A study comparing developed and developing countries. J. Clean. Prod. 2018, 190, 94–103. [Google Scholar] [CrossRef]
- Xie, P.; Gao, S.; Sun, F. An analysis of the decoupling relationship between CO2 emission in power industry and GDP in China based on LMDI method. J. Clean. Prod. 2019, 211, 598–606. [Google Scholar] [CrossRef]
- Wang, Q.; Wang, S. Decoupling economic growth from carbon emissions growth in the United States: The role of research and development. J. Clean. Prod. 2019, 234, 702713. [Google Scholar] [CrossRef]
- Dai, S.; Zhang, M.; Huang, W. Decomposing the decoupling of CO2 emission from economic growth in BRICS countries. Nat. Hazards 2016, 84, 1055–1073. [Google Scholar] [CrossRef]
- Moutinho, V.; Santiago, R.; Fuinhas, J.A.; Marques, A.C. The driving forces of energy-related carbon dioxide emissions from South Latin American countries and their impacts on these countries’ process of decoupling. Environ. Sci. Pollut. Res. 2020, 27, 20685–20698. [Google Scholar] [CrossRef]
- Zhang, J.; Fan, Z.; Chen, Y.; Gao, J.; Liu, W. Decomposition and decoupling analysis of carbon dioxide emissions from economic growth in the context of China and the ASEAN countries. Sci. Total Environ. 2020, 714, 136649. [Google Scholar] [CrossRef]
- Ozturk, I.; Majeed, M.T.; Khan, S. Decoupling and decomposition analysis of environmental impact from economic growth: A comparative analysis of Pakistan, India, and China. Environ. Ecol. Stat. 2021, 28, 793–820. [Google Scholar] [CrossRef]
- Li, R.; Jiang, R. Investigating effect of R&D investment on decoupling environmental pressure from economic growth in the global top six carbon dioxide emitters. Sci. Total Environ. 2020, 740, 140053. [Google Scholar] [CrossRef] [PubMed]
- Papież, M.; Śmiech, S.; Frodyma, K. The role of energy policy on the decoupling processes in the European Union countries. J. Clean. Prod. 2021, 318, 128484. [Google Scholar] [CrossRef]
- Madaleno, M.; Moutinho, V. Effects decomposition: Separation of carbon emissions decoupling and decoupling effort in aggregated EU15. Environ. Dev. Sustain. 2018, 20, 181–198. [Google Scholar] [CrossRef]
- Karmellos, M.; Kosmadakis, V.; Dimas, P.; Tsakanikas, A.; Fylaktos, N.; Taliotis, C.; Zachariadis, T. A decomposition and decoupling analysis of carbon dioxide emissions from electricity generation: Evidence from the EU-27 and the UK. Energy 2021, 231, 120861. [Google Scholar] [CrossRef]
- Diakoulaki, D.; Mandaraka, M. Decomposition analysis for assessing the progress in decoupling industrial growth from CO2 emissions in the EU manufacturing sector. Energy Econ. 2007, 29, 636–664. [Google Scholar] [CrossRef]
- Wang, Q.; Zhao, M.; Li, R.; Su, M. Decomposition and decoupling analysis of carbon emissions from economic growth: A comparative study of China and the United States. J. Clean. Prod. 2018, 197, 178–184. [Google Scholar] [CrossRef]
- Jiang, X.T.; Li, R. Decoupling and Decomposition Analysis of Carbon Emissions from Electric Output in the United States. Sustainability 2017, 9, 886. [Google Scholar] [CrossRef]
- Freitas, L.C.D.; Kaneko, S.J.E.E. Decomposing the Decoupling of CO2 Emissions and Economic Growth in Brazil. Ecol. Econ. 2011, 70, 1459–1469. [Google Scholar] [CrossRef]
- Wang, W.; Li, M.; Zhang, M. Study on the changes of the decoupling indicator between energy related CO2 emission and GDP in China. Energy 2017, 128, 11–18. [Google Scholar] [CrossRef]
- Zhang, Y.J.; Da, J.B. The decomposition of energy-related carbon emission and its decoupling with economic growth in China. Renew. Sustain. Energy Rev. 2015, 41, 1255–1266. [Google Scholar] [CrossRef]
- Xu, S.C.; Zhang, W.W.; He, Z.X.; Han, H.; Long, R.Y.; Chen, H. Decomposition analysis of the decoupling indicator of carbon emissions due to fossil energy consumption from economic growth in China. Energy Effic. 2017, 10, 1365–1380. [Google Scholar] [CrossRef]
- Engo, J. Decomposing the decoupling of CO2 emissions from economic growth in Cameroon. Environ. Sci. Pollut. Res. 2018, 25, 35451–35463. [Google Scholar] [CrossRef] [PubMed]
- Roinioti, A.; Koroneos, C. The decomposition of CO2 emissions from energy use in Greece before and during the economic crisis and their decoupling from economic growth. Renew. Sustain. Energy Rev. 2017, 76, 448–459. [Google Scholar] [CrossRef]
- Yasmeen, H.; Tan, Q. Assessing Pakistan’s energy use, environmental degradation, and economic progress based on Tapio decoupling model. Environ. Sci. Pollut. Res. 2021, 28, 68364–68378. [Google Scholar] [CrossRef]
- Tapio, P. Towards a theory of decoupling: Degrees of decoupling in the EU and the case of road traffic in Finland between 1970 and 2001. Transp. Policy 2005, 12, 137–151. [Google Scholar] [CrossRef]
- Engo, J. Decoupling analysis of CO2 emissions from transport sector in Cameroon. Sustain. Cities Soc. 2019, 51, 101732. [Google Scholar] [CrossRef]
- Zhao, Y.; Kuang, Y.; Huang, N. Decomposition Analysis in Decoupling Transport Output from Carbon Emissions in Guangdong Province, China. Energies 2016, 9, 295. [Google Scholar] [CrossRef]
- Li, Y.; Du, Q.; Lu, X.; Wu, J.; Han, X. Relationship between the development and CO2 emissions of transport sector in China. Transp. Res. Part D Transp. Environ. 2019, 74, 1–14. [Google Scholar] [CrossRef]
- Han, H.; Zhong, Z.; Guo, Y.; Xi, F.; Liu, S. Coupling and decoupling effects of agricultural carbon emissions in China and their driving factors. Environ. Sci. Pollut. Res. 2018, 25, 25280–25293. [Google Scholar] [CrossRef]
- Hossain, M.A.; Chen, S. Decoupling of energy-related CO2 emissions from economic growth: A case study of Bangladesh. Environ. Sci. Pollut. Res. 2020, 27, 20844–20860. [Google Scholar] [CrossRef]
- Huang, Q.; Zhang, Y. Decoupling and Decomposition Analysis of Agricultural Carbon Emissions: Evidence from Heilongjiang Province, China. Int. J. Environ. Res. Public Health 2022, 19, 198. [Google Scholar] [CrossRef] [PubMed]
- Liu, Y.; Feng, C. What drives the decoupling between economic growth and energy-related CO2 emissions in China’s agricultural sector? Environ. Sci. Pollut. Res. 2021, 28, 44165–44182. [Google Scholar] [CrossRef]
- Luo, Y.; Long, X.; Wu, C.; Zhang, J. Decoupling CO2 emissions from economic growth in agricultural sector across 30 Chinese provinces from 1997 to 2014. J. Clean. Prod. 2017, 159, 220–228. [Google Scholar] [CrossRef]
- Huang, C.; Zhou, Y.J.; Cheng, J.H. Research on Energy-Related CO2 Emissions Characteristics, Decoupling Relationship and LMDI Factor Decomposition in Qinghai. Front. Energy Res. 2021, 9, 700385. [Google Scholar] [CrossRef]
- Qin, J.; Gao, L.; Tu, W.; He, J.; Tang, J.; Ma, S.; Zhao, X.; Zhu, X.; Brindha, K.; Tao, H. Decomposition and Decoupling Analysis of Carbon Emissions in Xinjiang Energy Base, China. Energies 2022, 15, 5526. [Google Scholar] [CrossRef]
- Shi, B.; Xiang, W.; Bai, X.; Wanga, Y.; Geng, G.; Zheng, J. District level decoupling analysis of energy-related carbon dioxide emissions from economic growth in Beijing, China. Energy Rep. 2022, 8, 2045–2051. [Google Scholar] [CrossRef]
- You, Z.; Zhao, T.; Song, C.; Wang, J. Analyzing China’s coal-related carbon emissions from economic growth perspective: Through decoupling and decomposition model. Environ. Sci. Pollut. Res. 2021, 28, 3703–3718. [Google Scholar] [CrossRef] [PubMed]
- Wang, W.; Liu, R.; Zhang, M.; Li, H. Decomposing the decoupling of energy-related CO2 emissions and economic growth in Jiangsu Province. Energy Sustain. Dev. 2013, 17, 62–71. [Google Scholar] [CrossRef]
- Li, W.; Sun, S.; Li, H. Decomposing the decoupling relationship between energy-related CO2 emissions and economic growth in China. Nat. Hazards 2015, 79, 977–997. [Google Scholar] [CrossRef]
- Luo, G.; Baležentis, T.; Zeng, S.; Pan, J. Creating a decarbonized economy: Decoupling effects and driving factors of CO2 emission of 28 industries in China. Energy Environ. 2022, 1–19. [Google Scholar] [CrossRef]
- Wang, X.; Gao, X.; Shao, Q.; Wei, Y. Factor decomposition and decoupling analysis of air pollutant emissions in China’s iron and steel industry. Environ. Sci. Pollut. Res. 2020, 27, 15267–15277. [Google Scholar] [CrossRef]
- Wan, L.; Wang, Z.L.; Ng, J.C.Y. Measurement research on the decoupling effect of industries’ carbon emissions based on the equipment manufacturing industry in China. Energies 2016, 9, 921. [Google Scholar] [CrossRef]
- Wu, Y.; Chau, K.W.; Lu, W.; Shen, L.; Shuai, C.; Chen, J. Decoupling relationship between economic output and carbon emission in the Chinese construction industry. Environ. Impact Assess. Rev. 2018, 71, 60–69. [Google Scholar] [CrossRef]
- Wang, J.; Li, Z.; Wu, T.; Wu, S.; Yin, T. The decoupling analysis of CO2 emissions from power generation in Chinese provincial power sector. Energy 2022, 255, 124488. [Google Scholar] [CrossRef]
- Yang, L.; Yang, Y.; Zhang, X.; Tang, K. Whether China’s industrial sectors make efforts to reduce CO2 emissions from production? a decomposed decoupling analysis. Energy 2018, 160, 796–809. [Google Scholar] [CrossRef]
- Kaya, Y. Impact of Carbon Dioxide Emission Control on GNP Growth: Interpretation of Proposed Scenarios; Paper Presented to the IPCC Energy and Industry Subgroup; Response Strategies Working Group: Paris, France, 1990. [Google Scholar]
- Yamaji, K.; Matsuhashi, R.; Nagata, Y.; Kaya, Y. An Integrated System for CO2/Energy/GNP Analysis: Case Studies on Economic Measures for CO2 Reduction in Japan; Paper Presented at the Workshop on CO2 Reduction and Removal: Measures for the Next Century, 19–21 March; International Institute for Applied Systems Analysis: Laxenburg, Austria, 1991. [Google Scholar]
- Baležentis, A.; Baležentis, T.; Štreimikiene, D. The energy intensity in Lithuania during 1995–2009: A LMDI approach. Energy Policy 2011, 39, 7322–7334. [Google Scholar] [CrossRef]
- Ang, B.W.; Zhang, F.Q.; Choi, K.H. Factorizing changes in energy and environmental indicators through decomposition. Energy 1998, 23, 489–495. [Google Scholar] [CrossRef]
- Hoekstra, R.; van den Bergh, J.J.C.J.M. Comparing structural and index decomposition analysis. Energy Econ. 2003, 25, 39–64. [Google Scholar] [CrossRef]
- Ang, B.W. Decomposition analysis for policymaking in energy: Which is the preferred method? Energy Policy 2004, 32, 1131–1139. [Google Scholar] [CrossRef]
- Karakaya, E.; Bostan, A.; Özçağ, M. Decomposition and decoupling analysis of energy related carbon emissions in Turkey. Environ. Sci. Pollut. Res. 2019, 26, 32080–32091. [Google Scholar] [CrossRef]
- Greenhouse Gas Emissions from Energy, IEA, 2022—Highlights. Available online: https://www.iea.org/data-and-statistics/data-product/greenhouse-gas-emissions-from-energy-highlights (accessed on 1 December 2021).
- Complete Energy Balances. Eurostat, 2022. Available online: https://appsso.eurostat.ec.europa.eu/nui/show.do?dataset=nrg_bal_c&lang=en (accessed on 1 December 2021).
- Eurostat. Population on 1 January by Age and Sex [Demo_Pjan]. 2022. Available online: https://appsso.eurostat.ec.europa.eu/nui/show.do?dataset=demo_pjan&lang=en (accessed on 1 December 2021).
- Proposal for a Directive of the European Parliament and of the Council amending Directive (EU) 2018/2001 of the European Parliament and of the Council, Regulation (EU) 2018/1999 of the European Parliament and of the Council and Directive 98/70/EC of the European Parliament and of the Council as Regards the Promotion of Energy from Renewable Sources, and Repealing Council Directive (EU) 2015/652. European Commission Brussels, 14.7.2021 COM(2021) 557 Final. Available online: https://eur-lex.europa.eu/legal-content/EN/ALL/?uri=CELEX%3A52021PC0557 (accessed on 1 December 2021).
- Ministry of Climate and Environment. National Energy and Climate Plan for the Years 2021–2030; Ministry of Climate and Environment: Warsaw, Poland, 2019. Available online: https://www.gov.pl/web/klimat/national-energy-and-climate-plan-for-the-years-2021-2030 (accessed on 1 December 2021).
- Davis, S.J.; Caldeira, K. Consumption-based accounting of CO2 emissions. Proc. Natl. Acad. Sci. USA 2010, 107, 5687–5692. [Google Scholar] [CrossRef] [PubMed]
- Liobikienė, G.; Dagiliūtė, R. The relationship between economic and carbon footprint changes in EU: The achievements of the EU sustainable consumption and production policy implementation. Environ. Sci. Policy 2016, 61, 204–211. [Google Scholar] [CrossRef]
- Oswald, Y.; Owen, A.; Steinberger, J.K. Large inequality in international and intranational energy footprints between income groups and across consumption categories. Nat. Energy 2020, 5, 231–239. [Google Scholar] [CrossRef]


Disclaimer/Publisher’s Note: The statements, opinions and data contained in all publications are solely those of the individual author(s) and contributor(s) and not of MDPI and/or the editor(s). MDPI and/or the editor(s) disclaim responsibility for any injury to people or property resulting from any ideas, methods, instructions or products referred to in the content. |
© 2023 by the author. Licensee MDPI, Basel, Switzerland. This article is an open access article distributed under the terms and conditions of the Creative Commons Attribution (CC BY) license (https://creativecommons.org/licenses/by/4.0/).