Article

Analysis of a Phase Change Material-Based Condenser of a Low-Scale Refrigeration System

1
Dipartimento di Ingegneria Industriale (DII), Università di Napoli Federico II, 80125 Napoli, NA, Italy
2
ENEA—Italian National Agency for New Technologies, Energy and Sustainable Economic Development, Portici Research Center, 80055 Portici, NA, Italy
*
Author to whom correspondence should be addressed.
Energies 2023, 16(9), 3798; https://doi.org/10.3390/en16093798
Submission received: 6 March 2023 / Revised: 20 April 2023 / Accepted: 21 April 2023 / Published: 28 April 2023
(This article belongs to the Section G2: Phase Change Materials for Energy Storage)

Abstract

:
This study concerns the numerical simulation and the experimental implementation of a low-scale Phase Change Material-based (PCM-based) condenser, to be included in a PCM-based portable cooling systems. In this category of cooling systems, the PCM can be integrated either in the condenser or in the evaporator. In the present study, the PCM is integrated in the condenser of the vapor compression cycle to absorb the heat power released from the refrigerant fluid (R134a) during condensation, thus eliminating the need to transfer heat to the external environment. The main objective of the present study is to realize and validate a numerical model capable of simulating both the refrigerant fluid and the PCM thermofluid dynamics. For this purpose, a commercial solver was used for the implementation of the developed numerical model, and experimental tests were performed to validate the numerical simulations results. The paper reports the details and test results of both the numerical model and the experimental apparatus. The simulation results indicate a good accordance between the numerical and experimental data.

1. Introduction

HVAC systems are the main solution to guarantee comfortable conditions in indoor environments. These systems are highly costly from an energy point of view, since they demand half of the energy required in the EU and US for buildings, that is, 20–40% of the primary energy [1]. In contrast to traditional HVAC systems, personal cooling systems allow providing air conditioning for only a small space around the user, resulting in savings in terms of the energy, costs and environmental impact [1]. The thermostat temperature for HVAC systems can also be increased if a combination of the aforementioned systems is used [2,3]. Furthermore, these systems are helpful for increasing comfort and productivity [4] since they permit satisfying people’s customized needs.
To improve their performances in terms of energy saving, space occupation, etc., latent thermal energy storage systems would be helpful for this task [5]. Among latent systems, phase change materials are widely known since they are essentially able to melt and solidify around a designed temperature that depends on the final application [6]. Within cooling systems, PCMs can be coupled with heat exchangers to be effectively used as the secondary fluid [7]. Medrano et al. [8] used phase change materials within different heat exchangers, such as double-pipe, finned, and plate heat exchangers. The other working fluid was water, and the authors concluded that the highest heat transfer coefficients and heat rate were achieved with a PCM/graphite double-pipe heat exchanger and a finned heat exchanger, respectively. Shell and tube heat exchangers have been analyzed for free cooling applications, where the air is the primary working fluid, and PCM is placed within the shell [9]. Similarly, shell and tube heat exchangers have also been equipped with PCMs in cold storage applications that require low-melting-temperature PCMs [10,11], as well as in studies regarding relatively high-temperature applications [12,13]. Other heat exchangers that have been analyzed are finned tube heat exchangers with water as the working fluid and R35 as the phase change material. In this case, using continuous spiry tubes is helpful to increase the heat transfer area [14]. Lv et al. [15] analyzed four groups of tubes embedded with various fins (longitudinal, H-shaped, spiral, and without fins) for a pilot-scale LHS system loaded with 5674.7 kg of PCM. Plate-fin heat exchangers have been considered, too, with air as the working fluid and PCM placed within the plates [16]. In this contribution, the authors presented both experimental and numerical studies, where the proposed device allowed managing peak loads. Another application that has been proposed is the household refrigerator, where the evaporator is coupled with U-type tubes equipped with PCM with a melting temperature of 4 °C [17]. This solution reduced the power consumption by a factor of 12%. In another application [18], the authors analyzed a horizontal channel, crossed by a fluid and whose walls contained a porous medium saturated with phase change material (PCM), in order to assess the effects of the matrix porosity and PCM type on the rate of charged and released thermal energy.
Several studies have been conducted to include PCM-based heat exchangers within vapor compression cycles, as performed in [17] for a household refrigerator. In particular, a PCM heat exchanger can replace the evaporator, or it can be included in the cycle before or after the condenser, resulting in small portions of heat being removed in the form of sensible heat or a small amount of latent heat [19]. Shape-stabilized PCMs were used within the condenser of a household refrigerator in [20]. Simulations showed that a 19% COP increase could be achieved due to the latent heat storage performance of these PCMs. A PCM heat exchanger located after the condenser and before the expansion valve was analyzed by Bakhshipour et al. [21] within a domestic refrigerator. By using N-Octadecane as the PCM, the authors showed that the COP could be increased 9.58%. An improvement in terms of the coefficient of performance by employing a PCM subcooler within freezers was found by Yan et al. [22], who achieved an improvement of 3.3–10.5% when compared to a conventional vapor–compression cycle. In order to reduce the electricity consumption peak, Mosleh et al. [23] simulated a vapor compression system that integrated a PCM-based heat exchanger to take advantage of the exterior dynamic conditions. With this solution, the authors were able to move the electricity peak, even if there was a slight reduction in terms of the coefficients of performance. Riffat et al. [24] proposed a sustainable and affordable refrigerator unit for developing countries with no access to electricity or weak grid settings. A miniature refrigerator and a second fluid loop were used by connecting a finned-tube heat exchanger in the fridge cabinet, with PCM packs included within the fridge for cold storage. In their study, the authors concluded that the transient power consumption could be reduced up to 26%. Sun et al. [25] analyzed a single-tube, double-finned row of a tube evaporator with phase change material in a refrigeration unit for food. Their results indicated that the charged PCM ensured the stable operation of the cold storage for a period after shutdown, and that economic savings could be achieved by taking advantage of peak and valley electricity prices. Abdolmaleki and Berardi [26] analyzed the use of cooling systems with single- and multiphase change materials, considering both air conditioning systems and refrigerators. Their results showed that, compared to a single PCM configuration, multi-PCM configurations have the potential to improve heat transfer rates, reduce the gap between peak and off-peak loads of electricity demand, and shift electricity consumption from on-peak to off-peak periods.
Among vapor compression cycles-based devices, personal cooling devices have been proposed recently in conjunction with phase change materials. The Roving Comforter (RoCo), which represents an innovative personal cooling system with drop-in alternatives to R134a as the working fluid, was proposed by Dhumane et al. [27]. In this device, the condenser heat exchanger was equipped with a PCM, as well as a microchannel heat exchanger as the evaporator. The authors obtained an improvement of 8% in terms of COP when R32 was employed [28]. Qiao et al. [18] proposed a personal cooling system by coupling a PCM with a graphite matrix, with everything placed within the condenser of the cycle. Their device reached a cooling capacity of 160 W for 4.5 h. As evident from the literature survey, the integration of PCMs in vapor compression cycles—especially for personal cooling purposes—can be useful to improve cooling performances because of the latent heat storage capabilities. In this context, this paper describes our experimental and numerical research activities regarding a low-power cooling system that includes a PCM-based condenser, realized to develop and validate a model for the simulation of PCM-based personal cooling systems or localized cooling systems (for example, a workstation inside an office). The system is based on a vapor compression system condenser equipped with a phase change material to absorb the heat released from the refrigerant fluid during condensation, allowing for the design of a portable system with a relatively high storage capacity, without the need to exchange heat with the external environment. The development of an appropriate and robust predictive numerical model is fundamental, since it allows designing, analysis, and optimization, without the need to carry out multiple onerous experimental tests. Of course, the predictive model must be validated with appropriate experiments. In the following, the details of the models adopted for the numerical simulation are first presented. Successively, the experimental apparatus is described, and data from two different tests are reported. In the final part, the results of the numerical simulation of a PCM-based condenser unit are shown and compared with experimental ones.

2. Numerical Modeling

This section presents the predictive models implemented for the PCM-based condenser. Figure 1 shows one of the three units composing the PCM-based condenser, each consisting of a plexiglass box containing the PCM, thermally insulated using polystyrene rigid panels (not shown in the picture), whereas the refrigerant flows through the copper serpentine tube immersed in the PCM. Further details will be provided in the following sections. Simulations of both the PCM and the refrigerant used in this study were realized with the software COMSOL Multiphysics 5.6.

2.1. Numerical Modeling of the PCM

The enthalpy–porosity method was used to predict the thermofluid dynamic behavior. The following assumptions were made:
(i)
Homogeneous and isotropic materials;
(ii)
Phase change occurs within a fixed temperature range;
(iii)
The PCM initial temperature is uniform;
(iv)
Expansion and compression during a phase change are negligible;
(v)
At the liquid state, the PCM is a Newtonian fluid, and the flow is laminar;
(vi)
Incompressible flow (density is assumed constant and equal to the arithmetic mean of the liquid density and solid density).
The thermophysical properties of the PCM are reported in Table 1.
The volume liquid fraction, called θ T , is expressed by Equation (1) to underline its dependence from the temperature.
θ T = 1 , T T m + T 2 T ( T m T 2 ) T , T m T 2 > T T m + T 2 0 , T < T m T 2

2.1.1. Mass Conservation and Momentum Conservation Equations

The mass conservation equation, under the assumption of incompressible flow, is represented by Equation (2):
· v = 0
The momentum conservation equation is represented by Equation (3):
ρ p c m v t + v · v = p + μ 2 v + F b
where F b represents the buoyancy force, according to the Bousinnesq approximation:
F b = ρ p c m g β T T m · θ T
β is the coefficient of thermal expansion, in this case, assumed to be equal to 0.0006 K−1 [12]. The liquid viscosity, μ p c m , L , is assumed to be equal to 4.4 mPa·s [30].
In Equation (3), the Carman–Kozeny source term is included to account for the mushy zone. This source term is described by Equation (5).
F D = S T · v
This term dominates all the others in the momentum equation while the PCM is solid, under the condition that v = 0 . S(T) is the following Carman–Kozeny porosity function:
S T = A m u s h ( 1 θ ( T ) ) 2 θ ( T ) 3 + δ
where δ is fixed to 0.001 to avoid a null denominator. A m u s h is an arbitrary constant, which influences the effective viscosity within the mushy zone. Usually, its value varies in the range between 103 and 107. Thus, Equation (3) becomes:
ρ p c m v t + v · v = p + μ 2 v + F b + F D

2.1.2. Energy Conservation Equation

The energy conservation equation is given by Equation (8).
ρ p c m C p , p c m , a T t + ρ p c m C p , p c m v · T · k p c m T = 0
where both k p c m and ρ p c m are assumed to be constant here. Particular attention must be paid to the term C p , p c m , a , which represents the apparent heat capacity:
C p , p c m , a = C p , p c m + L H θ ( T ) T
In order to account for the latent heat via the apparent heat capacity, a fictitious heat source is used, as shown in Equation (10).
ρ p c m L H θ ( T ) T T t + ρ p c m C p , p c m T t + ρ p c m C p , p c m v · T · k p c m T = 0

2.2. Numerical Modeling of the Refrigerant Fluid

To predict the refrigerant flow behavior, the mixture model, coupled to the Lee model, was used. The mixture model assumes that the dispersed phase is in local equilibrium with the continuous phase, i.e., the dispersed phase cannot accelerate with respect to the continuous phase. With this model, a set of Navier–Stokes equations is solved to determine the mixture momentum. The pressure distribution is calculated using a mixture-averaged continuity equation, meaning that averaged parameters of the mixture are used. The velocity of the dispersed phase is described by means of a slip model, and the dispersed phase volume fraction is obtained by solving the volume fraction transport equation. Under the assumptions of unsteady and laminar flow, the governing equations are introduced in the following subsections.

2.2.1. Mass Conservation Equation

The continuity equation is given by Equation (11).
j = m ˙ d c 1 ρ c 1 ρ d
where j (m/s) represents the mixture velocity field. The subscripts d and c refer to dispersed (vapor) and continuous (liquid) phases, respectively. m ˙ d c (kg/s/m3) represents the mass transfer from the dispersed to the continuous phase. This term must be defined by employing another model. In this case, the Lee model was used [31], since it pairs well with the mixture model and condensation. The Lee model can be described by the following set of equations.
m ˙ d c = m ˙ v l m ˙ l v m ˙ v l = r · φ v ρ v · T s a t T v T s a t c o n d e n s a t i o n , T < T s a t m ˙ l v = r · φ l ρ l · T l T s a t T s a t e v a p o r a t i o n , T > T s a t
where the subscripts v and l indicate the vapor and liquid phase, respectively; φ is the volume fraction; and T s a t (K) is the saturation temperature. The coefficient r (s−1), which can be interpreted as the inverse of a relaxation time, is usually set equal to 0.1 s−1 to maintain the interface temperature close to the saturation temperature. However, this is a coefficient that needs to be finely tuned. In this case, a first value of r = 5 was used. Further, in this case, a homogeneous model was considered, thus Tl = Tv = T.

2.2.2. Momentum Conservation Equation

The momentum conservation equation is:
ρ j t + ρ j · j + ( ρ d ρ c ) ( j s l i p · ) j = · [ ρ I + K ] · K m + ρ g
where j s l i p (m/s) represents the mixture slip velocity, in this case equal to zero, since the assumption of homogeneous flux is made, meaning that there is no difference between the velocities of dispersed and continuous phases. K represents the stress tensor, while Km is assumed to be equal to zero as it is referred to the slip velocity. The equation can then be rewritten as follows:
ρ j t + ρ j · j = · ρ I + K + ρ g
ρ is the mixture density, calculated as shown in Equation (15).
ρ = ρ d φ d + ( 1 φ d ) ρ c
To define the stress tensor K, viscosity is also needed. In this case, the mixture viscosity is used, and it is calculated in an equivalent way with respect to Equation (15).

2.2.3. Dispersed Phase Transport Equation

The transport equation of the dispersed phase is given by:
φ d t + · ( j φ ) = m ˙ c d ρ d

2.2.4. Energy Conservation Equation

The energy conservation equation is given by:
ρ C p T t + ρ C p u T + · q = k T + m ˙ d c Δ H l
where ρ , C p , u , and k are all mixture averaged parameters, and they represent the density (kg/m3), specific heat (J/kg/K), velocity (m/s), and thermal conductivity (W/m/K) of the mixture, respectively. The last term is a source term, which simulates the latent heat of condensation, wherein Δ H l (J/kg) is the latent heat of condensation.

2.3. Boundary Conditions

As concerns the PCM, the boundary conditions prescribe a null velocity (no slip) at the box and serpentine tube walls. Further, the box walls are assumed to be adiabatic.
Concerning the refrigerant, a null velocity is assumed on the tube walls, while at the inlet, the following conditions are assumed for the incoming mass flux:
j = J 0 n φ d = φ d , 0
where J0 (m/s) is the inlet velocity and φd,0 the inlet dispersed volume fraction. The energy equation is finally closed by means of the following set of equations:
J 0 n = ρ H u · n H = T u s t r T C p d T + p u s t r p A 1 ρ 1 α p T d p
where T (K) is the inlet temperature, and pA (Pa) is the inlet pressure. Tustr (K) and pustr (Pa) are the assumed upstream conditions. The term αp (K−1) is the thermal expansion coefficient. At the outlet, a zero-gauge pressure with no back flow, together with outflow conditions, are imposed.

3. Experimental Setup

This section describes the experimental setup that was realized for the experimental validation of the numerical simulations results. Indeed, with the experimental results, it was possible to tune the semi-empirical parameters that characterize the simulation models.
The components of the experimental system were selected and sized on the basis of the theoretical thermodynamic cycle of the refrigerant fluid R134a shown in the temperature–entropy diagram of Figure 2. The goal of the experimental phase was, therefore, to get as close as possible to this cycle, with a useful refrigerating power of 100 W at the evaporator.
Table 2 shows the values of temperature, pressure, vapor quality, specific volume, specific enthalpy, and specific entropy in the various points of the thermodynamic cycle, calculated in order to obtain the above useful cooling power at the evaporator and a temperature of the refrigerant of about 50 °C at the condenser, and considering a compressor efficiency equal to 0.75. The resulting COP is equal to 4.5, the mass flow rate of the refrigerant fluid is 7.41·10−4 kg/s, and the heat rate to be dissipated to the condenser is 122 W. In the present case, to have a transportable refrigeration system, which can be used in the internal environments of buildings without the need for an external condensing unit, the heat to be dissipated through the condenser is transferred to the PCM, which accumulates it in an almost isothermal way.
By assuming five hours of autonomy for the personal cooling system, the total energy that the PCM should be able to store is equal to 2196 kJ, as reported in Equation (20).
E s t o r a g e = 122   W · 5   h · 3600 s h = 2196   k J
where 122 W is the heat rate that the condenser must dissipate. In this case, by assuming the exploitation of the full potential energy of the thermal storage of the PCM, and to have a heat exchanger with a 122 W heat rate between the refrigerant fluid and the PCM, the necessary quantity of PCM to store this thermal energy is approximately equal to 9.15 kg. This value was used to size the PCM-based condenser for the experimental system.

3.1. System Description

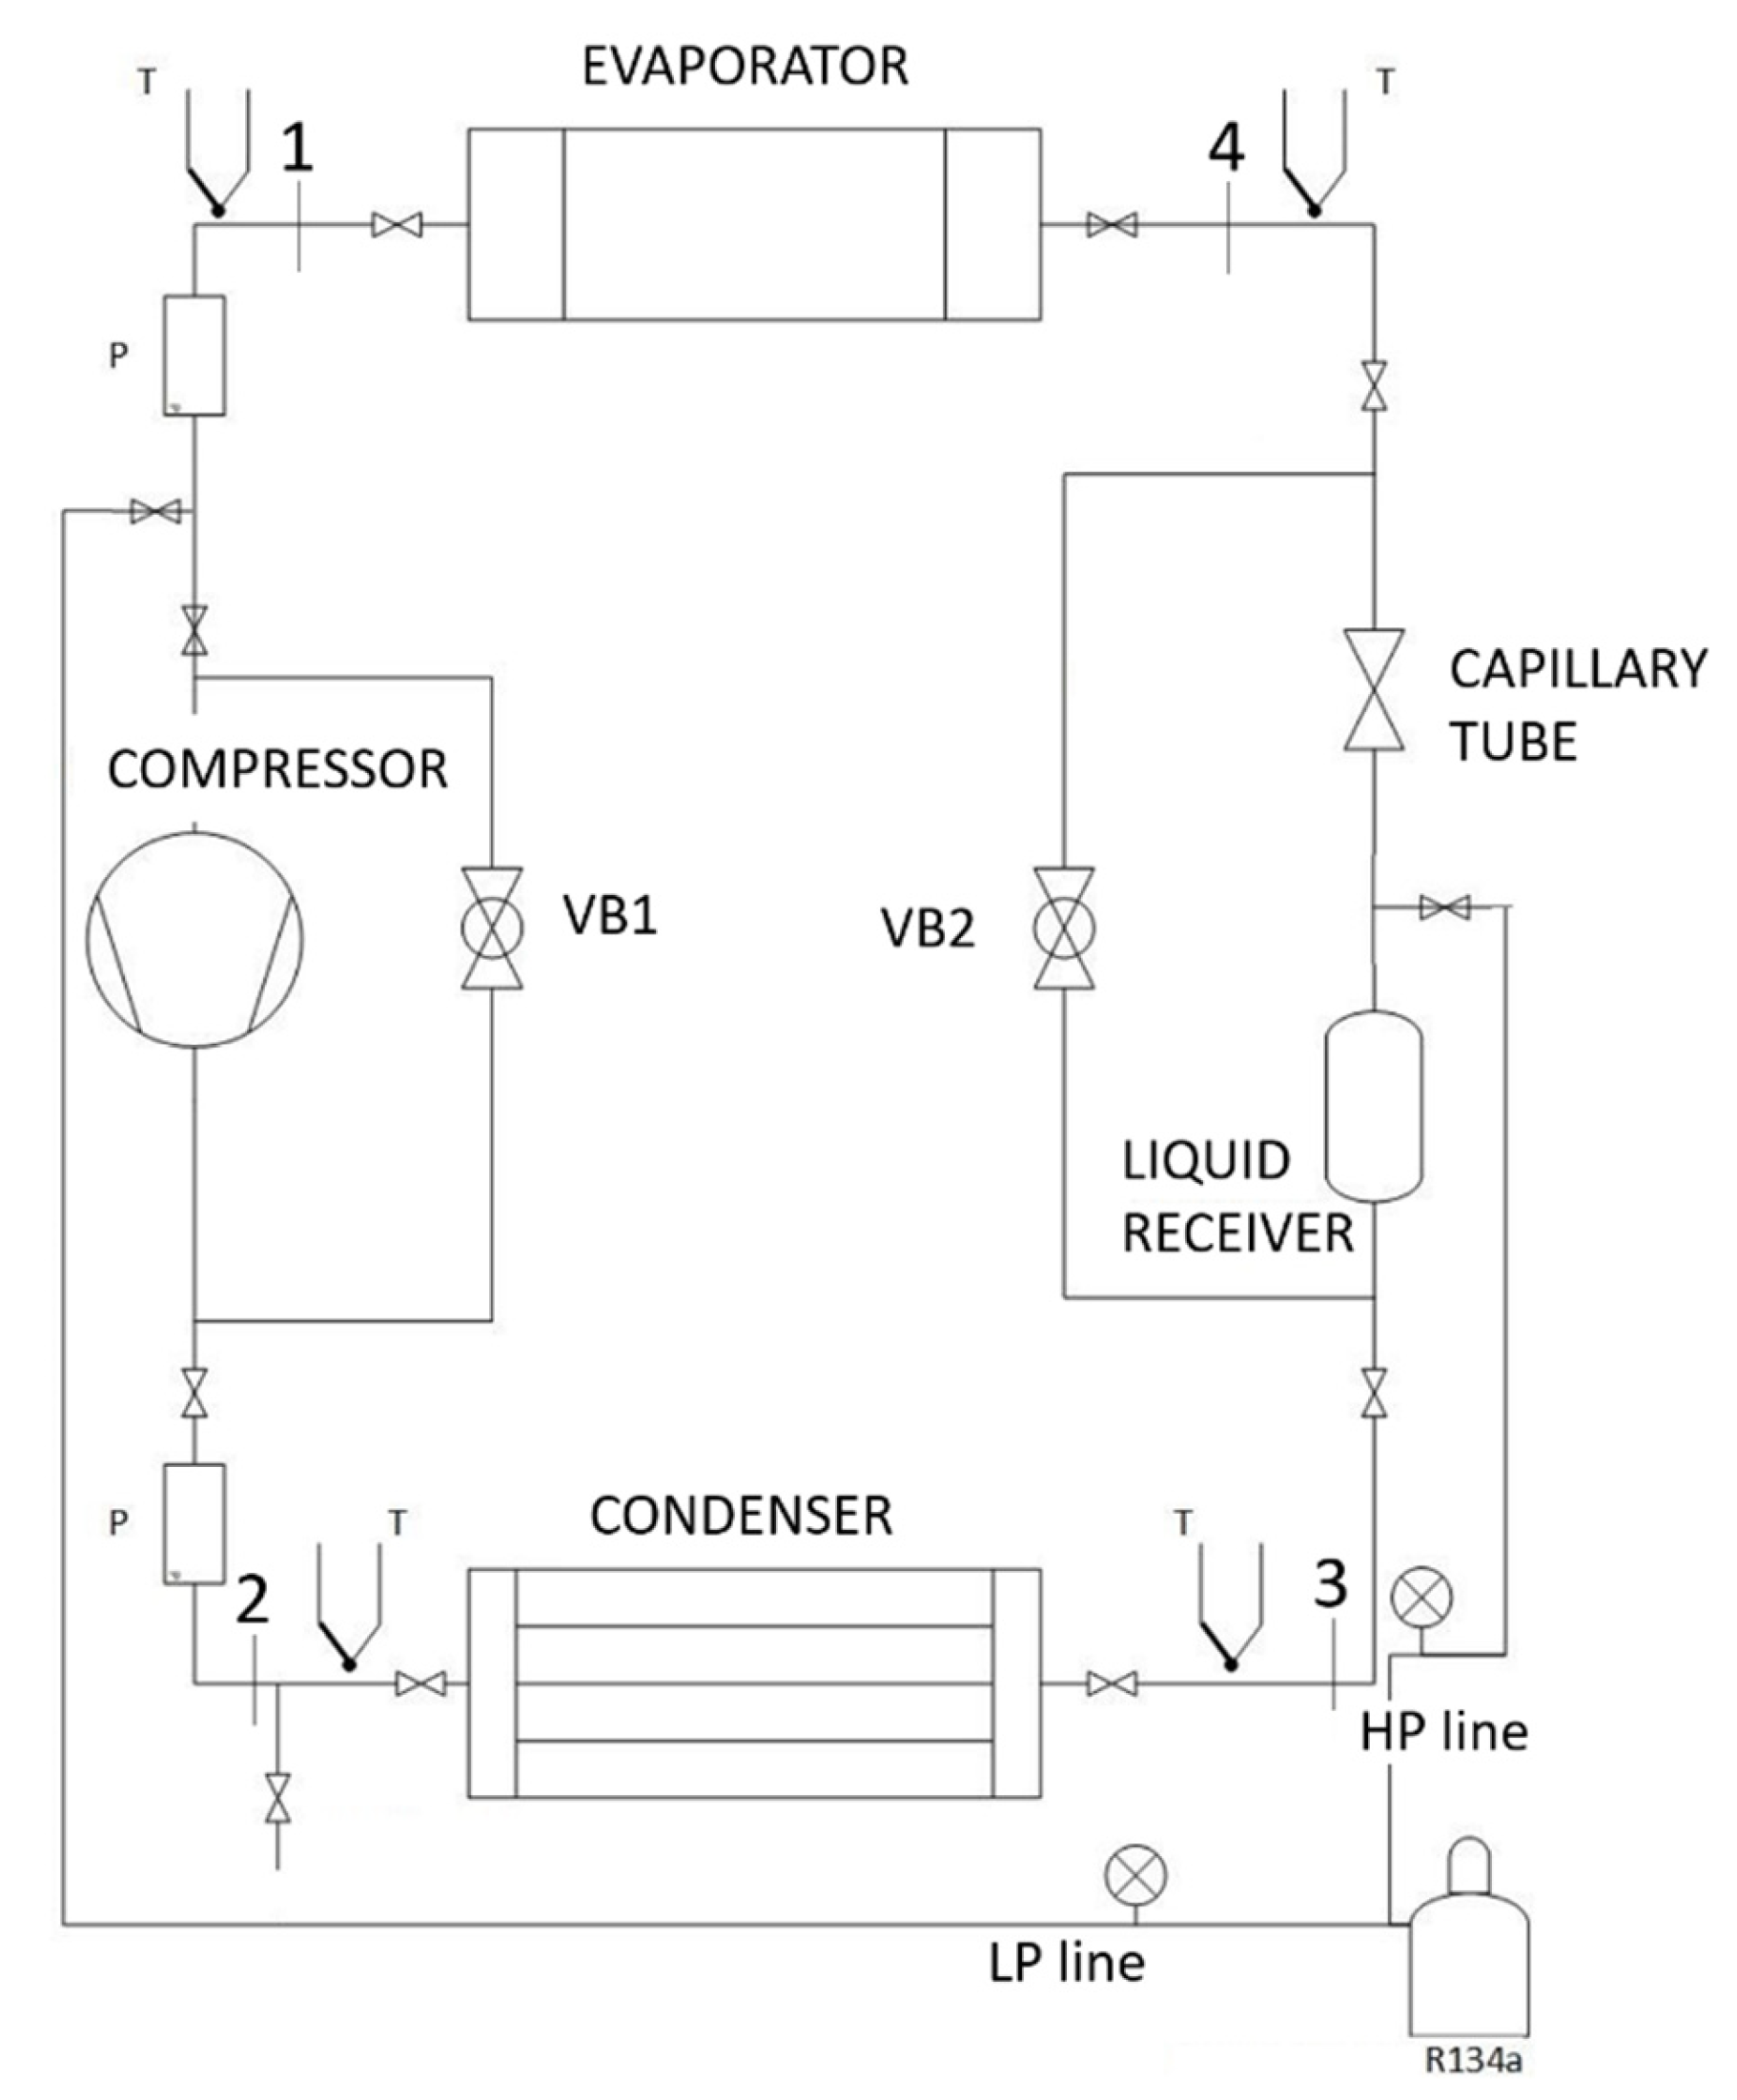
The main components necessary to achieve the refrigeration cycle were the compressor, the PCM integrated condenser, the liquid receiver, the throttling device (in this case, a capillary tube), and the evaporator. Figure 3 shows a schematic of the refrigeration circuit of the experimental apparatus, while Figure 4 shows the schematic of the condenser units. In addition to the main components, the circuit also featured a refrigerant filling unit, connected to both high (HP) and low (LP) pressure, and two bypass lines controlled by motorized ball valves; this allows, after a complete operation cycle of the system, circulating the refrigerant fluid, simply by means of natural convection mechanisms, to cool down and solidify the PCM. In the two above figures, the points where temperature and pressure measurements were made are noticeable, too.

3.2. Components of the Experimental Apparatus

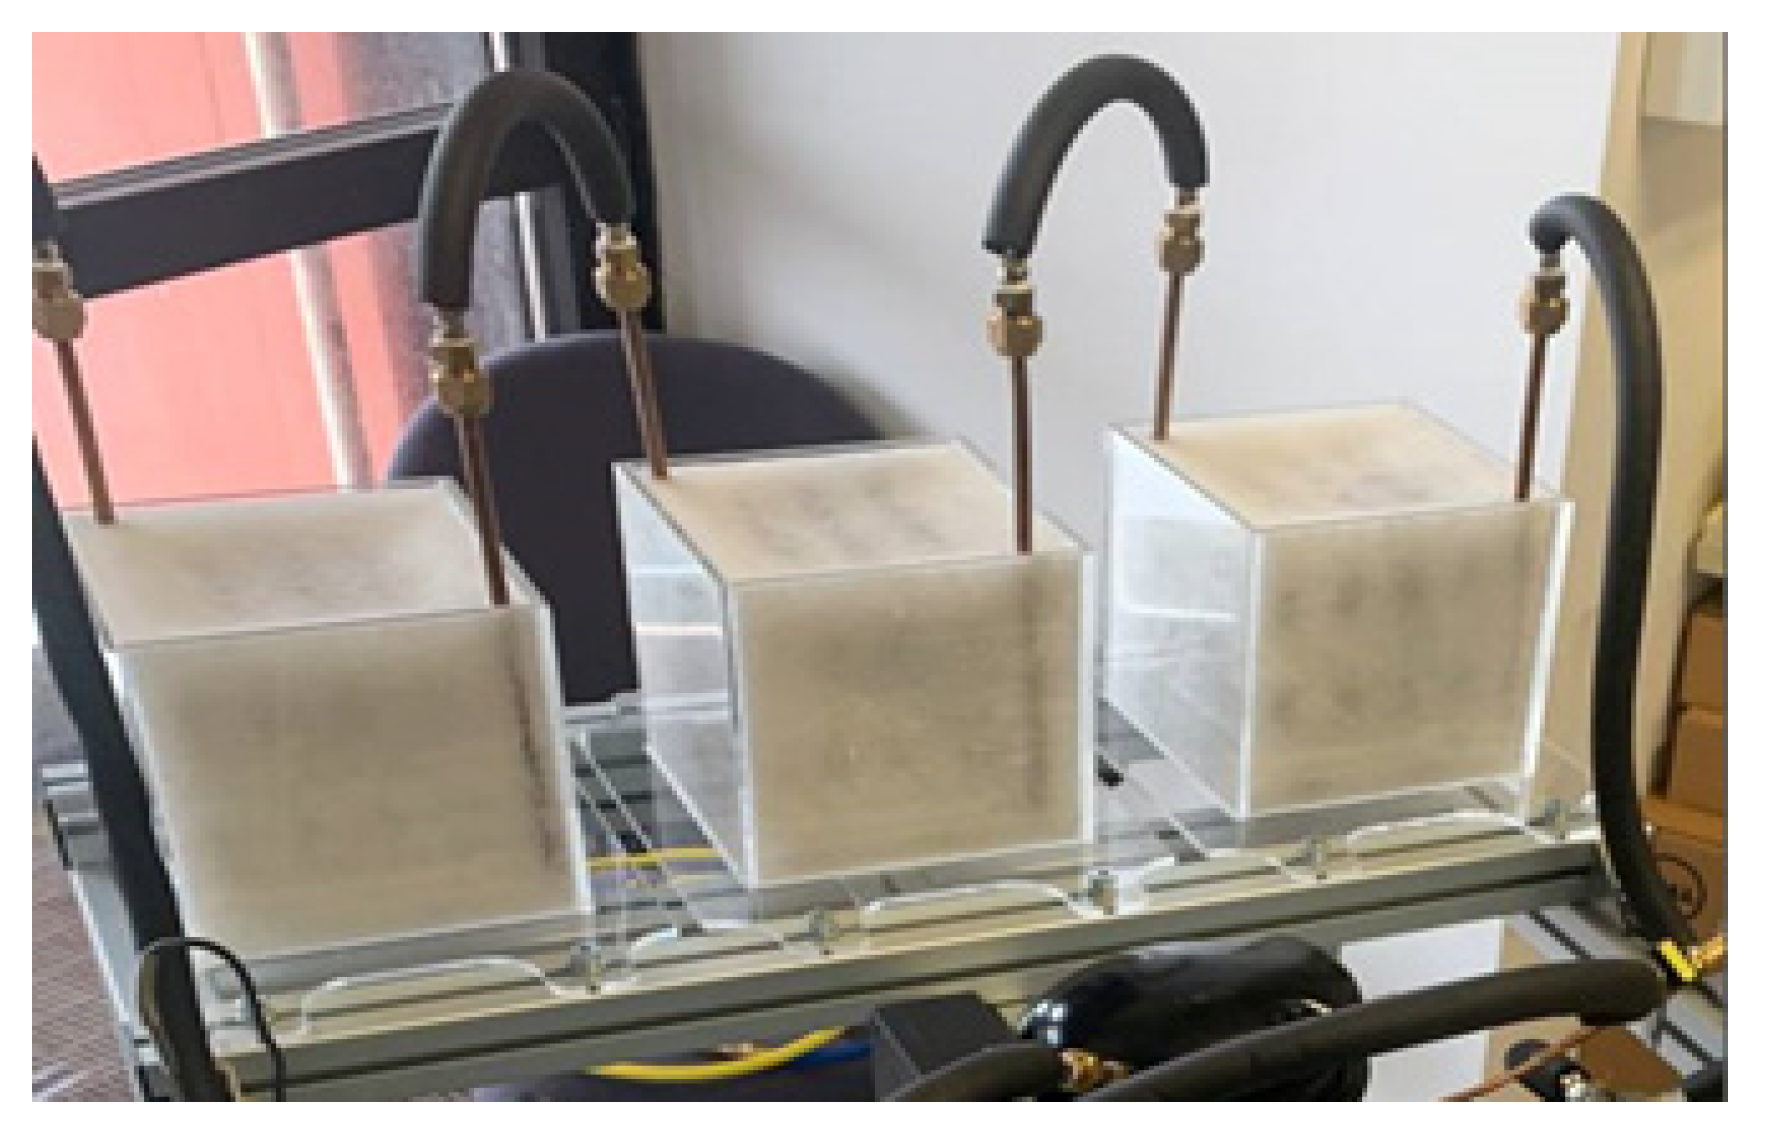
The nominal diameter of the circuit piping was DN8 (1/4”), with the tubes connecting the circuit components made of PTFE and thermally insulated with extruded polyethylene. Regarding the compressor, the Danfoss BD50F compressor was chosen in accordance with the system requirements. It must be noted that, for this system, it was necessary to oversize this component, as compared to the one that would be used in a real prototype, since the system was equipped with various measuring devices that contribute to generating concentrated pressure losses. Additionally, the quantity of pipes should not be so large because of a cost also in terms of distributed pressure losses. A potentiometer was also connected to the compressor electronics to vary the engine speed. The condenser installed in the circuit consists of three modules in series, each comprising a cube with a 17 cm side, containing a copper serpentine tube, in which the refrigerant circulates. The PCM used was Rubitherm RT 35 HC. In Figure 5, it is possible to see the entire condenser, with the PCM inside the cubes, at a room temperature of about 20 °C, i.e., in a solid state.
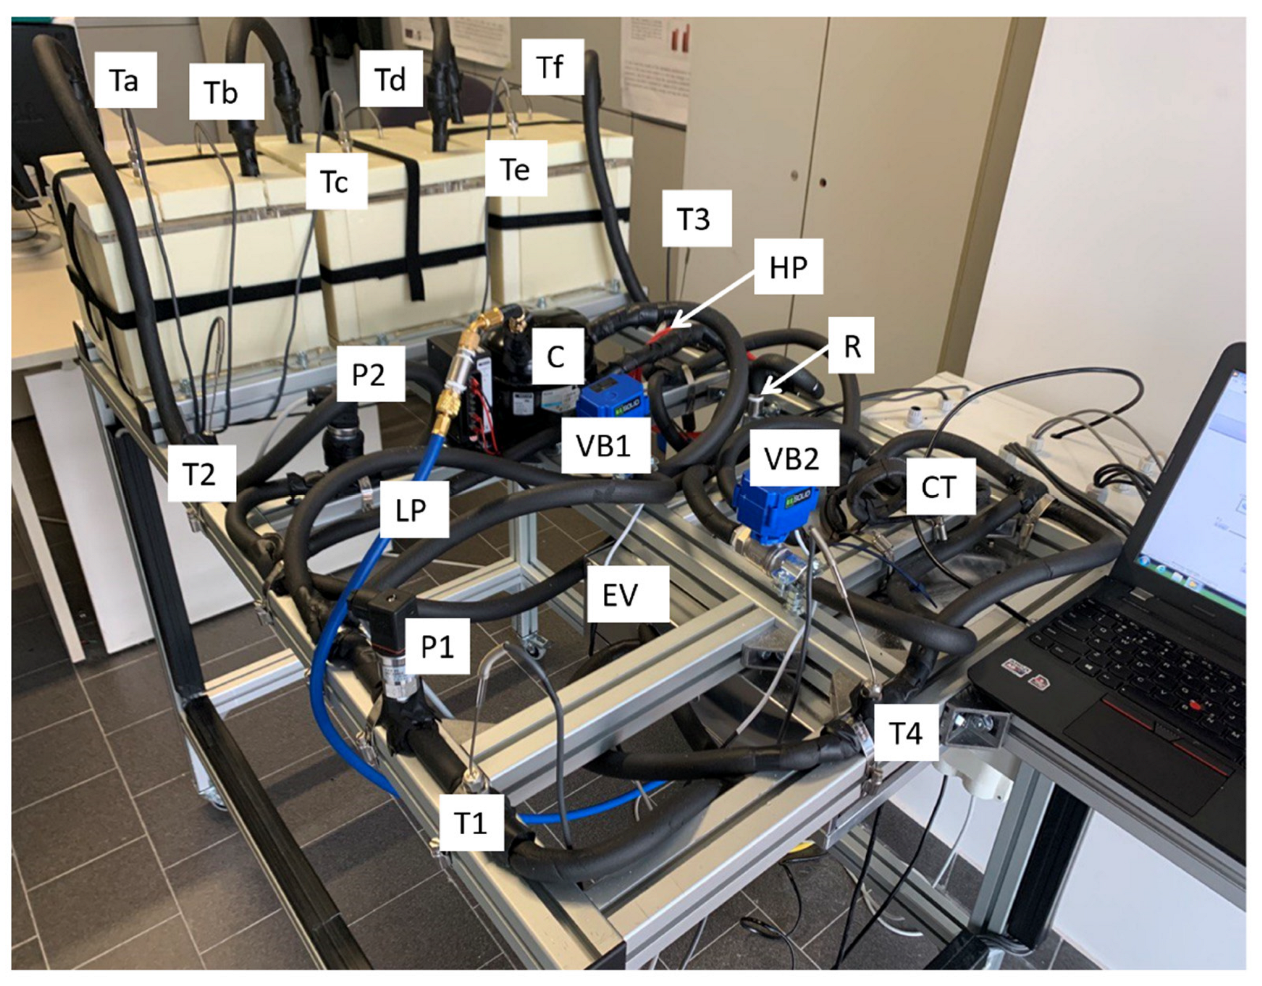
All the boxes’ walls were insulated with 30 mm-thick rigid panels made of extruded polystyrene (thermal transmittance λ ≅ 0.035 W/m K). To obtain throttling, 2 copper capillaries, with an internal diameter of 0.8 mm and lengths of 1.5 m and 2 m, was used. Furthermore, the circuit included a small 15 mL copper receiver for the liquid refrigerant. The circuit was equipped with the commercial evaporator RIVACOLD RS1040. The standard motor fan was replaced with an adjustable rotation speed one, with analog control via a manual command. The whole experimental apparatus is shown in Figure 6, and the components are listed in Table 3.

3.3. Measuring and Control Equipment

The following sensors were used: 4 class A Pt100 Resistance Temperature Detectors (RTDs) for the refrigerant temperature monitoring (thermodynamic points 1,2,3, and 4 of the cycle) and 6 class A Pt100 RTDs to measure the PCM temperature at different points inside the condenser modules. The class A RTDS have an accuracy of ±0.15 °C (IEC 751). For each module, two temperature measurements were made, one at a height of 4.2 cm, and one at a height of 9 cm from the box base. In total, 2 Danfoss AKS 32 pressure sensors, with an accuracy of 0.06 bar, were used to measure pressures at points 1 and 2 of the thermodynamic cycle. The characteristic points of the thermodynamic cycle were numbered by following the order shown in Table 1; the schematic is shown in Figure 3.
For the experimental data acquisition, carried out using LabView 2018 software, the following components were used: NI cRIO-9053 Controller, 2 modules NI-9216 (RTDs), 1 Module NI-9239 (pressure transducers), 1 module NI-9425; in particular, the last was also used to obtain a digital output in order to switch on and off, via the LabView interface, the compressor and evaporator, as well as the two bypasses. The bypass valves were US SOLID ½” motorized ball valves, and the Lenovo Thinkpad E565 computer was used for data acquisition.

3.4. Setup of Experimental Tests Initial Conditions

The initial conditions for the experimental tests were obtained using the following procedure. Initially, the PCM was melted in a thermal chamber and subsequently poured into the three modules that constituted the condenser, until each of them was completely filled. Once all the PCM solidified, a vacuum pump was used to make a void in the circuit. Successively, with a three-way manifold gauge set and a tank containing R134a, the refrigerant was introduced into the circuit. The evaporator motor fan was initially adjusted to its minimum speed, and subsequently the speed was increased. The air temperature, with which the evaporator exchanges heat, was about 20 °C (controlled room temperature). The initial temperature of the PCM was also around 20 °C.

4. Experimental Tests Results

The results from two different experimental tests are reported in this section. In the first test, only the useful phase was analyzed (PCM melting), while the second test also includes the post-operation phase, that is, the PCM re-solidification.

4.1. Results of the First Test

The main results for the first test are given in Figure 7, Figure 8 and Figure 9.
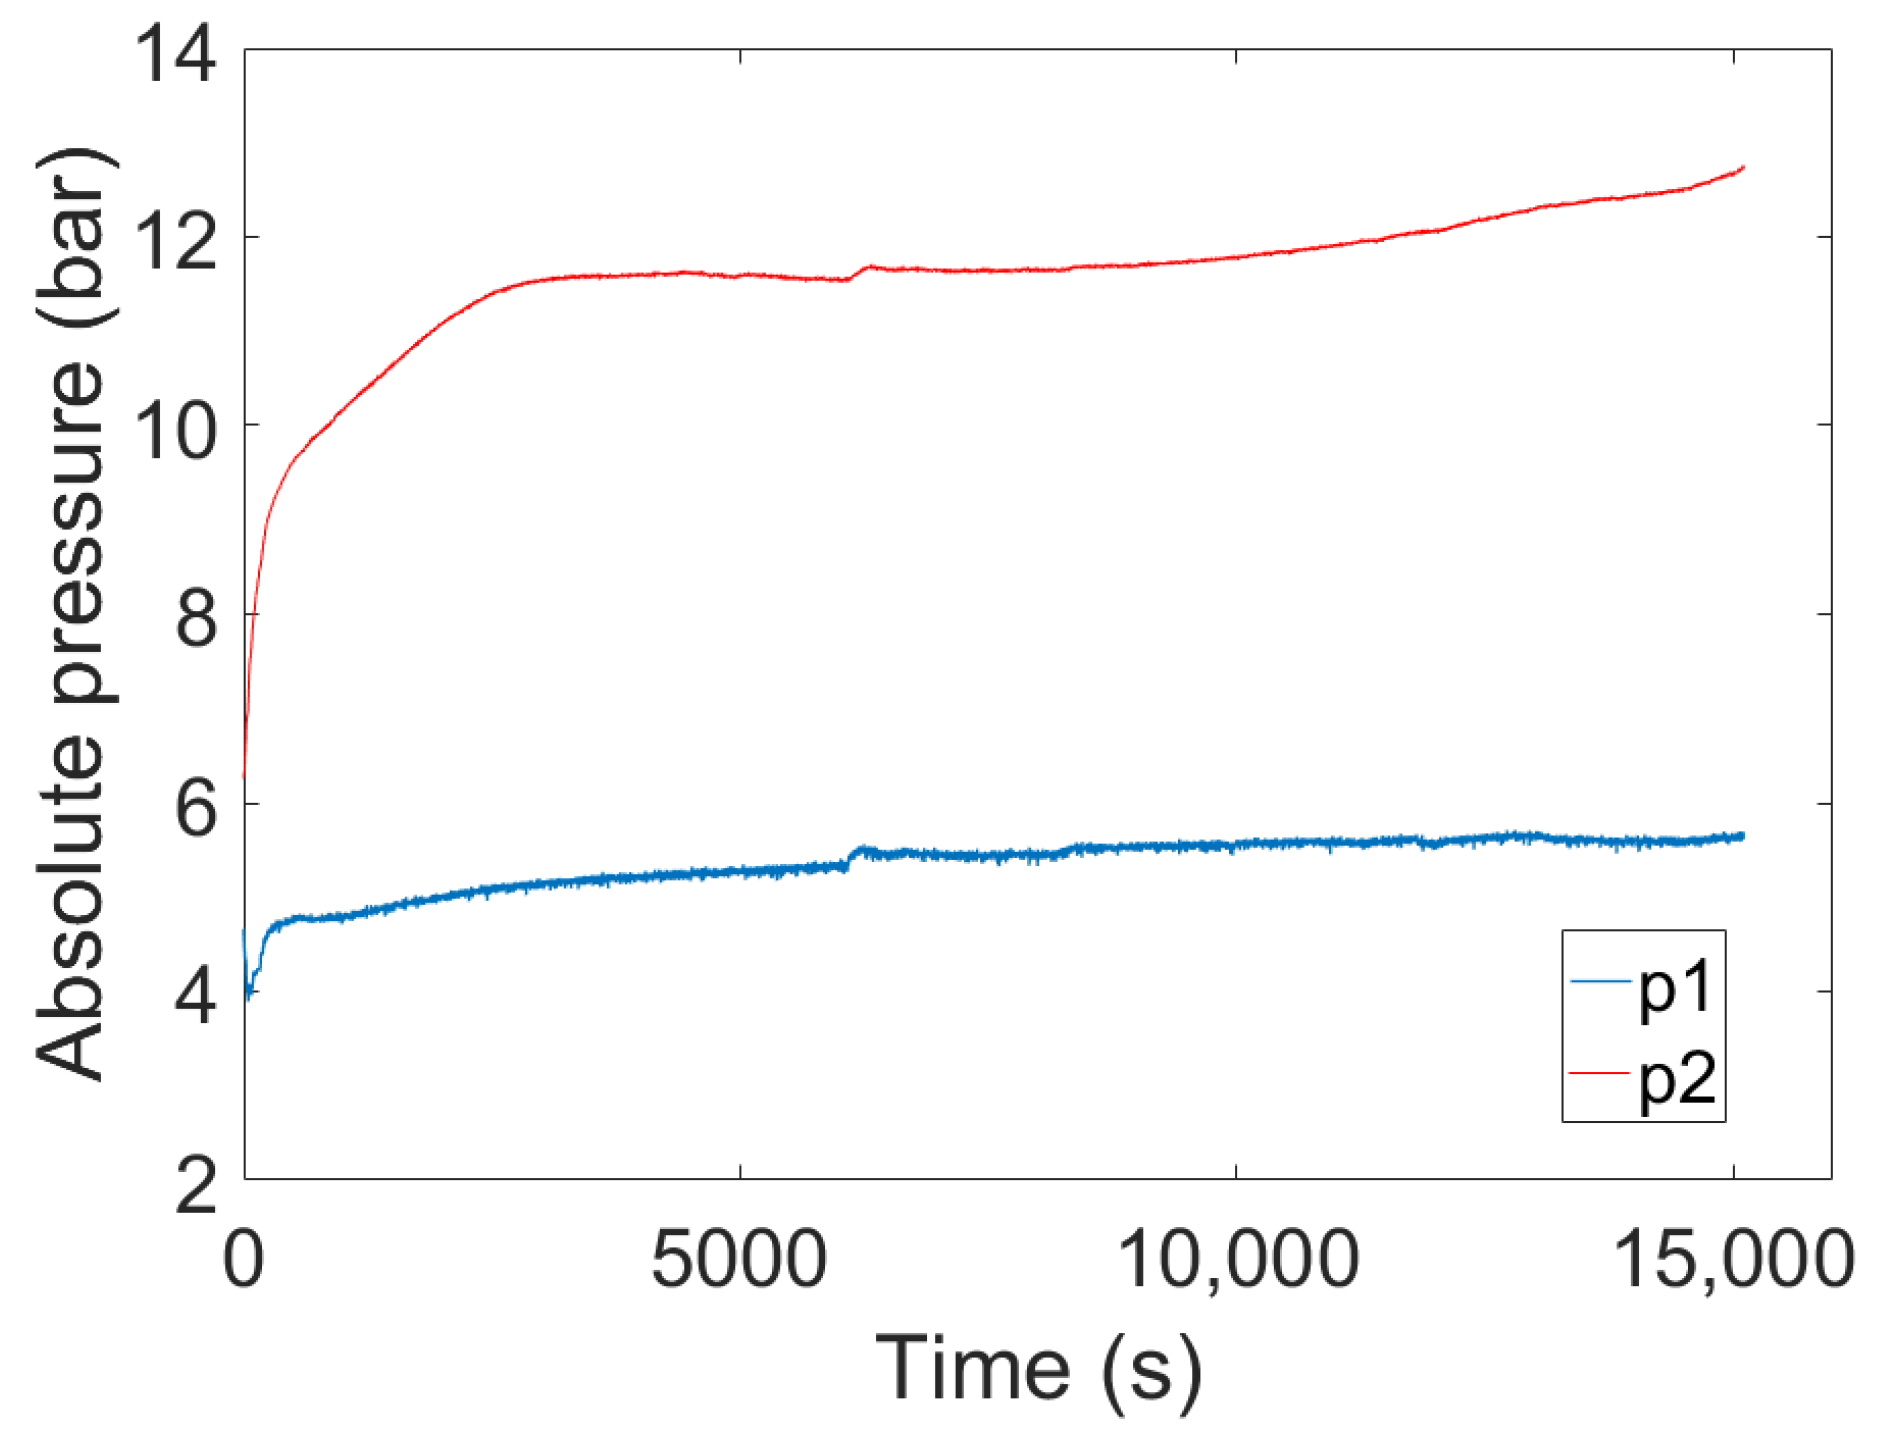
From Figure 7, it can be noted that after filling the system, the low-pressure level became stable very quickly, while the high-pressure level became stable after about 3000 s (during this time, the compressor was operating, as already mentioned, at maximum speed). In particular, the value of the absolute pressure p1 was around 5.47 bar, while the absolute pressure p2 became stable at about 11.86 bar. A quite abrupt pressure increase shortly after 6000 s is also noticeable. This pressure rise happened because the heat transfer at the evaporator was increased by increasing the motor fan speed. Clearly, this phenomenon affected the refrigerant temperatures, too. The refrigerant temperature of the four main points of the cycle versus time is shown in Figure 8. Clearly, like the pressure levels, the temperatures were initially transient, after which they became stable. In particular, temperatures T1, T2, T3, and T4 became stable around the values of 19.05 °C, 46.02 °C, 40.90 °C, and 19.45 °C, respectively. From the temperature difference between T2 and T3, since the vapor quality at the condenser inlet was equal to 1, it is clear that the refrigerant flowing inside the condenser initially released latent heat to condense, and subsequently exchanged sensible heat with the PCM, becoming a subcooled liquid. The refrigerant mass flow rate was estimated via the Equation (21):
m ˙ = d · μ L · 1.8925 · L 0.484 · V 0.824 · P 1.369 · S 0.0187 · ρ L ρ G 0.773 · μ L μ G μ G 0.265
where, for the definition of the individual terms in the equation, reference was made to the ASHRAE Handbook [32].
The inlet and outlet evaporator temperatures were instead very close; this was because not only was the refrigerant fluid in phase transition within its entire flow path, but also because the ambient temperature was about 20 °C, which was very close to the saturation temperature of the refrigerant inside the evaporator. The PCM temperature measurements are shown in Figure 9. The temperature trend can be conceptually divided into three phases: within the first phase, the PCM heated up noticeably, since it was in the solid phase. Indeed, the PCM initial temperature was about 20.5 °C, reaching about 31 °C when heated up. The second phase took place in the temperature range from about 31 °C up to about 35 °C; in this temperature range, the material melted, so the contribution of the latent heat slowed down the rise of the temperature of the material, and thus, the temperature was almost constant, as normally happens during a phase change. Once this phase was over, the temperature started to increase again. With reference to the scheme shown in Figure 4, the RTDs were positioned as follow: the RTD pairs Ta and Tb, Tc and Td, and Te and Tf were located in the first (following the refrigerant flow direction), second, and third module, respectively; the RTDs Ta, Tc, and Te measured the material at a greater depth than the RTDs Tb, Td, and Tf. Due to convective motions that occur in the PCM when it is in the liquid state, the RTDs located at a greater depth measured lower temperatures than the ones recorded by the sensors that were located higher. Furthermore, the PCM temperature rise also depends on the distance from the refrigerant inlet: the closer the module is to the refrigerant inlet, the faster the heating of the material inside. For example, temperatures Ta and Tb, measured inside the first module, were visibly higher than temperatures Te and Tf, measured inside the last module, especially after 8000 s. This happened because the refrigerant underwent cooling, hence the temperature difference between the PCM and refrigerant, and, consequently, the heat rate decreased as one approached the outlet. In addition, different slopes for the different RTDs can be seen. These are due to the proximity of the instrument itself to the coil in which the refrigerant circulated. For example, the Ta sensor was further away from the coil than the Td one; for this reason, it recorded a lower steep temperature variation.

4.2. Results of the Second Test

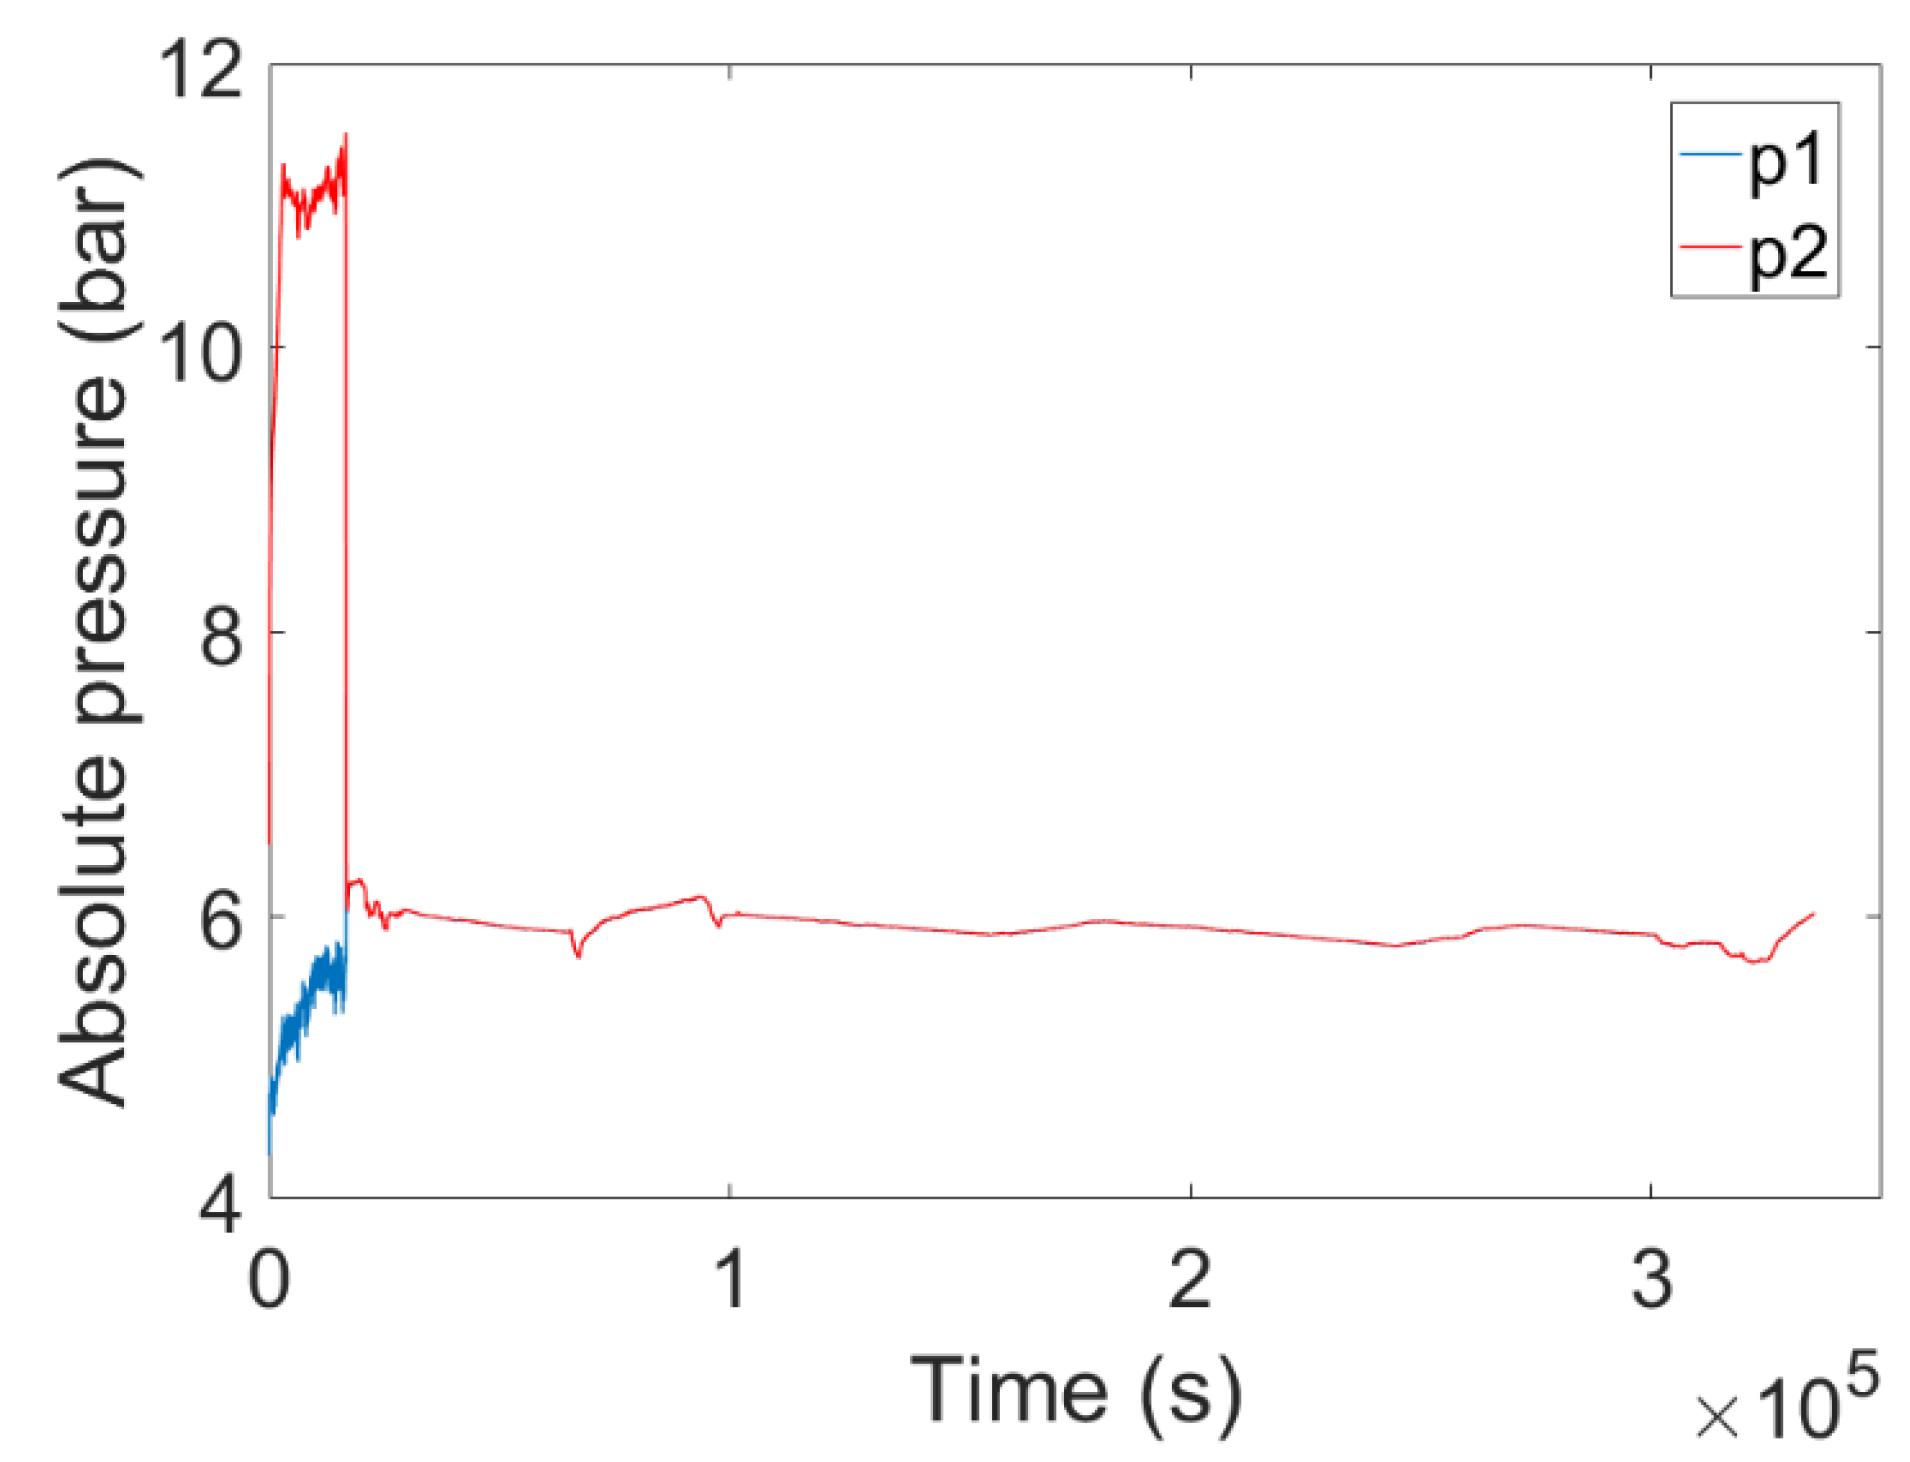
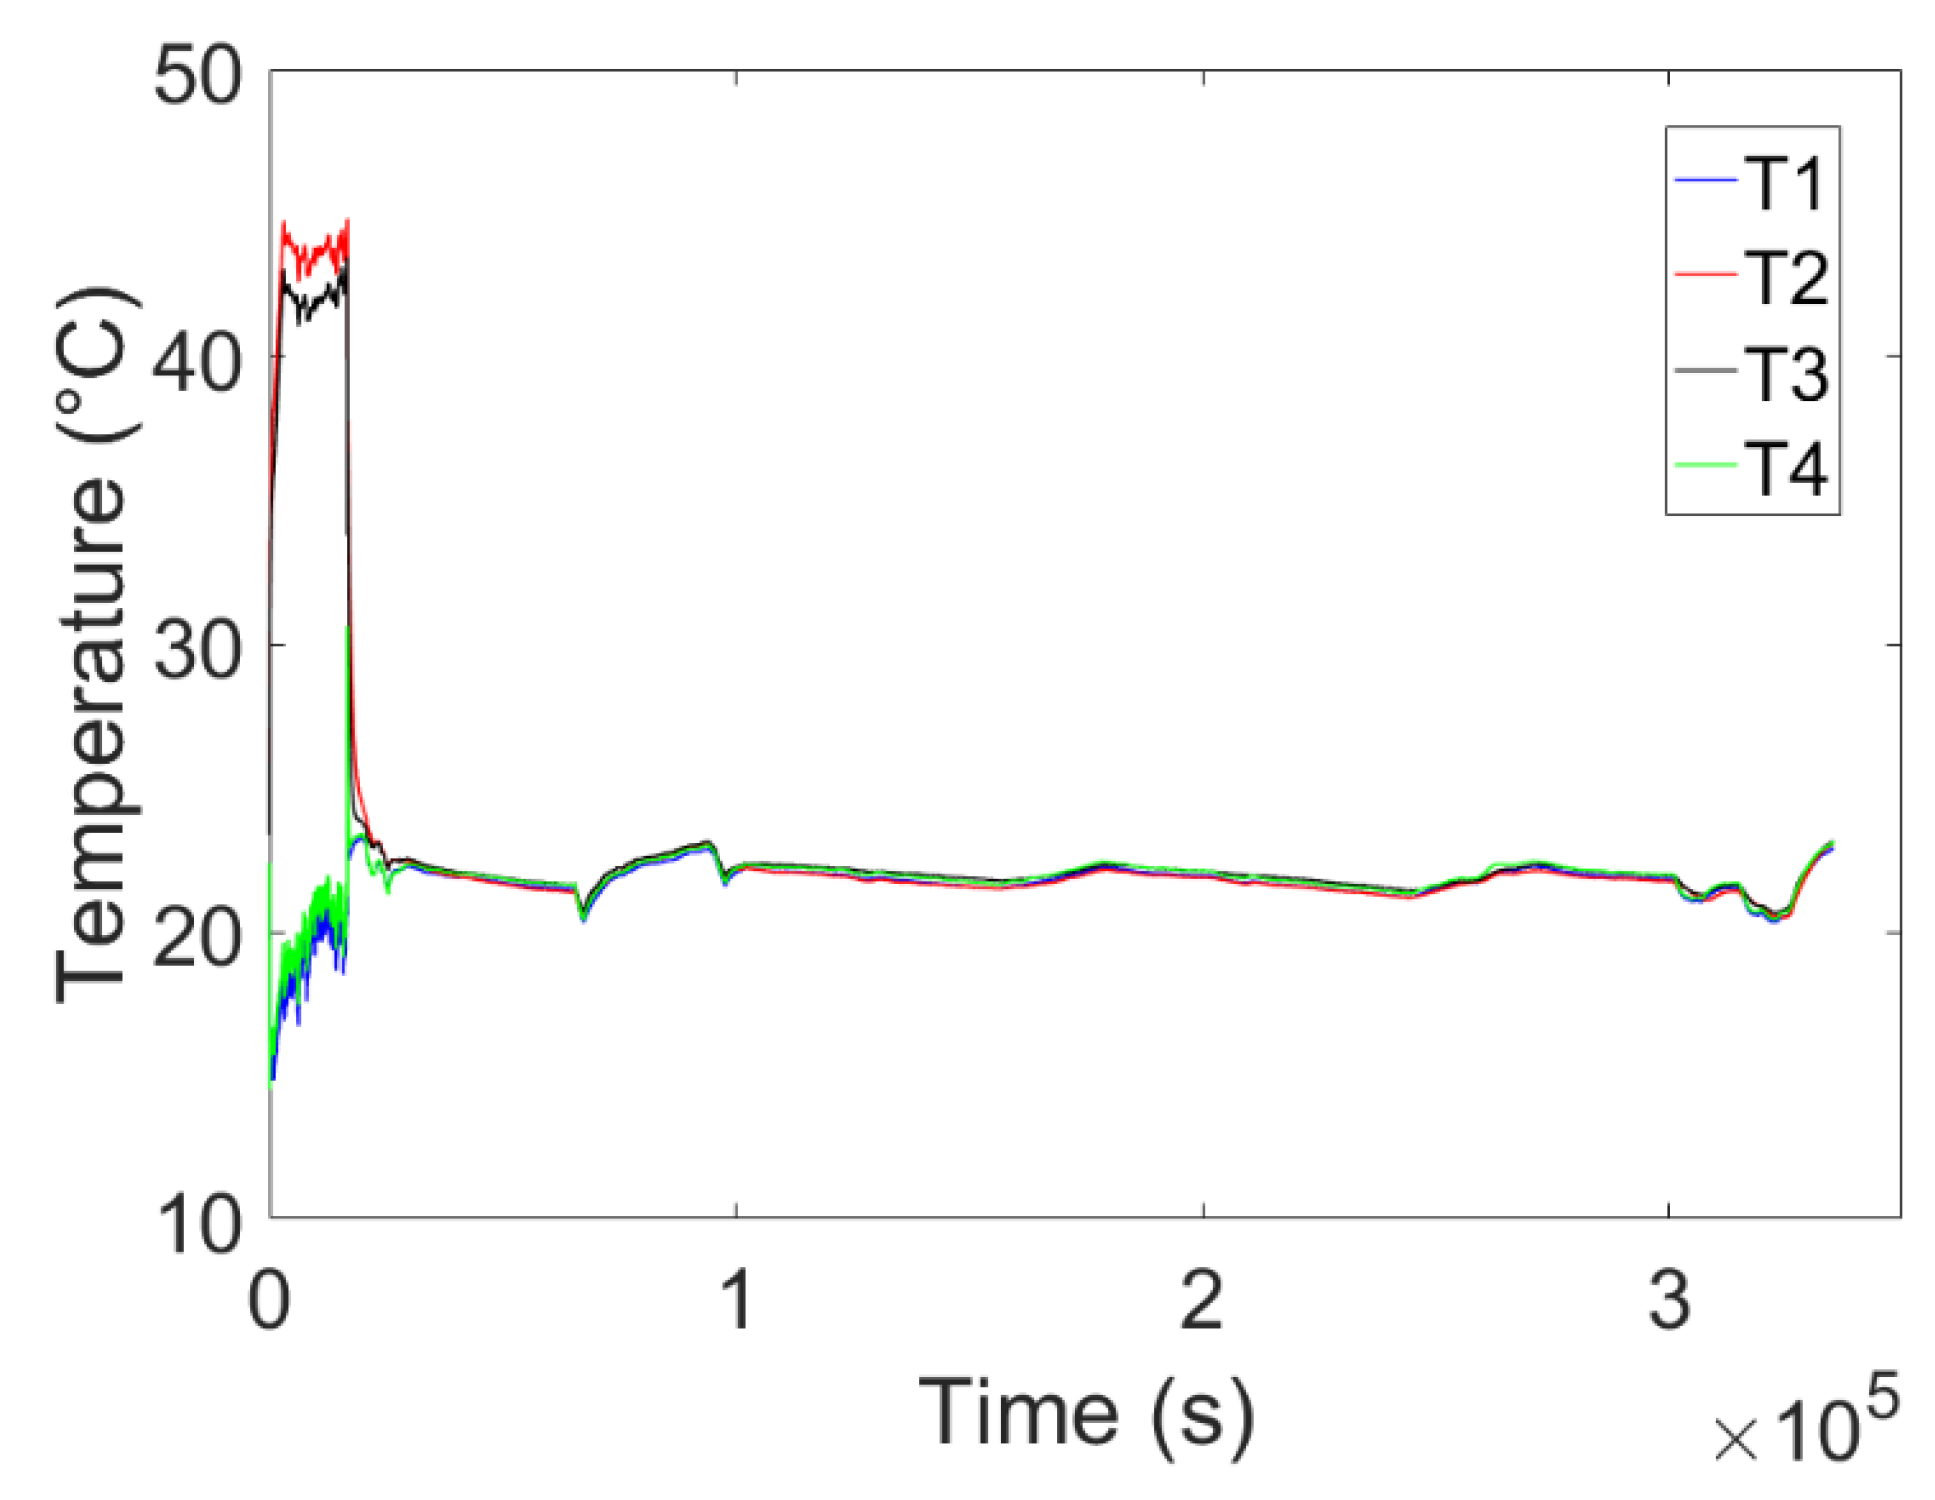
The results of the second experimental test are shown in the following figures. The useful phase duration in the second test was about 16,000 s long. After this, the compressor was turned off and the valves were opened, so that the PCM could solidify, thanks to the heat transfer with the refrigerant. After the compressor shut down, the refrigerant pressure—and consequently the temperature—decreased within the entire system. Almost immediately after switching off the compressor, the refrigerant pressure in the whole system reached the same pressure level, about 6 bar.
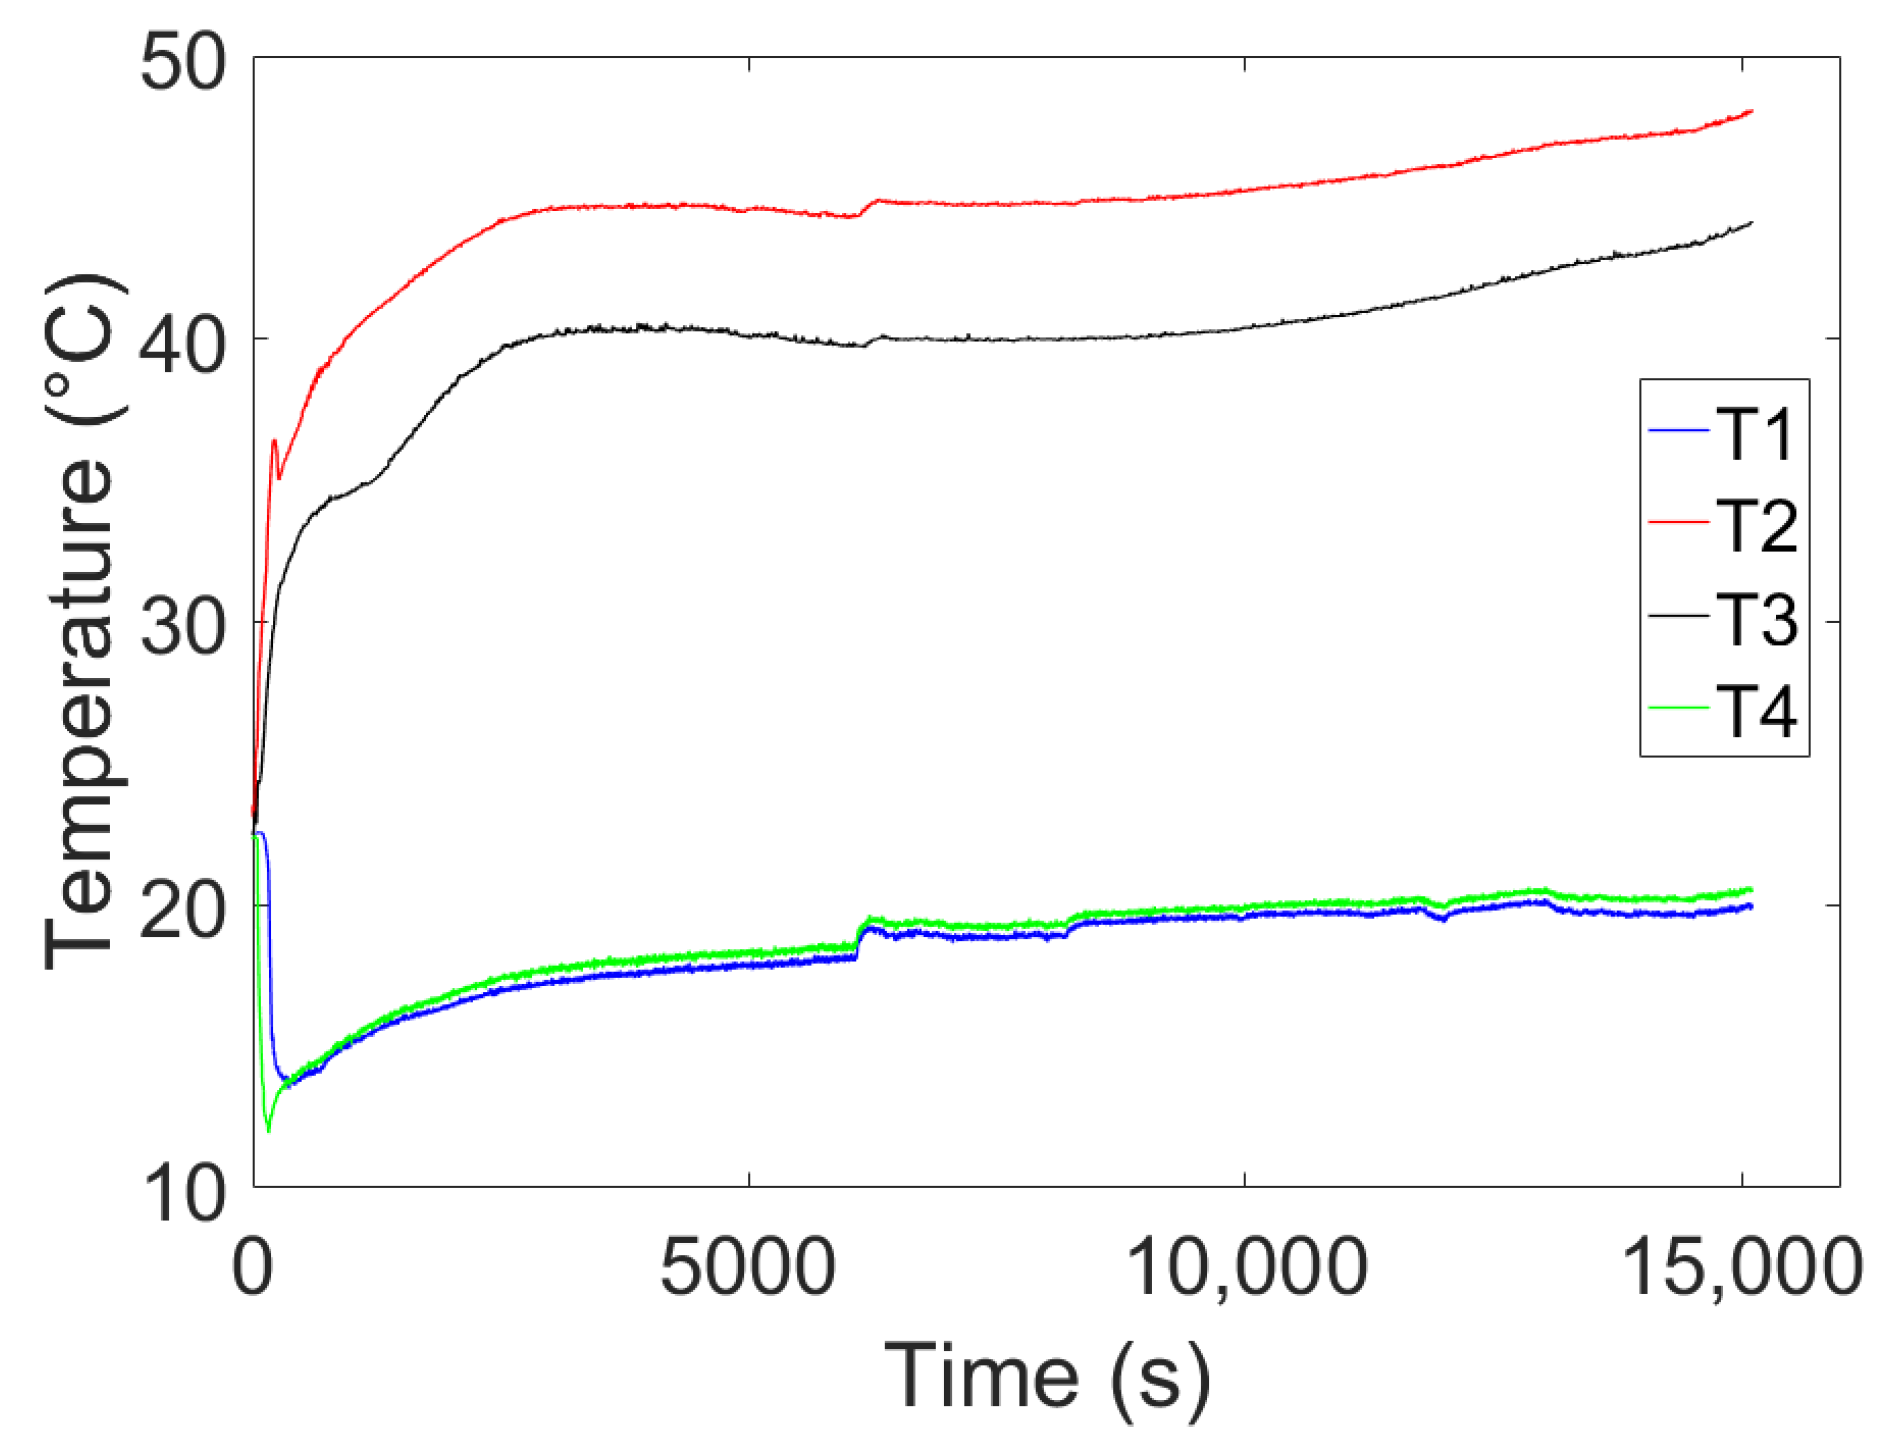
The absolute pressure evolution with time is shown in Figure 10, while Figure 11 presents a focus on the pressure trends during the useful phase. Moreover, in this test, after filling the circuit, the lowest pressure level stabilized very quickly, while after about 3000 s, the higher-pressure level stabilized, too. In particular, the pressure p1 was around 5.5 bar, while the pressure p2 stabilized at about 11 bar. The temperature trend of the cycle’s four characteristic points are shown in Figure 12. As can be seen, the temperatures clearly tended to follow the pressure trends. After shutting down the system, the refrigerant temperature reached about 22 °C. Further, in this case, a focus is shown to evaluate the performance of these quantities during the useful phase, in Figure 13.
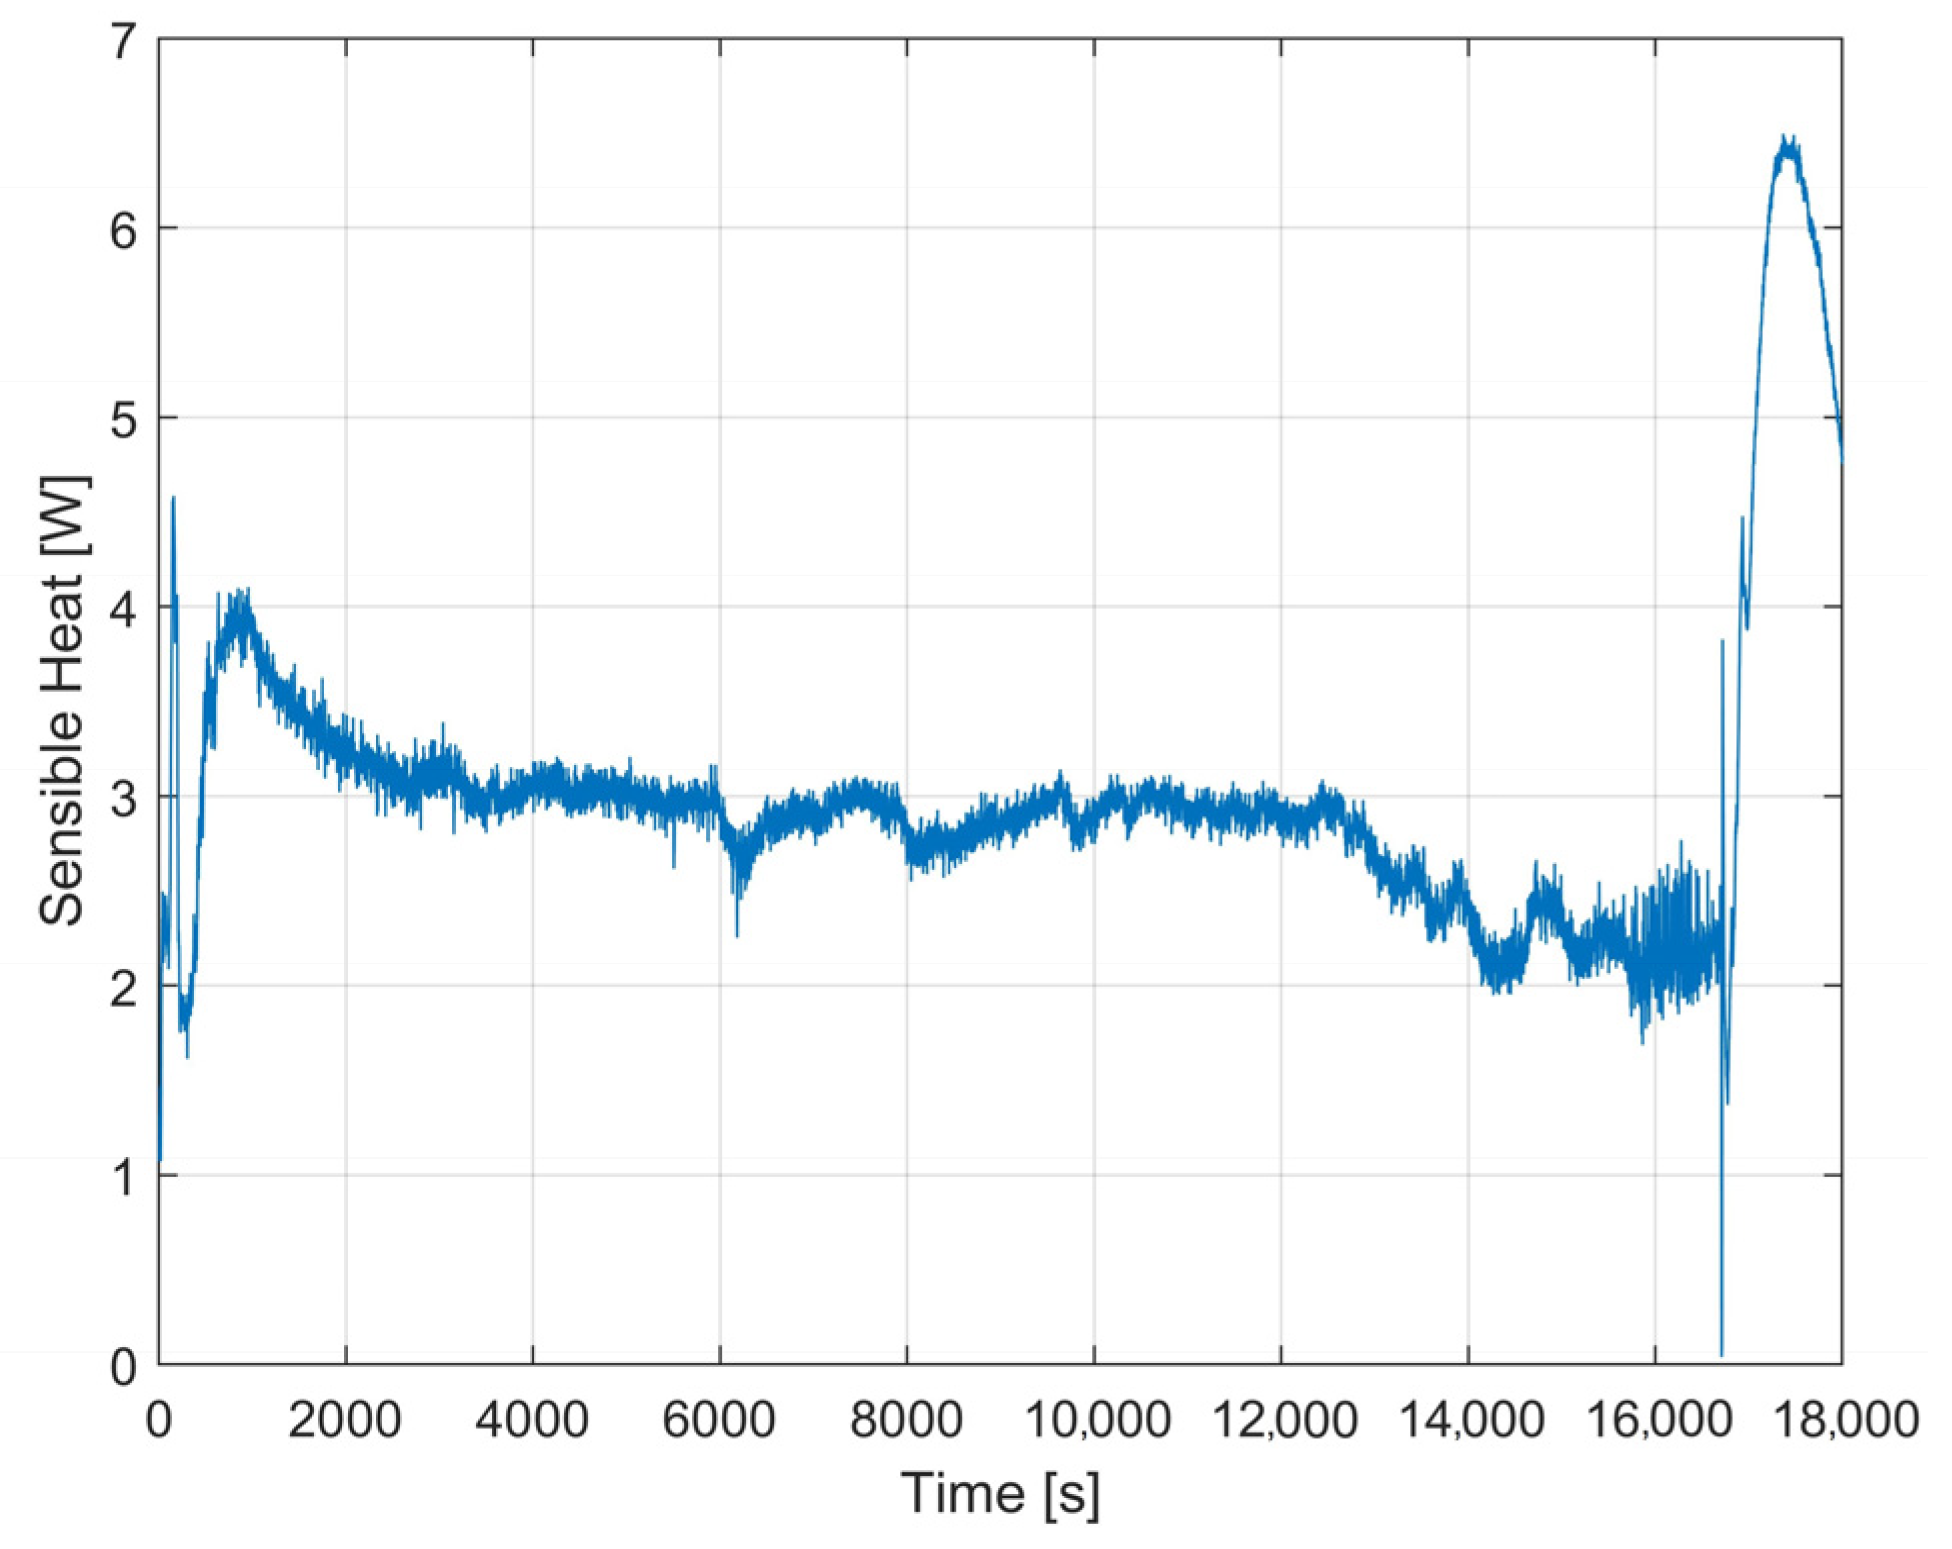
It can be noticed that the temperatures were initially transient, too, and then they stabilized. In particular, temperatures T1, T2, T3, and T4 stabilized around the values of 20 °C, 44 °C, 42 °C, and 21 °C, respectively. In this case also, the behavior of the sensible thermal power exchanged at the condenser is reported (Figure 14).
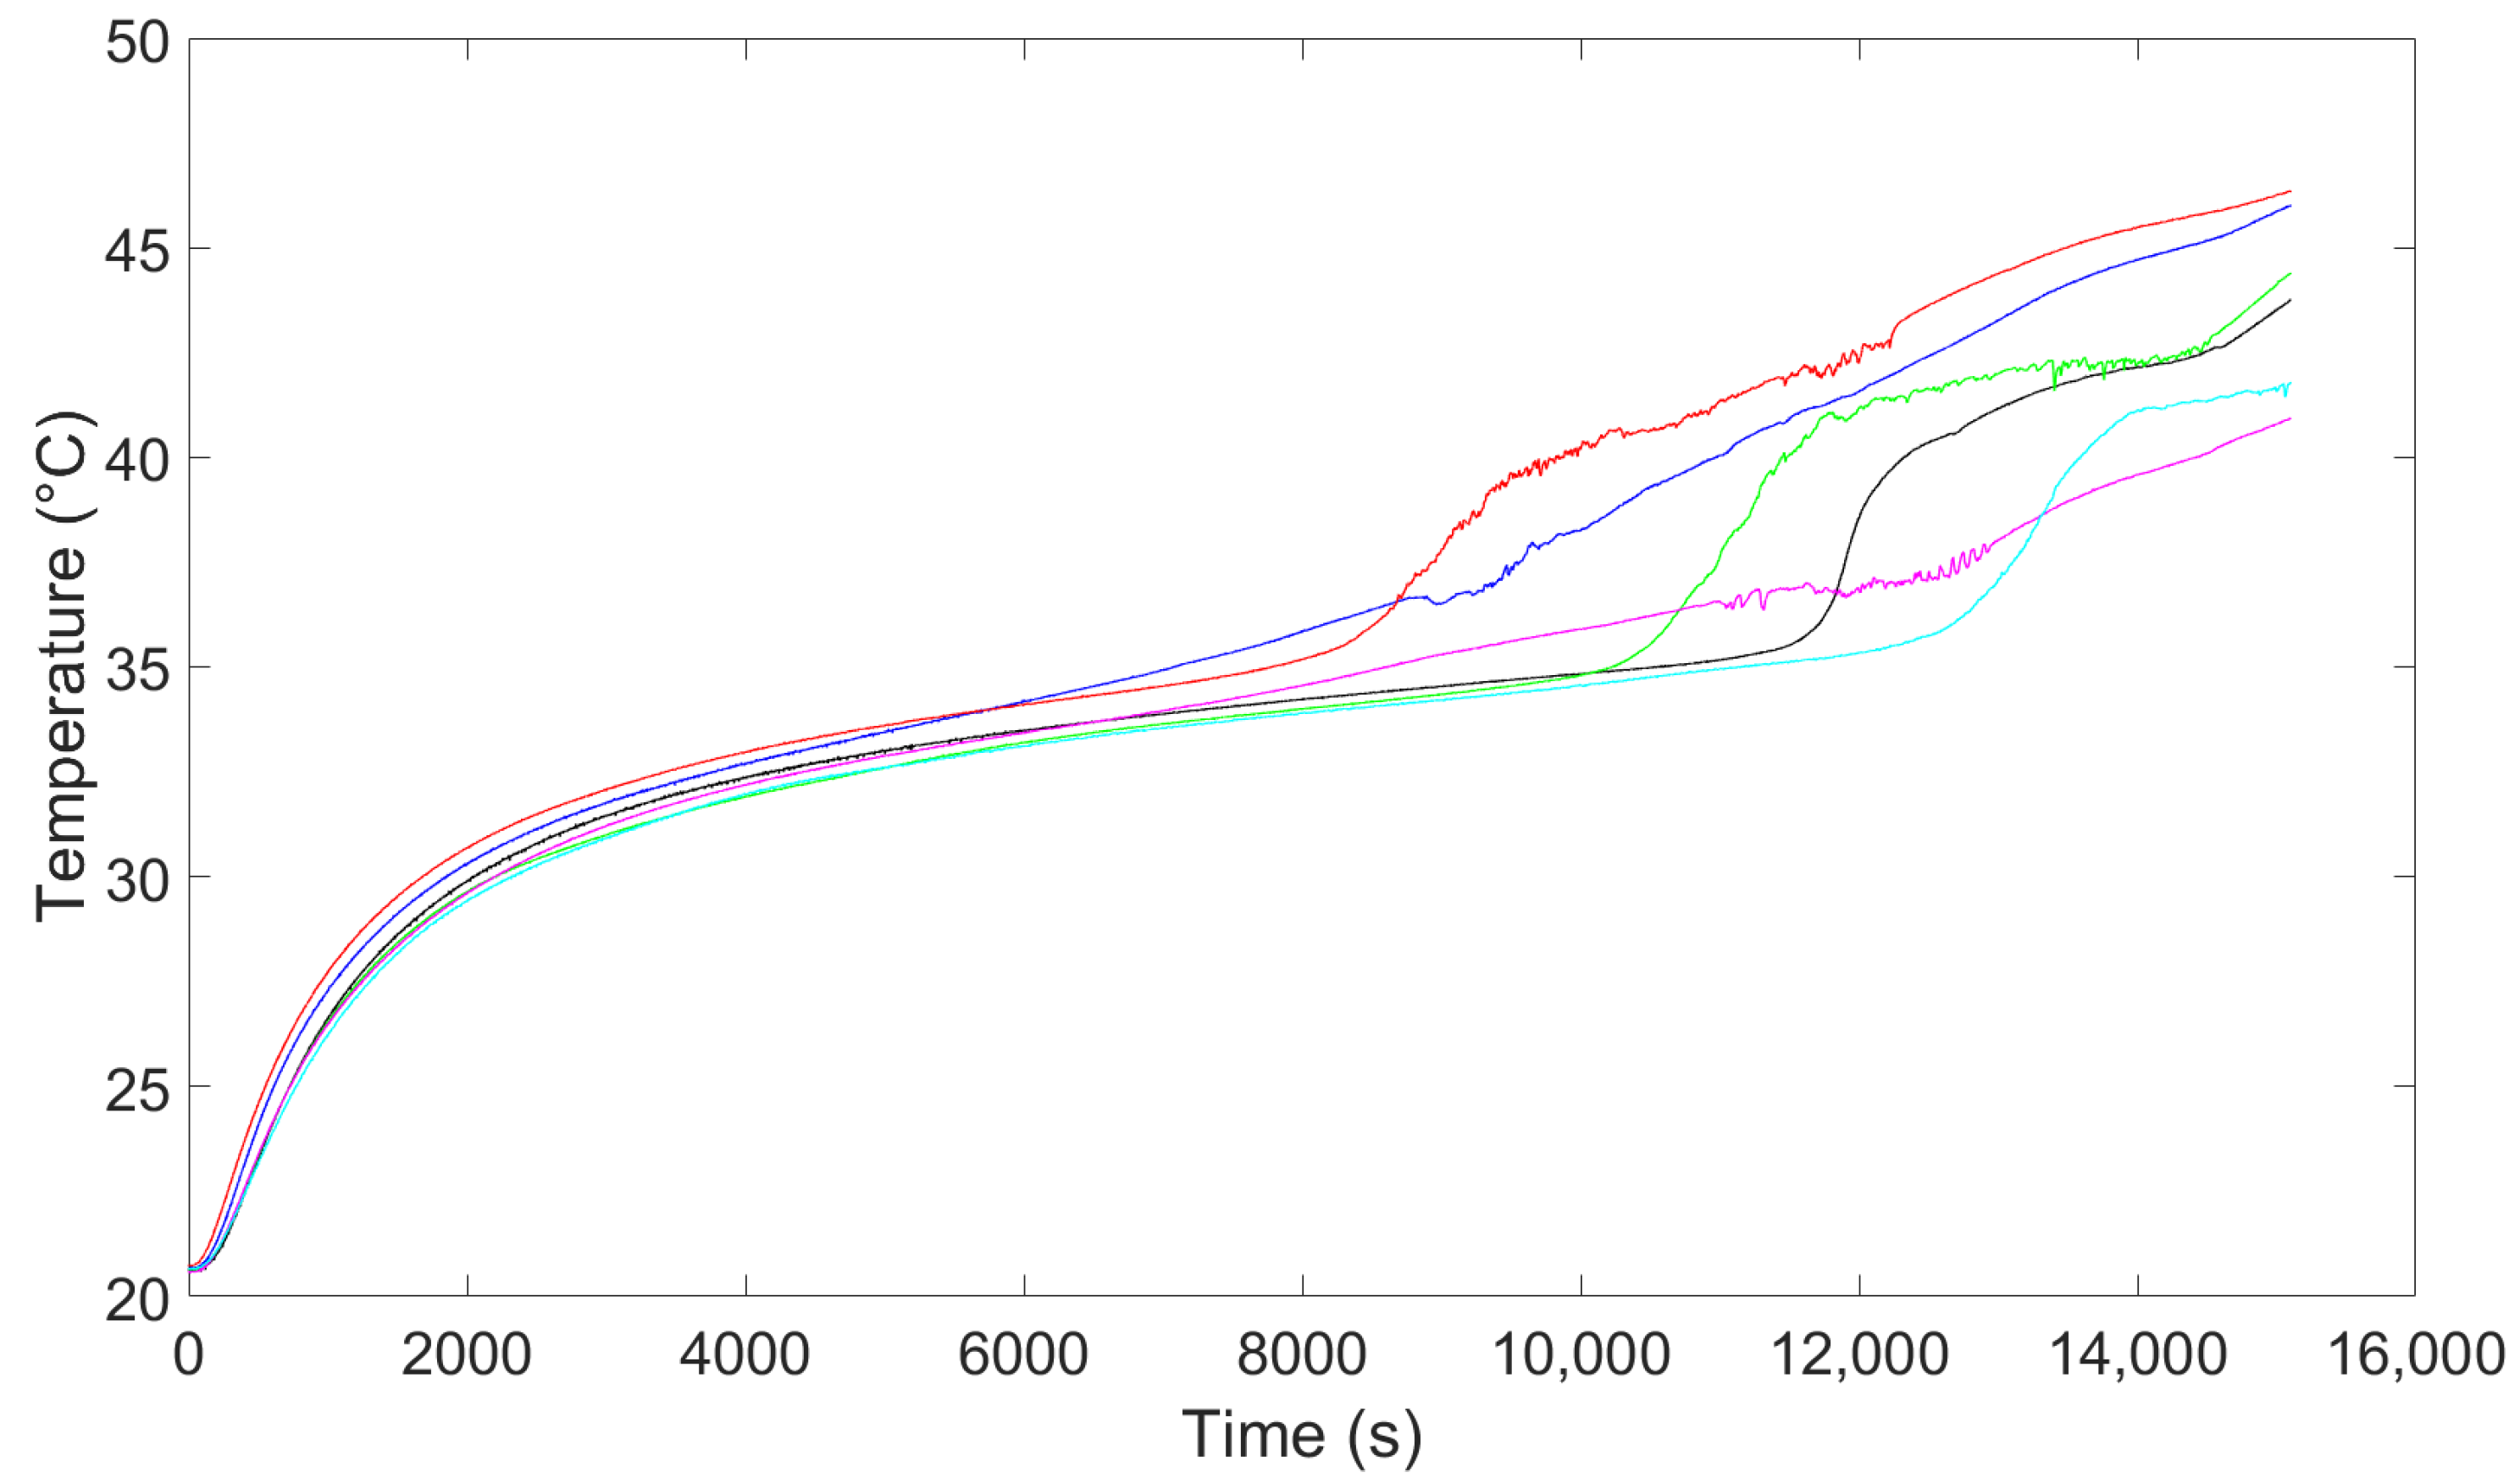
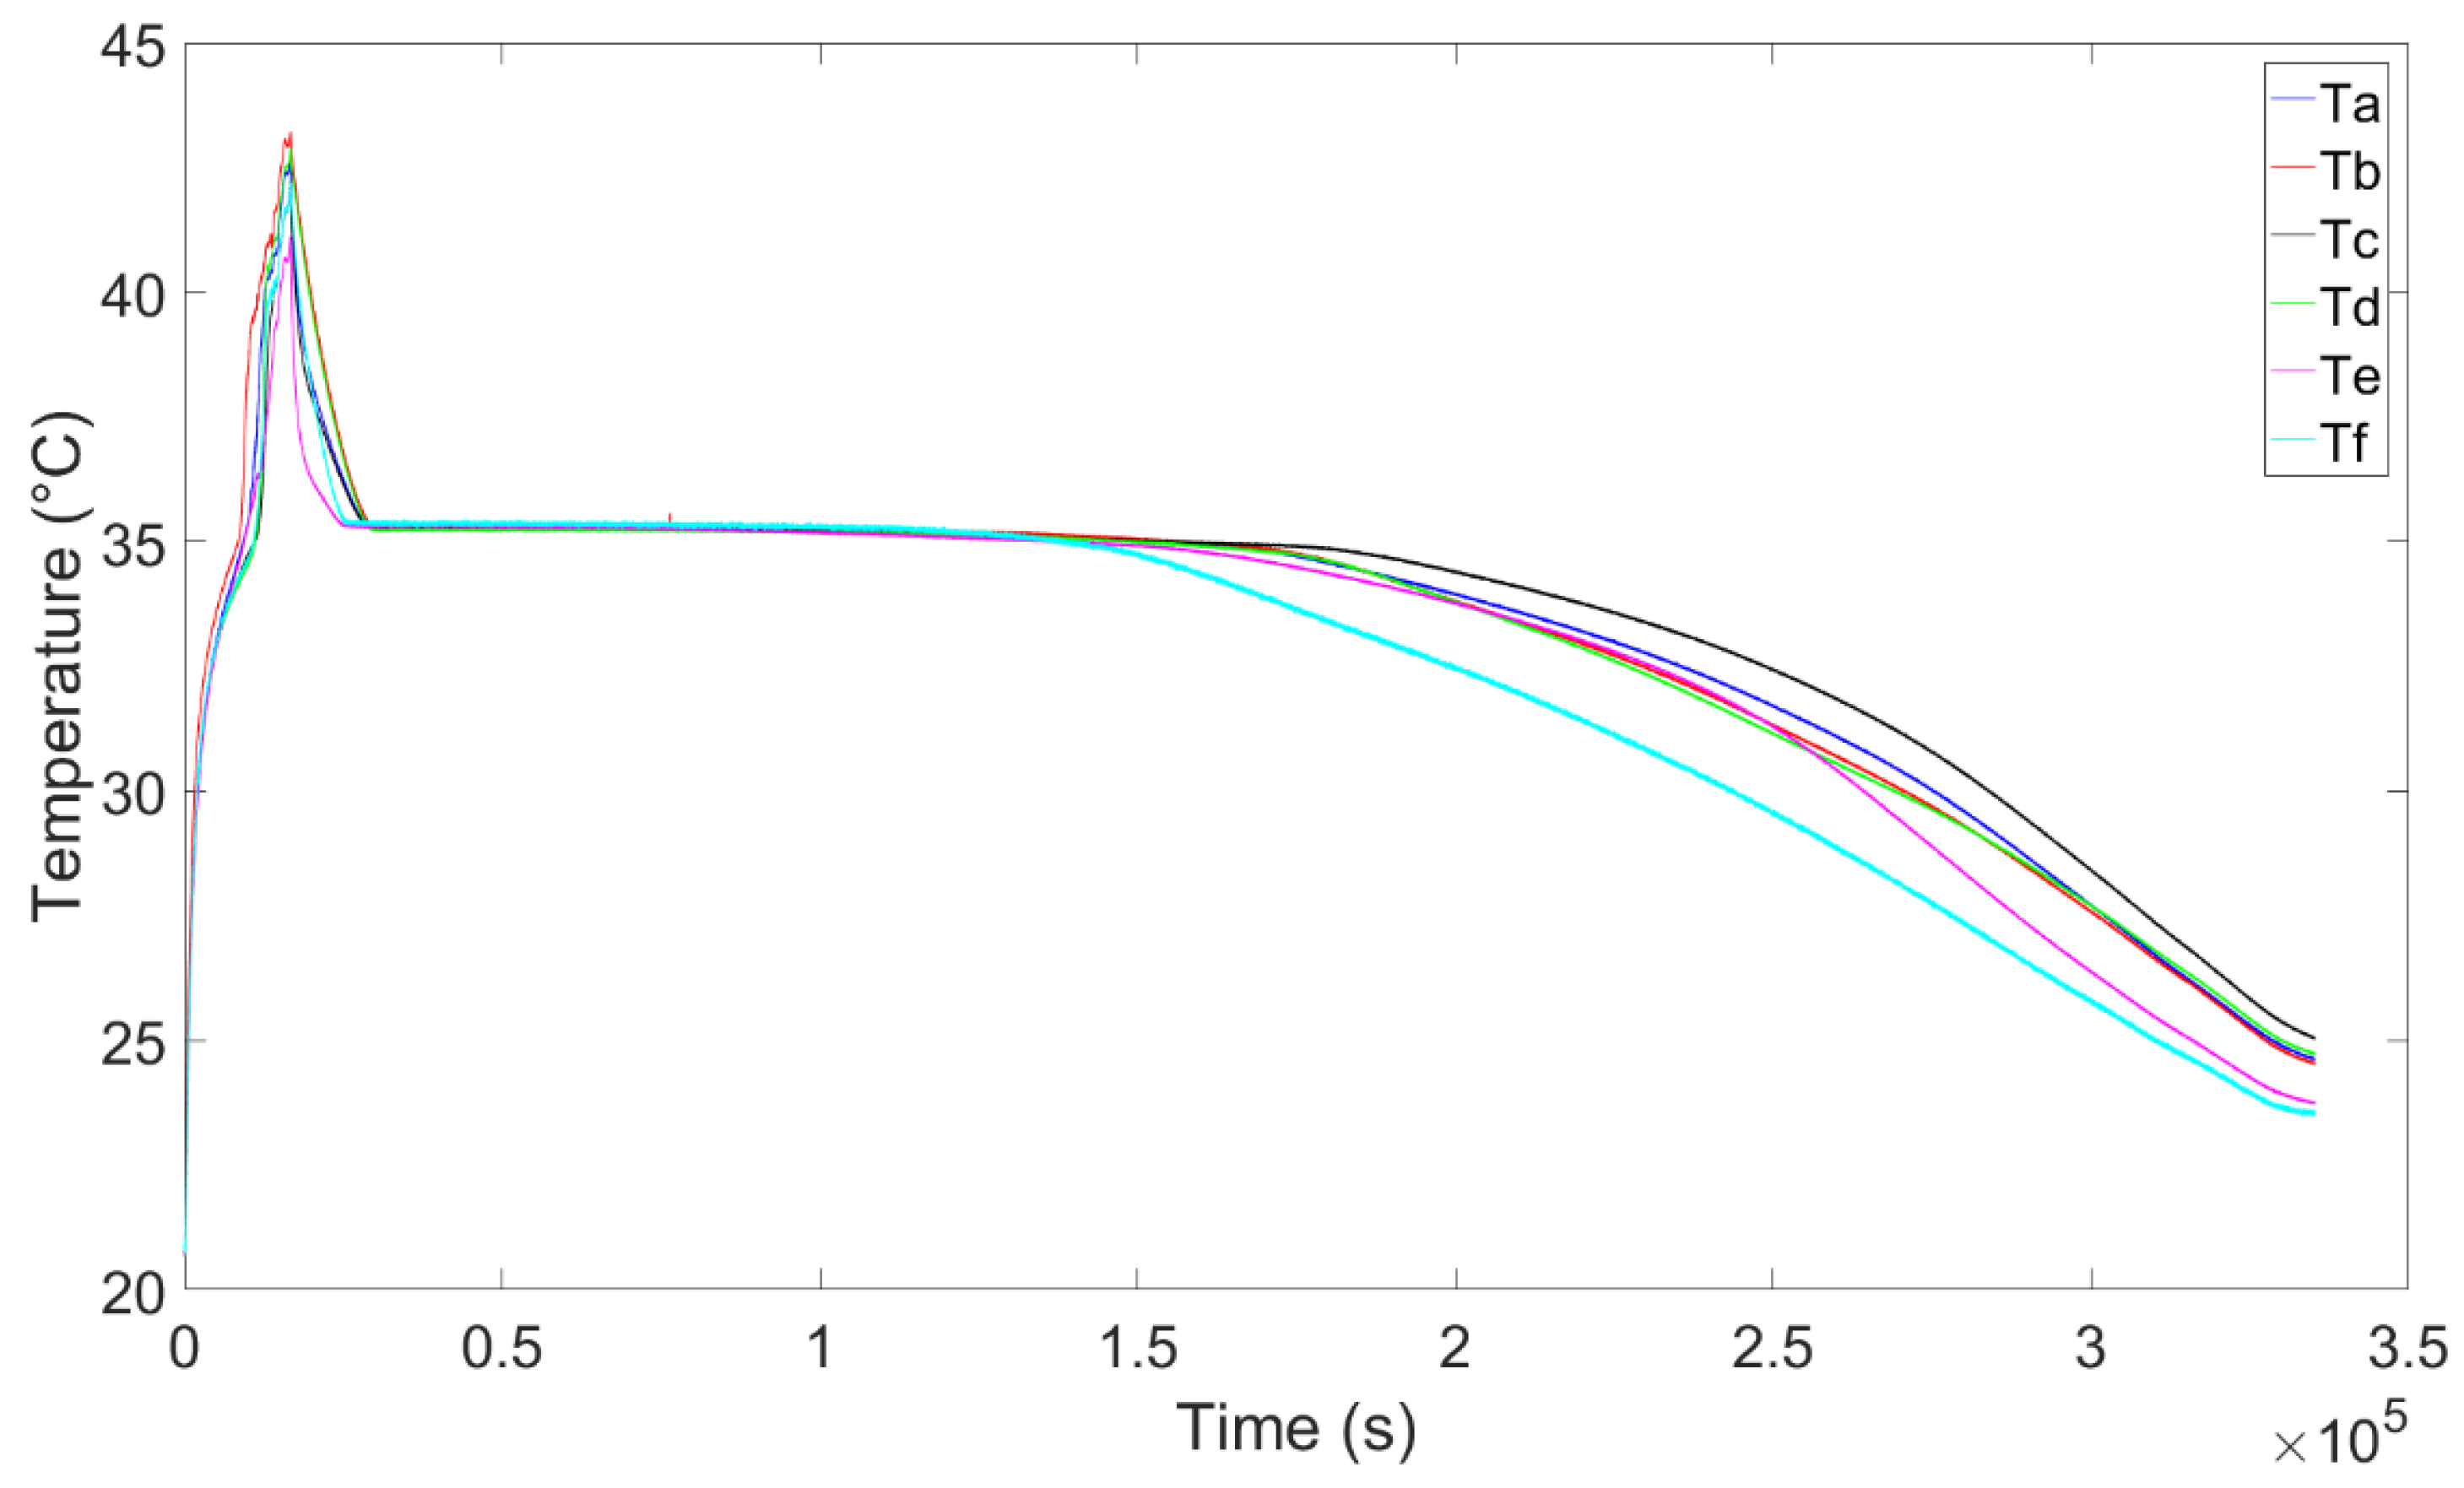
The PCM temperature trend at the different measuring points is shown in Figure 15 and Figure 16. In addition to the considerations already made above, in this case we can see the effect of latent heat during recharging, as the material remained at a constant temperature of 35 °C for about 3 h. Subsequently, the PCM cooled significantly, until it reached temperatures around 25 °C.
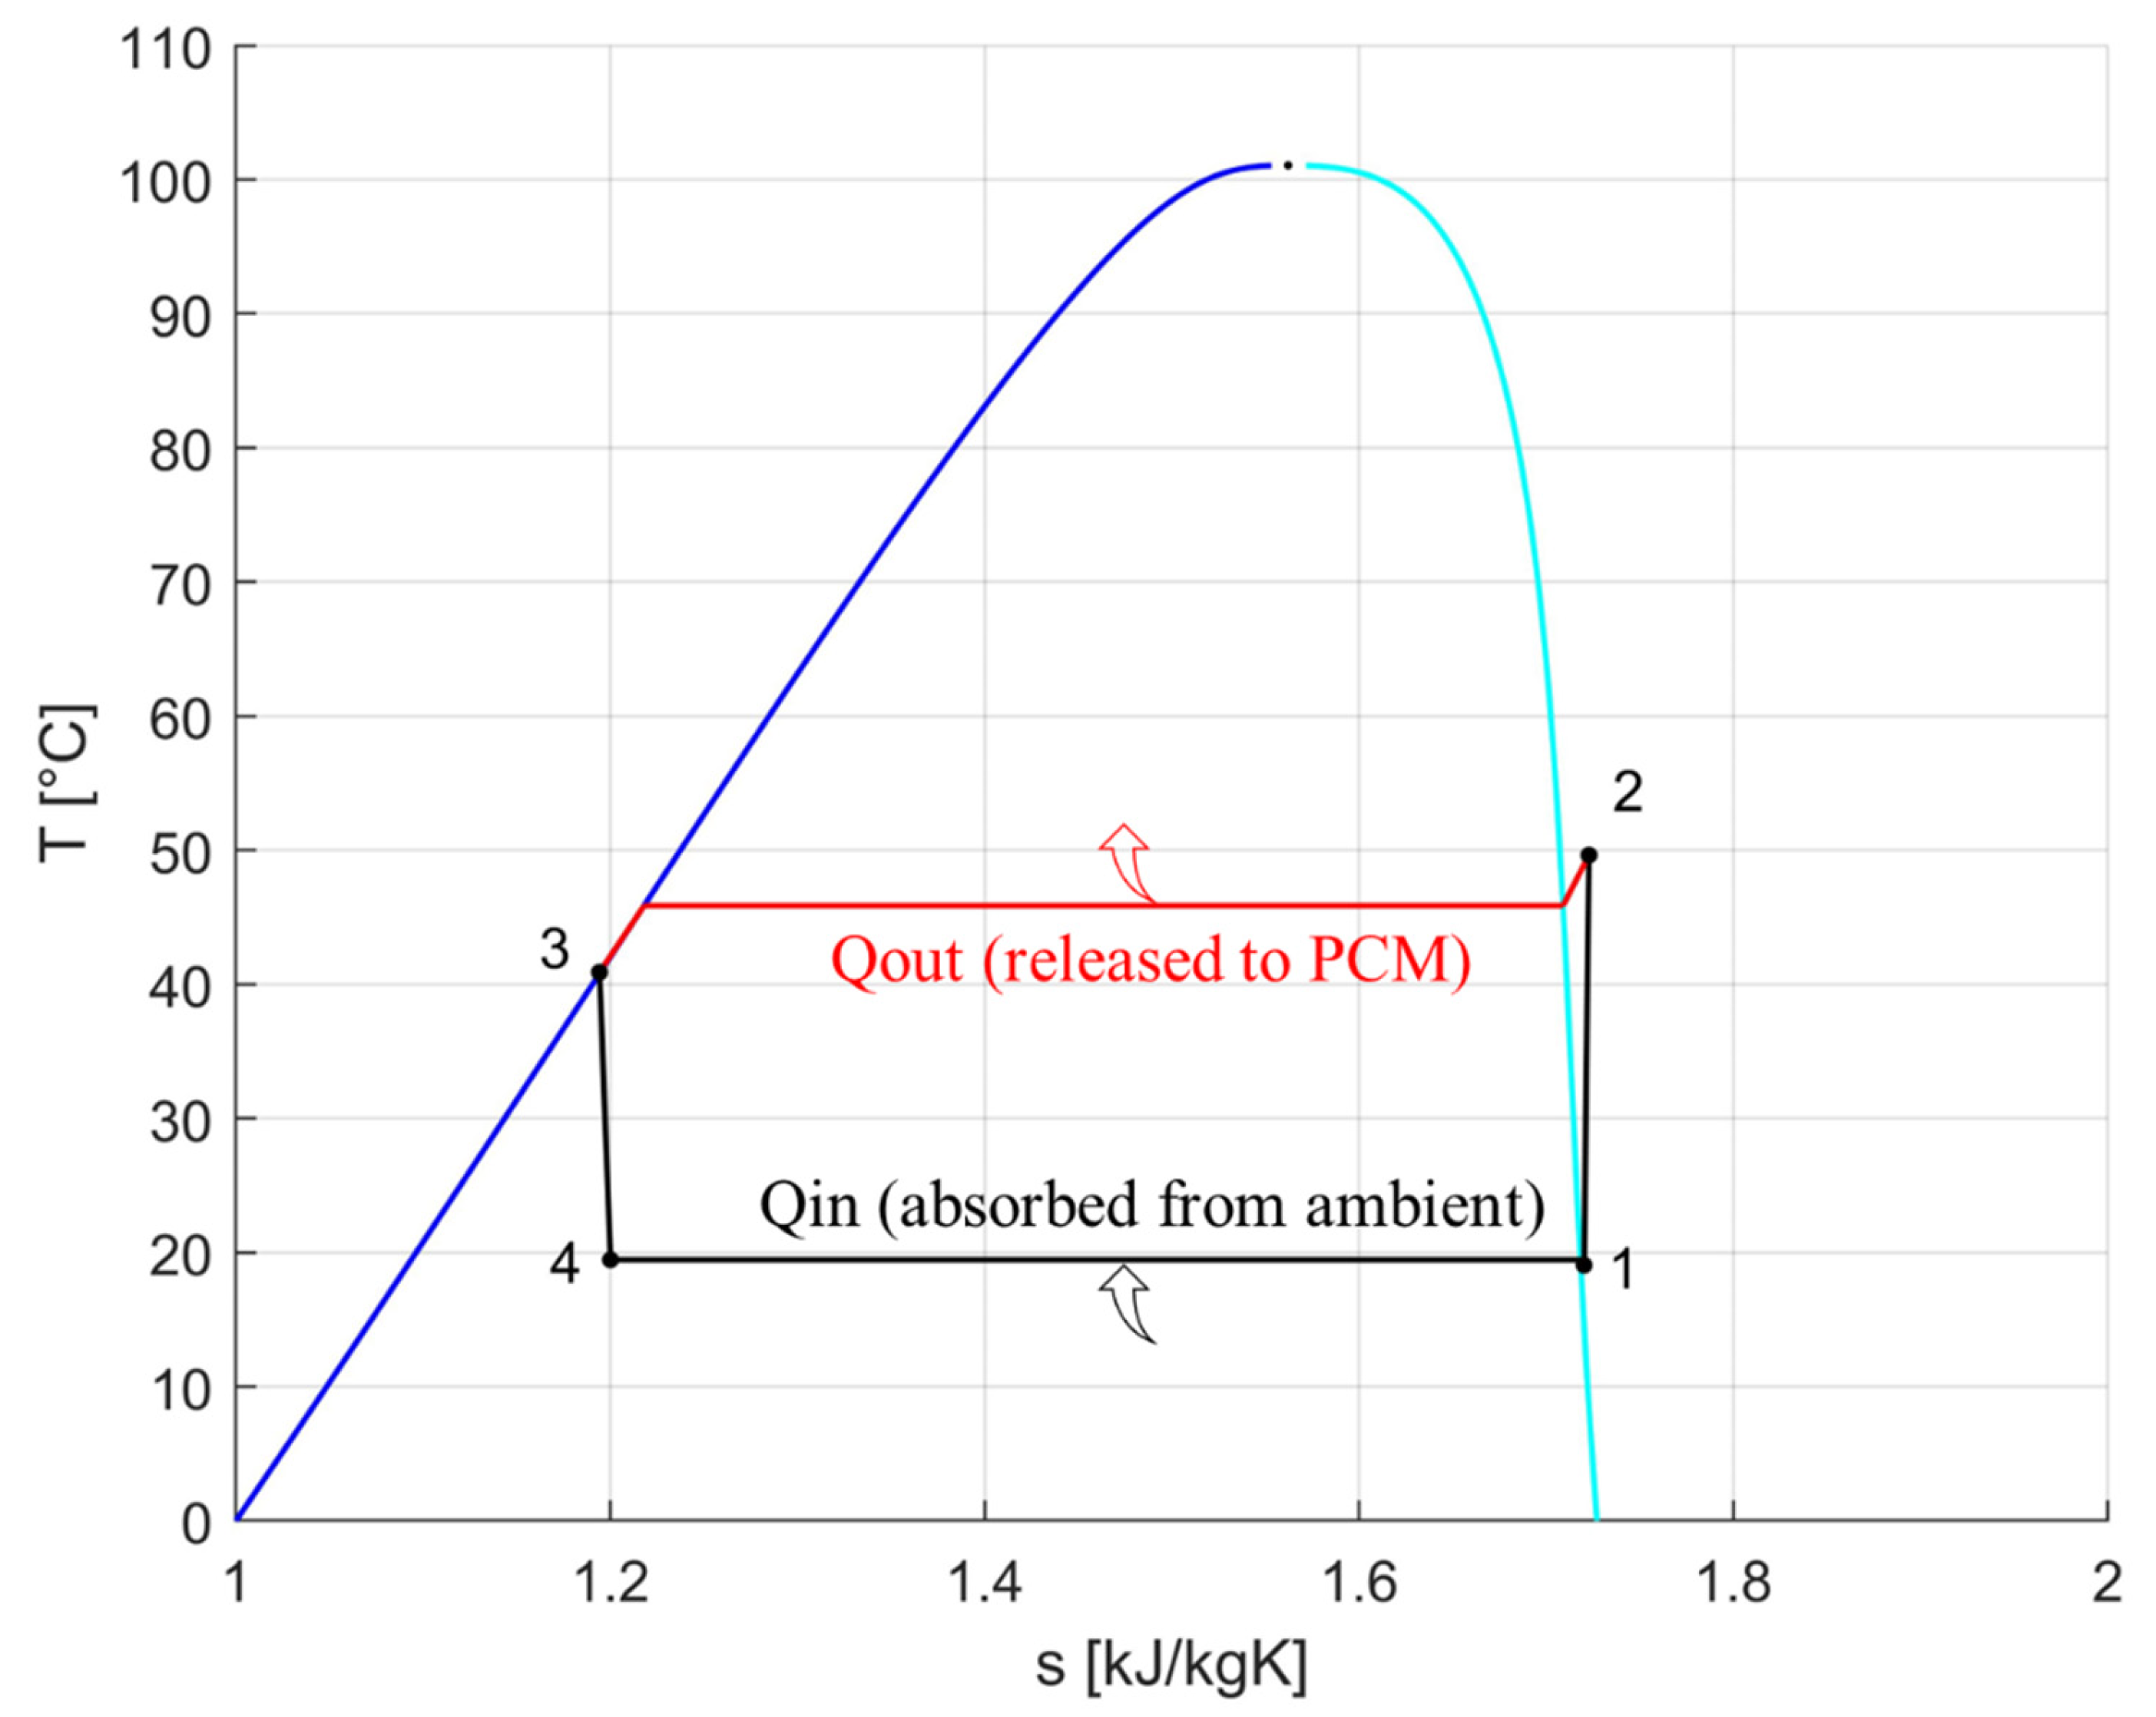
With the results from the experimental tests, although the trend of the temperatures and pressures was not completely stationary, the thermodynamic cycle can be approximately represented. To accomplish this, we use the average temperatures and pressures to identify the four fundamental points of the cycle, excluding the initial transience. We still assumed that the throttling was perfectly adiabatic in order to display the thermodynamic cycle correctly. The main points of the thermodynamic cycle are described in Table 4, while the cycle is visible in Figure 17.
It must be stated that measurement point 2 is not exactly placed at the outlet of the compressor, but it is quite far, while the compressor is not thermally insulated. The real measurement is at a lower temperature than the point that was considered in the following table and graph, but, for the previous reasons, in order to represent the cycle correctly, we chose to recalculate the properties of point 2, considering a compressor efficiency equal to 0.95 in order to keep the depicted point close to the “real” point 2, assuming that the fluid has a small temperature decrease. Measurement point 2 is represented in Table 4, where it is referred to as 2*.
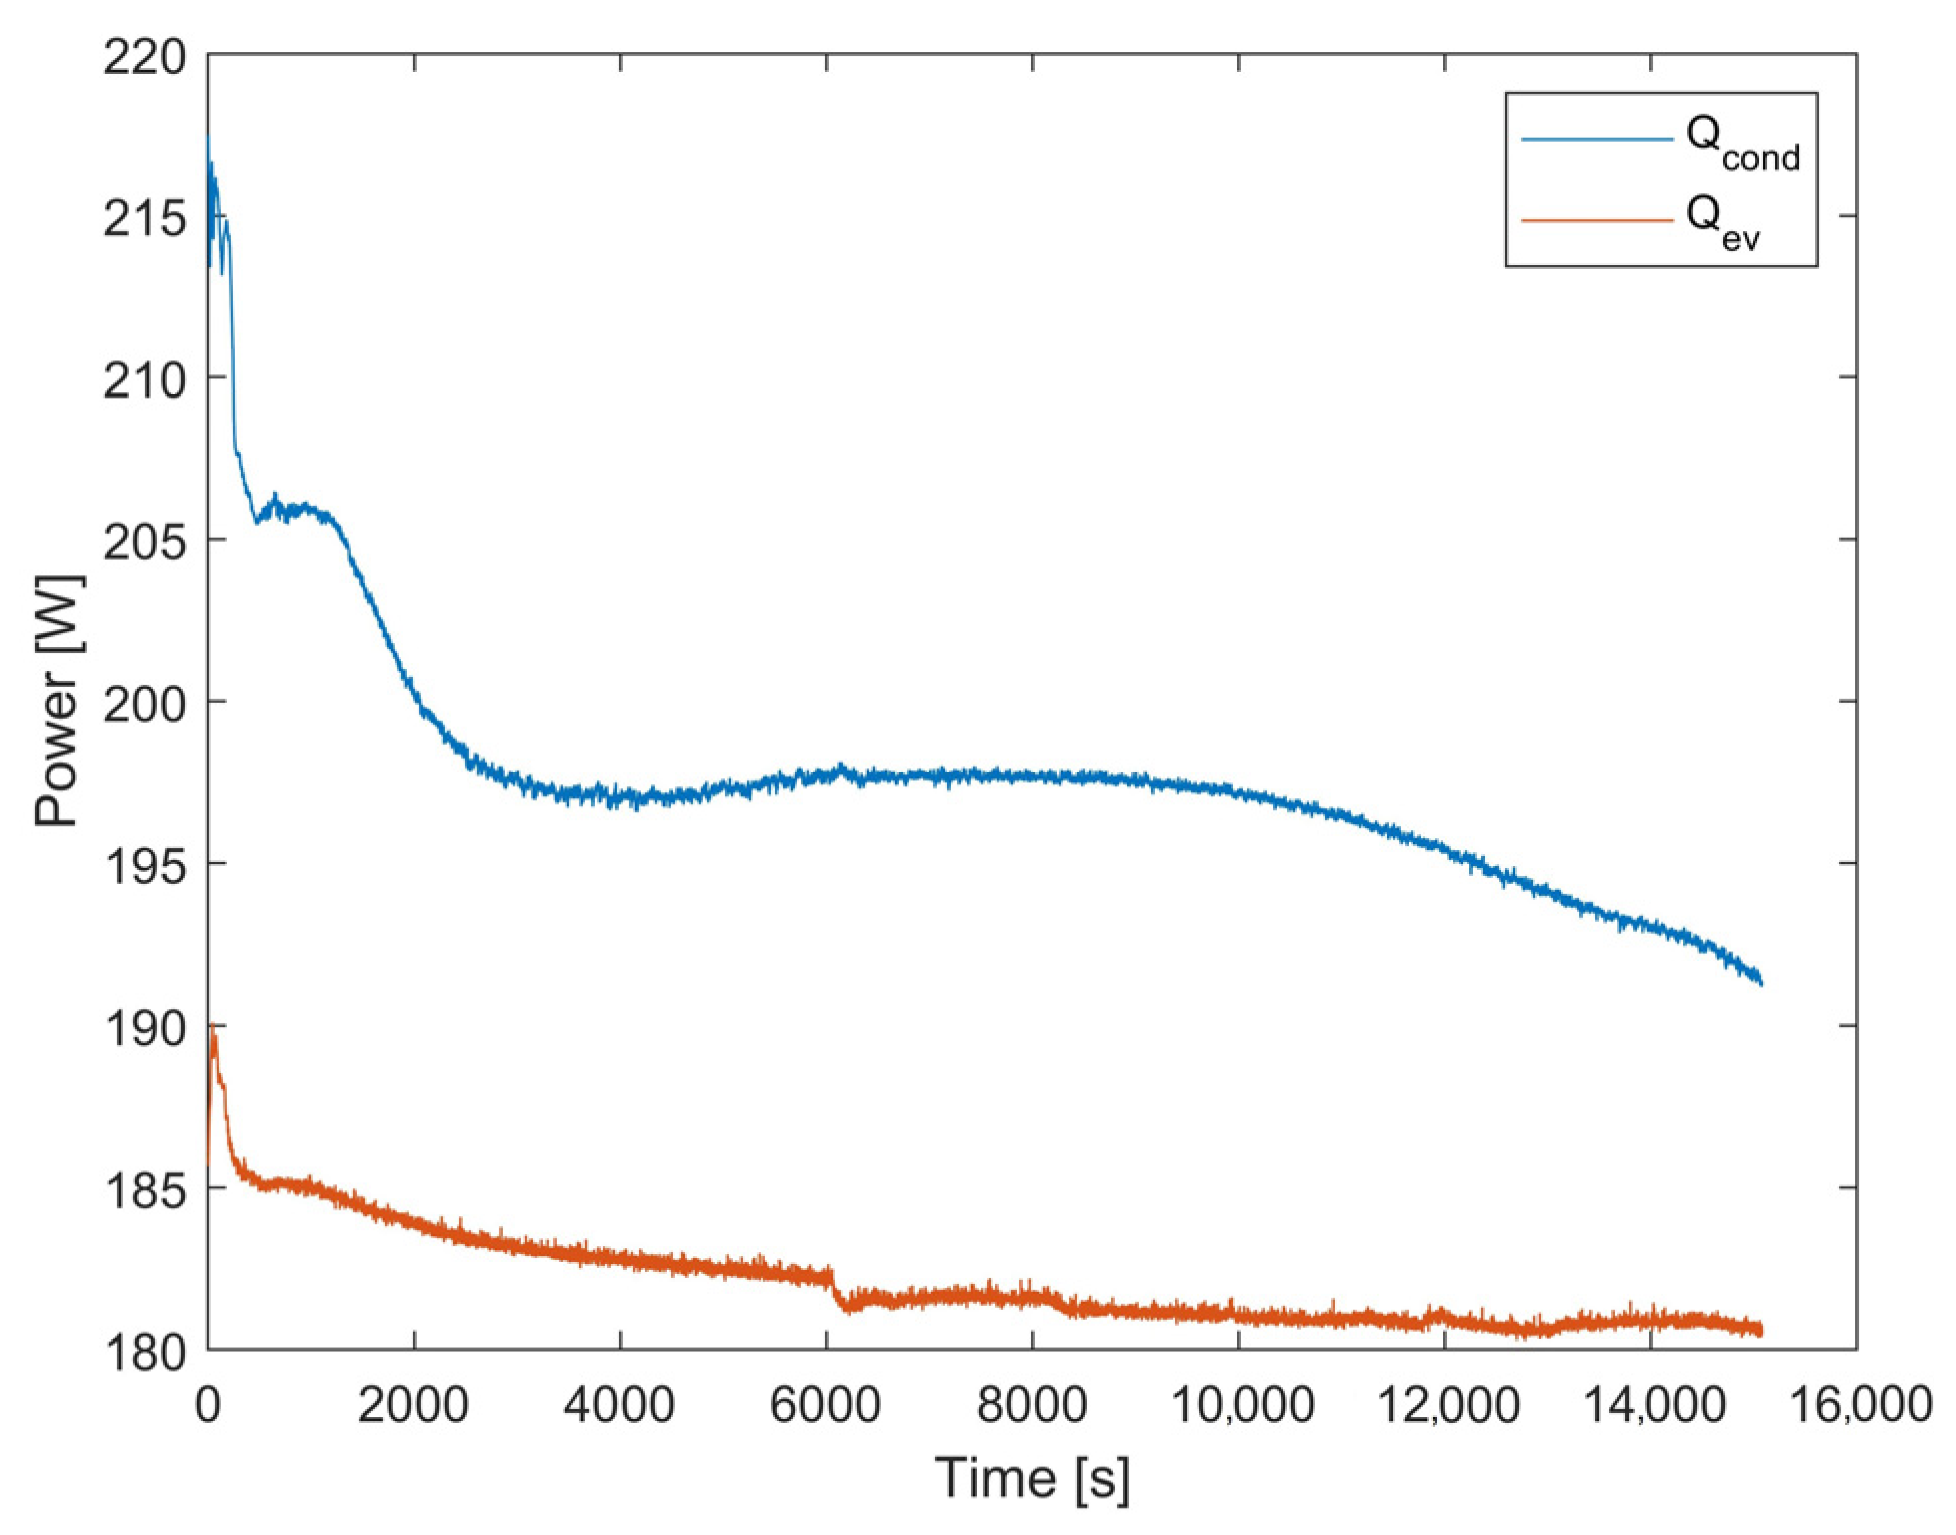
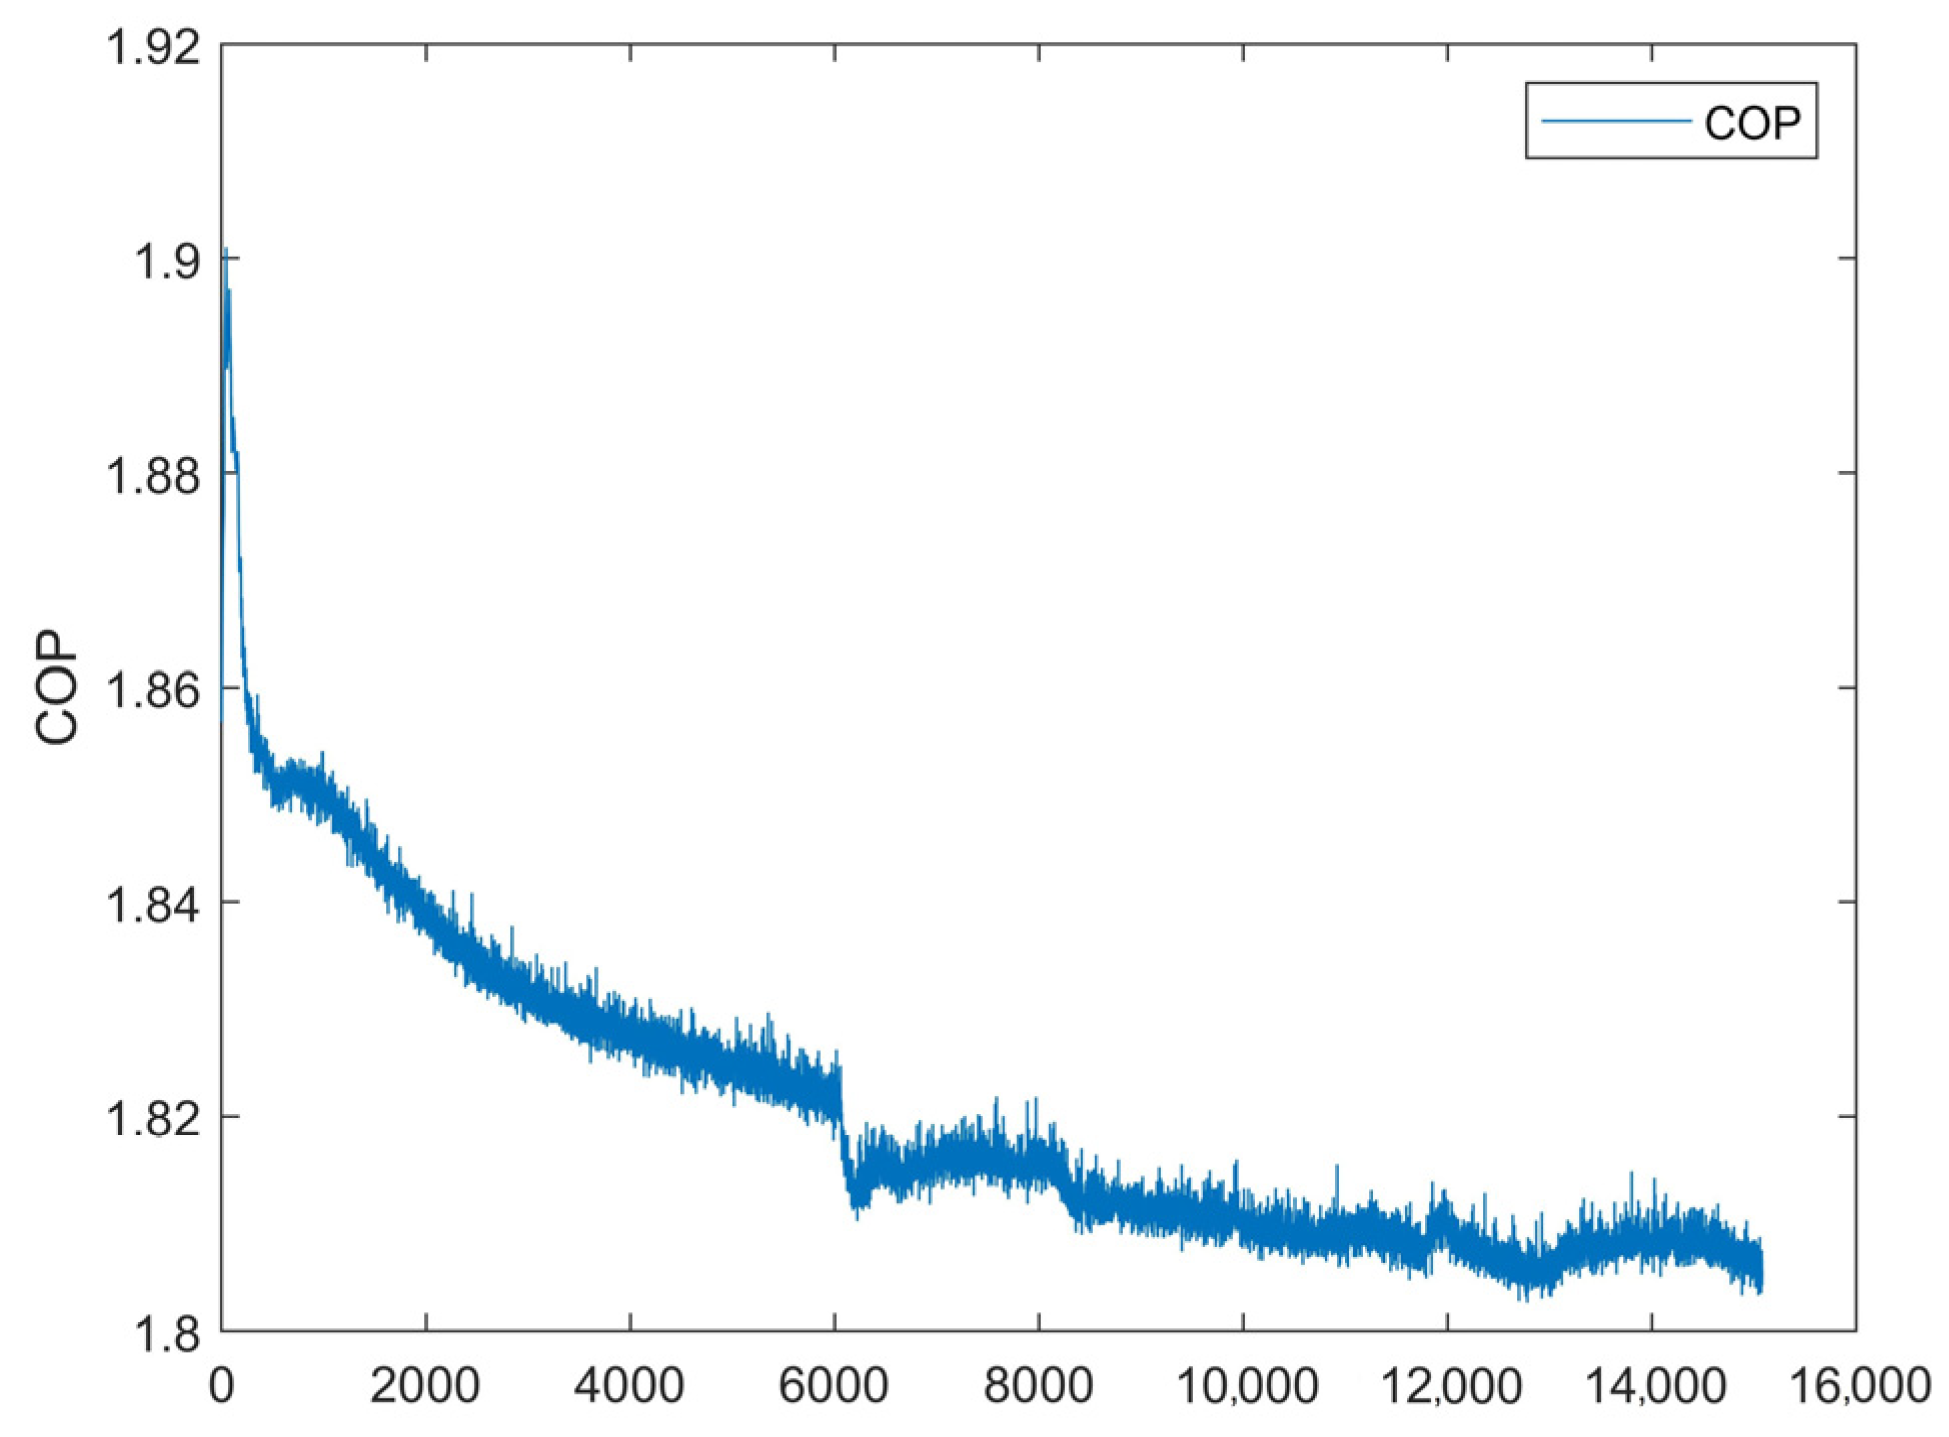
Based on the first test’s measured values, we can represent the most important parameters of the cycle, represented in Figure 18 and Figure 19: the heat released to the PCM (at the condenser); the heat absorbed from the ambient air; and the coefficient of performance (COP), calculated as the ratio between the heat absorbed during evaporation and the power absorbed by the compressor, this last operating constantly to its nominal power (100 W). As shown in Figure 19, the average COP of this system is around 1.82.

5. Simulation Results

This section describes the results obtained from the numerical simulation of the useful phase relative to the first module of the first experimental test reported in Section 4.1, realized with the COMSOL Multiphysics solver installed on a Dell Precision Tower 7910, with the processor Intel(R) Xeon(R) CPU E5-2680 v3 @ 2.50 GHz and 32.0 GB RAM. Initially, the PCM and R134a were simulated separately and coupled iteratively, until the convergence of the mean heat flux at the serpentine tube outer surface was reached. At a later stage, the two models were coupled to obtain a single complete model. The following results are those obtained from the implementation of the complete model.

5.1. Simulation Model Implementation and Validation

In order to validate the model, the time-dependent refrigerant inlet conditions relative to pressure and temperature were set equal to the corresponding experimental data, while the inlet dispersed phase volume fraction was assumed to be equal to 1, meaning that the refrigerant was completely in the gaseous phase at the inlet. The inlet velocity was also set as time-dependent since it depended on the refrigerant density and, consequently, on the temperature. The box external walls were considered adiabatic, and zero derivative conditions were set at the outlet. Figure 20 shows the inlet velocity temporal profile, calculated using Equation (21).
The set of equations were solved using a segregated approach: the mass, momentum, and energy equations were solved via a direct solver (PARDISO), while the dispersed phase transport equation was solved through the GMRES iterative solver. Three meshes were tested in order to evaluate the mesh independency of the numerical results: mesh 1 consisted of 303,640 domain elements, 33,482 boundary elements, and 163 edge elements; mesh 2 consisted of 359,034 domain elements, 36,178 boundary elements, and 233 edge elements; mesh 3 consisted of 437,433 domain elements, 39,938 boundary elements, and 243 edge elements. The simulations times for meshes 1, 2, and 3 to obtain the numerical results reported in this section were 204,541 s (2 days, 8 h, 49 min, 1 s); 288,069 s (3 days, 8 h, 1 min, 9 s); and 397,992 s (4 days, 14 h, 33 min, 12 s), respectively.
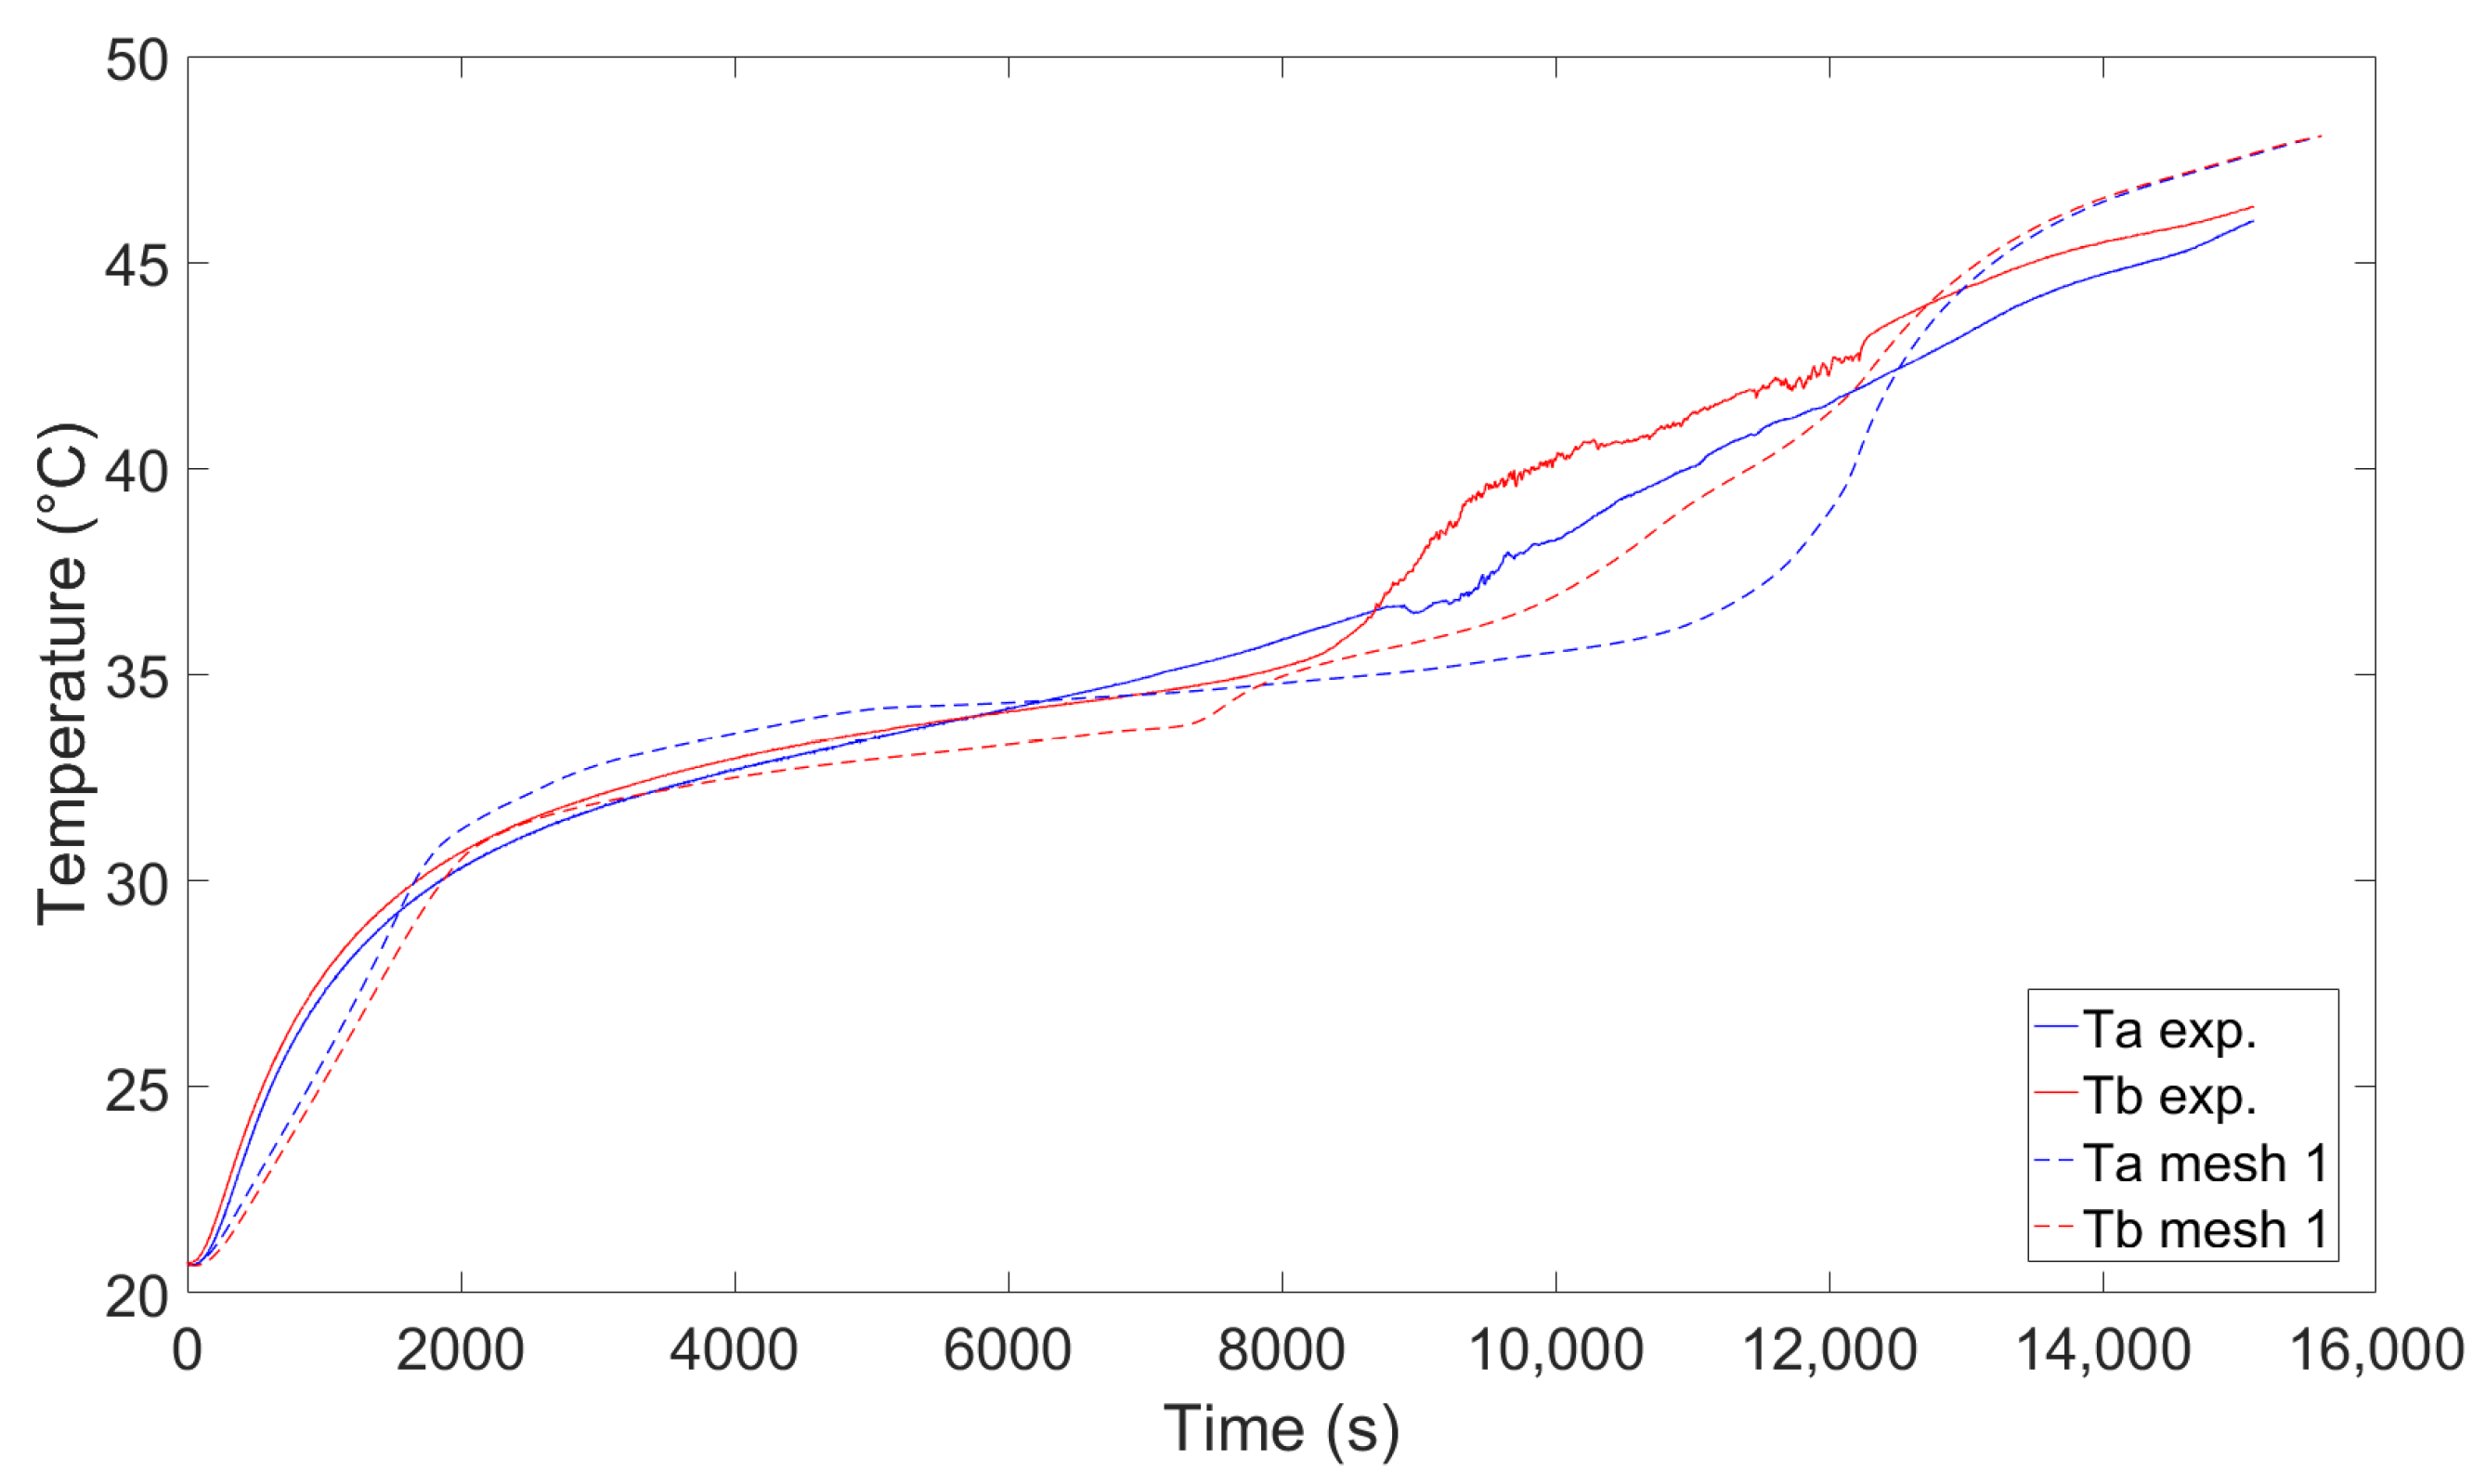
Figure 21 shows the simulated Ta and Tb obtained with the three meshes by means of virtual probes positioned at the same locations of Ta and Tb, reported in Figure 4. These results were all obtained with Amush equal to 103, the parameter r equal to 10, and the value of dT (which represents half of the total temperature melting range) used to define the melted fraction θ T equal to 2 K. This set of tuning parameters represents the combination that will eventually produce the better comparison with the experimental results. It can be noted that the profiles are very close to each other, with those relative to mesh 2 and 3 practically coincident. Finally, Figure 22 shows the best comparison between the experimental and numerical results for Ta and Tb, these last indeed obtained with the above set of tuning parameters and using mesh 2.

5.2. Averaged and 3D Results

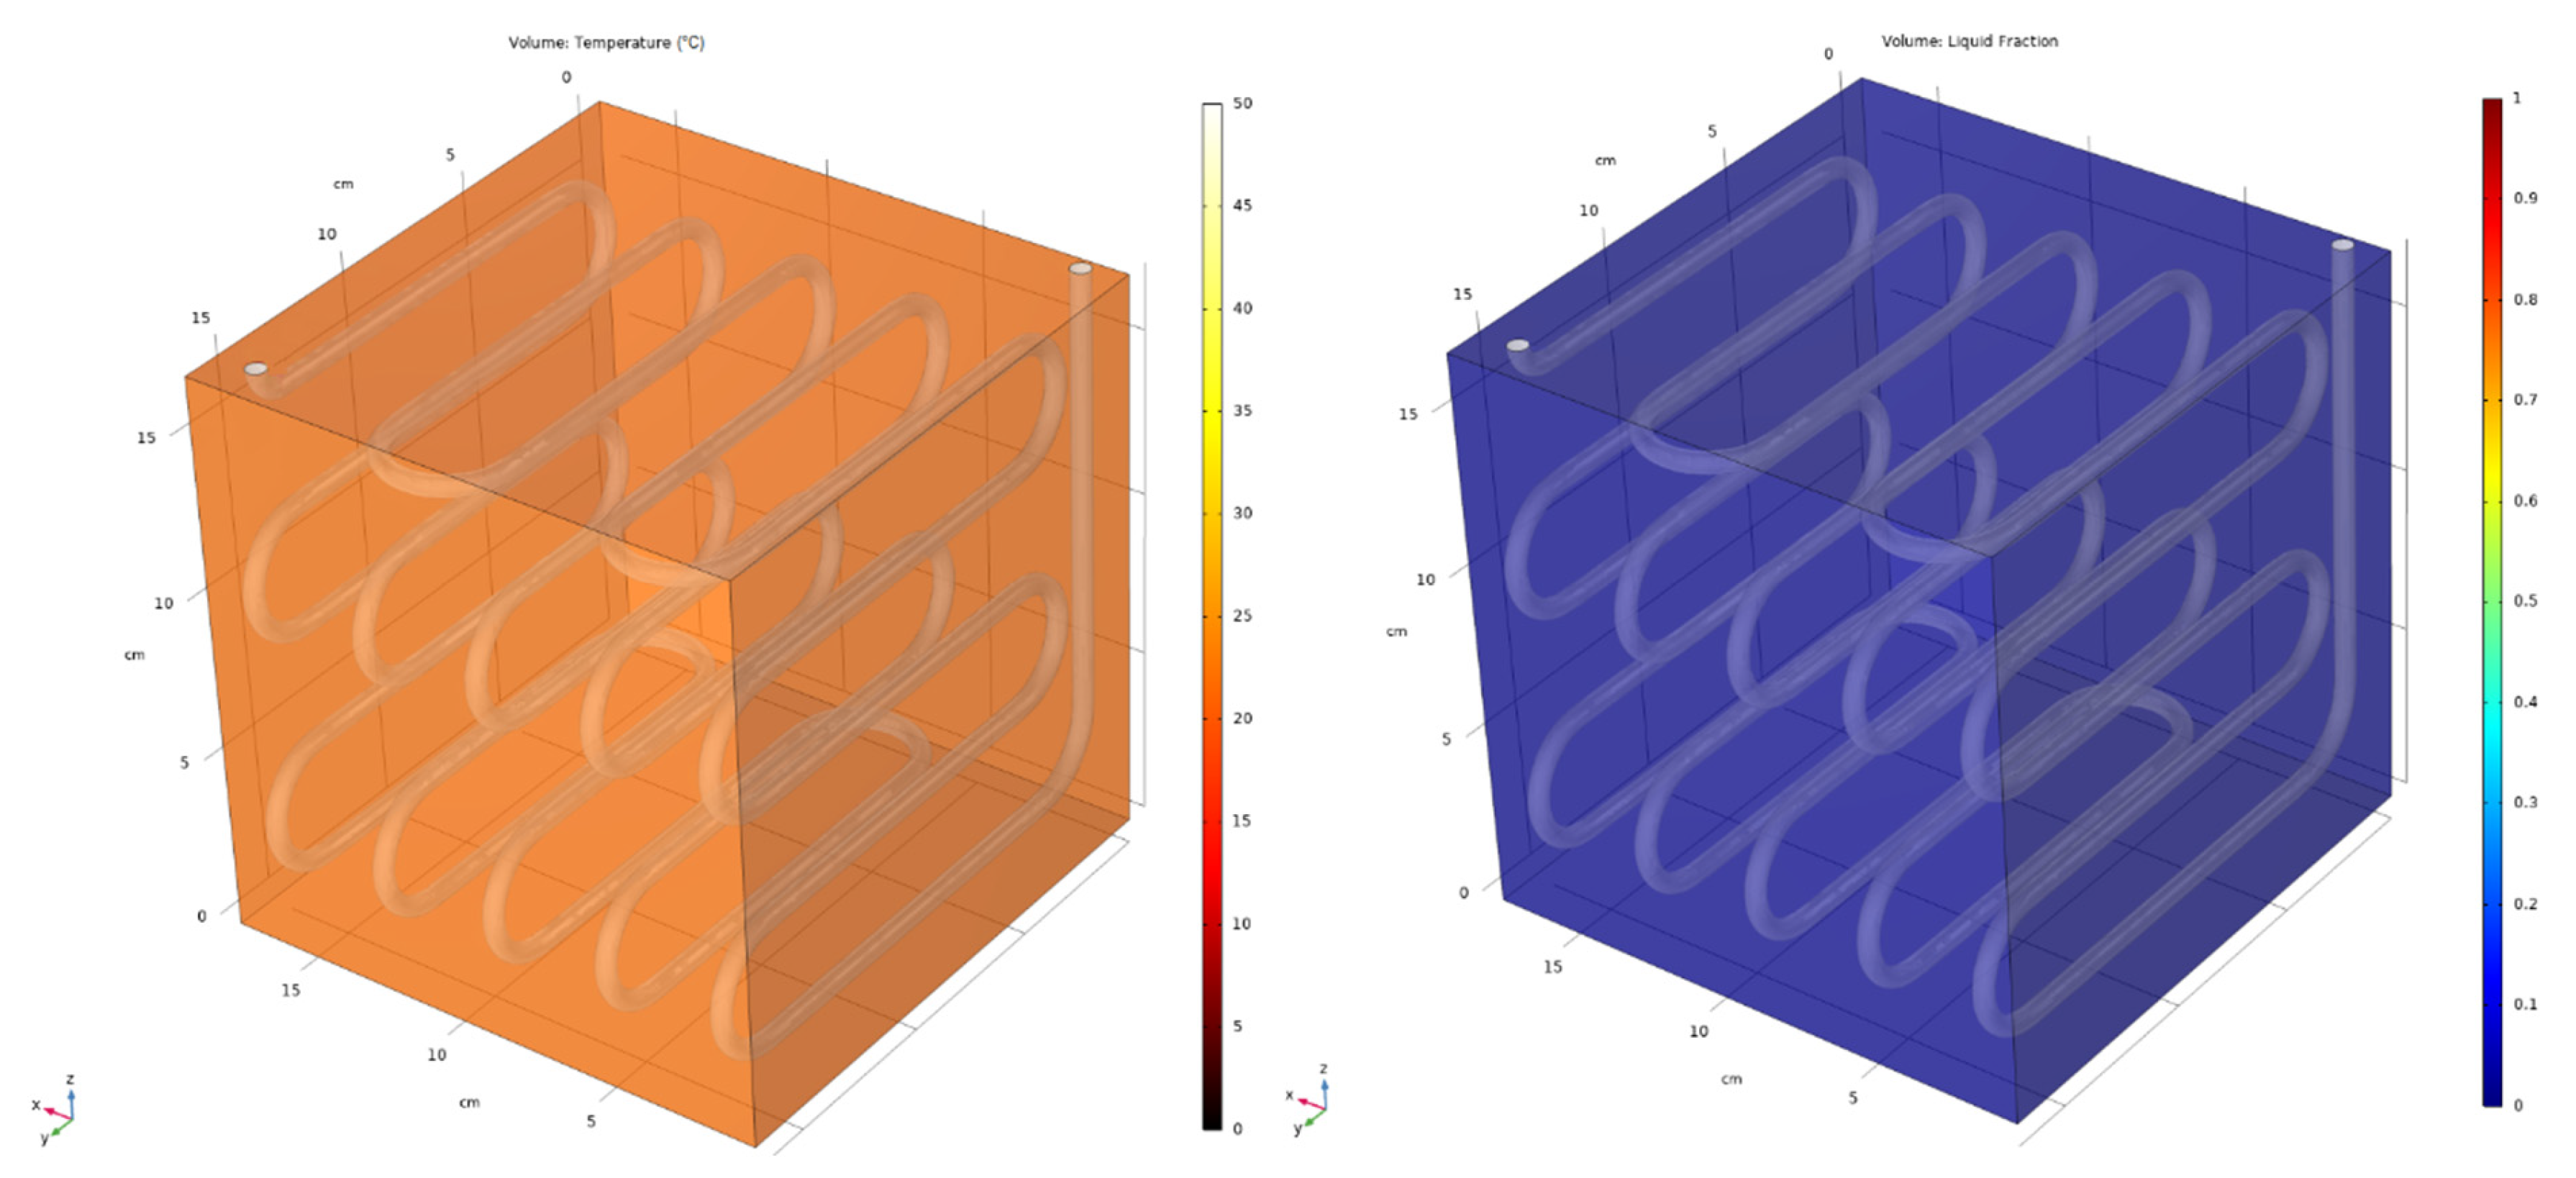
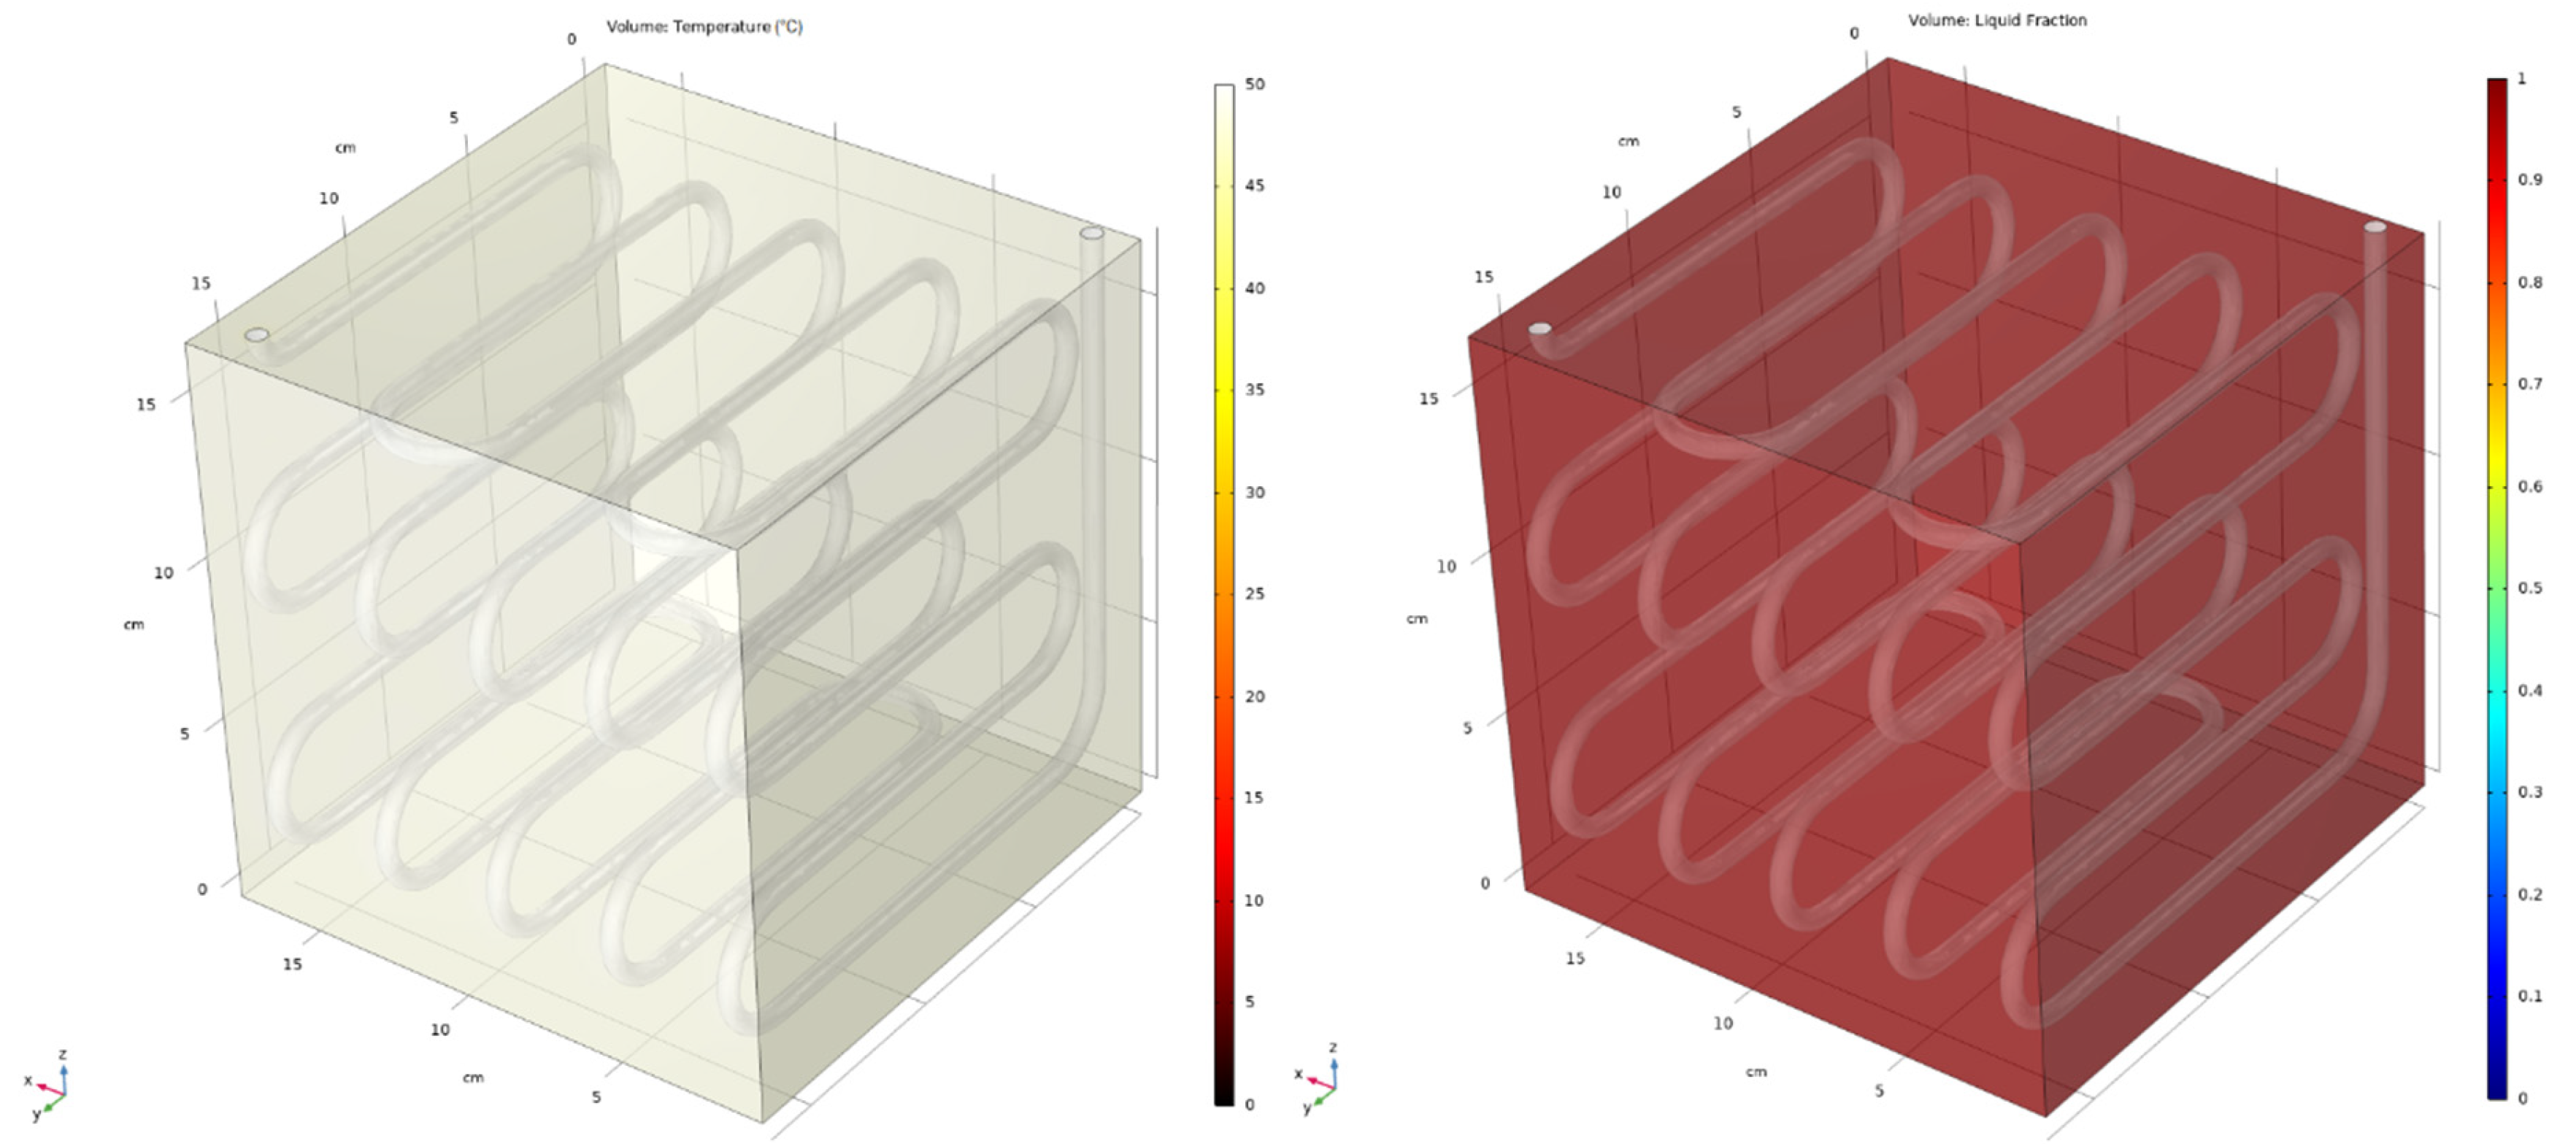
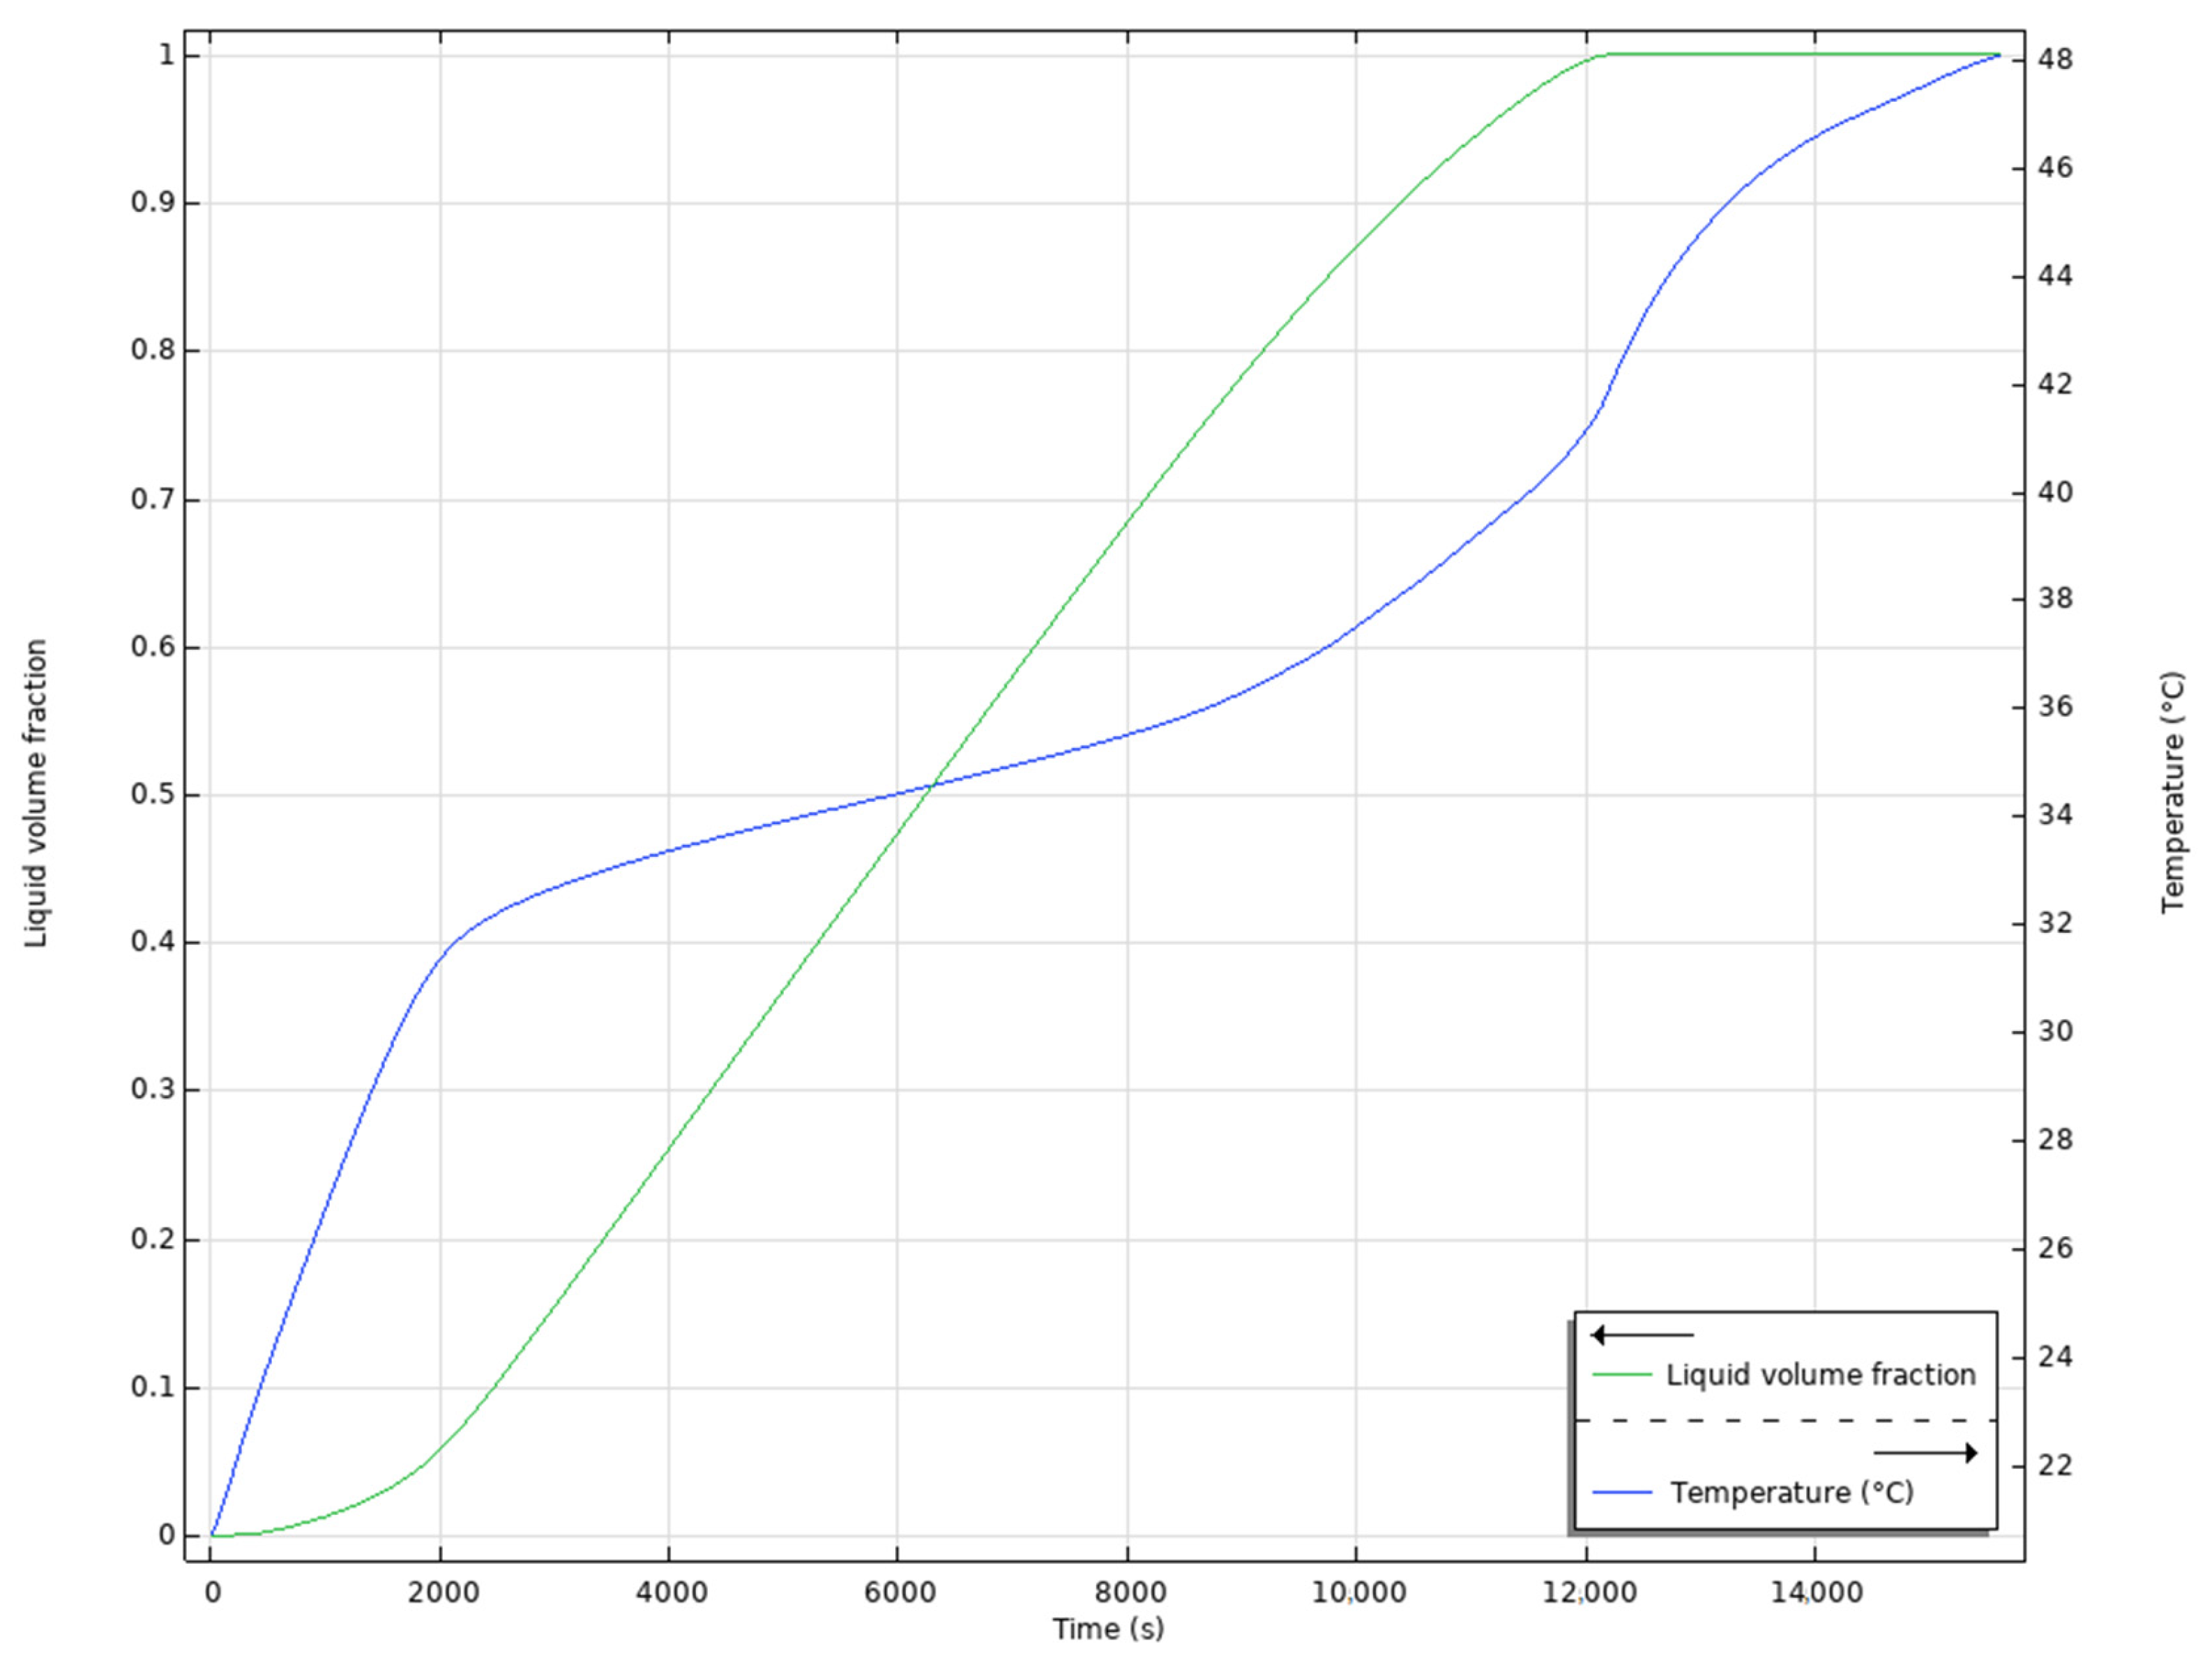
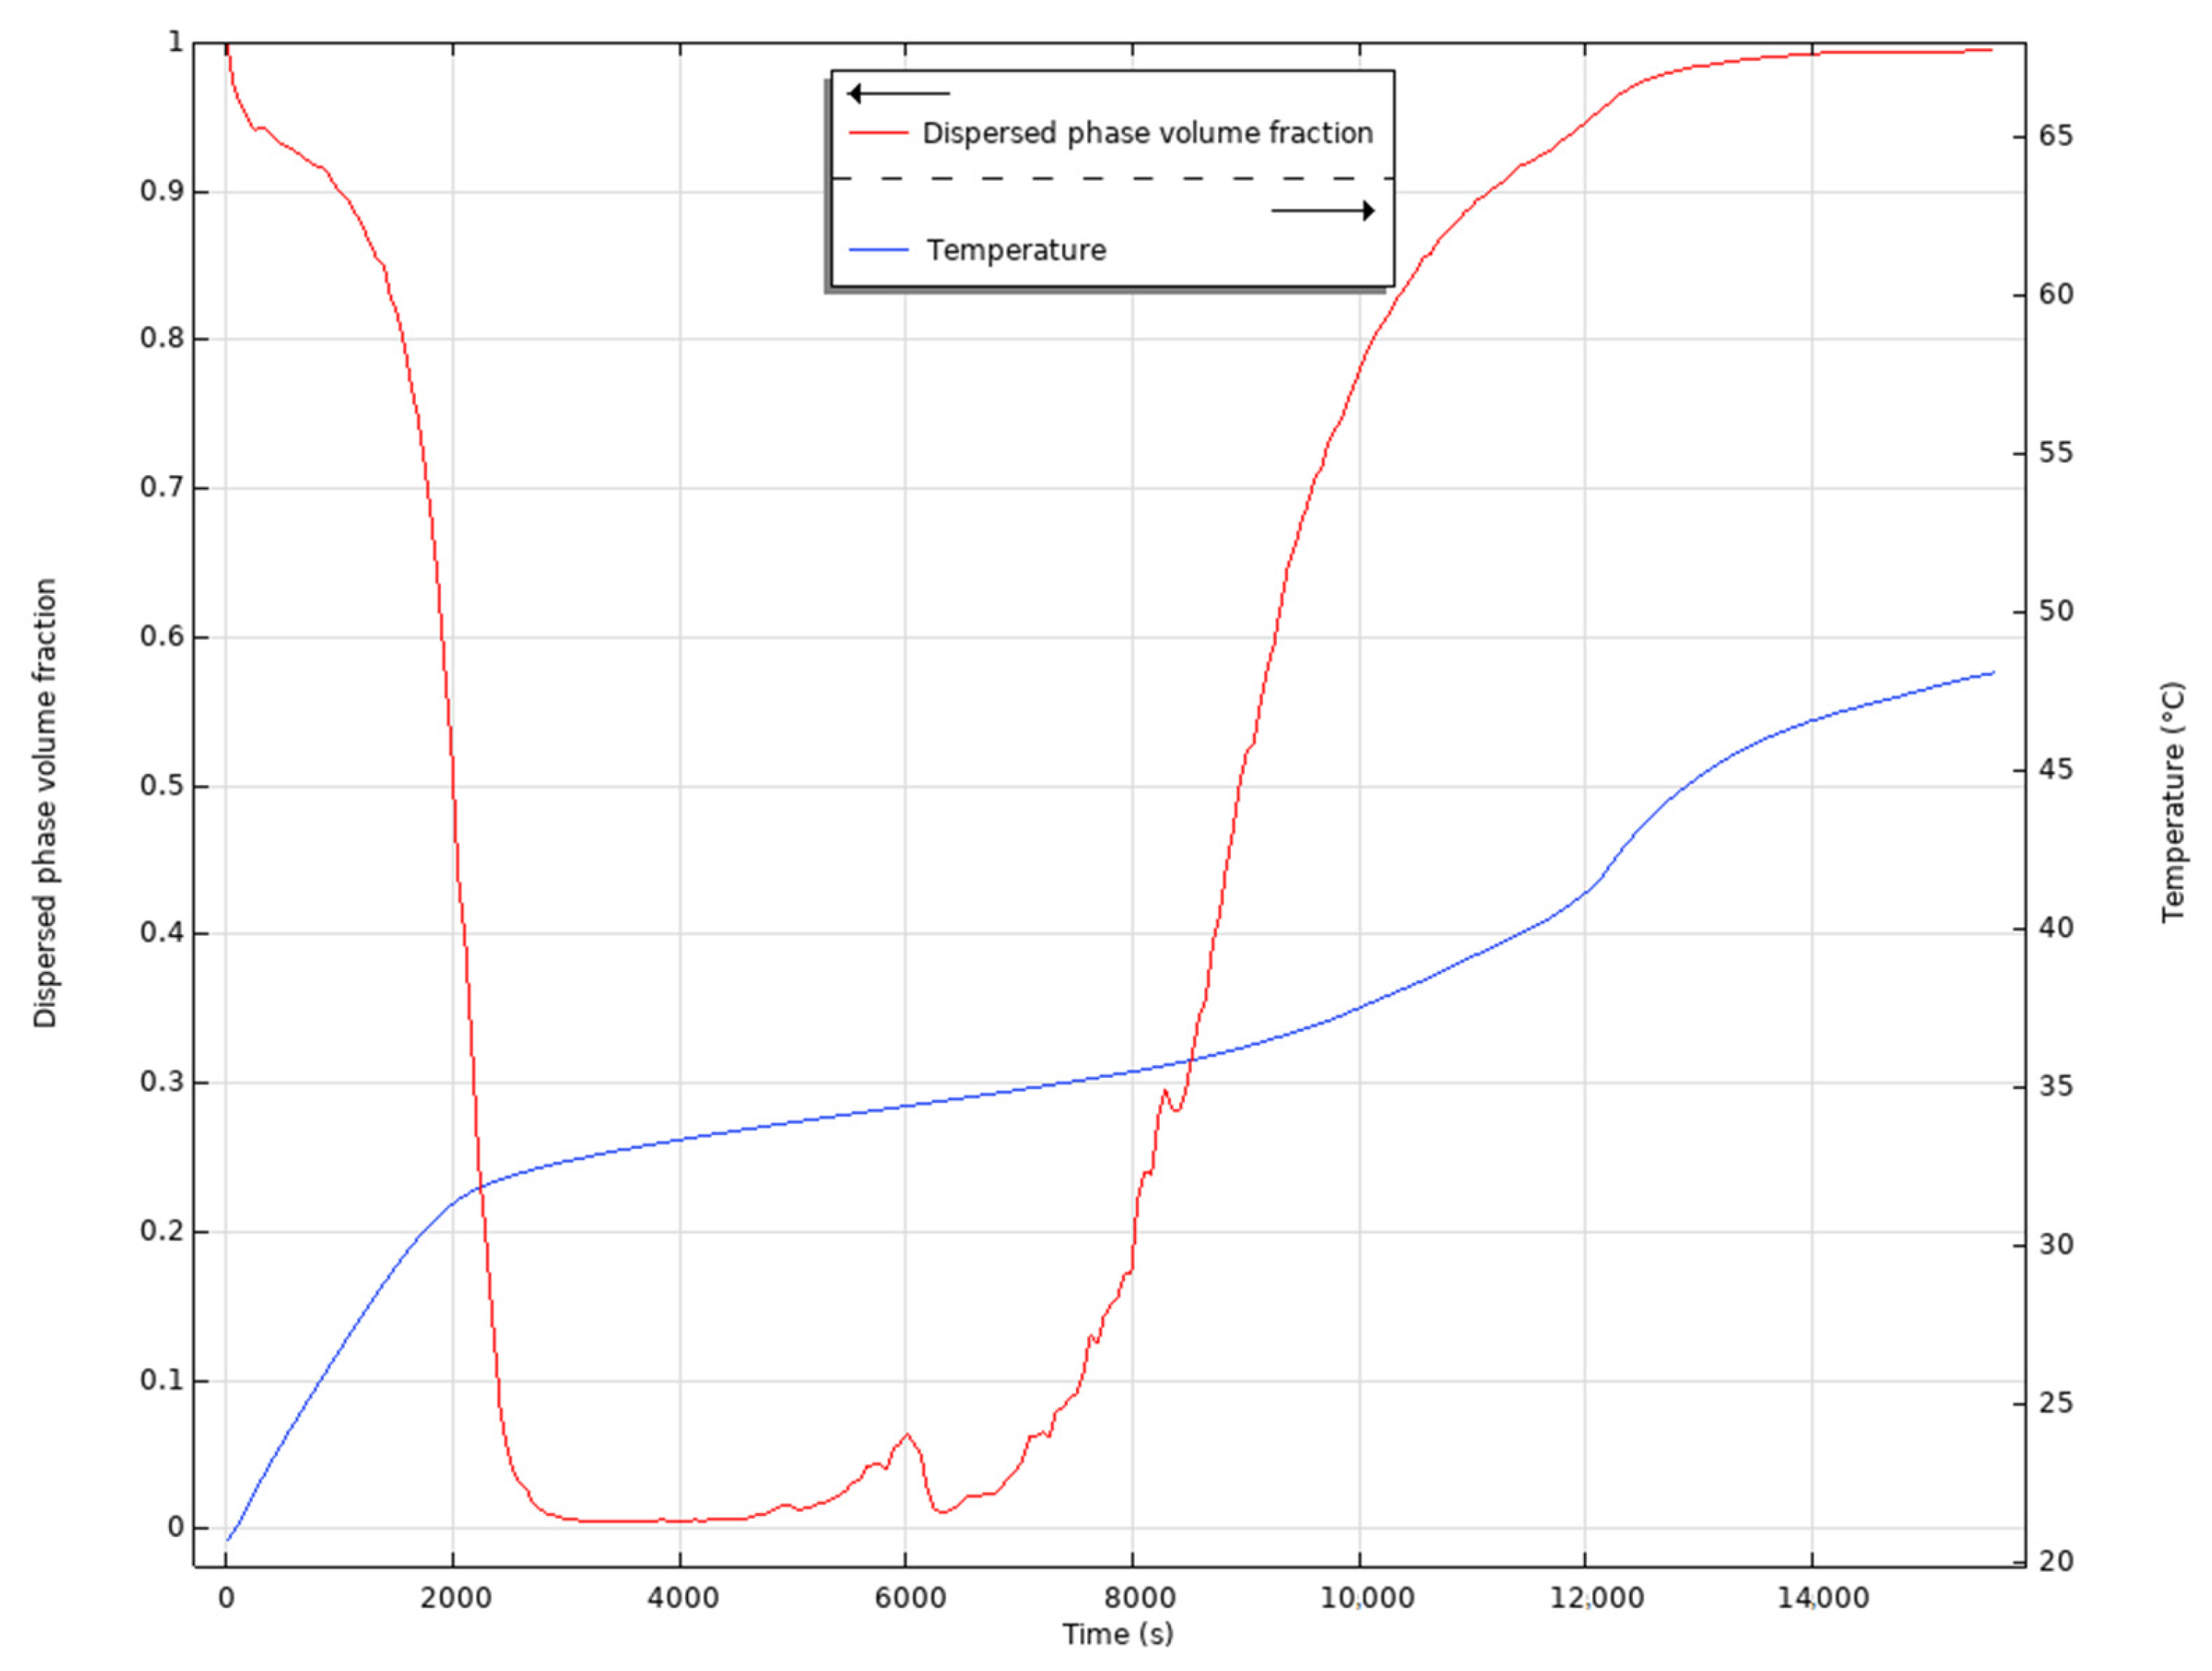
The results reported hereafter refer to mesh 2, and they were obtained with Amush equal to 103, r equal to 10, and the value of dT equal to 2 K. The temperature and PCM liquid fraction fields are represented, at different times, in Figure 23, Figure 24 and Figure 25. For better comprehension, Figure 26 shows the volume average liquid fraction and temperature temporal evolution. As can be deducted from the figure, the whole PCM became liquid after about 12,000 s. This means that the heat transfer with the refrigerant was much higher than the value that was initially estimated, confirming the results obtained from the experimental test. Figure 27 shows the refrigerant dispersed phase volume fraction after 3900 s, during the useful phase of the system. It can be seen that the refrigerant condensed almost completely in the first module, meaning that in the other two modules of the condenser, it will transfer only sensible heat. Figure 28 shows the temporal evolution of the average temperature and the dispersed phase volume fraction evolution at the serpentine pipe outlet section. As can be seen, during the PCM melting, the refrigerant tended to condensate, while it tended to stay in its vapor state when the PCM reached complete melting. This happened because the refrigerant temperature was quite close to the temperature of the PCM.

6. Conclusions

This paper presents the experimental and numerical results obtained within a research activity aimed at developing and validating a numerical model for a low-scale PCM-based condenser to be used within a refrigeration system for personal cooling. For that purpose, a simulation model was developed and implemented using the COMSOL Multiphysics solver, and an experimental apparatus was realized to validate the computations.
The consistency of the adopted model was demonstrated by comparing the numerical results with the experimental ones. Further, the simulations confirmed that the experimental apparatus is oversized as compared to the theoretical refrigeration cycle developed in the pre-design phase. Finally, even though the simulation model is highly computationally demanding, as it simulates complex physics involving two different materials that are subjected to phase change, it allows evaluating the proper design for a similar system, without the need for expensive experimental tests, and thus, it can be useful to researchers and engineers involved in similar studies.

Author Contributions

Conceptualization, A.C. and L.M.; Methodology, A.C. and L.M.; Software, A.C.; Validation, A.C., L.M., M.I. and N.B.; Investigation, A.C.; Writing—original draft, A.C.; Writing—review & editing, L.M., M.I. and N.B.; Supervision, L.M., M.I. and N.B. All authors have read and agreed to the published version of the manuscript.

Funding

This research received no external funding.

Data Availability Statement

The data presented in this study are available on request from the corresponding author.

Conflicts of Interest

The authors declare no conflict of interest.

References

  1. Veselý, M.; Zeiler, W. Personalized Conditioning and Its Impact on Thermal Comfort and Energy Performance—A Review. Renew. Sustain. Energy Rev. 2014, 34, 401–408. [Google Scholar] [CrossRef] [Green Version]
  2. Hoyt, T.; Arens, E.; Zhang, H. Extending air temperature setpoints: Simulated energy savings and design considerations for new and retrofit buildings. Build. Environ. 2015, 88, 89–96. [Google Scholar] [CrossRef] [Green Version]
  3. Arens, E.; Humphreys, M.A.; de Dear, R.; Zhang, H. Are “class A” temperature requirements realistic or desirable? Build. Environ. 2010, 45, 4–10. [Google Scholar] [CrossRef] [Green Version]
  4. Zhu, S.; Dalgo, D.; Srebric, J.; Kato, S. Cooling efficiency of a spot-type personalized air-conditioner. Build. Environ. 2017, 121, 35–48. [Google Scholar] [CrossRef]
  5. Sharma, S.D.; Sagara, K. Latent heat storage materials and systems: A review. Int. J. Green Energy 2005, 2, 1–56. [Google Scholar] [CrossRef]
  6. Nkwetta, D.N.; Haghighat, F. Thermal energy storage with phase change material—A state-of-the art review. Sustain. Cities Soc. 2014, 10, 87–100. [Google Scholar] [CrossRef]
  7. Beyne, W.; T’Jollyn, I.; Lecompte, S.; Cabeza, L.F.; De Paepe, M. De Paepe Standardised methods for the determination of key performance indicators for thermal energy storage heat exchangers. Renew. Sustain. Energy Rev. 2023, 176, 113139. [Google Scholar] [CrossRef]
  8. Medrano, M.; Yilmaz, M.O.; Nogués, M.; Martorell, I.; Roca, J.; Cabeza, L.F. Experimental evaluation of commercial heat exchangers for use as PCM thermal storage systems. Appl. Energy 2009, 86, 2047–2055. [Google Scholar] [CrossRef]
  9. Raj, V.A.A.; Velraj, R. Heat transfer and pressure drop studies on a PCM-heat exchanger module for free cooling applications. Int. J. Therm. Sci. 2011, 50, 1573–1582. [Google Scholar]
  10. Bianco, N.; Fragnito, A.; Iasiello, M.; Mauro, G.M.; Mongibello, L. Multi-objective optimization of a phase change material-based shell-and-tube heat exchanger for cold thermal energy storage: Experiments and numerical modeling. Appl. Therm. Eng. 2022, 215, 119047. [Google Scholar] [CrossRef]
  11. Fragnito, A.; Bianco, N.; Iasiello, M.; Mauro, G.M.; Mongibello, L. Experimental and numerical analysis of a phase change material-based shell-and-tube heat exchanger for cold thermal energy storage. J. Energy Storage 2022, 56, 105975. [Google Scholar] [CrossRef]
  12. Hosseini, M.J.; Rahimi, M.; Bahrampoury, R. Experimental and computational evolution of a shell and tube heat exchanger as a PCM thermal storage system. Int. Commun. Heat Mass Transf. 2014, 50, 128–136. [Google Scholar] [CrossRef]
  13. Yu, M.; Sun, X.; Su, W.; Li, D.; Shen, J.; Zhang, X.; Jiang, L. Investigation on the Melting Performance of a Phase Change Material Based on a Shell-and-Tube Thermal Energy Storage Unit with a Rectangular Fin Configuration. Energies 2022, 15, 8200. [Google Scholar] [CrossRef]
  14. Rahimi, M.; Ranjbar, A.A.; Ganji, D.D.; Sedighi, K.; Hosseini, M.J.; Bahrampoury, R. Analysis of geometrical and operational parameters of PCM in a fin and tube heat exchanger. Int. Commun. Heat Mass Transf. 2014, 53, 109–115. [Google Scholar] [CrossRef]
  15. Lv, L.; Zou, Y.; Huang, S.; Wang, X.; Shao, R.; Xue, X.; Rong, Y.; Zhou, H. Experimental study on a pilot-scale medium-temperature latent heat storage system with various fins. Renew. Energy 2023, 205, 499–508. [Google Scholar] [CrossRef]
  16. Stathopoulos, N.; El Mankibi, M.; Issoglio, R.; Michel, P.; Haghighat, F. Air–PCM heat exchanger for peak load management: Experimental and simulation. Sol. Energy 2016, 132, 453–466. [Google Scholar] [CrossRef]
  17. Elarem, R.; Mellouli, S.; Abhilash, E.; Jemni, A. Performance analysis of a household refrigerator integrating a PCM heat exchanger. Appl. Therm. Eng. 2017, 125, 1320–1333. [Google Scholar] [CrossRef]
  18. Ben Nasrallah, S.; Ben Khedher, N. Three-dimensional simulation of a porous thermal energy storage system using solid-liquid phase change material. J. Porous Media 2011, 2011, 777–790. [Google Scholar] [CrossRef]
  19. Qiao, Y.; Cao, T.; Muehlbauer, J.; Hwang, Y.; Radermacher, R. Experimental study of a personal cooling system integrated with phase change material. Appl. Therm. Eng. 2020, 170, 115026. [Google Scholar] [CrossRef]
  20. Cheng, W.L.; Yuan, X.D. Numerical analysis of a novel household refrigerator with shape-stabilized PCM (phase change material) heat storage condensers. Energy 2013, 59, 265–276. [Google Scholar] [CrossRef]
  21. Bakhshipour, S.; Valipour, M.S.; Pahamli, Y. Parametric analysis of domestic refrigerators using PCM heat exchanger. Int. J. Refrig. 2017, 83, 1–13. [Google Scholar] [CrossRef]
  22. Yan, G.; Liu, Y.; Qian, S.; Yu, J. Theoretical study on a vapor compression refrigeration system with cold storage for freezer applications. Appl. Therm. Eng. 2019, 160, 114091. [Google Scholar] [CrossRef]
  23. Mosleh, H.J.; Kavian, S.; Shafii, M.B. Performance analysis and transient simulation of a vapor compression cooling system integrated with phase change material as thermal energy storage for electric peak load shaving. J. Energy Storage 2021, 35, 102316. [Google Scholar]
  24. Riffat, J.; Kutlu, C.; Tapia-Brito, E.; Tekpetey, S.; Agyenim, F.B.; Su, Y.; Riffat, S. Development and testing of a PCM enhanced domestic refrigerator with use of miniature DC compressor for weak/off grid locations. Int. J. Green Energy 2021, 19, 118–1131. [Google Scholar] [CrossRef]
  25. Sun, Z.; Peng, J.; Shi, Y.; Wang, H.; Li, J.; Zhu, S.; Yuan, Y.; Xu, Z.; Feng, Z.; Liu, J. Experimental study of a single-tube multi-fin row of tube evaporator. Appl. Therm. Eng. 2022, 211, 118385. [Google Scholar] [CrossRef]
  26. Abdolmaleki, L.; Berardi, U. Single and Multi-phase Change Materials Used in Cooling Systems. Appl. Therm. Eng. 2022, 182, 116160. [Google Scholar] [CrossRef]
  27. Dhumane, R.; Qiao, Y.; Ling, J.; Muehlbauer, J.; Aute, V.; Hwang, Y.; Radermacher, R. Improving system performance of a personal conditioning system integrated with thermal storage. Appl. Therm. Eng. 2019, 147, 40–51. [Google Scholar] [CrossRef]
  28. Dhumane, R.; Ling, J.; Aute, V.; Radermacher, R. Performance comparison of low GWP refrigerants for a miniature vapor compression system integrated with enhanced phase change material. Appl. Therm. Eng. 2021, 182, 116160. [Google Scholar] [CrossRef]
  29. Available online: www.rubitherm.eu (accessed on 4 April 2022).
  30. Faden, M.; König-Haagen, A.; Höhlein, S.; Brüggemann, D. An implicit algorithm for melting and settling of phase change material inside macrocapsules. Int. J. Heat Mass Transf. 2018, 117, 757–767. [Google Scholar] [CrossRef]
  31. Lee, W.H. A Pressure Iteration Scheme for Two-Phase Flow Modeling. In Computational Methods for Two-Phase Flow and Particle Transport; World Scientific Publishing Company: Singapore, 2013; pp. 61–82. [Google Scholar] [CrossRef]
  32. ASHRAE Handbook; Ashrae Handbook: Refrigeration; ASHRAE (American Society of Heating, Refrigerating and Air-Conditioning Engineers): Peachtree Corners, GA, USA, 2006.
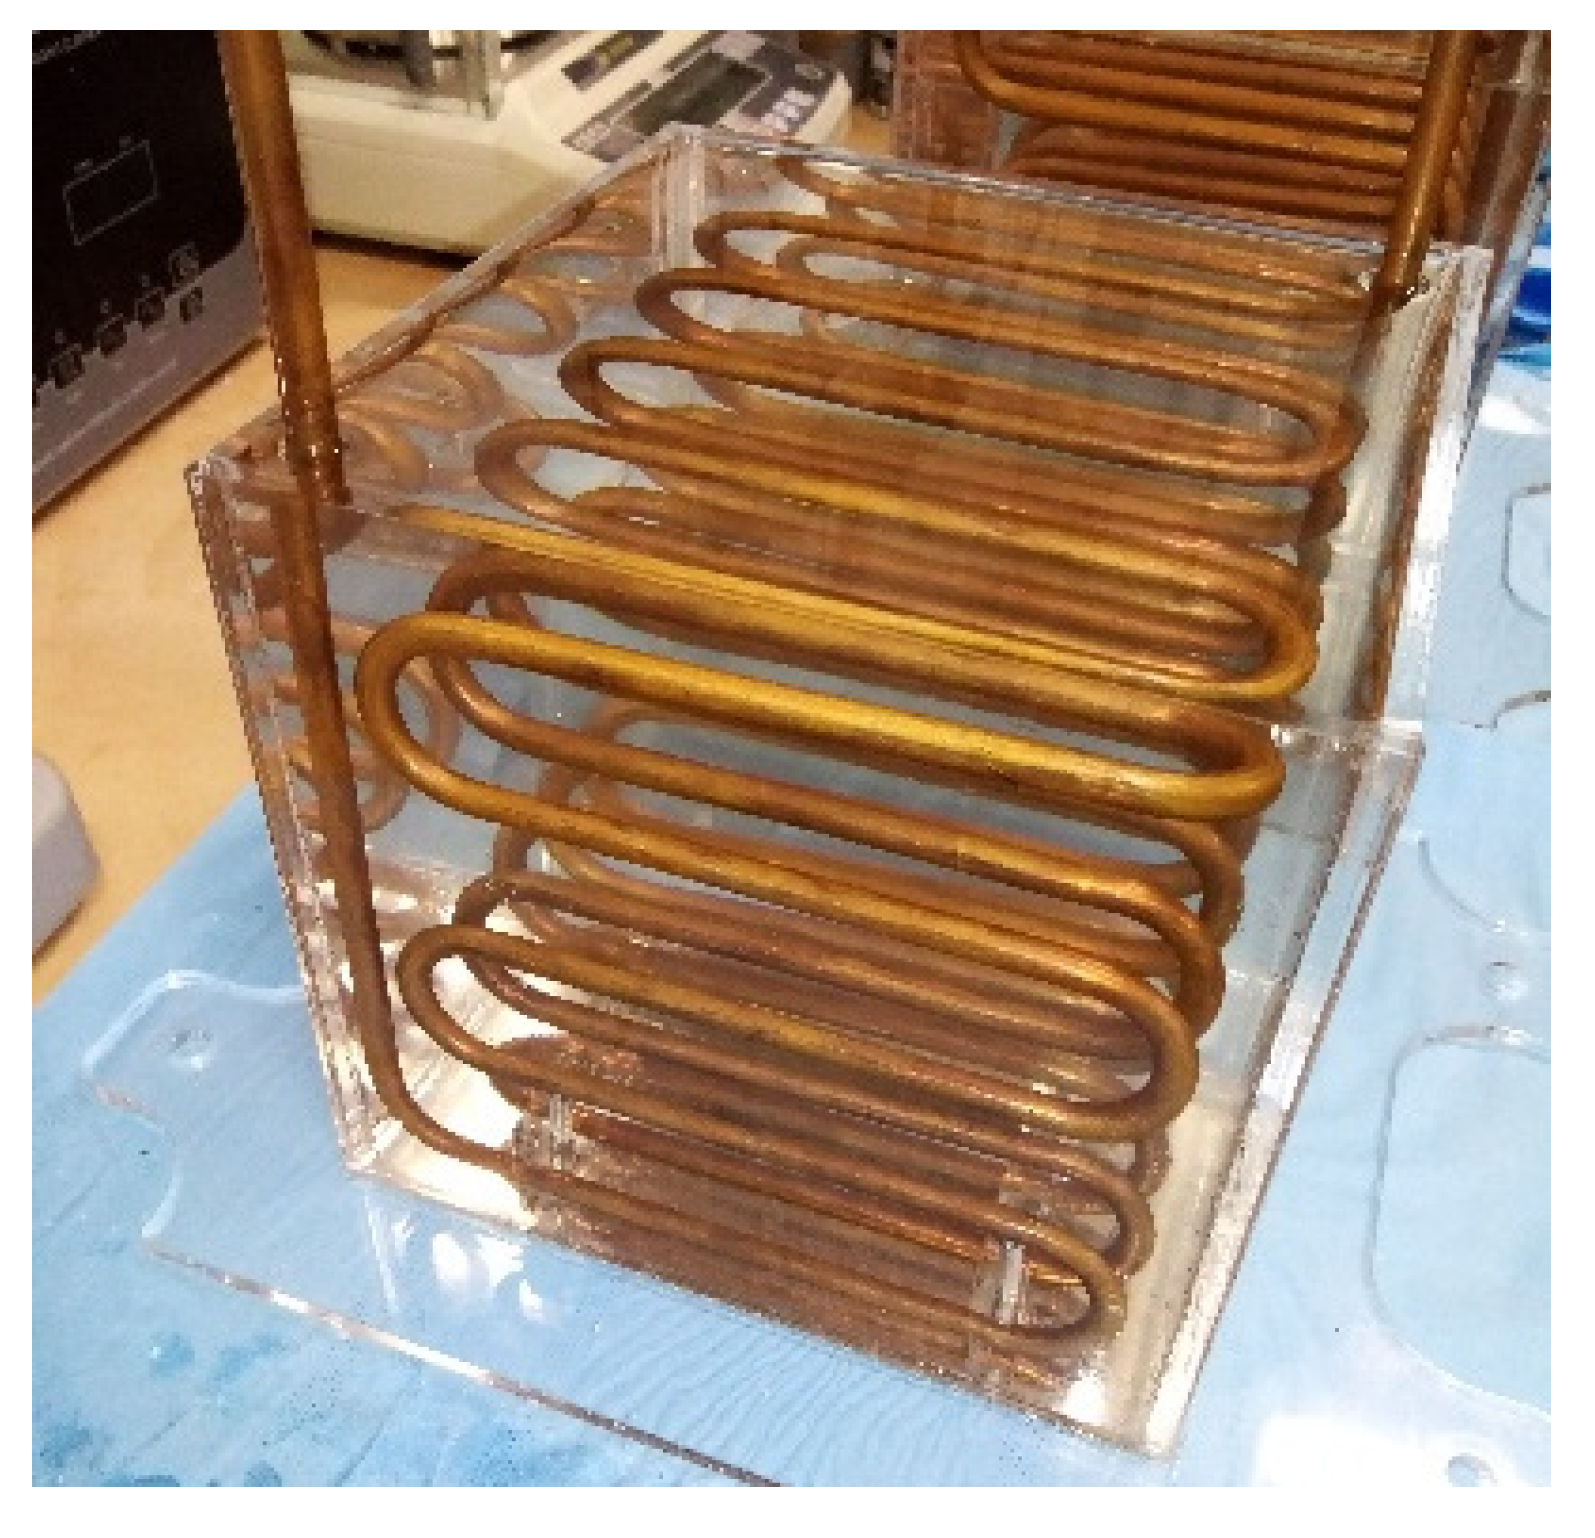
Figure 1. One of three units comprising the PCM-based condenser, without the thermal insulation.
Energies 16 03798 g001
Figure 2. Theoretic thermodynamic cycle.
Energies 16 03798 g002
Figure 3. Schematic of experimental apparatus.
Energies 16 03798 g003
Figure 4. Schematic of condenser units.
Energies 16 03798 g004
Figure 5. Condenser with solid PCM and without the thermal insulation.
Energies 16 03798 g005
Figure 6. Experimental apparatus.
Energies 16 03798 g006
Figure 7. Refrigerant pressure versus time.
Energies 16 03798 g007
Figure 8. Refrigerant temperatures versus time.
Energies 16 03798 g008
Figure 9. PCM temperatures versus time.
Energies 16 03798 g009
Figure 10. Refrigerant pressures.
Energies 16 03798 g010
Figure 11. Refrigerant pressures during the useful phase.
Energies 16 03798 g011
Figure 12. Refrigerant temperatures.
Energies 16 03798 g012
Figure 13. Refrigerant temperatures during the useful phase.
Energies 16 03798 g013
Figure 14. Sensible heat within the condenser.
Energies 16 03798 g014
Figure 15. PCM temperatures versus time.
Energies 16 03798 g015
Figure 16. PCM temperatures versus time during the useful phase.
Energies 16 03798 g016
Figure 17. Graphical representation of the experimental thermodynamic cycle.
Energies 16 03798 g017
Figure 18. Heat exchanged at the condenser and at the evaporator.
Energies 16 03798 g018
Figure 19. Coefficient of Performance (COP).
Energies 16 03798 g019
Figure 20. Inlet velocity.
Energies 16 03798 g020
Figure 21. Simulated Ta and Tb temporal evolution with different meshes.
Energies 16 03798 g021
Figure 22. Comparison between experimental and numerical results for Ta and Tb.
Energies 16 03798 g022
Figure 23. Temperature (left) and liquid phase fraction (right) on the PCM external surfaces (with transparency) at t = 0 s.
Energies 16 03798 g023
Figure 24. Temperature (left) and liquid phase fraction (right) on the PCM external surfaces (with transparency) after 2 h and 10 min.
Energies 16 03798 g024
Figure 25. Temperature (left) and liquid phase fraction (right) on the PCM external surfaces (with transparency) after 4 h and 20 min.
Energies 16 03798 g025
Figure 26. Average temperature and PCM liquid fraction evolution.
Energies 16 03798 g026
Figure 27. Dispersed phase inside the serpentine at various sections after 3900 s.
Energies 16 03798 g027
Figure 28. Surface average of dispersed phase volume fraction and temperature at the serpentine outlet.
Energies 16 03798 g028
Table 1. Rubitherm RT35HC thermophysical properties [29].
Melting Area
(°C)
34–36
Main peak 35
Congealing Area
(°C)
36–34
Main peak 35
Heat storage capacity ± 7.5%
(J·kg−1)
240 × 103
Combination of sensible and latent heat in the temperature range 27–42 °C
(J·kg−1)
241.2
Specific heat capacity
(J·kg−1·K−1)
2000
Density solid at 25 °C
(kg·m−3)
880
Density liquid at 40 °C
(kg·m−3)
770
Thermal conductivity (both phases)
(W·m−1·K−1)
0.2
Volume expansion
(%)
12
Flash point
(°C)
177
Max. operation temperature
(°C)
70
Table 2. Points of the thermodynamic cycle: T = temperature, P = absolute pressure, vs = specific volume, h = specific enthalpy, s = specific entropy, x = vapor quality.
T
[°C]
P
[bar]
vs [m3/kg]h [kJ/kg]s [kJ/kgK]x
1 (evaporator outlet/compressor inlet)11.104.300.0477404.9281.7221
2id. (ideal compressor outlet/condenser inlet)53.8913.200.0155428.1441.722\
2 (real compressor outlet/condenser inlet)60.4613.200.0163435.8821.745\
3 (condenser outlet/receiver inlet)50.0613.200.00091271.7211.2380
4 (capillary tube outlet/evaporator inlet)11.104.300.0148271.7211.2530.298
Table 3. Components of the experimental apparatus.
CCompressor
CTCapillary tube
EVEvaporator
LPLow pressure line
HPHigh pressure line
P1, P2Pressure sensors
RReceiver
T1-4, Ta-fTemperature sensors (RTD)
VB1, VB2Bypass valves
Table 4. Experimental thermodynamic cycle points.
T
[°C]
P
[bar]
vs [m3/kg]h
[kJ/kg]
S
[kJ/kgK]
x
1 (evaporator outlet/compressor inlet)19.055.470.037409.461.720~1
2 (compressor outlet/condenser inlet)49.6311.860.0174426.321.723/
3 (condenser outlet/receiver inlet)40.9011.860.0008257.721.194~0
4 (capillary tube outlet/evaporator inlet)19.455.470.0073257.721.2000.176
2* (real measurement of the point 2)46.0211.860.0169422.051.709~1
Disclaimer/Publisher’s Note: The statements, opinions and data contained in all publications are solely those of the individual author(s) and contributor(s) and not of MDPI and/or the editor(s). MDPI and/or the editor(s) disclaim responsibility for any injury to people or property resulting from any ideas, methods, instructions or products referred to in the content.