Article

The Role of Biogas Production in Circular Economy Approach from the Perspective of Locality

Institute of Spatial Management, Wrocław University of Environmental and Life Sciences, Grunwaldzka 55, 50-375 Wrocław, Poland
*
Author to whom correspondence should be addressed.
Energies 2023, 16(9), 3801; https://doi.org/10.3390/en16093801
Submission received: 14 March 2023 / Revised: 24 April 2023 / Accepted: 25 April 2023 / Published: 28 April 2023
(This article belongs to the Special Issue Advanced Research on Clean Energy and Electricity Market)

Abstract

:
The circular economy is an economic concept opposite to the current linear system. One of its main principles is to seek to minimise waste by reusing seemingly useless raw materials. Biogas plants are places where energy can be recovered from waste. In order to boost the environmental benefits of this concept, it is important to rely on local systems (including supply chains). Therefore, the aim of this study was to examine whether biogas plants in Poland operate in a circular manner from the perspective of locality. The analysis was based on questionnaire surveys concerning the nature of the facilities’ operations, divided into biogas plants located at sewage treatment plants, biogas plants based on municipal waste and agricultural biogas plants. On the basis of the data obtained, statistical and spatial analyses were carried out to verify the installed capacity of the facilities, the distance from which they obtain their substrate and the use of the biogas produced. The results of the study confirm that the functioning of biogas plants located in Poland is, in most cases, of a local character, fitting into the objectives of a circular economy. Biogas plants that are characterised by the lowest transportation needs are biogas plants located next to sewage treatment plants.

1. Introduction

1.1. Background of Circular Economy

One of the development goals of the European Union (EU) is to achieve EU climate neutrality by 2050. The policy strategy to bring about the transformation of the EU economy for a sustainable future is to mobilise the industrial sector for a clean, circular (closed-loop) economy [1]. The circular economy is a strategic approach that helps local communes shift from a linear to a circular metabolism [2]. It can be characterised as an economic system based on multiple collaborations, networks and sustainable solutions. It is a constantly evolving economy, striving for better and more modern ways of managing, producing and processing. It is a concept that seeks to extend the life of existing products, extracted raw materials and materials, as well as minimise waste production [3] while maintaining continuous economic development. The concept covers all stages of a product’s life cycle: design, production, consumption, waste collection and management [3]. Products are designed in a sustainable way so that they can be recycled after use. This means that a product is transformed many times in its life process.
Two types of cycle can be distinguished: biological and technical [4]. The biological cycle comprises the flow of renewable raw materials, in which natural processing processes take place. Decomposed biological waste re-enters the biosphere and can be used in crops as natural fertilisers. Biochemical feedstock extraction and anaerobic decomposition can be sources of biogas. A finite resource is managed in a technical cycle. Man, by his actions, contributes to the transformation of products. Articles are constantly maintained, repaired and used for different purposes. Only when repair is not possible are they recycled, then transformed into other products and reused. The lack of waste treatment and reuse wastes existing natural and financial resources.
Capturing the circular economy encompasses the activities, principles and goals that are characteristic of the concept. The Ellen MacArthur Foundation [4] distinguishes three basic principles that guide the circular economy:
  • Maintaining and increasing capital by controlling depletable resources and balancing the flow of renewable resources;
  • Optimising profits through resources in circulation, both biological and technical;
  • Increasing efficiency through discovery and design without negative impact on the external environment.
At present, the world is dominated by a linear economic model, based on the ‘extract, process, use and discard’ scheme. The problem arising from this economic approach is the negative environmental impacts. Increasing levels of raw material extraction, such as what occurred between 1970 and 2017 [5], among others, are leading to the depletion of natural resource deposits and consequent environmental degradation. Current exploitation far exceeds the capacity of the environment. Since 1970, the human ecological footprint has exceeded the Earth’s regeneration rate [6]. The occurrence and use of resources worldwide is unevenly distributed. Often, raw material extraction sites are not located in areas of greatest demand. This results in the need to transport raw materials over very long distances. This is a resource-intensive activity that consumes financial and human resources and negatively affects the natural environment through, among other things, the emission of carbon dioxide into the atmosphere.

1.2. Renewable Energy and Its Relation to Circular Economy

The circular economy uses energy from local renewable sources. Depending on local conditions, different sources might be more suitable. Some of them are more dependent on solar [7,8] or wind conditions in a specific location [9], while some, such as those based on biomass [10,11,12] and biogas, are less dependent [13,14]. Usually, local potential in that aspect can be reflected in local development strategies [15,16], energy policies [17] or even municipal planning documents [18]. One renewable energy source is biogas plants, which produce electricity and heat. They produce biogas, which is a mixture of gases resulting from the combustion of organic matter, either naturally occurring or under controlled conditions [19]. Depending on the substrate from which it is produced, biogas has different compositions. Substrates feeding biogas plants can be waste from sewage treatment plants, municipal and agricultural waste. They are delivered to sealed pre-combustion tanks where they are stored. Anaerobic digestion of the waste then takes place in the digester. The substrate is heated and continuously stirred and bacteria break down the organic substances into simple compounds. Biogas is produced in the chamber, which is then transferred to the cogeneration module. Electricity and heat can be generated in the module. The waste produced during fermentation is the digestate, which amounts to approximately 85–95% of the weight of the raw materials used [20].
The choice of location of waste treatment facilities is important for both environmental and economic reasons. Sometimes, wastes are transported to poorer countries or those where waste management standards are more lenient. The transport of harmful waste to more developed countries can be explained by the fact that richer countries have the technology to treat waste safely [21]. However, it is more difficult to identify the driving forces behind the export of waste not defined as hazardous. Import of wastes for energy recovery in Sweden increased between 1996 and 2002 [22]. Wood, paper and plastics were imported mainly from Germany, the Netherlands, Norway, Denmark and Finland. One of the factors contributing to the increase in imports in Sweden was advanced technology allowing high energy recovery. In theory, that stays in line with preferable sources of energy, therefore, such actions could be considered as environmentally positive from a technological point of view. In practice, however, the long-distance transport of waste has simultaneously increased the carbon footprint of the raw materials. Similarly to the well-known in scientific literature concept of food miles [23], transport of wastes for energy purposes could be called waste miles, or energy source miles. Therefore, in a circular economy, it is important to highlight the locality of a system and material flow. The greater the distance over which waste is transported, the greater the chance that the environmental costs of transport will outweigh the environmental gains from energy recovery. An analogy with cited waste incineration plants can be drawn with biogas plants. Biogas plants are plants that extract energy from waste, so they should deliver environmental benefits. Therefore, lower substrate transport needs are the higher positive environmental impact of the system that can be observed. The proposed approach is based on an indirect estimation approach [24] where, in this case, transportation needs reflect the economic and environmental impact on the system.

1.3. Recent Progress in Biogas Supply Chains in Circular Economy

Seven out of the eight variables that create the environmental pillar can be improved by biogas production, namely GHG emissions, soil quality, non-GHG air pollutants, water use and efficiency, water quality, biological variety in the environment and land use [25]. Given the enormous benefits of waste management, environmental credits and co-product value gain, government and non-government incentives, laws, policies and regulatory framework have reinvigorated the attention on biogas [26]. The study conducted in Spain on 88 sewage treatment facilities (each serves more than 50,000 equivalent users) analysed the possibility to produce a biogas for district heating networks. The findings indicate a possibility for 1.8 Mt per year in CO2 emissions savings with a total investment of 2854 M euros [27]. The level of this effectiveness may differ based on biochemical methane potential which characterises different types of biowaste [28]. In order to increase this potential some strategies may be applied, such as pretreatments (e.g., lyophilization or freezing [29] as well as heating up [30]) or use of environmental remediation materials (e.g., sulfidated microscale zerovalent iron) [31]. Having this knowledge from recent studies, it can be concluded that technical aspects do not seem to be a main problem in the implementation of biogas on a larger scale.
Recent studies show that one of the main obstacles in biogas operation is economic conditions. This problem refers both to biogas production from plant-based [32] as well as animal-based [33] agricultural activity. A study from Italy suggests that, in case of biogas from animal residues, a 200 kW biogas plant and 350 m3/h biomethane plant are the minimum sizes in which economic feasibility is demonstrated [34]. Similar studies have considered the size of the farm delivering animal manure for biogas in the Netherlands. If the biogas producer pays the farmer to collect its manure (5 EUR/t), or if the farmer sells manure for free and waste disposal expenses are greater than 10 EUR/t, the partnership is profitable for a large farm (>20,000 t/year). If the farmer pays the biogas producer (5 EUR/t) to contribute their manure, cooperation is always advantageous for the producer. If the biogas producer is a medium–large facility (>20,000 t/year), benefits are always favourable if manure is provided for free. Benefits are good for a small-scale facility if the manure dry content is less than 12 percent and the transportation distance is less than 10 kilometres [35]. This last example proves that, especially in case of small-scale installations, geographic distance is a crucial factor in order to evaluate the profitability of biogas system operation. The other study proves that identification of opportunities to create strategic partnerships of raw material suppliers and the volume of raw material supply can be based on geographic coordinates [36].
Some of the aspects described above can be analysed based on available statistics; however, other elements require additional data sources. That is why methods from social sciences have become very popular in energy research, especially in the domains of energy policy or behaviour of different actors in the energy market. Using a structured questionnaire or survey instrument, data is collected from a pool of respondents drawn from an appropriate target group. Many social scientific disciplines employ surveys often; however, there might be differences in how surveys are implemented, how they are interpreted and other related practices and norms [37]. In the case of energy research, questionnaires were used in many studies [38], including biogas focused studies [39,40]. Some questionnaire-based research focuses even more precisely on the issue of supply chains in biogas production [41,42,43]. All these findings confirm that surveys based on questionnaires are suitable to carry out research in the energy domain.

1.4. Aim of the Research

The aim of this study was to investigate whether the operation of biogas plants in Poland stands in line with the objectives of a circular economy using local energy resources. This paper is structured as follows. Section 2 describes materials that were used to perform the analyses, together with methods that were applied in the research. Section 3 contains results of the research presenting biogas plants’ installed capacity, spatial aspects of their operation and ways of fermentation waste management. Discussion and conclusions of the obtained results are presented in Section 4.

2. Materials and Methods

Data on the operation of biogas plants in Poland was collected using a questionnaire survey prepared in Google Forms. Three attempts to collect data were made to provide a dataset. Attempts to deliver surveys were made in approximately 8-week intervals. Collecting data started at the end of November 2021. The first reminder was sent in January 2022. The second reminder to complete the survey was sent out again in March 2022. The last data included in the survey were collected in May 2022. The total period of collecting data took 6 months. The recipients of the surveys were individuals who were business owners or employees working in biogas plants included in the list of renewable source installations (as of 31 December 2018 and 30 June 2021) and the registry of agricultural biogas producers (as of 23 March 2021). The documents were downloaded from the websites of the Energy Regulatory Office and The National Support Centre for Agriculture. Three attempts to collect data were made to provide a dataset. The questionnaire collected data on installed capacity of the facilities [MW], distance between biogas plants and sites where substrate is produced, as well as distance between biogas plants and locations where biogas is used. Additionally, there were also open-ended questions regarding the amount of generated fermentation waste and how it is managed. According to the Polish Energy Regulatory Office, in Poland there are 343 registered biogas plants in operation [44]. A total of 65 responses were received, and after analysing the collected information, 61 items were considered for further research. Four responses were excluded because representatives of one facility completed the questionnaire twice and representatives of three facilities completed the questionnaire incorrectly, preventing further analysis of the information. Statistical analyses were performed in the Tabelau 2021.4. software. A histogram with equal size intervals and a box plot were prepared to represent the empirical distribution of installed power. Using this program, basic statistical parameters were also analysed. The results of the surveys were processed spatially in QGIS 3.22.7. This analysis included the geolocation of objects based on geographic coordinates. To mark the distance of biogas plant substrate procurement and using biogas, a geoprocessing tool (buffer) was used. Data visualisation was prepared separately for each type of biogas plant in order to distinguish spatial patterns between biogas plant types.

3. Results

Biogas plants located in 15 out of 16 voivodships in Poland participated in the study. Among the 61 biogas facilities, the following stand out: 36 biogas plants at the sewage treatment plant, 16 biogas plants fed with municipal waste and 9 agricultural biogas plants [45]. The location of the facilities with respect to their type is shown in Figure 1.

3.1. Analysis of Installed Capacity

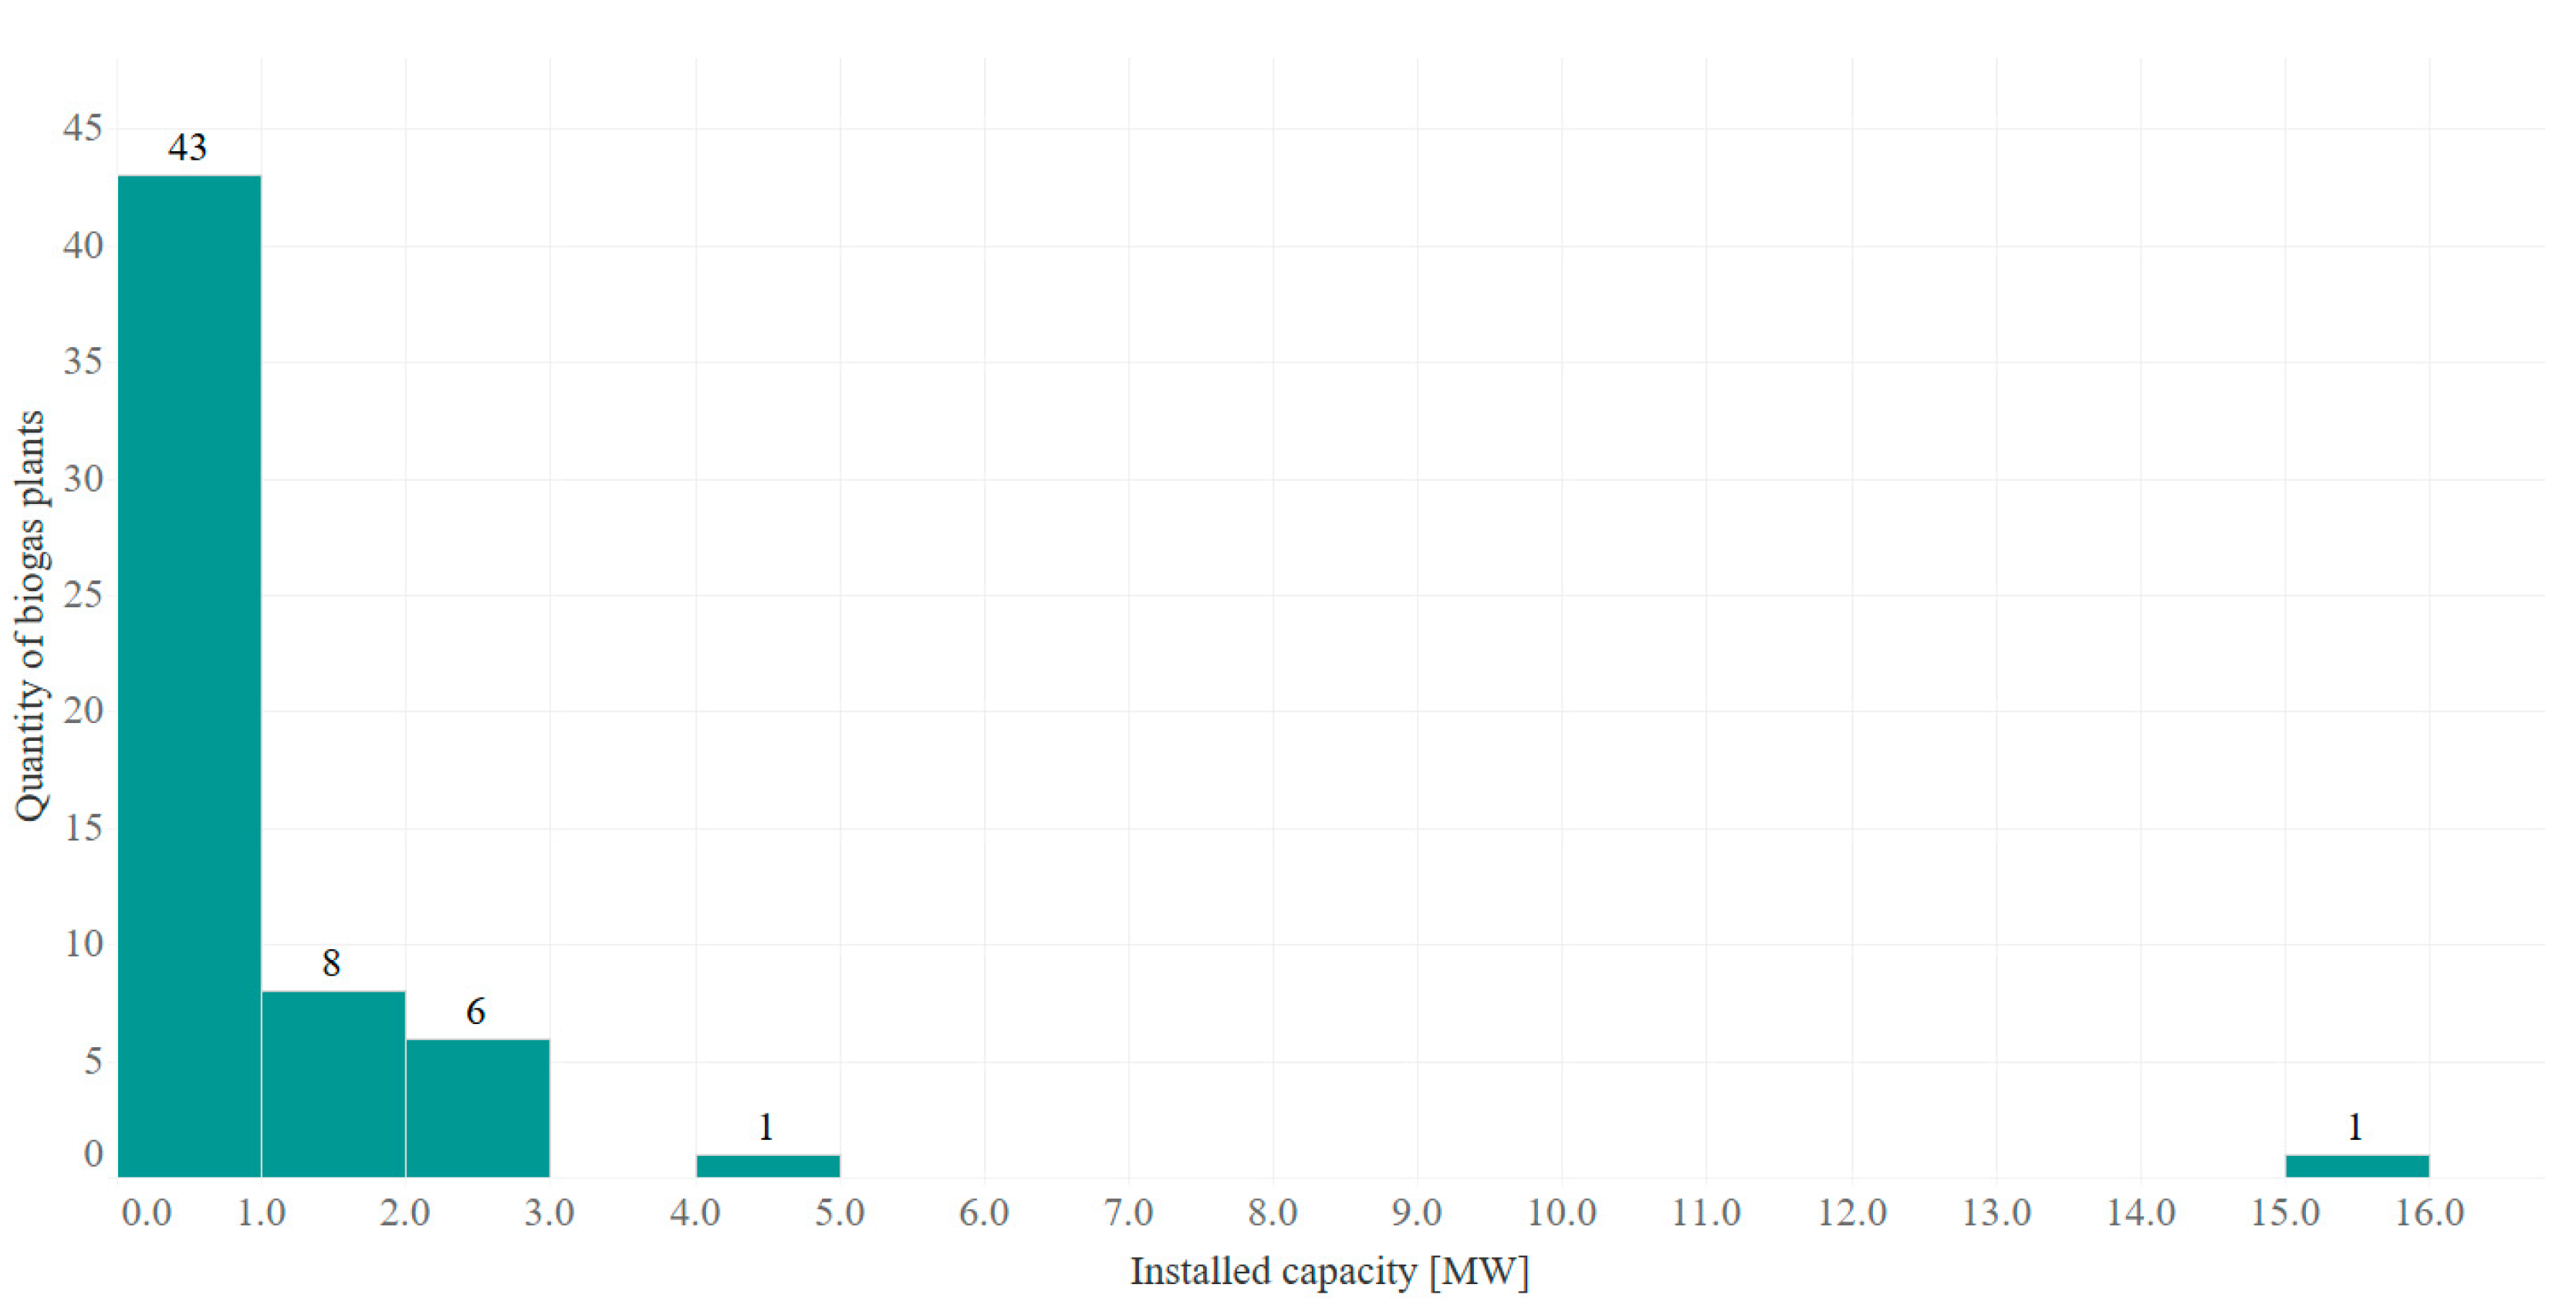
The empirical distribution for power plants includes one facility with the installed power of 15.536 MW, which causes a gap in the histogram (Figure 2). In order to interpret the impact that power might have on the rest of the analyses, the standard deviations of the set were compared in the following two variants: with the 15.536 MW power plant included in the calculations (Table 1 group 1) and for the set without the biogas plant with the highest capacity (Table 1 group 2). A comparison of the standard deviation values in both cases (value of 2.089 for group 1 and 0.844 for group 2) indicates a right-handed asymmetric distribution. The difference between the standard deviation and the arithmetic mean in group 1 is larger than that of group 2, which means that the installed capacity values in group 2 are more concentrated around the arithmetic mean. As the outlier does not affect the research objective formulated at the beginning of the paper, group 1 was considered in further analyses, considering the biogas plant with the highest installed capacity of 15.536 MW.
The following histogram (Figure 2) shows the abundance of observations in class intervals spanning 1 MW. Among all valid observations, the group of biogas plants with an installed capacity of less than 1 MW is the most numerous (43 facilities). It should be noted that most biogas plants have an installed capacity not exceeding 3 MW. Two facilities declared a higher capacity, one of which has a capacity of 4.266 MW, while the other has a capacity of 15.536 MW.
The size of the installed capacity of biogas plants varies according to their type. The box diagrams (Figure 3) show the distribution of the given installed capacity values comparing the three types of biogas plant.
Biogas plants at the sewage treatment plant are characterised by the widest range of power ranges. Half of the biogas plants of this type have a capacity of less than 0.806 MW. The typical installed capacity of a biogas plant at a sewage treatment plant is between 0.050 and 1.532 MW. Two outliers were observed, the first in the Kujawsko–Pomorskie region (4.266 MW) and the second in the Łódzkie region (15.536 MW). The outlier of 4.266 MW is the installed capacity of the biogas plant at the Toruń wastewater treatment plant. The total installed capacity includes 2.028 MW of electrical capacity and 2.238 MW of thermal capacity. The outlier of 15.536 MW is the total installed capacity of the biogas plant at the Łódź wastewater treatment plant. It includes 3.333 MW of electrical capacity, 3.897 MW of thermal capacity and 8.306 MW of combustion capacity.
Biogas plants fuelled by municipal waste have the smallest median capacity. Half of the facilities have an installed capacity of less than 0.420 MW. The typical capacity of landfill biogas facilities is in the range of 0.180–0.776 MW. The smallest installed capacity is equal to 0.180 MW, while the largest, which is also an outlier, is 1.550 MW. The outlier of 1.550 MW is the installed capacity of the biogas plant located in Bydgoszcz. No breakdown of capacity by type was provided in the survey response.
Agricultural biogas plants are characterised by the highest median value. The installed capacity of half of the biogas plants of this type does not exceed 0.999 MW. The smallest installed capacity is equal to 0.499 MW, while the largest is equal to 2.134 MW. No outliers were observed.

3.2. Analysis of the Localisation of Biogas Plant Operation

In terms of a circular economy, locality is one of the main features of renewable energy plants. Biogas plants are not very high energy production plants, as outlined in the previous section. Therefore, it is particularly important that the substrate they are fed with is sourced from as close to the area of the biogas plant as possible. This is so that the cost of transporting substrate does not outweigh the benefits of treating the waste in biogas plants. Most of the plants analysed obtain their substrate from the same location as the plant (Table 2). The second largest group are biogas plants sourcing substrate at distances of up to 50 km from the plant. One facility obtains material from a distance greater than 50 km.
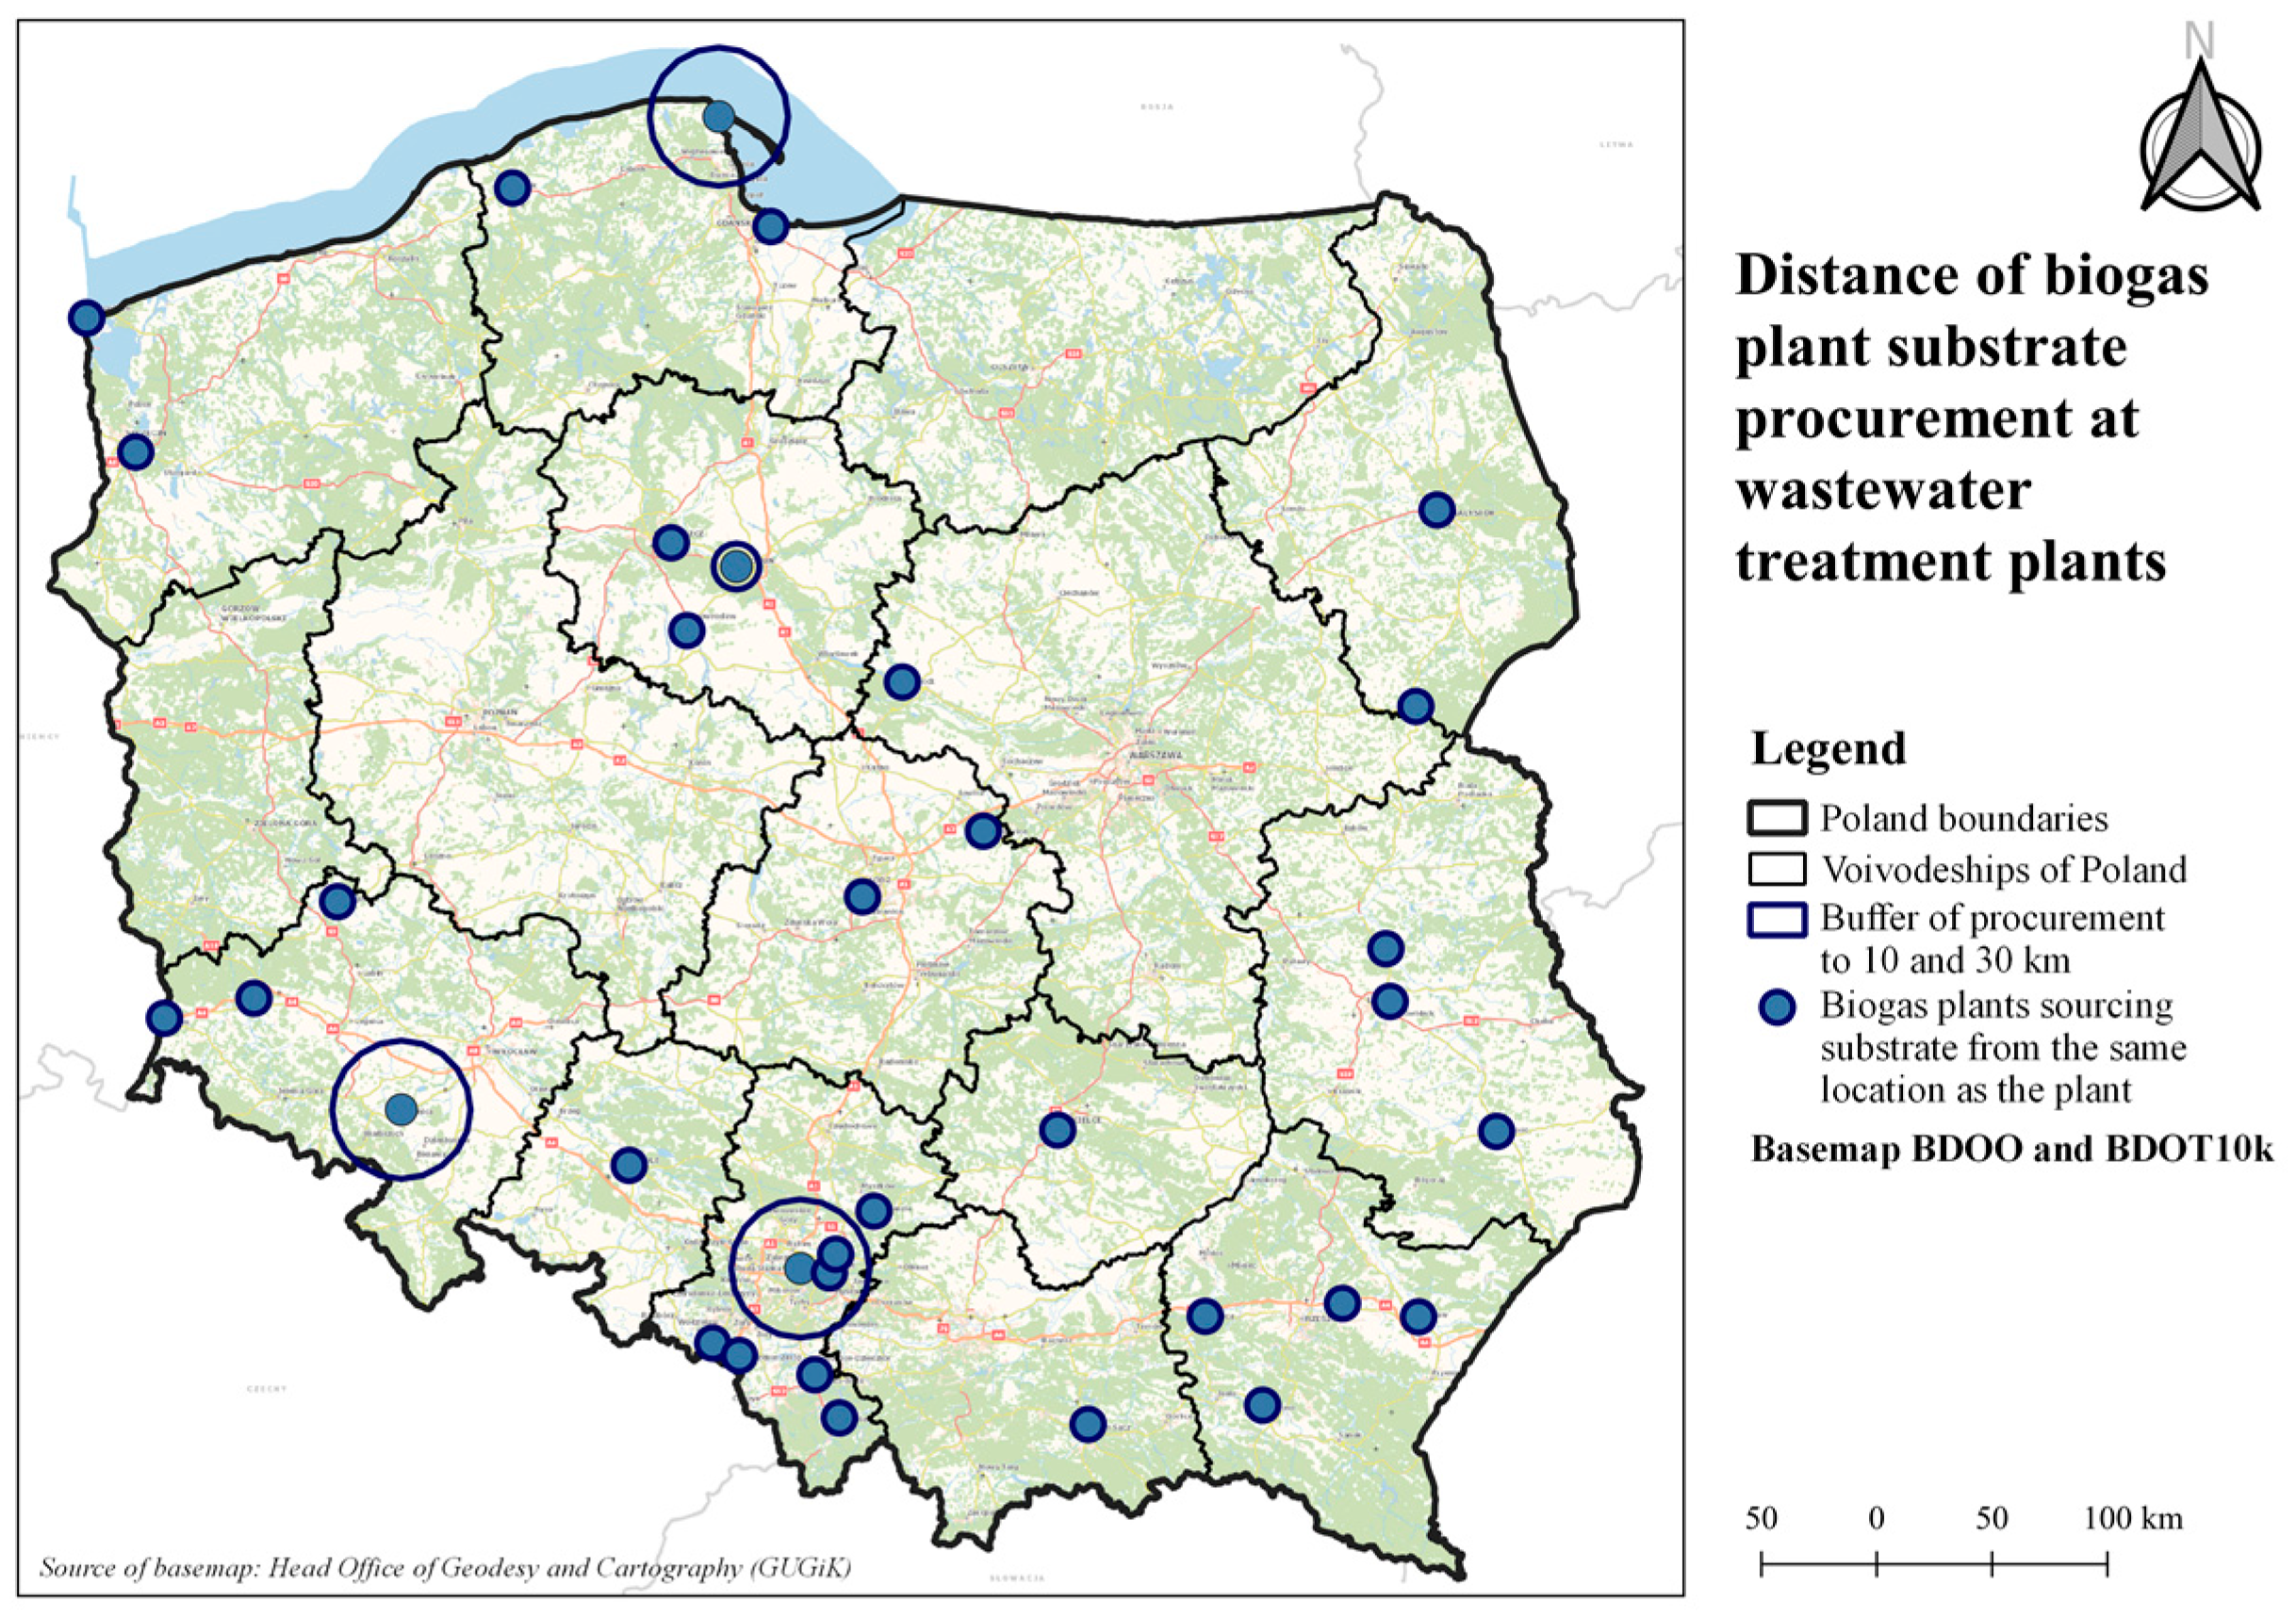
In order to find similarities, a spatial analysis by biogas plant type was performed. The vast majority of biogas plants at wastewater treatment plants take the substrate for the facility from the same location as the plant (Figure 4). One biogas plant located in Toruń draws substrate from locations within a 10 km radius of the biogas plant. Three biogas plants located in Swarzewo, Chorzów and Świdnica take substrate from locations within a 30 km radius of the biogas plant. None of the biogas plants participating in the study take substrate from locations 10–20 km or more than 30 km away from the biogas plant.
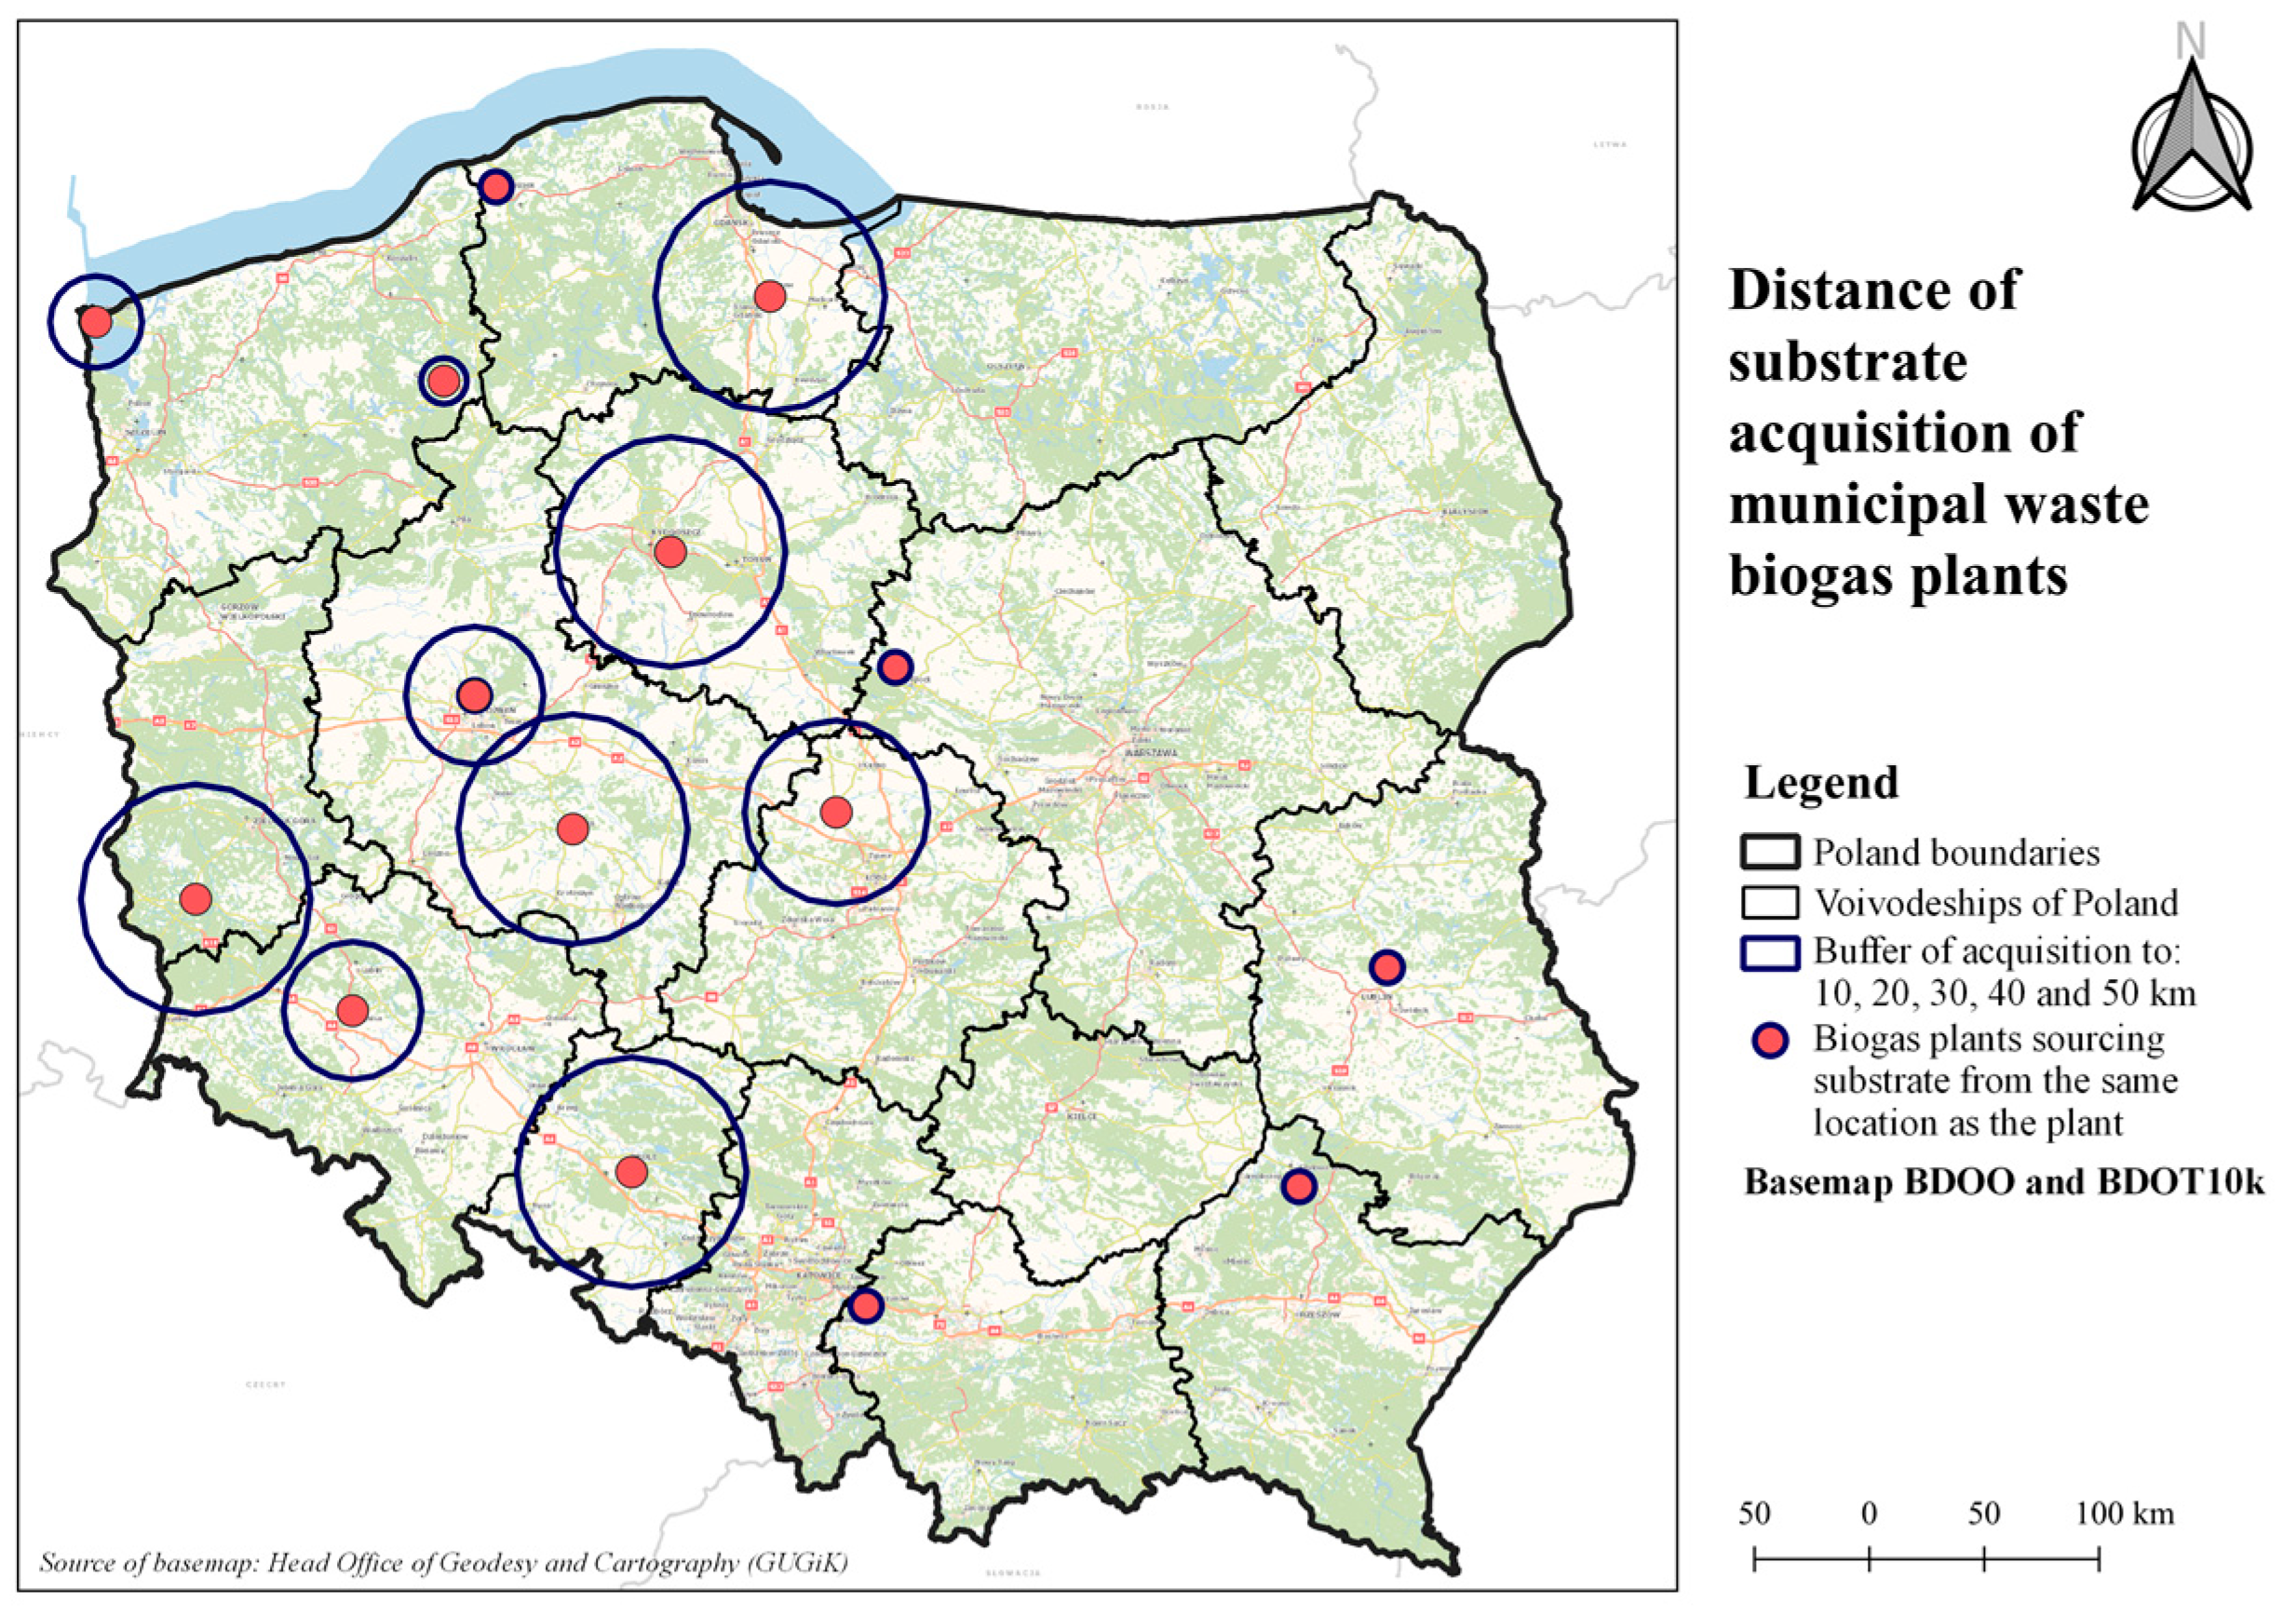
In the case of biogas plants fuelled by municipal waste, a greater variety of responses was noted (Figure 5). Six facilities indicated that they source substrate from the same location as the biogas plant. Five biogas plants source material within a 50 km radius of the plant. Two biogas plants source material within a radius of up to 30 km. One facility each obtains substrate from within 10, 20 and 40 km of the biogas plant location.
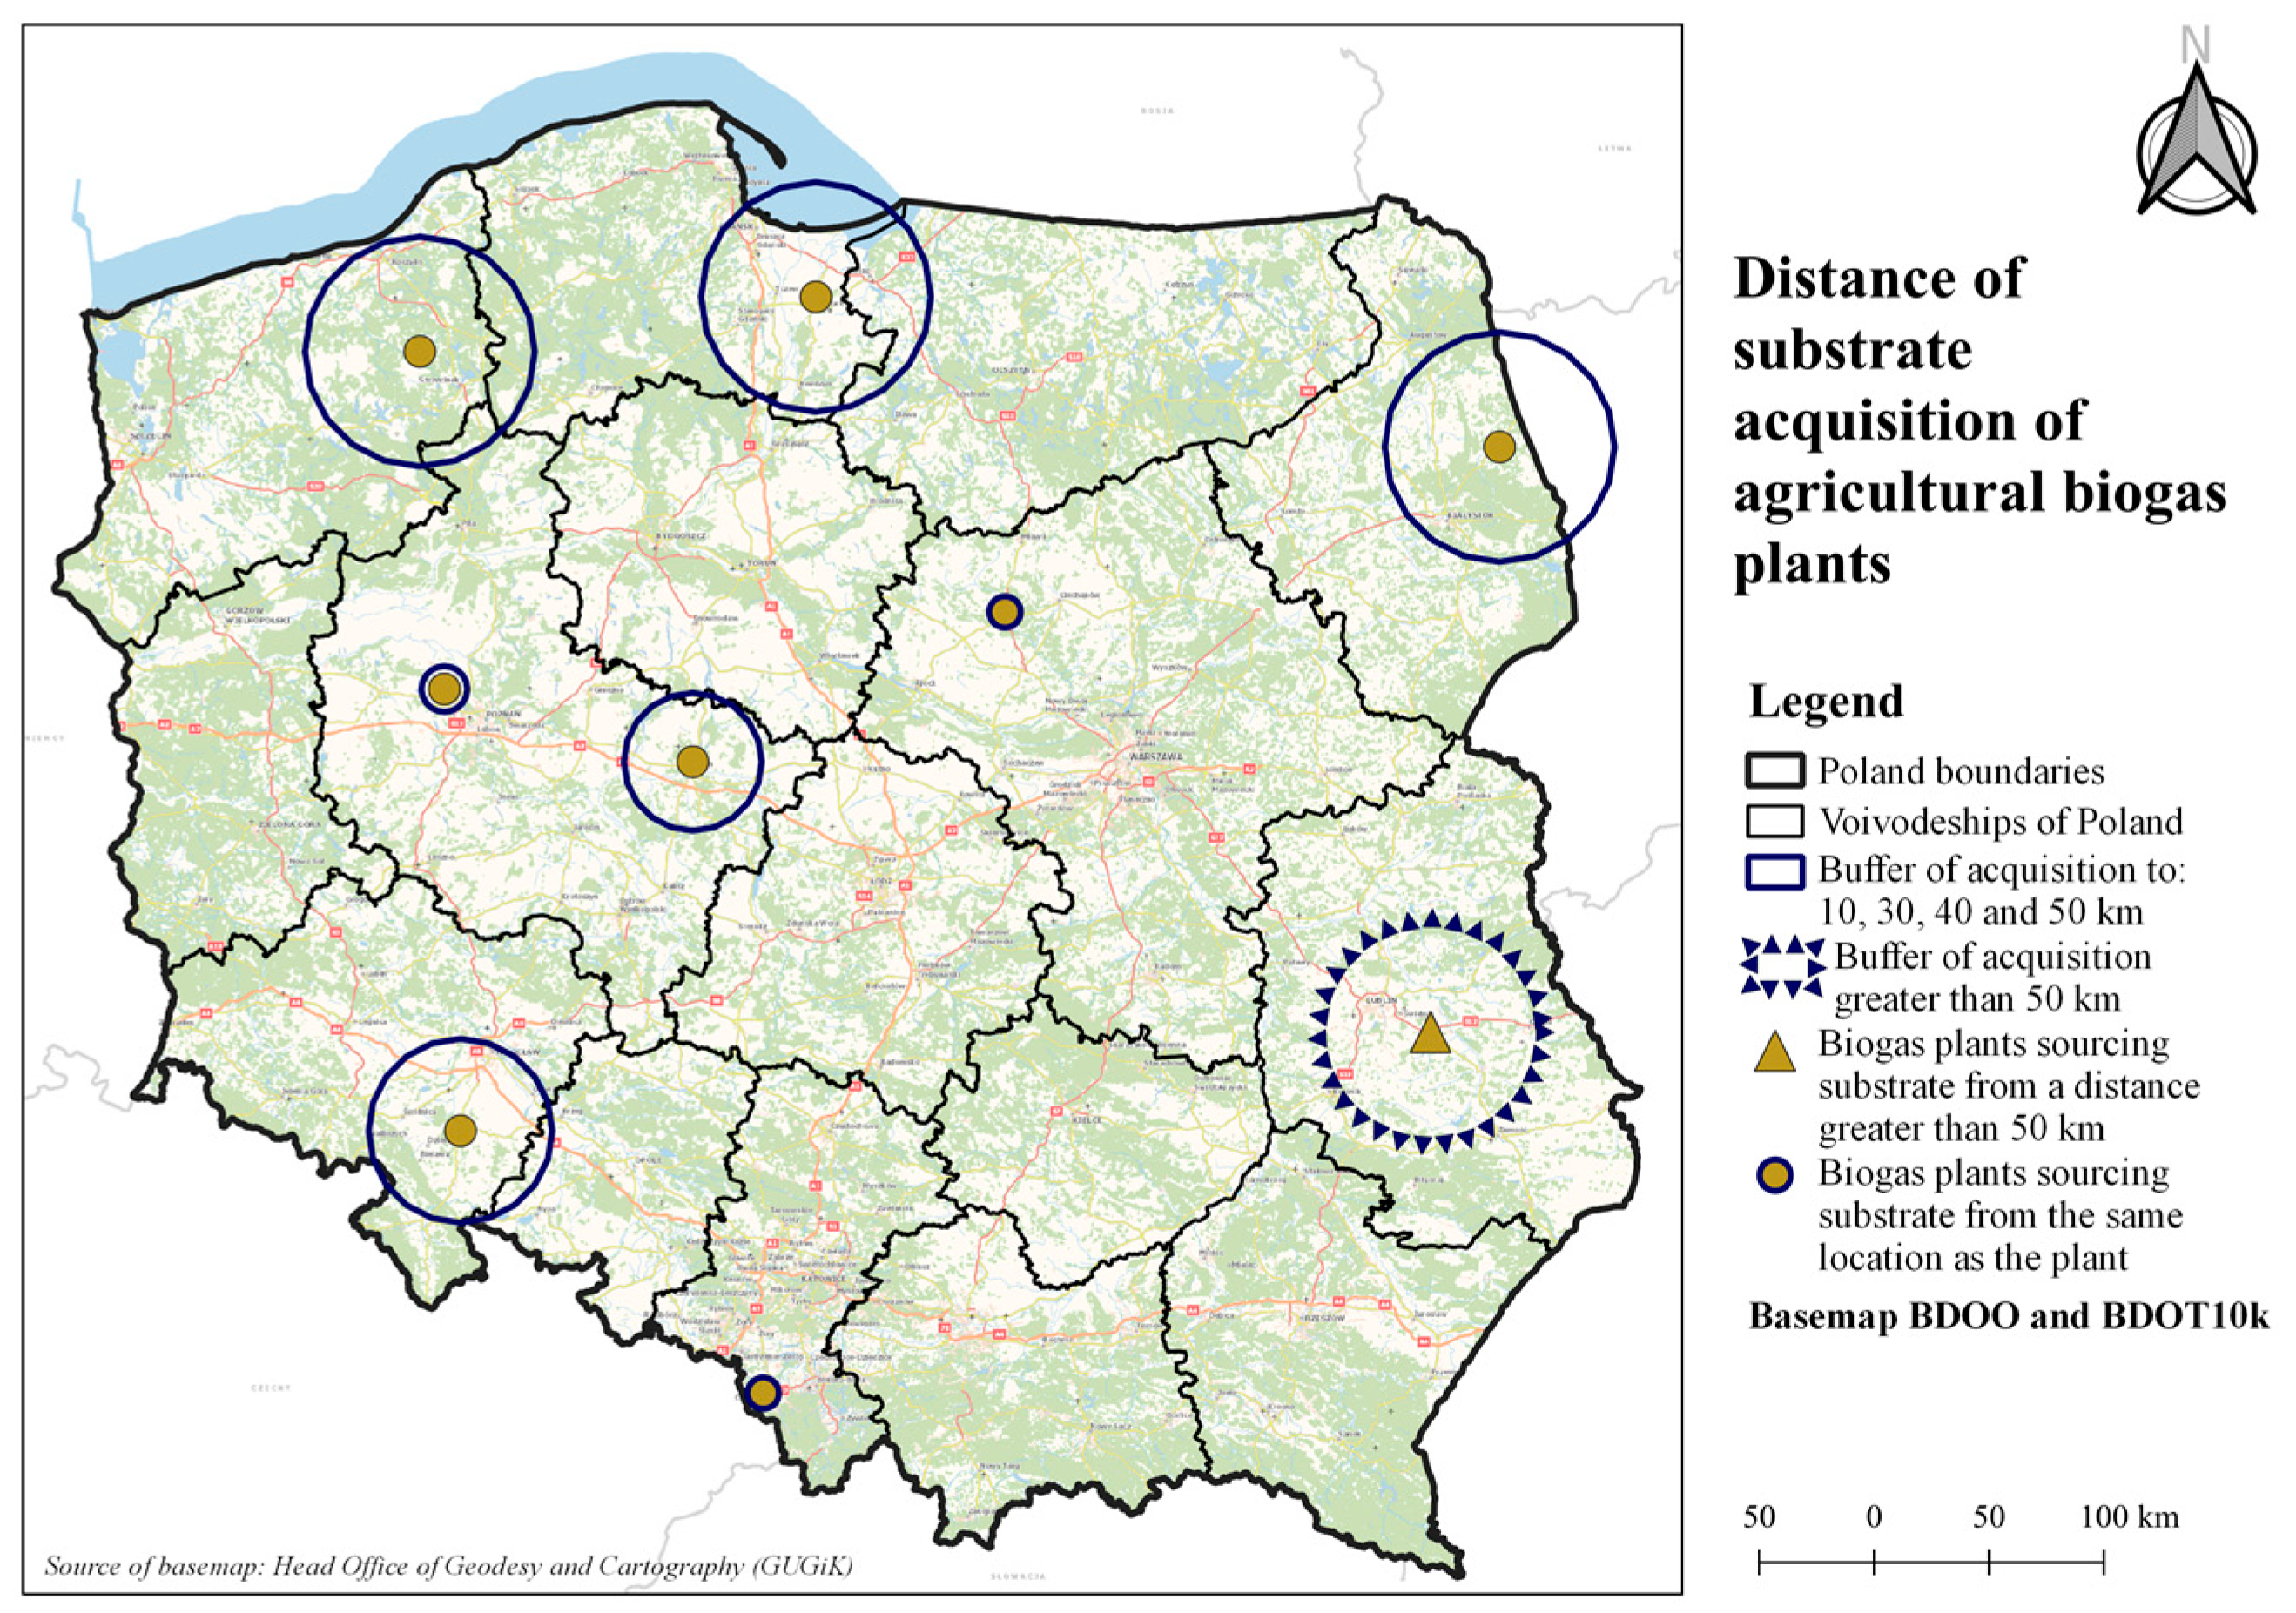
Among agricultural biogas plants, three of them take substrate from a location within a 50 km radius of the facility (Figure 6). Two plants draw material from the same location as the biogas plant. One each of the biogas plants has substrate delivered from distances of up to 10, 30 and 40 km. The agricultural biogas plant in Piaski is supplied with substrate taken from more than 50 km from the plant.
The majority of substrate is sourced from the locations of the biogas plants. In comparison to the other two types of biogas plants, facilities at sewage treatment plants source material from the shortest distances, which translates into a dominance in terms of the localisation of substrate sourcing. The only biogas plant supplied with material sourced from a distance greater than 50 km is an agricultural biogas plant located in the Lublin region.
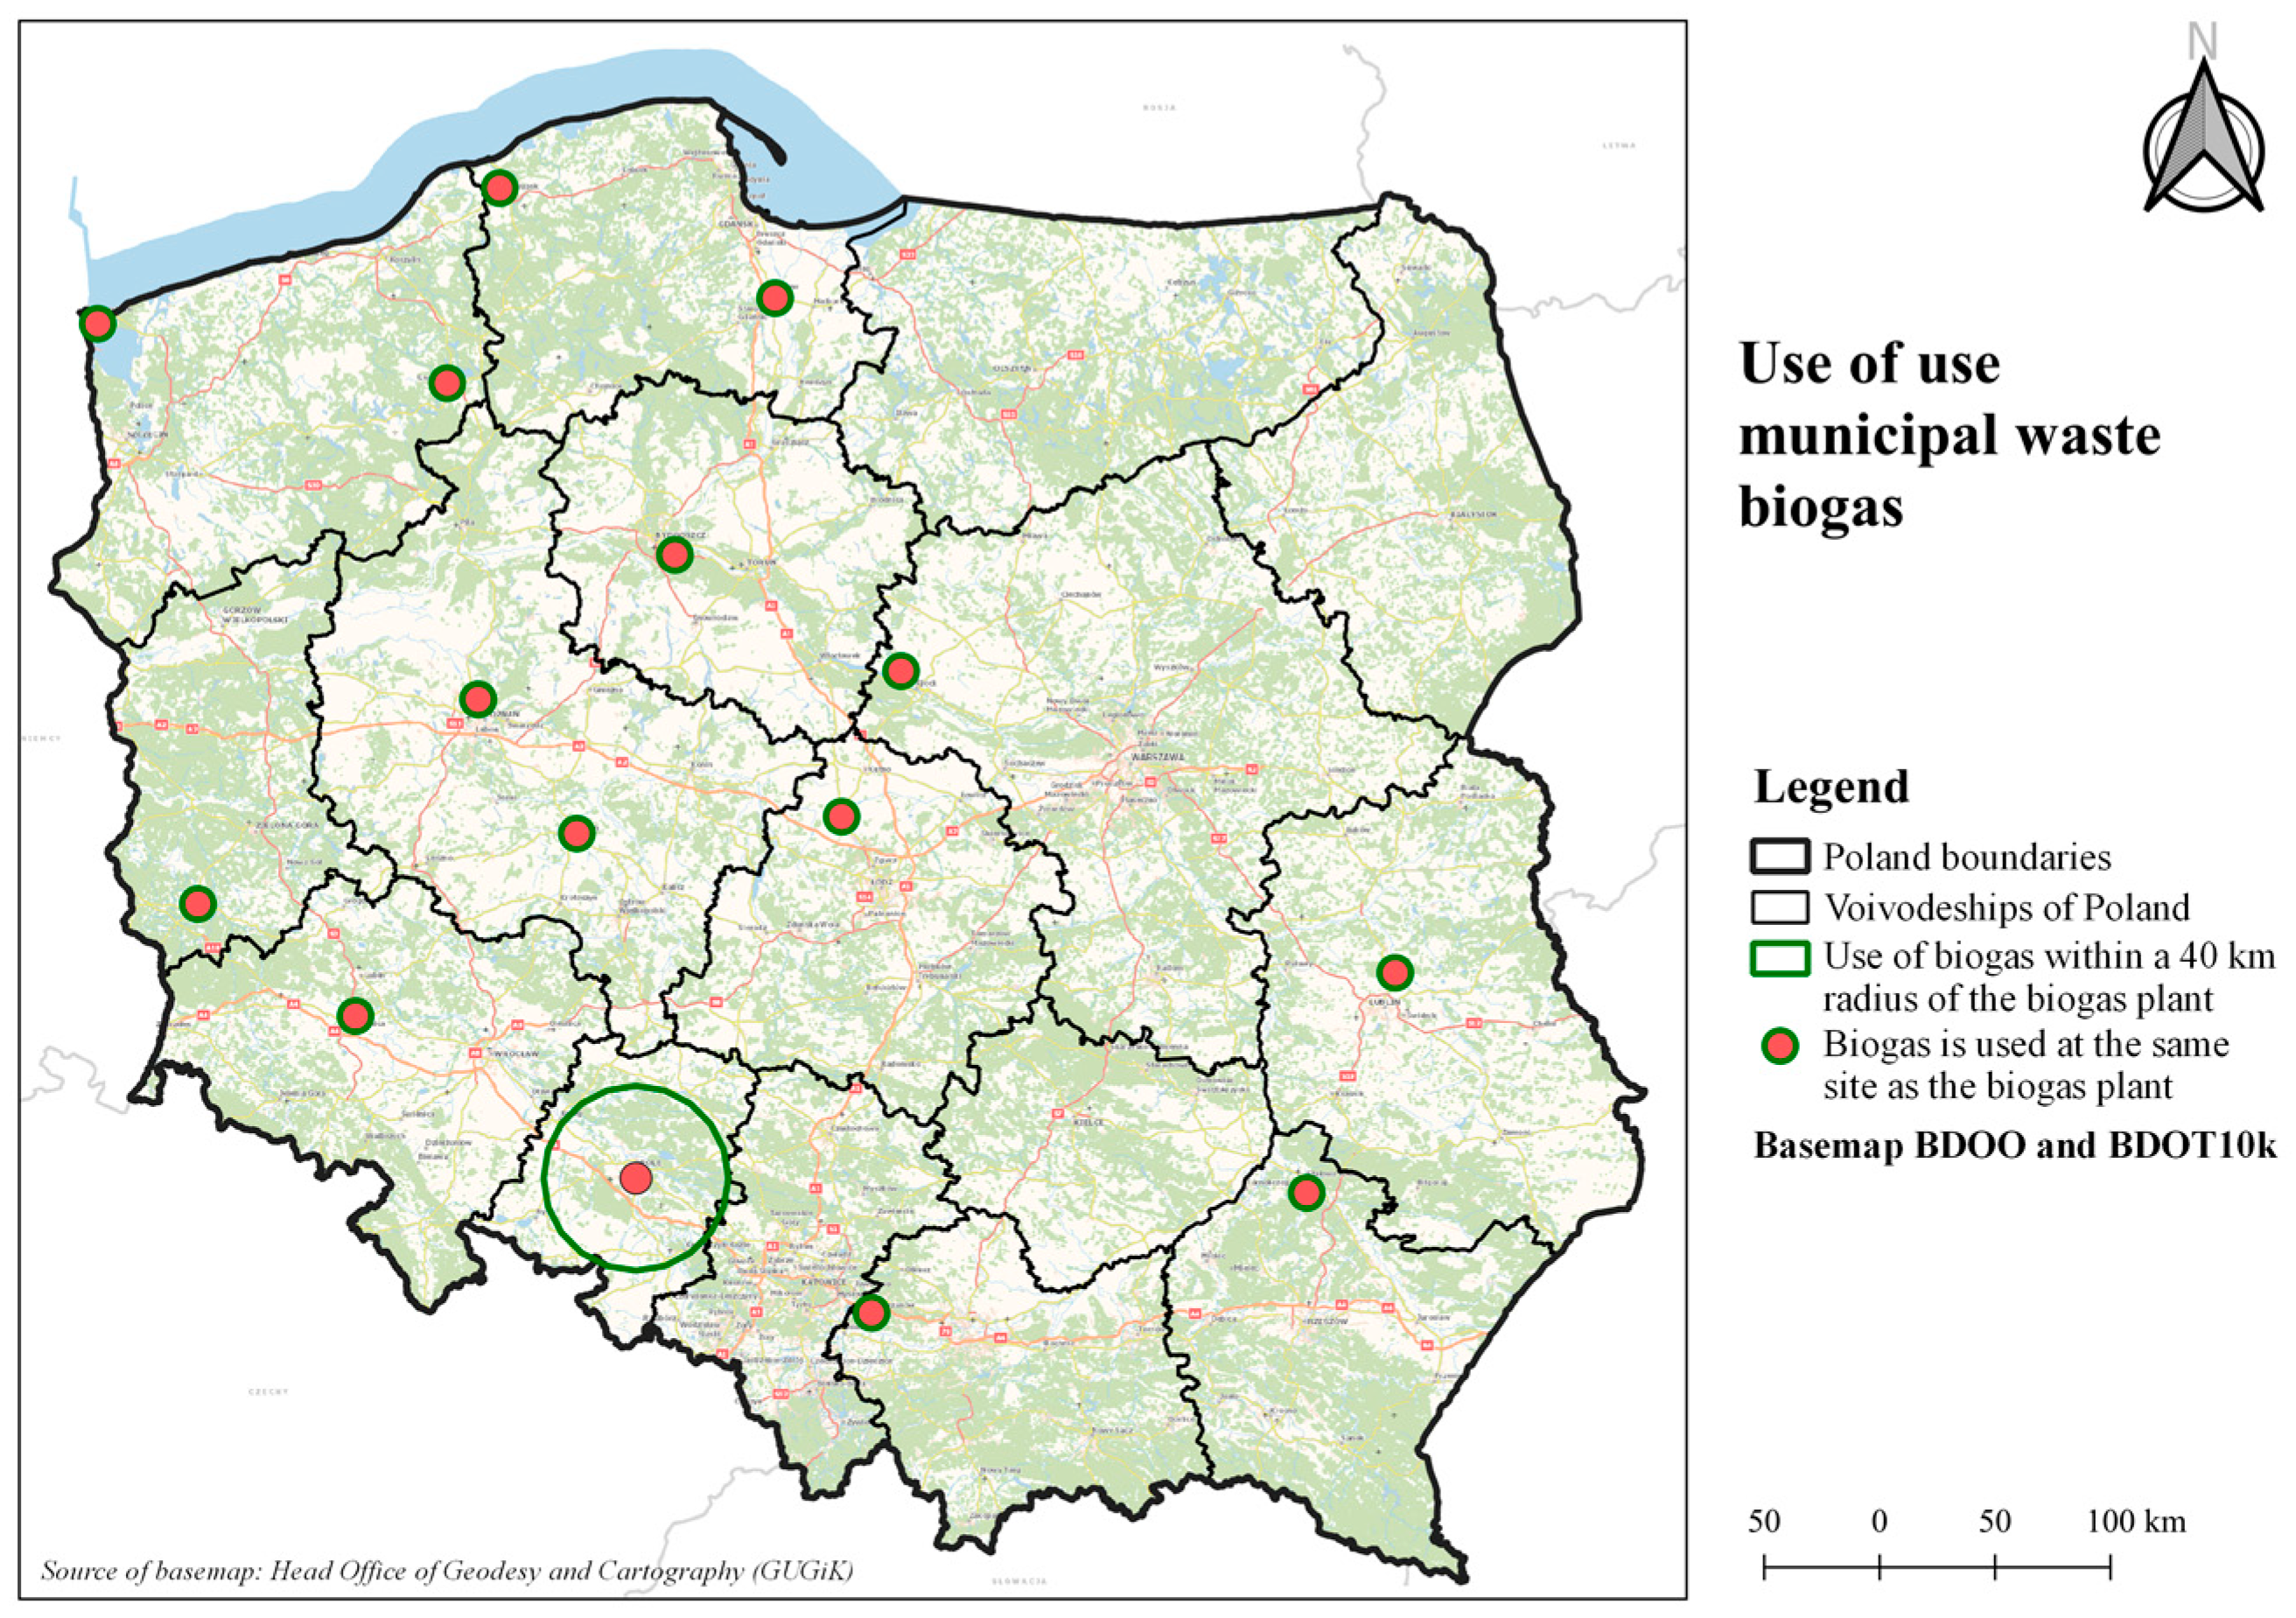
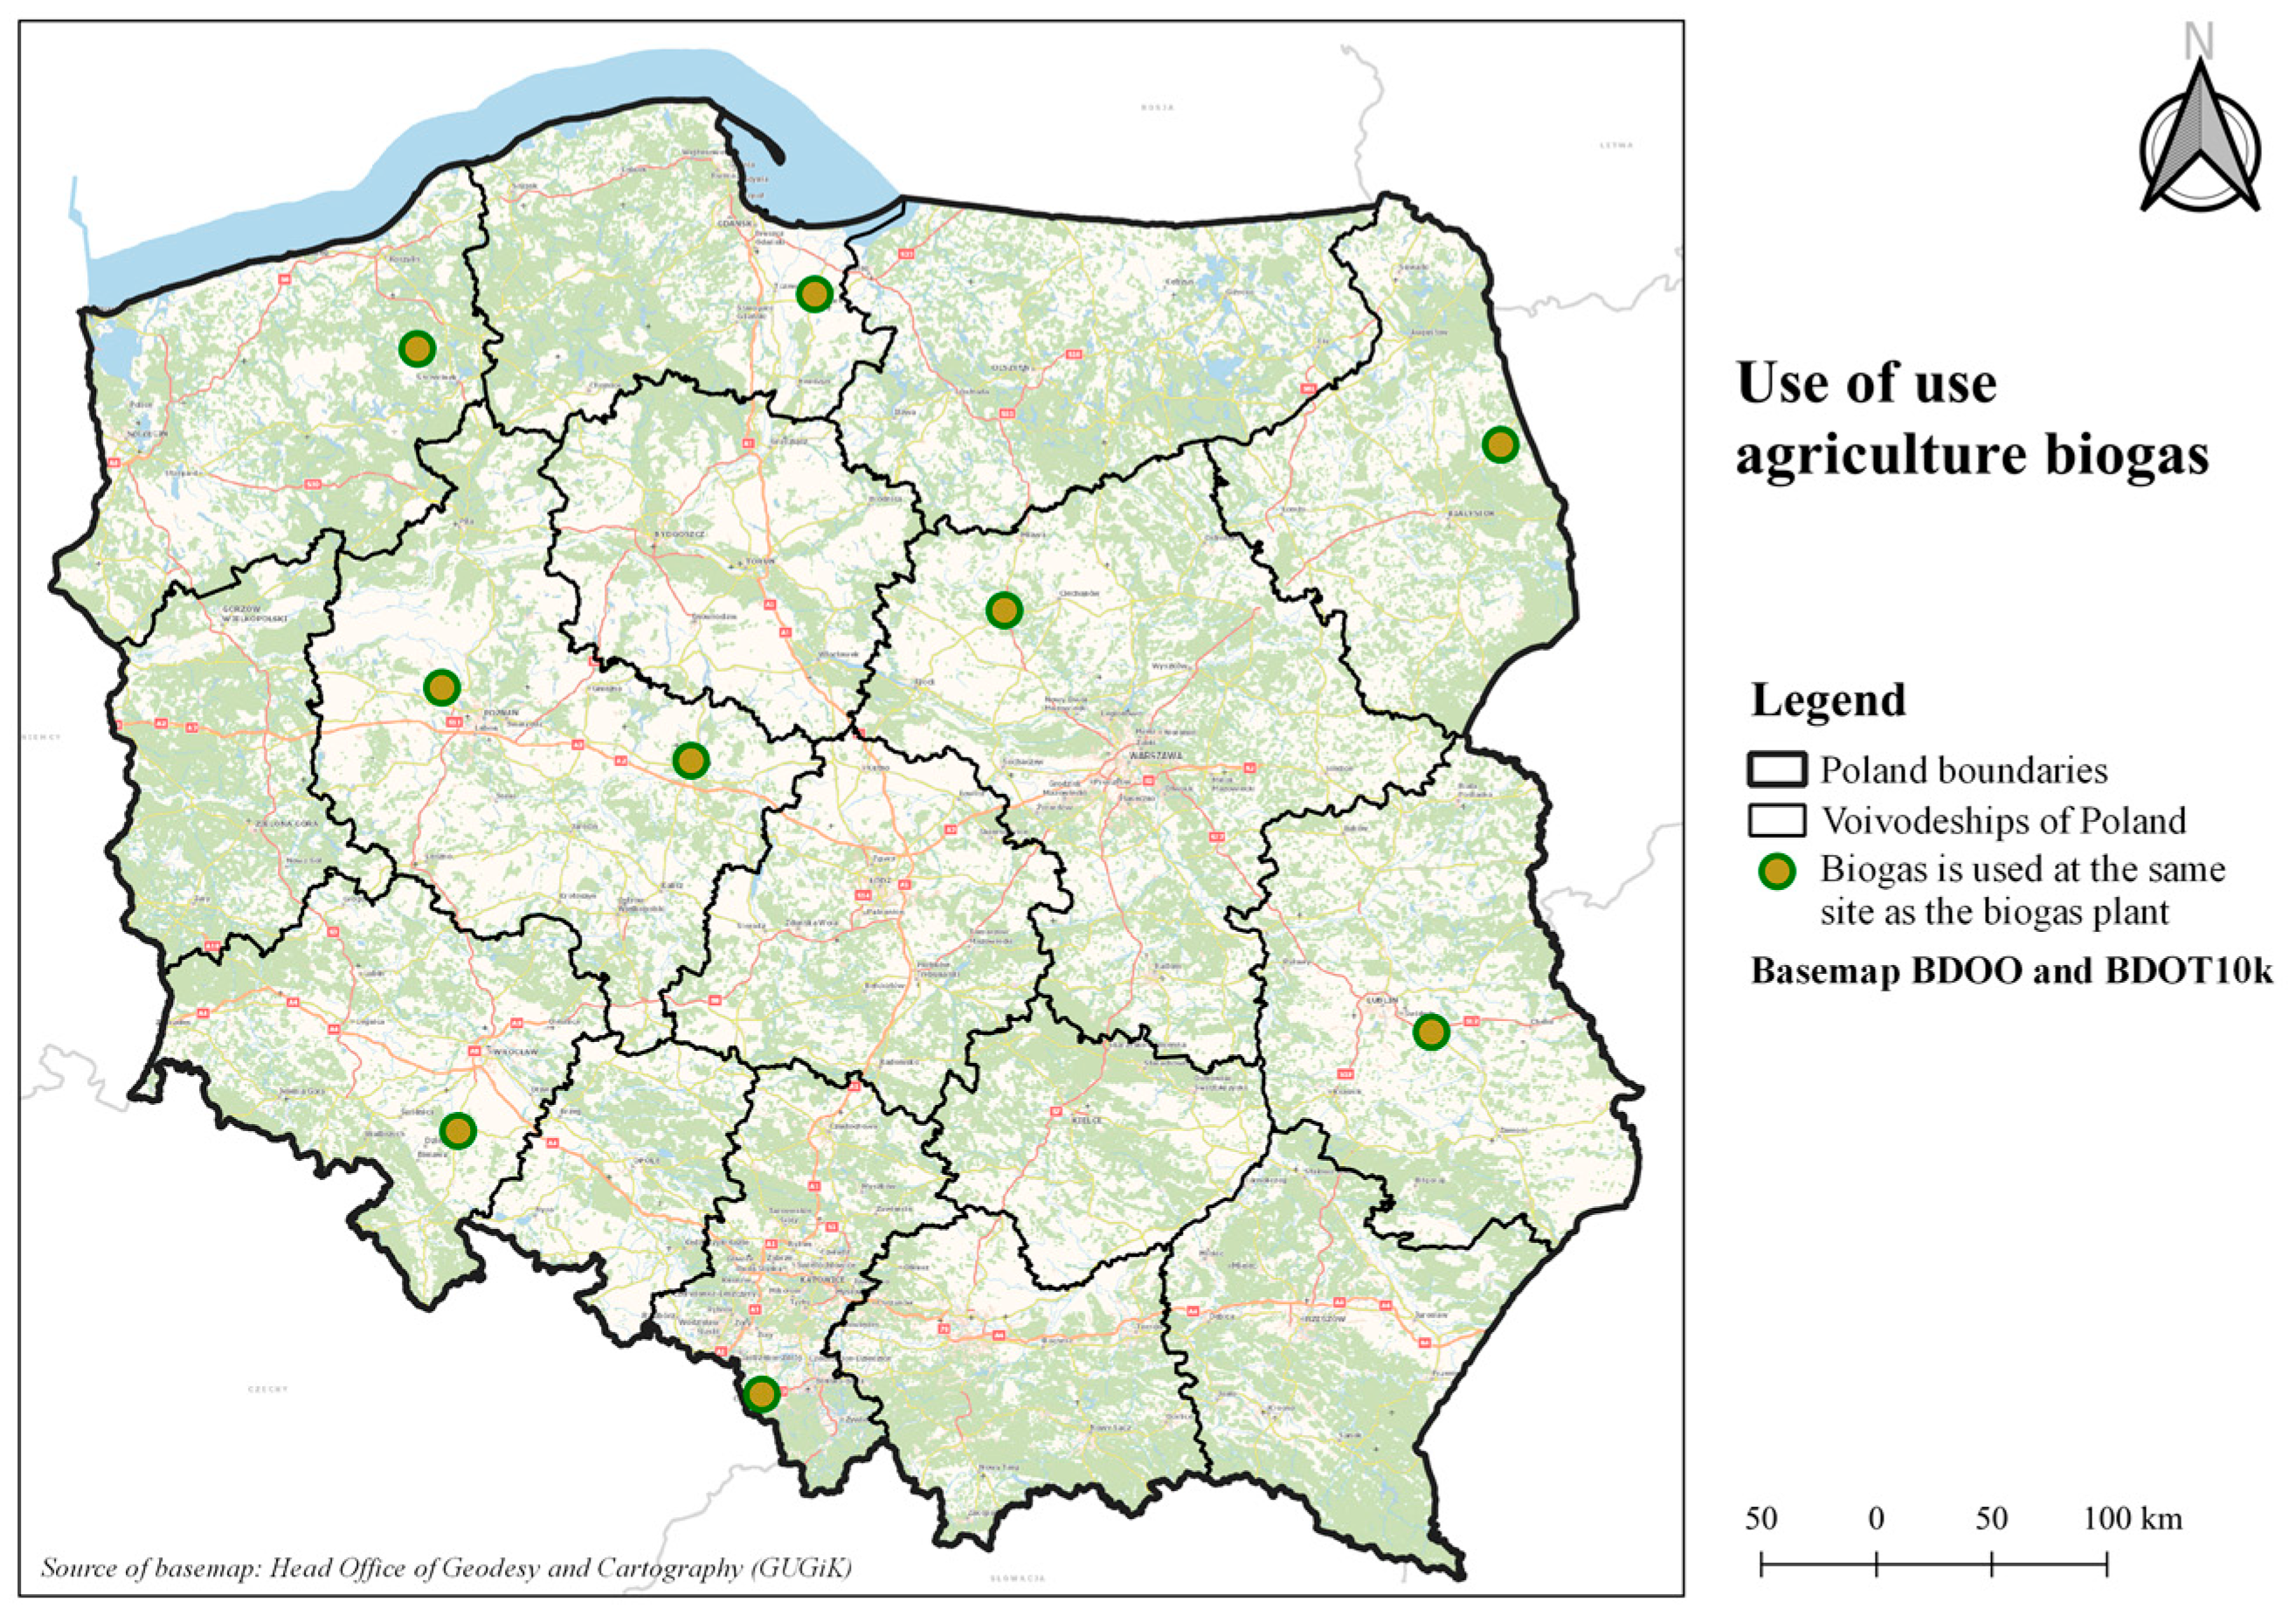
The vast majority of the biogas plants analysed produce biogas exclusively for their own consumption (Table 3). Representatives of two facilities indicated that they sell the surplus produced or give it to the grid. Biogas produced from one biogas plant located in Opole (Figure 7) is used by the generating facility and within a 40 km radius of the biogas plant. This is a municipal waste-fuelled biogas plant with an installed capacity of 0.528 MW, which is greater than the capacity in more than half of the facilities of this type. In the case of biogas plants located at sewage treatment plants and agricultural biogas plants, the biogas produced is used exclusively for the facilities’ own needs (Figure 8 and Figure 9).
The use of the energy generated in biogas plants is decidedly local. This is due to the small amounts of energy generated in the waste treatment process. All biogas plants use the energy generated for the plant’s own needs. Any excess is fed into the grid. Representatives of one biogas plant powered by municipal waste declare that, in addition to using the energy for their own needs, any excess is used within a 40 km radius of the biogas plant.

3.3. Management of Fermentation Waste

In order to clarify information about the operation of the biogas plants, additional questions were asked about the amount of fermentation waste produced and how it was managed. Unlike the previous questions, this part was open-ended, which influenced the number (17) of responses received. Below are the two questions that were asked of the biogas plant representatives and an analysis of the responses received:
  • What is the percentage of fermentation waste in relation to substrate you feed into the biogas plan (e.g., on average in one month the fermentation waste constitutes X% of the total substrate weight)?
Some units omit statistics on the amount of waste generated. They treat the fermentation waste as equal to substrate, assuming that 100% of the output mass is input mass. There were 3 responses stating that there was no data and 5 responses stating that the waste volume is up to 15% of the substrate mass. The remaining responses are highly variable, on a dry weight basis, with a ratio of waste to substrate dry weight of between 25% and 69%.
2.
How do you manage fermentation waste? If you transfer fermentation waste, do you have information on what happens to it afterwards?
The majority of fermentation waste is transferred to third-party recipients authorised to process this type of waste. Among the ways of managing the fermentation waste are:
  • recultivation of industrial sites;
  • composting and biological transformation processes;
  • fertiliser in agriculture;
  • reclamation of the tailings pile.
Representatives of 4 out of the 17 plants in their responses did not indicate that the fermentation waste is managed by external customers. The declared ways of managing the fermentation waste from these plants were fertiliser in agriculture and thermal disposal.

4. Discussion and Conclusions

Biogas plants are facilities where waste is converted into energy in the form of biogas. This contributes to the reuse of the raw material and its integration into a new production cycle. The premise of a circular economy is that the aim is to minimise their production through, among other things, local cooperation between businesses and society in many dimensions. The results of studies carried out confirm that biogas plants can be a local solution for managing part of man-made waste. The substrates that biogas plants use are mostly sourced from the sites where the biogas plant is located. Unfortunately, for some of the biogas plants, the substrate is sourced from an area with a radius of up to 50 km, and one plant (an agricultural biogas plant) declared that it sources material from further than 50 km away. Looking for an analogy to other systems, such distances in the case of food systems, are treated as local systems (even up to 100 km) [46,47]. However, this does not change the fact that it is worthwhile to strive to minimise this distance, reducing the transportation needs of the system while at the same time increasing energy independence in local systems. In terms of energy use, analysed biogas plants should be considered definitely local, which has a positive impact on the environment and energy system.
Biogas plants also generate waste, and the amount of waste varies. Scientific studies say that the fermentation waste is about 85–95% of the weight of the raw materials used [20,48,49,50]. Thanks to biological treatment, the waste generated in biogas plants can be used in a variety of ways. According to studies [19,20,51,52], the most common use of fermentation waste is as a fertiliser in agriculture, which was also mentioned in this study. That corresponds with approaches observed by Grešlová et al. [53] in different countries, where materials from agricultural production can support other processes, re-shaping the energy metabolism of these areas. As a result, we can increase the autonomy of rural areas in energy dimension [54]. There are mechanisms to support the development of different renewable energy installations, including biogas [55,56]. However, studies carried out for Central Europe confirm that future development of biogas plants should change from direct government subsidies to a more self-sufficient business model that emphasizes collaboration, participation and the inclusion of local stakeholders in decision-making, as well as the use of locally produced agricultural waste and residential biowaste as energy sources [57].
Among the analysed biogas plant types, plants at sewage treatment plants are characterised by the highest locality in their operation. The vast majority, 88%, of the biogas plants of this type studied obtain their substrate from the same location. In the case of a biogas plant at a sewage treatment plant, the substrate is sewage sludge, but it should be borne in mind that the sewage arriving at the plant is an intermediate substrate. It is from this that the sludge that feeds the biogas plants is produced during the biological treatment of the wastewater. The local character of the operation also manifests itself in the management of the biogas produced. Each biogas plant of this type uses the energy generated for the plant’s own needs. In the case of agricultural biogas plants and biogas plants fuelled by municipal waste, a typical relationship cannot be clearly identified. The substrate of most plants is obtained from the same locations where the biogas plants are located. The transport distance of the material for some plants reached up to 50 km for biogas plants fuelled by municipal waste and more than 50 km for biogas plants fuelled by agricultural waste. At the same time, it should be noted that, compared to the transport needs of energy raw materials at distances of hundreds or thousands of kilometres for waste incineration plants identified in the literature (transport mainly from Germany, the Netherlands, Norway, Denmark and Finland to Sweden in 1999–2002) [22], the transport of substrate to Polish biogas plants is definitely of a more local character. With regard to the biogas produced, it should be added that, in the case of biogas plants located at sewage treatment plants and agricultural biogas plants, it is used in the vast majority also for the plant’s own needs. When considering the transport of the substrate and the produced biogas together, biogas plants next to a sewage treatment plant are characterised by the relatively lowest transport needs of the system.
The analysis carried out showed that biogas plants do not have a very high installed capacity. Therefore, they should not be considered as large-scale energy generation facilities. While biogas plants can be demand-supplementing plants, they will not be the main source of energy due to their low energy production at the moment. It is not possible to say that biogas plants are energy self-sufficient because, like other renewable energy sources, they are characterised by power output variability over time. Almost all biogas plants (98%) participating in the survey use the biogas produced exclusively for their own needs.
While interpreting the obtained results one has to bear in mind some of the limitations of this research. First of all, evaluation of whether the operation of biogas installations in Poland fits the concept of a circular economy was carried out only based on assessment of how local installations operate. Complex evaluation would require cost analysis and environmental analysis. The approach proposed in this paper is, therefore, an example of the indirect estimation of a renewable energy situation. The other limitation is the fact that access to information about biogas installations was different depending on the respondents’ willingness to answer. However, considering that public statistics and reports do not include this information, such a limited approach was the only possible way to conduct this experiment.
In summary, the circular economy is a challenge that countries will be grappling with over the coming years. Biogas plants, seemingly small energy production facilities, have an impact on local waste management. Transforming the current economic system is possible, but it requires clear regulations and consistency in action. It is a chance for rural areas to diversify agriculture activities by contributing to socio-economic systems in additional ways than just traditional food production [58]. At the same time, biogas plants should be implemented in such a way as to properly communicate with local communities in order to involve them in this transformation [59]. There is an important role to evaluate for such plants from the perspective of social issues covering social involvement, acceptance, needs and ultimately the social value of these investments [60]. Research carried out as part of this study has shown that the operation of biogas plants in Poland is compatible with the goals of a circular economy using local energy resources. To increase their local character, the locations of new biogas plants should be chosen in such a way as to minimise the need for substrate transport. By successful implementation of biogas systems on a larger scale, we can target two Sustainable Development Goals, namely: 7. Affordable and clean energy, and 12. Responsible consumption and production [61].

Author Contributions

Conceptualization, J.K.K.; methodology, A.L. and J.K.K.; validation, J.K.K.; formal analysis, A.L.; investigation, A.L.; resources, A.L.; data curation, A.L.; writing—original draft preparation, A.L. and J.K.K.; writing—review and editing, J.K.K.; visualization, A.L.; supervision, J.K.K.; funding acquisition, J.K.K. All authors have read and agreed to the published version of the manuscript.

Funding

This research received no external funding.

Data Availability Statement

Data available on request due to privacy restrictions.

Conflicts of Interest

The authors declare no conflict of interest. The research was conducted as part of the completion of a master’s thesis of the first author, supervised by the second author.

References

  1. European Commission. European Green Deal; COM(2019) 640 Final; European Commission: Brussels, Belgium, 2019. [Google Scholar]
  2. Langergraber, G.; Castellar, J.A.C.; Pucher, B.; Baganz, G.F.M.; Milosevic, D.; Andreucci, M.-B.; Kearney, K.; Pineda-Martos, R.; Atanasova, N. A Framework for Addressing Circularity Challenges in Cities with Nature-Based Solutions. Water 2021, 13, 2355. [Google Scholar] [CrossRef]
  3. Service of the Republic of Poland. Ministry of Development and Technology. Available online: https://www.gov.pl/web/rozwoj-technologia/gospodarka-o-obiegu-zamknietym (accessed on 2 March 2022).
  4. Ellen MacArthur Foundation. Towards the Circular Economy: Business Rationale for an Accelerated Transition; Ellen MacArthur Foundation: Isle of Wight, UK, 2015. [Google Scholar]
  5. Oberle, B.; Bringezu, S.; Hatfield-Dodds, S.; Hellweg, S.; Schandl, H.; Clement, J.; Cabernard, L.; Che, N.; Chen, D.; Droz-Georget, H.; et al. Global Resources Outlook 2019: Natural Resources for the Future We Want; A Report of the International Resource Panel; United Nations Environment Programme: Nairobi, Kenya, 2019. [Google Scholar]
  6. WWF. Living Planet Report 2020—Bending the Curve of Biodiversity Loss; Almond, R.E.A., Grooten, M., Petersen, T., Eds.; WWF: Gland, Switzerland, 2020. [Google Scholar]
  7. Nzelibe, I.U.; Ojediran, D.D.; Moses, M. Geospatial Assessment and Mapping of Suitable Sites for a Utility-scale Solar PV Farm. Geomat. Environ. Eng. 2022, 16, 79–101. [Google Scholar] [CrossRef]
  8. Davybida, L.; Wyczałek, I.; Plichta, A. Using GIS and SDSS Tools in the Design of a Photovoltaic System for a Built-up Roof. Geomat. Environ. Eng. 2022, 16, 31–58. [Google Scholar] [CrossRef]
  9. Mitka, B.; Klapa, P.; Gniadek, J. Use of Terrestrial Laser Scanning for Measurements of Wind Power Stations. Geomat. Environ. Eng. 2019, 13, 39–49. [Google Scholar] [CrossRef]
  10. Greinert, A.; Mrówczyńska, M.; Grech, R.; Szefner, W. The Use of Plant Biomass Pellets for Energy Production by Combustion in Dedicated Furnaces. Energies 2020, 13, 463. [Google Scholar] [CrossRef]
  11. Woch, F.; Hernik, J.; Sankowski, E.; Pióro, P.; Pazdan, M.; Noszczyk, T. Evaluating the Potential Use of Forest Biomass for Renewable Energy: A Case Study with Elements of a Systems Approach. Pol. J. Environ. Stud. 2020, 29, 885–891. [Google Scholar] [CrossRef]
  12. Greinert, A.; Mrówczyńska, M.; Szefner, W. The Use of Waste Biomass from the Wood Industry and Municipal Sources for Energy Production. Sustainability 2019, 11, 3083. [Google Scholar] [CrossRef]
  13. Cvetkovic, S.; Kaludjerović Radoičić, T.; Kijevcanin, M. Perspective of using biogas in Serbia in European context. Energy Sources Part B Econ. Plan. Policy 2017, 12, 372–376. [Google Scholar] [CrossRef]
  14. Hernik, J.; Noszczyk, T.; Rutkowska, A. Towards a better understanding of the variables that influence renewable energy sources in eastern Poland. J. Clean. Prod. 2019, 241, 118075. [Google Scholar] [CrossRef]
  15. Furmankiewicz, M.; Richard, J.H.; Kazak, J.K. Can rural stakeholders drive the low-carbon transition? Analysis of climate-related activities planned in local development strategies in Poland. Renew. Sustain. Energy Rev. 2021, 150, 111419. [Google Scholar] [CrossRef]
  16. Furmankiewicz, M.; Hewitt, R.J.; Janc, K.; Kazak, J. Europeanisation of energy policy and area-based partnerships: Regional diversity of interest in renewable energy sources in local development strategies in Poland. IOP Conf. Ser. Earth Environ. Sci. 2020, 609, 012033. [Google Scholar] [CrossRef]
  17. Chodkowska-Miszczuk, J.; Kulla, M.; Novotný, L. The Role of Energy Policy in Agricultural Biogas Energy Production in Visegrad Countries. Bull. Geogr. Socio-Econ. Ser. 2017, 35, 19–24. [Google Scholar] [CrossRef]
  18. Bazan-Krzywoszańska, A.; Skiba, M.; Mrówczyńska, M.; Sztubecka, M.; Bazuń, D.; Kwiatkowski, M. Green energy in municipal planning documents. E3S Web Conf. 2018, 45, 00006. [Google Scholar] [CrossRef]
  19. Kowalczyk-Juśko, A. Rozwój Innowacyjnych Technologii Odnawialnych Źródeł Energii na Obszarach Wiejskich; Centrum Doradztwa Rolniczego w Brwinowie: Radom, Poland, 2020; ISBN 978-83-66776-01-2.
  20. Makara, A.; Kowalski, Z.; Fela, K. Zagospodarowanie substancji pofermentacyjnej w aspekcie bezpieczeństwa ekologicznego. Prace Nauk. Akad. Im. Jana Długosza Częstochowie. Tech. Inform. Saf. Eng. 2017, 5, 177–190. [Google Scholar] [CrossRef]
  21. Europejska Agencja Środowiskowa. Nie na Moim Podwórku—Transport Odpadów do Innych Krajów a Środowisko. Available online: https://www.eea.europa.eu/pl/articles/nie-na-moim-podworku-2014-transport-odpadow-do-innych-krajow-a-srodowisko (accessed on 8 June 2022).
  22. Olofsson, M.; Sahlin, J.; Ekvall, T.; Sundberg, J. Driving forces for import of waste for energy recovery in Sweden. Waste Manag. Res. 2005, 23, 3–12. [Google Scholar] [CrossRef] [PubMed]
  23. Mundler, G.; Criner, G. Food Systems: Food Miles. In Encyclopedia of Food and Health; Elsevier: Amsterdam, The Netherlands, 2016; pp. 77–82. [Google Scholar] [CrossRef]
  24. Ke, J.; Khanna, N.; Zhou, N. Indirect estimation of willingness to pay for energy technology adoption. Appl. Energy 2022, 312, 118701. [Google Scholar] [CrossRef]
  25. Pirelli, T.; Chiumenti, A.; Morese, M.M.; Bonati, G.; Fabiani, S.; Pulighe, G. Environmental sustainability of the biogas pathway in Italy through the methodology of the Global Bioenergy Partnership. J. Clean. Prod. 2021, 318, 128483. [Google Scholar] [CrossRef]
  26. Sawale, S.; Patil, D.; Joshi, C.; Rachappanavar, B.; Mishra, D.; Kulkarni, A. Biogas Commercialization: Commercial Players, Key Business Drivers, Potential Market, and Fostering Investment. In Biogas Production; Balagurusamy, N., Chandel, A.K., Eds.; Springer: Cham, Switzerland, 2021; pp. 343–387. ISBN 978-3-030-58827-4. [Google Scholar]
  27. Picardo, A.; Soltero, V.M.; Peralta, M.E.; Chacartegui, R. District heating based on biogas from wastewater treatment plant. Energy 2019, 180, 649–664. [Google Scholar] [CrossRef]
  28. Naroznova, I.; Møller, J.; Scheutz, C. Characterisation of the biochemical methane potential (BMP) of individual material fractions in Danish source-separated organic household waste. Waste Manag. 2016, 50, 39–48. [Google Scholar] [CrossRef]
  29. Morales-Polo, C.; Cledera-Castro, M.d.M.; Revuelta-Aramburu, M.; Hueso-Kortekaas, K. Enhancing Energy Recovery in Form of Biogas, from Vegetable and Fruit Wholesale Markets By-Products and Wastes, with Pretreatments. Plants 2021, 10, 1298. [Google Scholar] [CrossRef]
  30. Valentino, F.; Lorini, L.; Pavan, P.; Majone, M. Development of a Biorefinery Platform for Urban Waste Valorisation into Biogas and Added-value Products. Chem. Eng. Trans. 2021, 86, 13–18. [Google Scholar] [CrossRef]
  31. Chen, S.; Tao, Z.; Yao, F.; Wu, B.; He, L.; Hou, K.; Pi, Z.; Fu, J.; Yin, H.; Huang, Q.; et al. Enhanced anaerobic co-digestion of waste activated sludge and food waste by sulfidated microscale zerovalent iron: Insights in direct interspecies electron transfer mechanism. Bioresour. Technol. 2020, 316, 123901. [Google Scholar] [CrossRef]
  32. Bentivoglio, D.; Chiaraluce, G.; Finco, A. Economic assessment for vegetable waste valorization through the biogas-biomethane chain in Italy with a circular economy approach. Front. Sustain. Food Syst. 2022, 6, 1035357. [Google Scholar] [CrossRef]
  33. Klimek, K.; Kapłan, M.; Syrotyuk, S.; Bakach, N.; Kapustin, N.; Konieczny, R.; Dobrzyński, J.; Borek, K.; Anders, D.; Dybek, B.; et al. Investment Model of Agricultural Biogas Plants for Individual Farms in Poland. Energies 2021, 14, 7375. [Google Scholar] [CrossRef]
  34. Cucchiella, F.; D’Adamo, I.; Gastaldi, M. An economic analysis of biogas-biomethane chain from animal residues in Italy. J. Clean. Prod. 2019, 230, 888–897. [Google Scholar] [CrossRef]
  35. Yazan, D.M.; Cafagna, D.; Fraccascia, L.; Mes, M.; Pontrandolfo, P.; Zijm, H. Economic sustainability of biogas production from animal manure: A regional circular economy model. Manag. Res. Rev. 2018, 41, 605–624. [Google Scholar] [CrossRef]
  36. de Jesus, R.H.G.; Barros, M.V.; Salvador, R.; de Souza, J.T.; Piekarski, C.M.; de Francisco, A.C. Forming clusters based on strategic partnerships and circular economy for biogas production: A GIS analysis for optimal location. Biomass Bioenergy 2021, 150, 106097. [Google Scholar] [CrossRef]
  37. Sovacool, B.K.; Axsen, J.; Sorrell, S. Promoting novelty, rigor, and style in energy social science: Towards codes of practice for appropriate methods and research design. Energy Res. Soc. Sci. 2018, 45, 12–42. [Google Scholar] [CrossRef]
  38. Ma, X.W.; Wang, M.; Lan, J.K.; Li, C.D.; Zou, L.L. Influencing factors and paths of direct carbon emissions from the energy consumption of rural residents in central China determined using a questionnaire survey. Adv. Clim. Chang. Res. 2022, 13, 759–767. [Google Scholar] [CrossRef]
  39. Bedi, A.S.; Sparrow, R.; Tasciotti, L. Indonesia’s Domestic Biogas Programme—Household panel survey data. Data Brief 2018, 17, 1388–1390. [Google Scholar] [CrossRef]
  40. Katuwal, H. Biogas adoption in Nepal: Empirical evidence from a nationwide survey. Heliyon 2022, 8, e10106. [Google Scholar] [CrossRef]
  41. Burg, V.; Troitzsch, K.G.; Akyol, D.; Baier, U.; Hellweg, S.; Thees, O. Farmer’s willingness to adopt private and collective biogas facilities: An agent-based modeling approach. Resour. Conserv. Recycl. 2021, 167, 105400. [Google Scholar] [CrossRef]
  42. Feiz, R.; Johansson, M.; Lindkvist, E.; Moested, J.; Påledal, S.N.; Ometto, F. The biogas yield, climate impact, energy balance, nutrient recovery, and resource cost of biogas production from household food waste—A comparison of multiple cases from Sweden. J. Clean. Prod. 2022, 378, 134536. [Google Scholar] [CrossRef]
  43. Alao, M.A.; Popoola, O.M.; Ayodele, T.R. Sustainable prime movers selection for biogas-based combined heat and power for a community microgrid: A hybrid fuzzy multi criteria decision-making approach with consolidated ranking strategies. Energy Convers. Manag. X 2022, 16, 100281. [Google Scholar] [CrossRef]
  44. Urząd Regulacji Energetyki. Instalacje Odnawialnych Źródeł Energii—Stan na 31 Grudnia 2021 r. Available online: https://www.ure.gov.pl/pl/oze/potencjal-krajowy-oze/8108,Instalacje-odnawialnych-zrodel-energii-stan-na-31-grudnia-2021-r.html (accessed on 30 October 2021).
  45. Lubańska, A. The Role of Biogas Plants in Circular Economy. Master’s Thesis, Wrocław University of Environmental and Life Sciences, Wrocław, Poland, 2022. [Google Scholar]
  46. Świąder, M.; Szewrański, S.; Kazak, J.K. Foodshed as an Example of Preliminary Research for Conducting Environmental Carrying Capacity Analysis. Sustainability 2018, 10, 882. [Google Scholar] [CrossRef]
  47. Augère-Granier, M.L. Short Food Supply Chains and Local Food Systems in the EU; European Parliament: Strasbourg, France, 2016. [Google Scholar]
  48. Łucka, I.A.; Kołodziej, A.U.; Szymańska, M.; Pilarski, K. Rolnicze wykorzystanie masy pofermentacyjnej z biogazowni rolniczej. In Wykorzystanie Biomasy w Energetyce, Aspekty Ekonomiczne i Ekologiczne; Jasiulewicz, M., Ed.; Polskie Towarzystwo Ekonomiczne: Koszalin, Poland, 2011; pp. 277–304. [Google Scholar]
  49. Węglarzy, K. Agro Biogazownia; Podkówka, W., Ed.; Zakład Doświadczalny Instytutu Zootechniki PIB: Grodziec Śląski, Poland, 2010. [Google Scholar]
  50. Węglarzy, K.; Skrzyżala, I.; Pellar, A. Agricultural biogas plant in Kostkowice, First experiences. J. Res. Appl. Agric. Eng. 2011, 56, 189–192. [Google Scholar]
  51. Igliński, B.; Buczkowski, R.; Cichosz, M. Biogazownie rolnicze w Polsce—Stan aktualny, potencjał, analiza SWOT. Rynek Energii 2015, 3, 93–101. [Google Scholar]
  52. Curkowski, A.; Oniszk-Popławska, A.; Mroczkowski, P.; Zowsik, M.; Wiśniewski, G. Przewodnik dla Inwestorów Zainteresowanych Budową Biogazowni Rolniczych; Instytut Energetyki Odnawialnej: Warszawa, Poland, 2011. [Google Scholar]
  53. Grešlová, P.; Štych, P.; Salata, T.; Hernik, J.; Knížková, I.; Bičík, I.; Jeleček, L.; Prus, B.; Noszczyk, T. Agroecosystem energy metabolism in Czechia and Poland in the two decades after the fall of communism: From a centrally planned system to market oriented mode of production. Land Use Policy 2019, 82, 807–820. [Google Scholar] [CrossRef]
  54. Woch, F.; Hernik, J.; Linke, H.J.; Sankowski, E.; Bęczkowska, M.; Noszczyk, T. Renewable Energy and Rural Autonomy: A Case Study with Generalizations. Pol. J. Environ. Stud. 2017, 26, 2823–2832. [Google Scholar] [CrossRef]
  55. Kazak, J.K.; Kamińska, J.A.; Madej, R.; Bochenkiewicz, M. Where Renewable Energy Sources Funds are Invested? Spatial Analysis of Energy Production Potential and Public Support. Energies 2020, 13, 5551. [Google Scholar] [CrossRef]
  56. Chodkowska-Miszczuk, J. Institutional Support for Biogas Enterprises—The Local Perspective. Quaest. Geogr. 2019, 38, 137–147. [Google Scholar] [CrossRef]
  57. Chodkowska-Miszczuk, J.; Martinat, S.; Kulla, M.; Novotný, L. Renewables projects in peripheries: Determinants, challenges and perspectives of biogas plants—Insights from Central European countries. Reg. Stud. Reg. Sci. 2020, 7, 362–381. [Google Scholar] [CrossRef]
  58. Chodkowska-Miszczuk, J.; Szymańska, D. Agricultural biogas plants-Achance for diversification of agriculture in Poland. Renew. Sustain. Energy Rev. 2013, 20, 514–518. [Google Scholar] [CrossRef]
  59. Chodkowska-Miszczuk, J. A new narrative for sustainability: Exploring biogas plants as ‘first movers’ in raising energy awareness. Aust. J. Environ. Educ. 2022, 38, 152–167. [Google Scholar] [CrossRef]
  60. Mazzanti, M.; Modica, M.; Rampa, A. The biogas dilemma: An analysis on the social approval of large new plants. Waste Manag. 2021, 133, 10–18. [Google Scholar] [CrossRef]
  61. D’Adamo, I.; Ribichini, M.; Tsagarakis, K.P. Biomethane as an energy resource for achieving sustainable production: Economic assessments and policy implications. Sustain. Prod. Consum. 2023, 35, 13–27. [Google Scholar] [CrossRef]
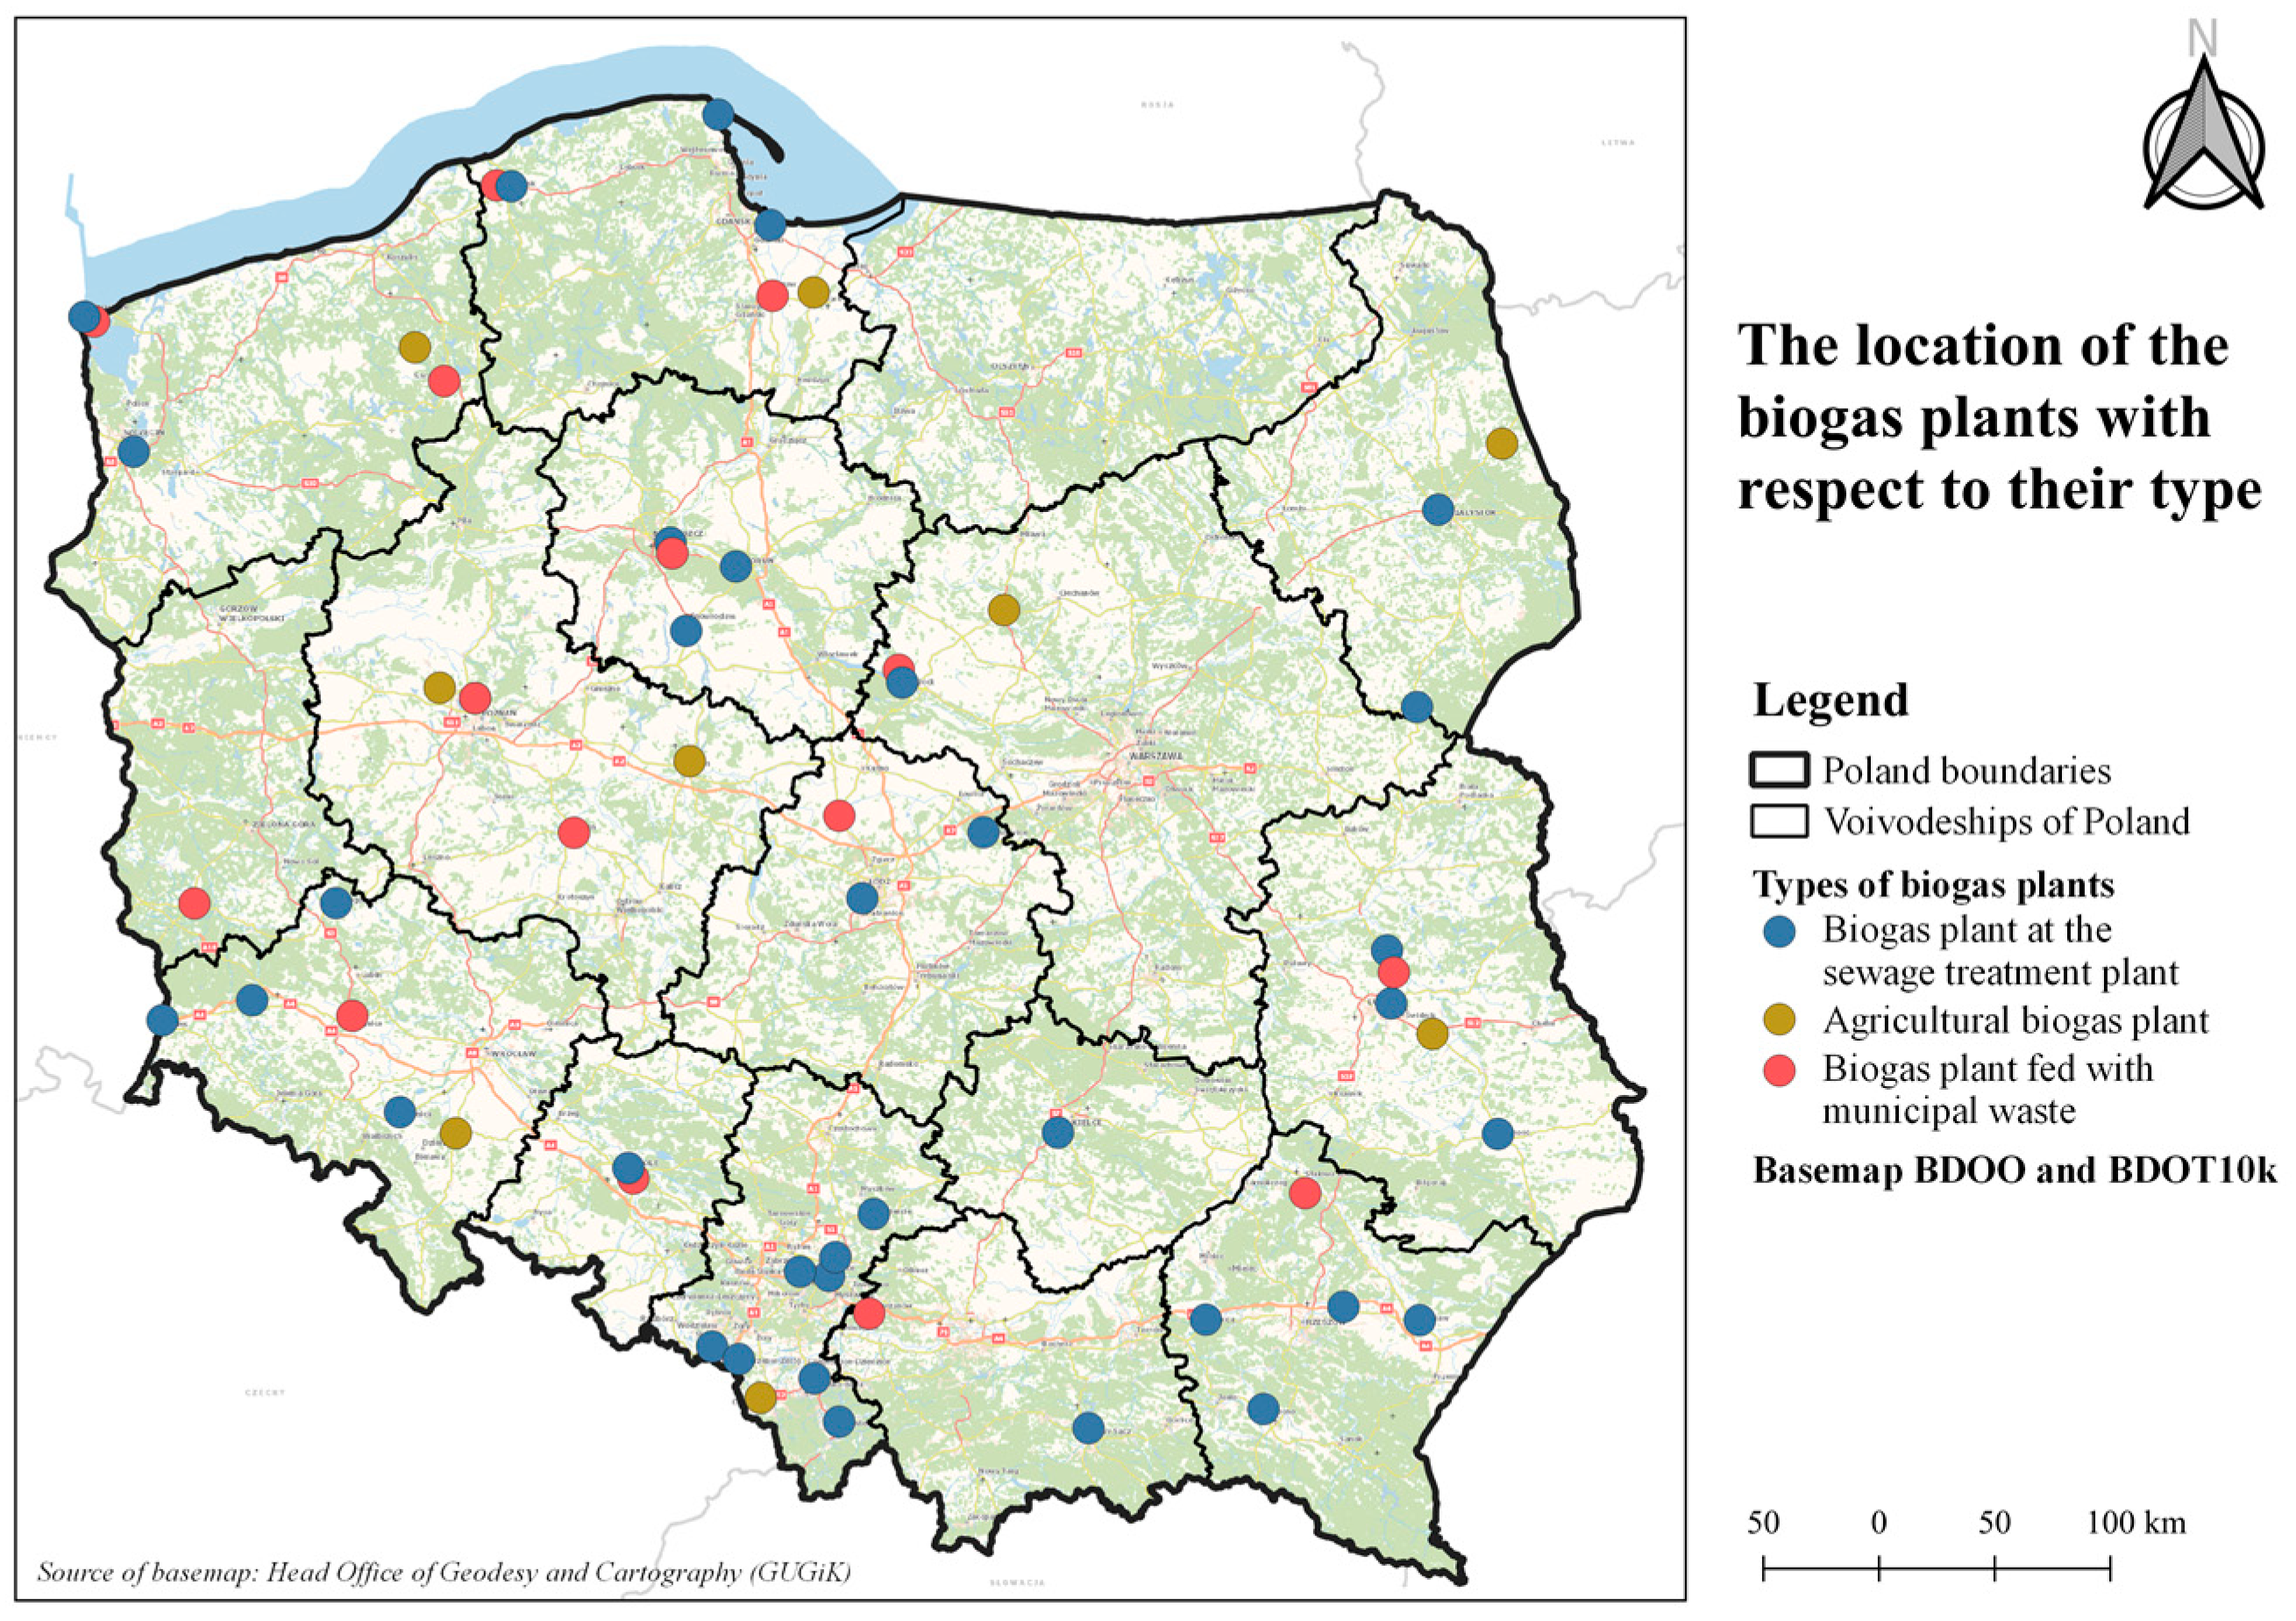
Figure 1. Location of biogas plants with type designation, source: own development in QGIS 3.22.7.
Energies 16 03801 g001
Figure 2. Histogram of installed capacity at all biogas plants, source: own compilation in Tableau 2021.4.
Energies 16 03801 g002
Figure 3. Box plot of installed capacity by type of biogas plant, source: own compilation in Tableau 2021.4.
Energies 16 03801 g003
Figure 4. Distance of biogas plant substrate procurement at wastewater treatment plants, source: own development in QGIS 3.22.7.
Energies 16 03801 g004
Figure 5. Distance of substrate acquisition of municipal waste biogas plants, source: own development in QGIS 3.22.7.
Energies 16 03801 g005
Figure 6. Distance of substrate acquisition of agricultural biogas plants, source: own development in QGIS 3.22.7.
Energies 16 03801 g006
Figure 7. Use of use municipal waste biogas, source: own elaboration in QGIS 3.22.7.
Energies 16 03801 g007
Figure 8. Use of use sewage treatment plant biogas, source: own elaboration in QGIS 3.22.7.
Energies 16 03801 g008
Figure 9. Use of use agriculture biogas, source: own elaboration in QGIS 3.22.7.
Energies 16 03801 g009
Table 1. Basic statistical parameters of installed capacity.
MeasureGroup 1
[MW]
Group 2
[MW]
Minimum value0.0500.050
Maximum value15.5364.266
Arithmetic mean1.1380.890
Median0.5620.561
Standard deviation2.0890.844
Source: own elaboration.
Table 2. Distance of substrate acquisition by biogas plants participating in the survey.
DistanceType of Biogas Plant
Biogas Plant at the Sewage Treatment PlantBiogas Plant Fed with Municipal WasteAgricultural Biogas Plant
Up to 10 km111
Up to 20 km-1-
Up to 30 km321
Up to 40 km-11
Up to 50 km-53
Over 50 km--1
The material is sourced from the same site as the biogas plant3262
Source: own elaboration.
Table 3. Distance of biogas use and entities using produced biogas.
Distance the Use of BiogasWho Uses Manufactured Biogas
Our Company/FarmOur Enterprise/Farm, the Surplus Is Sold or Given to the Network
Biogas is used at the same site as the biogas plant582
Up to 40 km1-
Source: own elaboration.
Disclaimer/Publisher’s Note: The statements, opinions and data contained in all publications are solely those of the individual author(s) and contributor(s) and not of MDPI and/or the editor(s). MDPI and/or the editor(s) disclaim responsibility for any injury to people or property resulting from any ideas, methods, instructions or products referred to in the content.