Abstract
This article concerns the identification of connections between the energy intensity of rail transport and spatial integration (convergence processes in the EU and spatial proximity) and the economic situation of countries that are in international export–import trade relations. Three research questions are formulated in the article: (1) Does the improvement of the economic situation of the importing country reduce the energy intensity of the Polish export of goods by rail transport to the partner country? (2) Does EU integration contribute to reducing the energy intensity of the export of goods by rail transport? (3) Is there a positive spatial effect (convergence) of reducing the energy intensity of the export of goods by rail transport? This study concerned 14 geographical destinations (export destinations from Poland) during the years 2010–2020. A comprehensive study of convergence was used by building a spatial (club) and type β convergence model and using an unconventional method (panel stationarity analysis). It has been verified that there is a convergence in the energy intensity of goods exportation by rail transport in EU countries. The rate of spatial (club) convergence is 8.66% per year, while the period after which this convergence will be halfway between the initial state and the long-term equilibrium point is 8 years.
1. Introduction
The development of rail transport has stimulated the level of trade since ancient times and has served as a stand-in for economic and civilizational advancement, as it formed the basis for the first forms of competitiveness of transport modes [1,2,3,4]. At first, it boosted the economies of the areas by creating backward links, understood as the requirement for building supplies and labor, and forward links, understood as the minimization of transport costs [1,5]. The development of the earliest forms of mobility and the shift in the interaction between space and humans brought about by steam, then electric, then diesel trains also affected the integration of areas through the building of networks of rail lines. Despite the proliferation of motorization and road transport in the 20th century, rail transport is still vital to globalization, network links, and trade [5,6,7].
The major importance of rail transport in the new “dual circulation” plan is simultaneously underlined, in addition to noting its considerable contribution to increasing the level of international trade between nations located along rail lines and those at the intersection of land links [8]. In other words, by maintaining an open economy, the country may reduce its reliance on foreign markets by focusing on raising domestic demand (or internal demand of integrated countries, e.g., the European Union), and concentration. The integration and liberalization of transport (also rail transport) were additional manifestations of this globalization [9,10].
The integration of the rail policies of European Union countries was intended, on the one hand, to face the difficulties of sustainable growth and ensure country synergy through reciprocal access to infrastructure, and to encourage the principles of fair competition [9,11,12]. On the other hand, it encouraged the development of rail transport, including intermodal rail freight services. It also outlined transport cooperation with countries, including in the European Neighborhood Policy [11]. The dynamic progress in rail transport in modern economies stems mainly from the expansion of the TEN-T network, the implementation of digital technologies, the implementation of the European Rail Traffic Management System (ERTMS) as a means of interoperability, or the possibility of implementing many EU railway programs for the development of rail transport [13,14]. However, the relatively small participation of this mode in the servicing of all international trade in the EU indicates that rail transport does not yet fully exploit its potential in long-distance transport (more than 300 km) [15]. This tendency can be a challenge for sustainable development, especially as it is one of the least energy-intensive modes of transport [16,17,18]. In the context of energy dependence, a limited supply of energy carriers, and tense international relations, there is a strong argument for promoting rail transport in meeting the needs of society and the economy to sustain development.
Three research questions were used to frame the problem for the study:
- 1.
- Does the improvement of the economic situation of the importing country reduce the energy intensity of Polish export of goods by rail transport to the partner country?
- 2.
- Does EU integration contribute to reducing the energy intensity of the export of goods by rail transport?
- 3.
- Is there a positive spatial effect (convergence) of reducing the energy intensity of the export of goods by rail transport?
A research hypothesis was put forward: the energy intensity of the export of goods by rail is strongly dependent on the convergence processes in the European Union, spatial proximity, and the economic situation of the importing country.
This article aims to identify linkages between the energy intensity of rail transport with spatial integration and the economic condition of countries with international trade relations with Poland (as an exporter of goods). The article uses Data Science methods with elements of spatial econometrics. A model of spatial (club) convergence and type β convergence was built for the measurement of the energy intensity of the export of goods by rail transport. The authors filled the research gap in the form by identifying the relationships between the energy intensity of goods exporting by rail transport depending on the convergence process in the European Union, the spatial proximity, and the economic situation of the importing countries. The presented approach is a novel one which addresses the energy intensity of exporting goods by rail transport and can be adapted to other modes of transport, total exportation, and in all directions to other countries.
This research is original and up-to-date in the field of transport, trade, and international business. Entities whose domains are in the above areas must respect the provisions of the sustainable development strategy and the European Green Deal. The results from the analysis of the dependence of the energy intensity of the export of goods by rail on the average distance and volume of transport may be essential for them too, but in addition, the patterns for club and type β convergences in the analyzed system of partner countries are important. Knowledge of these dependencies will rationalize decision-making processes in the context of meeting the requirements of the initiatives already taken for less energy-intensive and zero-emission transport. Currently, modern economies strive to become independent of energy imports (especially in the time of increasing conflicts); therefore, in the era of the multiplication of crises, the undertaken research brings additional cognitive values. The studies are transnational and indicate the promotion of rail transport in the entire transport system, which is important for maintaining sustainable development (in particular, minimizing the energy consumption of transport).
The article is divided into five sections. An introduction is first. In the second section, a narrative review of key issues and a body of methodological reviews on energy consumption patterns in rail transport are carried out. The research problems related to the hypothesis and purpose, the scope of the study, the data, and the methodology are described in the third section. The fourth section provides the findings of the empirical investigation and a discussion of it. Conclusions are described at the end of the article.
2. Background of Rail Transport Development
2.1. A Brief History of Rail Transport
An emblem of contemporary civilization and economic advancement was rail transport [5,19]. For one thing, it is acknowledged that the introduction of the railroad led to even greater improvements in transport. Additionally, rail transport was an example of an extraordinary development in terms of achieving cheaper costs of land transport compared to water transport [5].
Rail lines have been in use since prehistoric (ancient) times, when carts were pulled by people, horses, or gravity. In Greece, freight carts moved on tracks chiseled into the rock, and in the 16th century, Germany and other nations used wooden-railed wagonways. The introduction of the steam engine helped contemporary railroads advance more quickly. The first steam locomotive to travel on smooth tracks was created and built by Richard Trevithick in 1804 [1]. Railroad development was the fastest in Europe and the United States. All European nations developed their first rail lines (Table 1) before the end of the 19th century, and some of them were even joined into a trans-border system, demonstrating their international nature as a key characteristic [1].

Table 1.
The first rail lines in European countries in the 19th century.
The construction of the railroad in the 19th century marked the beginning of a period in which inland transport underwent major quality progress. After the first steam locomotives were built, there was a period of rapid advancement and the introduction of cutting-edge technical solutions. Assembling techniques and the fundamental ratios between the boiler, furnace, and cylinder were prioritized in the locomotive’s early stages of development, while the multiplication of power and speed was sought in later stages, which at the turn of the 19th century led to the introduction of the rail using electric and diesel traction [21]. The development of locomotives was accompanied by changes in the design of freight and passenger wagons, and the necessity to accommodate varied transport requirements prompted their specialization [22,23]. The increase in railway transport capacity was even faster, caused by the lengthening of trains, increasing the average load capacity of wagons, and the power and speed of railway vehicles. Currently, the main goal of traction vehicle constructors is to increase energy efficiency and thus lower fuel consumption per unit of work (reduced energy consumption), which is also associated with lower emissions of toxic compounds into the atmosphere. New ideas are also being sought for how trains are driven and associated with new energy sources (alternative fuels), which are also being sought as transport technology advances [24,25]. Historically, over the centuries, the development of rail transport has faced technical, economic, ecological, and social challenges. It has been tested over time and is an example of harmonizing the dimensions of sustainable development.
2.2. Rail Transport in the Light of Sustainable Development, Energy Dependency, and COVID-19
One of modern civilization’s megatrends is sustainable development, which emphasizes the need to balance social, environmental, and economic objectives [26,27]. Furthermore, it is emphasized that meeting the needs of future generations should not be viewed through the prism of their excessive consumption [28,29]. Numerous studies have addressed sustainable development and ways to reduce energy use in transport [16,30,31,32,33]. This subject is given considerable attention in an era of increasing shocks, including crises and disturbances, particularly those connected to the scarcity of energy resources [34,35,36,37]. The Sustainable Development Goals (SDGs) are a wake-up call for the world to adopt a sustainable perspective [27,38,39,40]. A prominent policy agenda for addressing global environmental issues and promoting sustainability is energy intensity improvement [41,42,43,44].
One of the least energy-intensive modes of transport is rail [16,17,18]. Despite its low energy intensity, rail transport was affected by stagnation and a fuel crisis. In the economic history of rail, there have been crises of an economic and social nature, especially fuel crises, which strengthened the stagnation of rail transport (for example, PKP Polskie Koleje Państwowe). In the 1980s, the fuel crisis limited the activity of rail transport, and the unprofitability of certain sections of rail lines was also strongly emphasized. The stagnation associated with the energy intensity of rail transport was also symbolized by the economically unjustified electrification of rail lines [45]. The harmony between the economic, social, and ecological order has been disturbed. Therefore, rail transport should be particularly important for actions aimed at sustainable transport. It is crucial to accomplishing Sustainable Development Goals and is deeply ingrained in the Sustainable Development Paradigms, such as the Shift Paradigm, Decoupling Paradigm, and Decarbonization Paradigm [46,47]. The rail system is ideally positioned to play a significant role in the development of a sustainable transport system [48]. It is important to examine the convergence of energy intensity to determine the path of sustainable development [49,50,51,52,53]. Originally, the convergence theory was used only to study income (e.g., GDP, value added) inequality between countries [54,55,56], but more and more often it refers to energy intensity [49,52]. Knowledge of the convergence of energy intensity allows for the determination of ecological constraints. This allows emerging countries to strive for a certain level of energy consumption, while developed countries can maintain a certain level of energy consumption [49,50]. Similarly, the analysis can be transferred to the consideration of the share of the transport mode in serving the needs of the economy.
However, the movement towards sustainable development is subject to constant upheavals caused by various factors, most recently by the COVID-19 pandemic. In the last years (2020–2022) of the COVID-19 pandemic, economies experienced a decrease in freight volumes (2019–2020), followed by a rebound (from 2021) [57,58,59,60]. COVID-19 has significantly affected the entire transport system [36,61,62]. However, this required calibrating the adjustment mechanism to the demand and supply patterns caused by disruptions in global supply chains [57,63,64]. Rail transport is believed to have been highly adaptable and resilient to the shocks caused by the COVID-19 pandemic. It is associated with the lever of transport during broken supply chains as a result of COVID-19 [63]. The rebuttal to the disruptions caused by the weakening of economic relations caused by the COVID-19 pandemic, but also to the downward trends in foreign trade and the rise of protectionism in Europe and the United States, was the development paradigm of “Dual Circulation”. It was related to the disconnection of internal circulation in internal economic processes from external circulation drawn by export demand [65]. Such an approach has the potential to reshape the economic model and provide a new perspective on the limits of development as seen through the lens of export-oriented growth [66,67]. Therefore, the importance of rail transport in cargo servicing has recently been raised.
2.3. Energy Consumption of Rail Transport as a Multidimensional Problem
Nowadays, the second fundamental mode of the inland transport of goods is rail. Although its significance has diminished with the growth of road transport, it is still one of the fundamental components of the European transport system [15,68].
In view of the importance of rail transport for the movement of goods, it is destined to move goods (mostly bulk) in block trains, primarily across longer distances (including international relations). Therefore, rail transport should strive to regain this market segment (bulk loads for long distances) from road transport [32,69]. Currently, rail transport is the basic link of combined transport (promoted as part of the implementation of the EU transport policy) [70].
The ongoing pursuit of measures to shift passengers and goods away from road transport and towards modes that have less of a detrimental impact on the environment, such as rail transport, is one of the cornerstones of the EU’s transport strategy [47]. Furthermore, these efforts are crucial for achieving the goals of the EU’s transport policy [71] and environmental policy [72].
In addition to measures aimed at a modal shift, an important element is also the calculation of the increase in the efficiency of transport in individual modes of transport. This relates to lowering energy intensity in a particular mode of transport [73,74,75] as well as lowering emissions of dangerous compounds into the environment [32,76,77]. Another system-wide issue for freight transport is energy security, or having access to enough energy supply at a stable price [78].
Energy intensity is a multidimensional problem in rail transport. It is understood as energy consumption by the mode of transport per unit of transport activity [79] (may be expressed in MJ/pkm for passenger transport or MJ/tkm for freight transport; for comparison purposes, tonnes or kg of oil equivalent are also used—toe/tkm, kgoe/tkm, instead of MJ/tkm). It also takes into account additional parameters other than those that are directly connected to the amount of traction fuel or traction energy consumed. Some of these elements are:
- Constructions of wagons and traction vehicles [16,80,81];
- Types of traction and propulsion vehicles [16,42,76,82], including electric [83,84,85], for example, cells [86,87,88,89], hydrogen [25,89,90,91], hybrid [92];
- Rail infrastructure [42,93,94,95];
- Rail traffic control systems [33,44,95,96];
- Organization of traffic and transport [33,44,88,95];
- Eco-driving [97].
In general, the multidimensionality of the energy intensity of rail transport includes organizational, technical, social, economic, and environmental factors at the level of system adaptation, governance, and the development of international relations.
2.4. Linkages between Rail Transport and Export
The growth of international trade benefits significantly from rail transport. He, Zhan, and Chen [98] looked at how it affected the export of goods with a high value-to-weight ratio. The value of Chinese laptop shipments to Europe are thought to have increased by around EUR 23.18 billion. Moreover, they stressed how intercontinental linkages gave rise to a micro-mechanism that sped up and improved export flows, making rail transport a viable alternative for exporters.
Yan et al. [8] came to the same conclusions. According to them, the “The Bet and Road” initiative’s land link and rail transport (transcontinental rail) facilitate cross-border trade between Chinese cities and other Eurasian metropolitan centers. China’s exports are expanding rapidly due to the construction of new routes and the development of rail services. This mode of transport also enables the implementation of a “dual circulation” approach.
Until 2010, East Asia’s international trade with Europe was carried out by the sea. Although rail connections existed, maritime transport was more competitive than rail transport in terms of cargo servicing. Only since 2011 has the potential of rail transport been noticed. The launch of the connection between Western China and Europe (Chengdu-Łódź, Chongqing-Duisburg) influenced the development of rail transport services in cities in China and the EU. These connections dynamized the market in such a way that the number of containers transported by rail on these routes doubled annually [99,100].
Rail transport was examined by Lu and Li [101] from both the supply and demand sides. They stated that on the demand side, high-speed rail boosts consumption, investment effectiveness, and export scale, which increases the production capacity of businesses.
Rao [102] examined the case of Canada in one of the earliest analyses (1978) of the connection between rail freight and exports. His study shows that one key factor influencing the demand for rail freight transport is the proportion of exports in total production. A similar line of inquiry was made using Pakistan as an example, but with the exception that the effect of international trade (the total of exports and imports) on the demand for rail freight transport was investigated [103].
Brazil is another nation that exemplifies the significance of the rail freight transport system for the development of international economic relations [104,105]. Causal relationships between rail transport corridors running in the vicinity of major economic centers and ports and trade have been noticed, which is also important for the development of production chains in the rail-intensive and export sectors. Researchers pointed out that the implementation of trade policy tools, such as the Greater Brazil Plan and National Exportation Plan, might alter the cost of transport in trade flows and improve the competitiveness of Brazilian exports [104]. From this point of view, it is worth adding that exportation can be equated with a measure of foreign demand when rail transport prices are fixed [106].
In additional research on the example of Poland by Kramarz et al. [107], the impacts of exports were not directly examined, but the focus was on the problem of the reliability of the intermodal transport network in conditions disrupted by rail freight transport. However, the research is relevant in this context, as the researchers noted that the explanation for the number of canceled trains may lie in the reasons attributable to the ordering process of re-exporting the goods. This is a valuable point worth exploring in the future.
Pittman et al. [108] examined the effectiveness of EC policies to move freight from road to rail transport. They also highlighted capacity bottlenecks in the rail sector in Poland, Slovakia, the Czech Republic, and Ukraine. The bottlenecks related to the ability of the wagons to service export and transit traffic were visible through the lost transport potential. This potential has also been lost in terms of shifting capacity (here, grain servicing) to inland waterway transport in Poland and Ukraine due to underinvestment in infrastructure. Pomfret [99] also wrote about the bottlenecks in freight rail transport in the servicing of export cargo. In the East Asia–Europe relationship, the bottleneck is the track change point on the Belarusian–Polish border. Train delays, in their opinion, result from management disruptions, not infrastructural problems. An alternative route through Lithuania to Klaipeda or Kaliningrad, and then by ship to German ports, creates incentives for Poland to improve its hinterland.
Although rail transport is not fully used in the servicing of export cargo, it is a very complex problem to be analyzed, especially in the context of the energy consumption of this mode of transport.
3. Data and Methodology
3.1. Data
The analysis employed secondary data. The data came from the databases listed in Table 2. The 2010–2020 time frame was covered. Due to the availability and integrity of the data, this was the broadest time range that could be studied. A detailed description of the data may be found in Table 2. In order to calculate the energy consumption by rail transport, 2945 data cells were employed. The data was finally organized using panel data (154 observations). The direction of the rail exporting of goods from Poland determined the structure of the data. Poland’s top 14 export destinations to European Union (EU) partners for commodities by rail transport between 2010 and 2020 have been chosen: Austria, Belgium, the Czech Republic, Denmark, France, Germany, Hungary, Italy, The Netherlands, Romania, Slovakia, Spain, Sweden, and the United Kingdom (left EU in 2020; the so-called Brexit). The study did not consider other geographic directions of exports since the available data for the remaining partner nations was only a summary (relatively small share in trade exchange).
Table 2.
Description of the data used in the study.
3.2. Methodology
The research problem was formulated in the form of three research questions:
- 1.
- Does the improvement of the economic situation of the importing country reduce the energy intensity of the Polish export of goods by rail transport to the partner country?
- 2.
- Does EU integration contribute to reducing the energy intensity of the export of goods by rail transport?
- 3.
- Is there a positive spatial effect (convergence) of reducing the energy intensity of the export of goods by rail transport?
A research hypothesis was formulated: the energy intensity of the export of goods by rail is strongly dependent on the convergence processes in the European Union, spatial proximity, and the economic situation of the importing country.
The article aims to identify linkages between the energy intensity of rail transport with the spatial integration and economic condition of countries with international relations with Poland (as an exporter of goods).
To calculate the energy intensity of the export of goods by rail transport, it was necessary to know about the energy intensity of diesel and electric traction (in MJ/thousand gross tkm) and gross transport performance separately for diesel and electric locomotives. This made it possible to estimate the aggregated energy consumption by diesel traction and electric traction using the index method. Data on the total freight transport and the structure of the rolling stock made it possible to separate two measures of energy intensity of the export of goods by rail transport in net terms [MJ/t] from the average freight load per kilometer of the line in gross terms. The energy intensity of rail transport in net terms (hereinafter referred to as energy intensity of rail transport) was related only to the export of goods by rail transport (also taking into account the structure of exports and geographical destinations). It was necessary to estimate the energy consumption of rail transport for the export of goods for different geographical directions. This value, divided by the net transport performance for the export of goods by rail transport, and taking into account geographical relations, allowed us to obtain the energy intensity of the exportation of goods by rail transport. These operations made it possible to clean the data from the curb weight of the rolling stock. Finally, this amount was converted (change of units) into the standardized unit, such as kgoe/thous tkm.
The pre-analysis began with the analysis of selected descriptive statistics for the entire data panel and for individual countries. Then, the average annual energy intensity of the export of goods by rail was visualized on a cartogram. Data visualization allowed the identification of anisotropic spatial correlation. The last step of the pre-analysis was to investigate autocorrelation using univariate Moran’s I statistics [43]. The results of the pre-analysis and the properties of the statistical features allowed for the selection of the appropriate method for the construction of the convergence model of the energy intensity of the export of goods by rail transport (Equation (1)):
where:
- —energy intensity of goods exported by rail transport from Poland to other importing countries i in year t
- —lagged energy intensity of goods exported by rail transport from Poland to other importing countries i in year t
- —volume of transport of goods exported by rail transport from Poland to the importing country i in year t
- —average transport distance of 1 tonne of goods exported by rail transport from Poland to the partner country (importer) i in year t
- —gross domestic product in the importing country i in year t
- —spatially lagged energy intensity of goods exported by rail transport from Poland to other importing countries i in year t
- —structural parameters for endogenous variables
- —structural parameters for exogenous variables
- —spatial autoregressive parameter
- —random component
In the construction of the spatial weight matrix W, the Mahalanobis distance was used to determine the economic distance between the investigated countries importing goods from Poland by rail transport [123,124]. The model was verified on the basis of Arellano–Bond tests (AR(1), AR(2)) for the assessment of first- and second-order autocorrelation and Sargan tests for the assessment of the correctness of over-identifying conditions [125]. In addition, the normality distribution of the residuals and the significance of the coefficients were tested with the Wald test [126].
Based on Equation (1), the rate of β-type convergence can be represented as the relation [55]:
where
- T—number of years in the analyzed period
- α1—structural parameter for endogenous variables from Equation (1)
On the other hand, the length of half of the β-type convergence period can be described by the formula [55]:
Spatial (club) convergence can be additionally determined based on parameter ρ, and the length of half of the convergence period similarly as in Formula (3), except that parameter ρ should be substituted for parameter β.
Convergence can also be investigated using the stationarity testing technique [55,127]. Panel unit root tests will be used in this study, among others: Levin, Lin & Chu (LLC, common root) [128,129], Breitung (common root) [130,131], Im, Pesaran & Shin (IPS, individual root) [129], Fisher-Augumented Dickey–Fuller (Fisher-ADF; ADF-Choi; individual root) [128,132].
Figure 1 presents the framework of the authors’ research procedure (methodology).
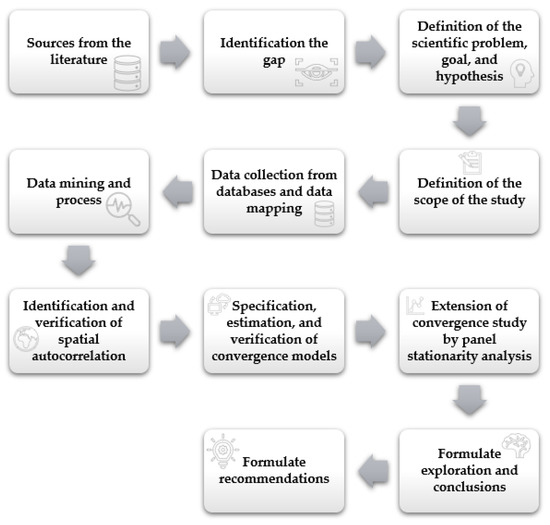
Figure 1.
The framework of the authors’ research procedure (methodology). Source: own elaboration.
4. Results and Discussion
4.1. Findings and Explanations
Table 3 presents selected descriptive statistics for all observations, and Table 4 presents selected statistics for export destinations.
Table 3.
Summary statistics for all observations.
Table 4.
Summary statistics by export destination.
Paying attention to the coefficients of variation contained in Table 3, it can be seen that it was relatively high for all variables. The volume of exports of goods by rail transport had the highest coefficient of variation, which fluctuated around 157%. A slightly lower share of the standard deviation in the mean value was noted for GDP and amounted to 0.972. The volatility of the state of the economy expressed as a measure of GDP is approx. 97%. Following this, it can be seen that the coefficient of variation in the energy intensity of the export of goods by rail transport for all 14 export destinations in the period 2010–2020 was approx. 85%. However, the lowest variability in the analyzed period was characterized by the average distance of transporting one tonne of goods by rail (approx. 46%). Summing up, the assessment of statistical features shows that the analyzed geographical destinations and years were not homogeneous.
The highest average value of energy intensity of the exporting of goods by rail transport in 2010–2020 was recorded for the geographical relationship Poland–Austria. It was 10.81 kgoe/thous. tkm per year. The lowest average annual value of this energy intensity was recorded in the geographic relation Poland–Belgium and Poland–the United Kingdom, at 1.83 kgoe/thous. tkm each. The value of the energy intensity of the export of goods by rail transport in Poland–Germany and Poland–France was the most stable during the analyzed period, but the most destabilized in Poland–Italy relations.
In the analyzed period of 2010–2020, the highest average annual volume of exports of goods from Poland by rail transport was recorded for Germany (5800.65 thous. tonnes), the Czech Republic (3607.45 thous. tonnes), and Austria (1852.17 thous. tonnes). The least average annual volume of exports by rail transport was recorded from Poland to Denmark (170.82 thous. tonnes) and to Belgium (173.74 thous. tonnes). The highest standard deviation, also a measure of instability, was recorded in the analyzed period in Poland–Germany (plus/minus 2965.35 thous. tonnes from an average value) and Poland–Czech Republic (1745.42 thous. tonnes from an average value). The slightest deviation was recorded for Sweden, Belgium, and Denmark.
The smallest average distance of transporting one tonne of goods by rail was recorded in the export relation towards Austria, and the largest towards the United Kingdom and Belgium. Similarly, the smallest deviation for the average distance in the analyzed period was recorded towards Austria, and the largest towards Italy and The Netherlands. This means that Austria is a certain permanent direction for the export of goods from Poland by rail transport in the analyzed period for bulk cargo.
GDP plays an important role in the study of the economic situation of Poland’s trading partners. It can be stated that the average annual GDP level in 2010–2020 was the highest in Germany and the lowest in Slovakia. Similarly, countries can be identified for the standard deviation, which is a measure of economic stabilization or destabilization.
From the perspective of the evaluated relationships with the energy consumption of commodities exported by rail transport, the aforementioned statistics imply that the tested countries—trading partners of Poland—were characterized by economic and spatial diversity.
As shown in Figure 2, it is possible to distinguish more energy-intensive directions of the export of goods by rail transport. There is a strong influence of neighborhood in individual belts. Only Austria plays the role of a hot spot and is located in the vicinity of countries that are less energy-intensive when importing goods from Poland by rail transport. Based on the arrangement of similar values in stripes, it can be concluded that there is anisotropic spatial autocorrelation, which is a function of distance and direction in space. This is consistent with the results of Moran’s univariate and the average energy intensity of exports of goods from Poland by rail. The Moran I statistic is 0.3849 (Figure 3).
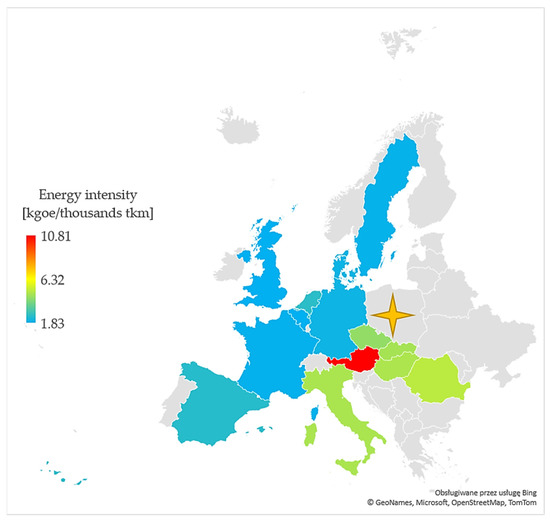
Figure 2.
Average annual energy intensity of goods exported from Poland by rail transport in 2010–2020 (in kgoe/thous. tkm). Note: An asterisk indicates the exporting country (Poland). Source: own elaboration based on data from Table 4. Basemap from © GeoNames [133], Microsoft [134], TomTom [135] (by Bing [136] service, the map generated by MS Excel).
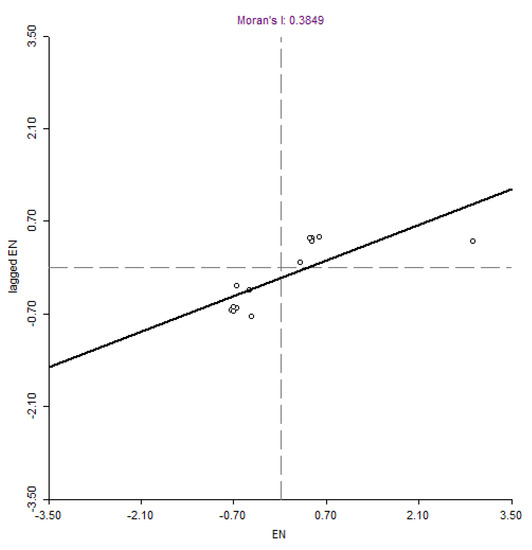
Figure 3.
Moran’s I for average energy intensity of export of goods by rail transport in 2010–2020. Note: the following countries are concentrated in the first quarter of the graph: Austria, the Czech Republic, Hungry, Italy, Romania, and Slovakia, and in the third quarter of the graph: Belgium, Denmark, France, Germany, The Netherlands, Spain, Sweden, and the United Kingdom. Source: own elaboration.
It can be noticed that Poland’s trade partners are concentrated in the 1st and 3rd quadrants of the coordinate system. No country is an “outlier” in this case. Countries in the first quarter of the graph (Figure 3), i.e., Austria, the Czech Republic, Hungary, Italy, Romania, and Slovakia, are characterized by the fact that high values of energy intensity of rail transport in the export–import relationship correspond to large “lagging” values. Belgium, Denmark, France, Germany, The Netherlands, Spain, Sweden, and the United Kingdom are characterized by a low energy intensity of rail transport in the export–import relation corresponding to low delayed values. The above results provide a strong basis for seeking convergence in the energy intensity of the export of goods from Poland to other countries by rail transport. The results of the convergence model are presented in Table 5.
Table 5.
Convergence model of energy intensity of export of goods by rail transport (β type; spatial type).
As it resulted from the model presented in Table 5, the examined variables were statistically significant in the whole system (Wald test) and separately (p-value for coefficients). Based on the Arellano–Bondo test, it is noted that first-order autocorrelation does not occur, whereas second-order autocorrelation does occur. Nevertheless, the Sargan test result unambiguously confirms the superindicating conditions’ correctness. At the same time, based on the statistics, it can be concluded that the model had the appropriate properties.
The following relationships may be found from the coefficient analysis:
- 1.
- An increase in the volume of goods exported from Poland to partner countries by 1% will result in a decrease in the energy intensity of the exportation of these goods by rail transport by 0.023%, ceteris paribus. The elasticity of energy intensity of rail transport is 0.023 with other factors unchanged. It means that the energy intensity of rail transport is inelastic (the percentage change in the energy intensity of rail transport is smaller than the percentage change in the volume of exports). The magnitude of this flexibility may suggest that considering the criterion of energy intensity, rail transport is hardly substitutable and is used to transport specific groups of cargo at a similar volume level during the period in question (slightly changing the volume of exports by rail transport). Therefore, rail transport should be used for the transport of relatively large loads, bulk, and heavy loads (taking into account the maximization of the use of wagons [137]) instead of transport modes that are much more energy-intensive (including road and air transport) and the role of rail transport in the breakdown transport tasks in international relations should increase (in sense of an increase in the potential of rail transport) [15,108].
- 2.
- An increase in the average transport distance of one tonne of exported goods by 1% will result in a decrease in the energy intensity of rail transport by as much as 0.8492%, ceteris paribus. The elasticity of the energy intensity of this transport under the influence of changes in the average distance is much higher than under the influence of changes in the volume of exports, although it can also be described as inelastic according to the theory of economics. However, it can be said without any doubt that the long-distance export of cargo by rail reduces energy intensity to a relatively low level. At the same time, it provides the basis for the promotion of this mode of transport in long-distance international transport, especially for relatively heavy loads, bulk, heavy loads, or containers, which is in line with the sustainable development policy and the shift paradigm [15,47,138,139].
- 3.
- An increase in GDP by 1% will increase the energy intensity of the export of goods by rail transport by 1.017%. With other conditions unchanged, it can be concluded that the elasticity of the energy intensity of the export of goods by rail transport under the influence of changes in GDP is almost proportional. The energy intensity of this transport increases as much as GDP. If the GDP of individual countries increases, the socio-economic conditions of these countries improve, as well as their import possibilities. Investments increase and, at the same time, the demand for transport services increases, which creates an increase in transport activity in various directions. This generates more and more energy intensity of transport if it does not go hand in hand with technological progress.
Moreover, in the presented model, there are two types of convergence of energy intensity of the export of goods by rail transport: spatial (club) and β-type.
The rate of convergence of energy intensity of the export of goods from Poland using β-type rail transport is 10.77%. This means that the level of the energy intensity of the export of goods by rail transport from Poland between importing countries is equalized at the rate of 11% per year. The period after which this convergence will be halfway between the initial state and the point of long-term equilibrium is 6 years and 5 months (half-life time). This convergence takes into account only the dynamics of changes in energy intensity; therefore it seems that a more complete picture is provided by spatial convergence.
Spatial (club) convergence is understood as the occurrence of a group of influences that shape the dynamics of the energy intensity of the export of goods by rail from Poland to other countries in a similar way in neighboring facilities. However, the proximity does not have to be purely geographical [55], because the measure of the distance between the examined spatial units is the difference in shaping the level of energy intensity. The basic convergence of this type includes trade in goods and services, the interpenetration of spatial effects, and capital migration. In addition, club convergence takes into account the diversity of points of long-term equilibrium, which have their source in the occurrence of scale effects, unevenly distributed production factors in space, different stages of development of individual countries, or the occurrence of the unreliability of the market mechanism (occurrence of public goods, externalities or asymmetry of information). It was possible to investigate this by taking into account the phenomenon of spatial autocorrelation in the model. The rate of spatial (club) convergence is 8.66%, whereas the period after which this convergence will be halfway between the initial state and the long-term equilibrium point is 8 years.
Table 6 presents an unconventional approach to convergence identification, based on stationarity analysis.
Table 6.
Convergence study by panel stationarity analysis.
Table 6 clearly shows that regardless of the method of identification or estimation of the pace of convergence, it undoubtedly occurs, as evidenced by the analysis of the stationarity of the panels. Based on the tests of LLC, Beitrung, IPS, Fischer-ADF, and ADF-Choi, it should be recognized that there is convergence in the analyzed panel. In other words, the differences in the levels of energy intensity of rail transport in the export of goods from Poland to the 14 analyzed countries of the European Union are becoming blurred. The common EU policy and the adopted railway packages contribute to this [9,10,12,15,71]. It is also a confirmation that this is a case of club convergence [127]. This means that EU integration is conducive to reducing the energy intensity of the export of goods by rail transport.
4.2. The Role of Rail Transport in Combined Transport in the View of Technological Evolution
It is undeniable that rail transport is a mode of transport with low energy intensity compared to other modes (e.g., road or air transport) and it has the potential to reduce the energy intensity of the entire transport sector (e.g., through the implementation of the EU Shift-to-Rail program). The presented research results indicate the course of the convergence (polyconvergence) process in the EU regarding the energy intensity of the export of goods by rail transport. The study considers spatial and economic factors in a dynamic approach at the megaeconomic level. However, this approach could be extended, beyond the analysis of rail transport itself, in consideration of combined transport in a wider dimension. The research results are complemented by a discourse on the role of rail transport as part of combined transport in light of technological progress from the point of view of economic benefits and limitations. Combined door-to-door transport significantly outperforms its single-modal alternative to road transport (Euro 6) in terms of energy efficiency. In recent UIRR studies, an increase in savings of 40–70% and a decrease in carbon footprints of 60–90% have been noted [140]. In the case of classic rail–road transport, the advantage of transport only by road in terms of flexibility, accessibility, or directness is indisputable. The solution is to promote and implement rail–road transport as the essence of combined transport (understood by the EU definition) to a broader extent. In addition to the requirements resulting from the definitions, attention should also be paid to such elements as:
- IT and telematics solutions (e.g., electronic documentation, tracking of shipments, motor vehicles, trains, wagons, etc.);
- Optimization of travel routes to/from the terminal from/to the client, dynamic response to changing conditions on the route (road transport);
- Optimization of the time of changing the means of transport by the load unit in rail–road terminals, which requires good work organization both on the side of carriers (rail and road) and the terminal;
- Appropriate technical speeds of freight trains—especially fast freight trains running between terminals (depending on the condition of the rail infrastructure, condition of railway traffic control (RTC) devices, and condition of rolling stock);
- Appropriate commercial speeds for freight trains; proper organization of freight transport understood also through the prism of shuttle transport between terminals without unnecessary stops along the route, including railway lines dedicated (or with preference, e.g., at night) to freight transport;
- Good synchronization of the time of arrival at the terminal with departure (truck → train, train → truck)—elimination or minimization of possible temporary storage of load units.
The efficiency of transshipment terminals is influenced, among other things, by the modernity of transshipment equipment, the level of digitization, and the connection of the terminal infrastructure with the lines of the TEN-T network [140].
The fundamental presumptions underlying the growth of rail–road transportation include [141]:
- A rise in the need for transport, accompanied by difficulty in supplying that need alone by road transportation;
- The need to protect the environment (including reducing energy consumption), which determines the directions of development of the economy and transport;
- Shifting the weight of transportation demands (user preferences)—raising the significance of timeliness and flexibility;
- The deterioration of the quality of road transport services, as well as the rising costs of congestion;
- Development of multiple forms of combined transport, e.g., transport of swap bodies, semi-trailers, and containers; transport of full motor vehicles (ro-la), bimodal transport (allows you to select the best option based on the size of the load lot, company fleet, transport distances, and other characteristics).
The International Union for Road-Rail Combined Transport (UIRR) points to numerous positive effects of door-to-door combined transport [140]:
- Reducing the dependence of European economies on energy imports;
- Reduction of the carbon footprint to 90% generated by land freight transport;
- Easing traffic congestion by shifting freight from road transport to rail transport;
- Mitigation of harmful emissions of noise, particulate matter, and other environmental pollutants;
- Mitigation of road infrastructure degradation.
Wojewódzka-Król [141] emphasizes that the problem of the profitability of combined transport is debatable. The benefits obtained depend primarily on the conditions of their implementation and the preferences of customers (society). However, it points to the benefits for the customer, road haulers, rail, and the environment. A well-functioning combined transport system can be advantageous for [141]:
- The customer through greater punctuality, and transport time comparable to road transport, ensuring door-to-door transport and greater reliability;
- Road haulers by making more efficient use of transportation means; intermodal unit is transported by rail and road vehicles can be used for other short-distance transport; labor savings;
- The rail transport by providing more rail freight volumes, enabling shorter turnaround times for block trains;
- The environment (from the point of view of external cost [142]) by reducing road traffic, energy intensity, air pollution, noise, and land use; increasing safety.
However, the barriers to the development of combined transport are still as follows: an insufficiently developed network of terminals, infrastructural barriers (determining the speed of trains), lack of rolling stock, lack of sufficient incentives to use this technology, and instability of the intermodal relief (a financial tool reducing the fee for access to railway infrastructure for intermodal transport) [141,143].
In addition, UIRR noticed the interpenetration of six global orders important for international business, trade, and logistics [140]:
- Energy crisis and EU independence;
- European Green Deal;
- European Climate Law;
- Strategy for Smart and Sustainable Mobility;
- Climate change;
- War in Ukraine.
There are eight lines of action and initiatives related to the above-mentioned global orders [140]:
- Digital transformation (en13044 revision; EDIGES; TAF TSI revision; eFTI Regulation; ILU-Code; ILU-Register (FENIX Project));
- Environment and decarbonization (CESAR; KV4.0; CT4U campaign);
- Dangerous goods and waste transport (Waste Shipment Regulation; Digital Automatic Coupling for intermodal wagons; COTIF/RID);
- CT Assets (AEROFLEX Project; Weights and Dimensions);
- EU road haulage rules (ERA Register for Infrastructure (RINF); Q-ELETA Project; Digital Train 2.0; Rail Freight Corridor Regulation; Eurovignette Directive);
- Rail freight: infrastructure and quality (TEN-T Regulation Track Access Charging; Regulation on waiving of track access charges; state aid guidelines);
- Transshipment terminals (crisis management (Danish safety incidents; LL block issues; rail traffic disturbances; Ukraine war effort); ERA Intermodal Task Force; CACTUS Project; EU railway standards);
- Intermodal transportation (RNE WG on Combined Transport; PLANET Project; Combined Transport Directive; Rail Facilities Portal).
The technological evolution of the rail transport system has been achieved, among others, by [140]:
- The Action Digital Train 1.0—makes it possible to identify the benefits of mining data on the composition of the train and the train’s course; enables the calculation of the estimated time of arrivals (ETAs) based on artificial intelligence;
- The Action Digital Train 2.0 (continuation of 1.0)—aims to integrate all stakeholders interested in the development of the Q-ELETA Quality Management System (QMS) for European combined transport operations; Q-ELETA will increase predictability and punctuality in the long term;
- Project COMBINE—the aim was to assess the potential of combined transport in the Baltic Sea region; the final task was to create a database of national regulations for combined transport;
- The aim of the H2020 project AEROFLEX was to develop and demonstrate new vehicle technologies and architectures with optimized aerodynamics, powertrains and safety systems, and flexible load units. As part of this project, load tests were carried out on four different rail systems and tests for deformation or other damage; one of the goals was to achieve energy savings of 4–5% by using separate platforms [144];
- FENIX (European Federated Network of Information eXchange in LogistiX)—the goal is to develop, implement and validate digital information systems along the EU transport Core Network. The aim was, inter alia, to facilitate cross-border rail freight transport through eCMR (paperless transport in intermodal transport with the possibility of exchanging road–rail documents; e-Gate (technology that improves the data exchange gate in the terminal/hub, also at the level of the ILU code register); e-FTI (Business-to-Administration (B2A) digital communication tool) [145,146].
Positive effects are also evidenced by the expansion of UIRR membership, e.g., accession of PCC Intermodal from Poland, Delta Rail from France, or Railhub Transylvania from Romania, which means that they respect the goals related to reducing the energy intensity of the transport sector and the concept of zero-emission transport.
5. Conclusions
The presented research allows for the assessment of the convergence process in the EU about the energy intensity of the export of goods by rail transport due to geographical proximity and the economic situation of Poland’s trading partners (importers). An anisotropic spatial correlation was identified, which is a function of not only distance but also the direction in space. This means that the convergence process has a spatial (club) and dynamic character, the so-called polyconvergence. The occurrence of type β and club convergence was verified, with its pace assessed at the level of 8.66% per year. The half-life of the disappearance of differences between the examined destinations in terms of the energy intensity of the export of goods by rail is 8 years (from the starting point to the long-term equilibrium). However, without taking into account the spatial and economic distance, in relation to dynamic processes only, convergence would last for a shorter time. Its rate would be 10.77% (half-life time is equal to 6 years and 5 months). In addition, a proportional elasticity of the examined energy intensity under the influence of changes in GDP was noticed. Economic growth results in an identical percentage increase in the energy intensity of export by rail transport from Poland to the examined destinations. This is a signal that the parameters and quality of infrastructure must be improved by investing in infrastructure. In addition, a stronger sensitivity to the energy intensity of the exportation of goods by rail was noticed under the influence of changes in the average distance than under the influence of changes in the volume. This confirms that servicing bulk loads, heavy or relatively large, over long distances by rail transport decreases the energy intensity of rail transport. This approach will relieve the entire transport system in terms of energy efficiency by shifting the servicing of this type of cargo from road transport to rail transport. At the same time, the study is important from the point of view of transportation policy, as it indicates that the common EU policy in the field of shaping transport brings positive results (integration and convergence takes place), but at the same time confirms the legitimacy of the shift of paradigm in sustainable transportation policy.
The research results entitled formulation of several key recommendations for practice, which, when implemented in economic reality, will contribute to obtaining added value and economies of scale:
- 1.
- Increasing the share of rail transport in transport chains [147,148,149] (intermodal transport; consultations in Poland are currently underway on the program “Directions of development of intermodal transport until 2030 with a perspective until 2040” [150]—its purpose is to identify the directions of development of transport and financing needs from the perspective of 2021–2027).
- 2.
- Providing synchromodality to these chains (Synchromodality as a Service (SaaS)) [151,152,153].
- 3.
- Increasing the speed of freight trains by adapting the lines to higher speeds; lines dedicated to freight transport [154] (example of Betuwe in The Netherlands [155]).
- 4.
- Increase in productivity and decrease energy intensity (longer and heavier trains) [156].
- 5.
- Improving access to seaports and border crossings (in the East) as generators of the main traffic of international transport [64,157].
- 6.
- Accelerating the deployment of new interoperability technologies (ERTMS, track and trace, etc.) [13,158].
- 7.
- Automation of transshipments in terminals (among others, Internet of Things (IoT) systems) [159,160,161].
- 8.
- Customer orientation, attracting new customers from newly developing industries [162,163].
- 9.
- Innovative solutions (EU program Shift to Rail (S2R) under Horizon 2020) [164,165].
- 10.
- Information sharing and joint bug fixing—affect development, reliability, and punctuality (especially in sense of open access to the Single European Rail Area (SERA)) [166].
The aim of the article has been achieved, and the research hypothesis has been verified. The research results prove that this is an area of research worth deepening due to the groups of cargo being extended to other destinations and the division into various modes of transport.
The limitations of this study result from its assumptions and the data used (during the analyzed period last year, the United Kingdom withdrew from the EU, the so-called Brexit). Data in 2020 may be affected by the global COVID-19 pandemic. The energy intensity of the export of goods by rail transport from Poland may also be affected by the following: structural, supply, and price shocks, as well as other changes of a social, political, and economic nature, which were not quantified and included in the study (it was not possible to include them due to the insufficient number of degrees of freedom and other properties of statistical features). Therefore, in future research directions, it is worth paying attention to decomposition analysis and the exploration of shocks with the above background, extending the time range of the study. It is also worth considering the analysis of business cycles and the leakage of shocks. Future research directions may also include a division into groups of cargo and directions of export dedicated to them. Undoubtedly, a valuable contribution to future research is the development of a model for intermodal transport at a lower level of data granulation, taking into account the directions of transport and locations of intermodal terminals. Sigma convergence (with a strong emphasis on in-depth taxonomic analysis) also is still worth exploring.
The conducted research is innovative, as so far in the analyzed literature there are no studies that take into account the energy intensity of transport in this approach, through export–import relations and in relation to rail transport. Usually, the role of transport in the flow of goods and services for export–import relations and dependence on energy carriers is described, but no attempt is made to assess this convergence. These studies are interdisciplinary and cover many research areas, including management, economics, socio-economic geography, statistics, econometrics, and computer science. The research results can be useful for transportation policymakers, infrastructure operators, decision-makers in economic management, or scientists.
Author Contributions
Conceptualization, E.S., E.Z., A.D. and P.D.-D.; methodology, E.S. and E.Z.; validation, E.S., E.Z. and A.D.; formal analysis, E.S.; investigation, E.S., E.Z., A.D. and P.D.-D.; resources, E.S., E.Z., A.D. and P.D.-D.; writing—original draft preparation, E.S., E.Z., A.D. and P.D.-D.; writing—review and editing, E.S., E.Z., A.D. and P.D.-D.; visualization, E.S. and E.Z.; supervision, E.S., E.Z., A.D. and P.D.-D.; project administration, E.S. and E.Z.; funding acquisition, E.S., E.Z., A.D. and P.D.-D. All authors have read and agreed to the published version of the manuscript.
Funding
The project is financed within the framework of the program of the Minister of Science and Higher Education under the name ”Regional Excellence Initiative” in the years 2019–2022; project number 001/RID/2018/19; the amount of financing PLN 10,684,000.00.
Institutional Review Board Statement
Not applicable.
Informed Consent Statement
Not applicable.
Data Availability Statement
Conflicts of Interest
The authors declare no conflict of interest.
References
- Aydin, G.; Dzhaleva-Chonkova, A. Discussions on Rail in Urban Areas and Rail History. Res. Transp. Econ. 2013, 41, 84–88. [Google Scholar] [CrossRef]
- Cui, S.; Pittman, R.; Zhao, J. Restructuring the Chinese Freight Railway: Two Scenarios. Asia Glob. Econ. 2021, 1, 100002. [Google Scholar] [CrossRef]
- Pittman, R. Make or Buy on the Russian Railway? Coase, Williamson, and Tsar Nicholas II. Econ. Change 2007, 40, 207–221. [Google Scholar] [CrossRef]
- MacDonald, J.M. Competition and Rail Rates for the Shipment of Corn, Soybeans, and Wheat. RAND J. Econ. 1987, 18, 151–163. [Google Scholar] [CrossRef]
- Ciccarelli, C.; Giuntini, A.; Groote, P. The History of Rail Transport. In International Encyclopedia of Transportation; Elsevier: London, UK, 2021. [Google Scholar]
- Guo, Y.; Dong, B. Railway and Trade in Modern China: Evidence from the 1930s. China Econ. Rev. 2021, 69, 101661. [Google Scholar] [CrossRef]
- Obeng, D.A.; Bessah, E.; Amponsah, W.; Dzisi, E.K.; Agyare, W.A. Ghana’s Railway Transport Services Delivery: A Review. Transp. Eng. 2022, 8, 100111. [Google Scholar] [CrossRef]
- Yan, B.; Tian, X.; Deng, S.; Wu, J. Impact of China Railway Express on Urban Exports: Evidence from Prefectural-Level City Economic Data. Procedia Comput. Sci. 2022, 214, 1222–1227. [Google Scholar] [CrossRef]
- Esposito, G.; Cicatiello, L.; Ercolano, S. Reforming Railways in the EU: An Empirical Assessment of Liberalisation Policies in the European Rail Freight Market. Transp. Res. Part A Policy Pract. 2020, 132, 606–613. [Google Scholar] [CrossRef]
- Załoga, E. Polityczna wizja rozwoju rynku usług transportowych Unii Europejskiej. Zesz. Nauk. Uniw. Szczecińskiego. Ekon. Probl. Usług 2010, 60, 498–506. [Google Scholar]
- International Relations. Available online: https://transport.ec.europa.eu/transport-modes/rail/international-relations_en (accessed on 12 February 2023).
- Charanwanitwong, T.; Fraszczyk, A. Rail Liberalisation in Europe and Lessons for Thailand: Policy Makers vs. Academic Views. Transp. Res. Part A Policy Pract. 2018, 113, 421–440. [Google Scholar] [CrossRef]
- Engelhardt, J. Transport Kolejowy. In Transport. Tendencje Zmian; Wojewódzka-Król, K., Załoga, E., Eds.; PWN: Warszawa, Poland, 2022; pp. 104–193. [Google Scholar]
- Engelhardt, J. Sektor Kolejowy w Polityce Transportowej Polski; Wydawnictwo Naukowe Uniwersytetu Szczecińskiego: Szczecin, Poland, 2022; ISBN 978-83-7972-536-6. [Google Scholar]
- Załoga, E. Trendy w Transporcie Lądowym Unii Europejskiej; Wydawnictwo Naukowe Uniwersytetu Szczecińskiego: Szczecin, Poland, 2013; ISBN 978-83-7241-933-0. [Google Scholar]
- Ćwil, M.; Bartnik, W.; Jarzębowski, S. Railway Vehicle Energy Efficiency as a Key Factor in Creating Sustainable Transportation Systems. Energies 2021, 14, 5211. [Google Scholar] [CrossRef]
- Dalla Chiara, B.; De Franco, D.; Coviello, N.; Pastrone, D. Comparative Specific Energy Consumption between Air Transport and High-Speed Rail Transport: A Practical Assessment. Transp. Res. Part D Transp. Environ. 2017, 52, 227–243. [Google Scholar] [CrossRef]
- Li, L.; Zhang, X. Reducing CO2 Emissions through Pricing, Planning, and Subsidizing Rail Freight. Transp. Res. Part D Transp. Environ. 2020, 87, 102483. [Google Scholar] [CrossRef]
- Arnaudov, B. Analyzing the Factors Which Influence the Effectiveness of Railway Passenger Transport. Yearb. UNWE 2021, 59, 137–148. [Google Scholar] [CrossRef]
- Timeline of Railway History. Wikipedia 2022. Available online: https://en.wikipedia.org/wiki/Timeline_of_railway_history (accessed on 11 February 2023).
- Wielkopolski, A. Zarys Gospodarczych Dziejów Transportu; Wydawnictwa Komunikacji i Łączności WKŁ: Warszawa, Poland, 1975. [Google Scholar]
- Malik, D.M. History of the World; New Saraswati House India Pvt Ltd: New Delphi, India, 2016; ISBN 978-93-5041-938-0. [Google Scholar]
- O’Brien, P. The New Economic History of the Railways, 1st ed.; Routledge: London, UK, 2016; ISBN 978-1-138-82622-9. [Google Scholar]
- Hosseini, S.E. Hydrogen and Fuel Cells in Transport Road, Rail, Air, and Sea. In Comprehensive Renewable Energy; Letcher, T.M., Ed.; Elsevier: Amsterdam, The Netherlands, 2022; pp. 317–342. [Google Scholar] [CrossRef]
- Lapidus, B.M. Improvements in Energy Efficiency and the Potential Use of Hydrogen Fuel Cells in Railway Transport. Vestn. Railw. Res. Inst. 2019, 78, 274–283. [Google Scholar] [CrossRef]
- Piwowarski, M.; Miłaszewicz, D.; Łatuszyńska, M.; Borawski, M.; Nermend, K. TOPSIS and VIKOR Methods in Study of Sustainable Development in the EU Countries. Procedia Comput. Sci. 2018, 126, 1683–1692. [Google Scholar] [CrossRef]
- Tarczynska-Luniewska, M.; Flaga-Gieruszynska, K.; Ankiewicz, M. Exploring the Nexus Between Fundamental Strength and Market Value in Energy Companies: Evidence From Environmental, Social, and Corporate Governance Perspective in Poland. Front. Energy Res. 2022, 10, 910921. [Google Scholar] [CrossRef]
- Przybyłowski, A.; Kałaska, A.; Przybyłowski, P. Quest for a Tool Measuring Urban Quality of Life: ISO 37120 Standard Sustainable Development Indicators. Energies 2022, 15, 2841. [Google Scholar] [CrossRef]
- Budziewicz-Guźlecka, A.; Drożdż, W. Development and Implementation of the Smart Village Concept as a Challenge for the Modern Power Industry on the Example of Poland. Energies 2022, 15, 603. [Google Scholar] [CrossRef]
- Dedík, M.; Čechovič, T.; Gašparík, J.; Majerčák, J. Rationalization of the Passenger Transport System as an Important Transport System. Transp. Res. Procedia 2019, 40, 193–200. [Google Scholar] [CrossRef]
- Bhatia, V.; Sharma, S. Expense Based Performance Analysis and Resource Rationalization: Case of Indian Railways. Socio-Econ. Plan. Sci. 2021, 76, 100975. [Google Scholar] [CrossRef]
- Ragimov, E.A. Comparative Analysis of Energy Intensity and Greenhouse Gas Production by Road and Rail Transport. Mod. Technol. Syst. Anal. Model. 2021, 3, 142–148. [Google Scholar] [CrossRef]
- Gołębiowski, P.; Jacyna, M.; Stańczak, A. The Assessment of Energy Efficiency versus Planning of Rail Freight Traffic. A Case Study on the Example of Poland. Energies 2021, 14, 5629. [Google Scholar] [CrossRef]
- Mączyńska, E. Crises as Impulses for Changes in Socio-Economic Systems. MAZOWSZE Stud. Reg. 2022, 9–30. [Google Scholar] [CrossRef]
- Croce, A.I.; Musolino, G.; Rindone, C.; Vitetta, A. Sustainable Mobility and Energy Resources: A Quantitative Assessment of Transport Services with Electrical Vehicles. Renew. Sustain. Energy Rev. 2019, 113, 109236. [Google Scholar] [CrossRef]
- Szaruga, E.; Załoga, E. Environmental Management from the Point of View of the Energy Intensity of Road Freight Transport and Shocks. Int. J. Environ. Res. Public Health 2022, 19, 14417. [Google Scholar] [CrossRef] [PubMed]
- Mączyńska, E.; Pysz, P. Po co nam społeczna gospodarka rynkowa? Ekonomista 2020, 2, 210–235. [Google Scholar] [CrossRef]
- Singh, S.; Singh, U.S.; Nermend, M. Sustainability in a Digitized Era Analyzing the Moderation Effect of Social Strata and Digital Capital Dependence on Digital Divide. Sustainability 2022, 14, 14508. [Google Scholar] [CrossRef]
- Kluza, K.; Zioło, M.; Bąk, I.; Spoz, A. Achieving Environmental Policy Objectives through the Implementation of Sustainable Development Goals. The Case for European Union Countries. Energies 2021, 14, 2129. [Google Scholar] [CrossRef]
- Zioło, M.; Niedzielski, P.; Kuzionko-Ochrymiuk, E.; Marcinkiewicz, J.; Łobacz, K.; Dyl, K.; Szanter, R. E-Government Development in European Countries: Socio-Economic and Environmental Aspects. Energies 2022, 15, 8870. [Google Scholar] [CrossRef]
- Otsuka, A. Assessment of the Improvement in Energy Intensity by the New High-Speed Railway in Japan. Asia-Pac. J. Reg. Sci. 2022, 6, 267–282. [Google Scholar] [CrossRef]
- Antoš, J. Energy Saving in Rail Transport. Acta Polytech. CTU Proc. 2021, 31, 1–4. [Google Scholar] [CrossRef]
- Szaruga, E.; Załoga, E. Sustainable Development Programming of Airports by Identification of Non-Efficient Units. Energies 2022, 15, 932. [Google Scholar] [CrossRef]
- Feng, X.; Zhang, H.; Ding, Y.; Liu, Z.; Peng, H.; Xu, B. A Review Study on Traction Energy Saving of Rail Transport. Discret. Dyn. Nat. Soc. 2013, 2013, e156548. [Google Scholar] [CrossRef]
- Keller, D. Polish State Railways in 1945–1989—A Research Contribution. Stud. Hist. Oeconomicae 2021, 39, 216–249. [Google Scholar] [CrossRef]
- Nordenholz, F.; Winkler, C.; Knörr, W. Analysing the Modal Shift to Rail Potential within the Long-Distance Passenger Travel Market in Germany. Transp. Res. Procedia 2017, 26, 81–91. [Google Scholar] [CrossRef]
- Załoga, E. Paradygmaty rozwoju transportu Unii Europejskiej. In Współczesna Polityka Transportowa; Rydzkowski, W., Ed.; Polskie Wydawnictwo Ekonomiczne: Warszawa, Poland, 2017; pp. 67–92. [Google Scholar]
- Drewnowski, A. The Importance of the Functioning of Private Railway Sidings for the Increase of Freight Railway Transport in Poland. In Challenges and Modern Solution in Transportation; Stajniak, M., Szuster, M., Kopeć, M., Toboła, A., Eds.; Instytut Naukowo-Wydawniczy „Spatium”: Radom, Poland, 2019; pp. 165–175. [Google Scholar]
- Bello, M.O.; Ch’ng, K.S. Convergence in Energy Intensity of GDP: Evidence from West African Countries. Energy 2022, 254, 124217. [Google Scholar] [CrossRef]
- Hajko, V. The Energy Intensity Convergence in the Transport Sector. Procedia Econ. Financ. 2014, 12, 199–205. [Google Scholar] [CrossRef]
- Huang, Z.; Zhang, H.; Duan, H. Nonlinear Globalization Threshold Effect of Energy Intensity Convergence in Belt and Road Countries. J. Clean. Prod. 2019, 237, 117750. [Google Scholar] [CrossRef]
- Mussini, M. Inequality and Convergence in Energy Intensity in the European Union. Appl. Energy 2020, 261, 114371. [Google Scholar] [CrossRef]
- Qi, S.-Z.; Peng, H.-R.; Zhang, Y.-J. Energy Intensity Convergence in Belt and Road Initiative (BRI) Countries: What Role Does China-BRI Trade Play? J. Clean. Prod. 2019, 239, 118022. [Google Scholar] [CrossRef]
- Lis, C. Zastosowanie Metod Taksonomicznych w Badaniu Konwergencji Gospodarczej. In Problemy Gospodarki Międzynarodowej, Krajowej i Regionalnej; Korol, J., Ed.; Wydawnictwo Adam Marszałek: Toruń, Poland, 2013; ISBN 978-83-8019-158-7. [Google Scholar]
- Batóg, J. Konwergencja Dochodowa w Krajach Unii Europejskiej. Analiza Ekonometryczna; Wydawnictwo Naukowe Uniwersytetu Szczecińskiego: Szczecin, Poland, 2010. [Google Scholar]
- Lis, C. Wartość Dodana Brutto i Jej Znaczenie w Procesie Akumulacji Kapitału w Świetle Teorii Wzrostu i Konwergencji: Podejście Taksonomiczne; Volumina.pl Daniel Krzanowski: Szczecin, Poland, 2013; ISBN 978-83-7867-033-9. [Google Scholar]
- Borca, B.; Putz, L.-M.; Hofbauer, F. Crises and Their Effects on Freight Transport Modes: A Literature Review and Research Framework. Sustainability 2021, 13, 5740. [Google Scholar] [CrossRef]
- Ji, C.; Yao, Y.; Duan, J.; Li, W. Sustainable Mechanism of the Entrusted Transportation Management Mode on High-Speed Rail and the Impact of COVID-19: A Case Study of the Beijing–Shanghai High-Speed Rail. Sustainability 2022, 14, 1171. [Google Scholar] [CrossRef]
- Yang, S.; Chen, Z. The Impact of COVID-19 on High-Speed Rail and Aviation Operations. Sustainability 2022, 14, 1683. [Google Scholar] [CrossRef]
- Barczak, A.; Dembińska, I.; Rozmus, D.; Szopik-Depczyńska, K. The Impact of COVID-19 Pandemic on Air Transport Passenger Markets-Implications for Selected EU Airports Based on Time Series Models Analysis. Sustainability 2022, 14, 4345. [Google Scholar] [CrossRef]
- Ding, R.; Fu, J.; Du, Y.; Du, L.; Zhou, T.; Zhang, Y.; Shen, S.; Zhu, Y.; Chen, S. Structural Evolution and Community Detection of China Rail Transit Route Network. Sustainability 2022, 14, 12342. [Google Scholar] [CrossRef]
- Shen, P.; Yin, P.; Niu, B. Assessing the Combined Effects of Transportation Infrastructure on Regional Tourism Development in China Using a Spatial Econometric Model (GWPR). Land 2023, 12, 216. [Google Scholar] [CrossRef]
- Schofer, J.L.; Mahmassani, H.S.; Ng, M.T.M. Resilience of U.S. Rail Intermodal Freight during the COVID-19 Pandemic. Res. Transp. Bus. Manag. 2022, 43, 100791. [Google Scholar] [CrossRef]
- Mańkowska, M.; Pluciński, M.; Kotowska, I.; Filina-Dawidowicz, L. Seaports during the COVID-19 Pandemic: The Terminal Operators’ Tactical Responses to Disruptions in Maritime Supply Chains. Energies 2021, 14, 4339. [Google Scholar] [CrossRef]
- Stanojević, N. The “Dual Circulation” Strategy: China’s Response to Declining International Economic Connectivity. In The Connectivity Cooperation Between China and Europe; Routledge: Abingdon-on-Thames, UK, 2022; ISBN 978-1-00-328327-0. [Google Scholar]
- Lin, J.Y. Dual Circulation and China’s Development. Front. Econ. China 2021, 16, 30–34. [Google Scholar]
- China Wants to Mend Fences—and Europe Must Fend off Menaces|Merics. Available online: https://merics.org/en/short-analysis/china-wants-mend-fences-and-europe-must-fend-menaces (accessed on 12 February 2023).
- Eurostat Freight Transport Statistics—Modal Split. Available online: https://ec.europa.eu/eurostat/statistics-explained/index.php?title=Freight_transport_statistics_-_modal_split (accessed on 11 February 2023).
- Rosell, F.; Codina, E.; Montero, L. A Combined and Robust Modal-Split/Traffic Assignment Model for Rail and Road Freight Transport. Eur. J. Oper. Res. 2022, 303, 688–698. [Google Scholar] [CrossRef]
- de Miranda Pinto, J.T.; Mistage, O.; Bilotta, P.; Helmers, E. Road-Rail Intermodal Freight Transport as a Strategy for Climate Change Mitigation. Environ. Dev. 2018, 25, 100–110. [Google Scholar] [CrossRef]
- European Commission. White Paper. Roadmap to a Single European Transport Area—Towards a Competitive and Resource Efficient Transport System; 144 Final 2011; European Commission: Brussels, Belgium, 2011. [Google Scholar]
- Communication from the Commission. The European Green Deal; 640 Final 2019; European Commission: Brussels, Belgium, 2019. [Google Scholar]
- Isler, C.A.; Blumenfeld, M.; Roberts, C. Assessment of Railway Infrastructure Improvements: Valuation of Costs, Energy Consumption and Emissions. Sustain. Energy Technol. Assess. 2022, 52, 102179. [Google Scholar] [CrossRef]
- Skrúcaný, T.; Kendra, M.; Kalina, T.; Jurkovič, M.; Vojtek, M.; Synák, F. Environmental Comparison of Different Transport Mode. Nase More 2018, 65, 192–196. [Google Scholar] [CrossRef]
- Gucwa, M.; Schäfer, A. The Impact of Scale on Energy Intensity in Freight Transportation. Transp. Res. Part D Transp. Environ. 2013, 23, 41–49. [Google Scholar] [CrossRef]
- Aminzadegan, S.; Shahriari, M.; Mehranfar, F.; Abramović, B. Factors Affecting the Emission of Pollutants in Different Types of Transportation: A Literature Review. Energy Rep. 2022, 8, 2508–2529. [Google Scholar] [CrossRef]
- Tao, X.; Wu, Q. Energy Consumption and CO2 Emissions in Hinterland Container Transport. J. Clean. Prod. 2021, 279, 123394. [Google Scholar] [CrossRef]
- Vanek, F. Mode and Commodity Perspectives on U.S. Freight Energy Consumption and CO2 Emissions: Insights and Directions for Improvement. Int. J. Sustain. Transp. 2019, 13, 741–760. [Google Scholar] [CrossRef]
- Energy Efficiency—European Environment Agency. Available online: https://www.eea.europa.eu/publications/ENVISSUENo12/page027.html (accessed on 23 February 2023).
- Sirina, N.F.; Yushkova, S.S. Integrative Management of Infrastructure and Traction Equipment at the Railway Area. Vestn. Railw. Res. Inst. 2020, 78, 328–339. [Google Scholar] [CrossRef]
- Nezevak, V.L. Increasing the Efficiency of Recuperation Through the Use of Energy Storage Systems for the Own Needs of Traction Substations. World Transp. Transp. 2021, 19, 224–237. [Google Scholar] [CrossRef]
- D’Ovidio, G.; Ometto, A.; Valentini, O. A Novel Predictive Power Flow Control Strategy for Hydrogen City Rail Train. Int. J. Hydrog. Energy 2020, 45, 4922–4931. [Google Scholar] [CrossRef]
- Cheng, P.; Liu, W.; Ma, J.; Zhang, L.; Jia, L. Solar-Powered Rail Transportation in China: Potential, Scenario, and Case. Energy 2022, 245, 123221. [Google Scholar] [CrossRef]
- Tang, Z.; Yin, H.; Yang, C.; Yu, J.; Guo, H. Predicting the Electricity Consumption of Urban Rail Transit Based on Binary Nonlinear Fitting Regression and Support Vector Regression. Sustain. Cities Soc. 2021, 66, 102690. [Google Scholar] [CrossRef]
- Chenchen, Z.; Dongyin, L.; Xuemei, X.; Yanhui, W. Modeling and Analysis of Global Energy Consumption Process of Urban Rail Transit System Based on Petri Net. J. Rail Transp. Plan. Manag. 2022, 21, 100293. [Google Scholar] [CrossRef]
- Pietrzak, K.; Pietrzak, O.; Montwił, A. Effects of Incorporating Rail Transport into a Zero-Emission Urban Deliveries System: Application of Light Freight Railway (LFR) Electric Trains. Energies 2021, 14, 6809. [Google Scholar] [CrossRef]
- García-Olivares, A.; Solé, J.; Samsó, R.; Ballabrera-Poy, J. Sustainable European Transport System in a 100% Renewable Economy. Sustainability 2020, 12, 5091. [Google Scholar] [CrossRef]
- Brenna, M.; Bucci, V.; Falvo, M.C.; Foiadelli, F.; Ruvio, A.; Sulligoi, G.; Vicenzutti, A. A Review on Energy Efficiency in Three Transportation Sectors: Railways, Electrical Vehicles and Marine. Energies 2020, 13, 2378. [Google Scholar] [CrossRef]
- Herwartz, S.; Pagenkopf, J.; Streuling, C. Sector Coupling Potential of Wind-Based Hydrogen Production and Fuel Cell Train Operation in Regional Rail Transport in Berlin and Brandenburg. Int. J. Hydrogen Energy 2021, 46, 29597–29615. [Google Scholar] [CrossRef]
- Marin, G.D.; Naterer, G.F.; Gabriel, K. Rail Transportation by Hydrogen vs. Electrification–Case Study for Ontario Canada, I: Propulsion and Storage. Int. J. Hydrogen Energy 2010, 35, 6084–6096. [Google Scholar] [CrossRef]
- Piraino, F.; Genovese, M.; Fragiacomo, P. Towards a New Mobility Concept for Regional Trains and Hydrogen Infrastructure. Energy Convers. Manag. 2021, 228, 113650. [Google Scholar] [CrossRef]
- Ogawa, K.; Yoneyama, T.; Sudo, T.; Kashiwagi, T.; Yamamoto, T. Performance Improvement of Fuel Cell Hybrid Powered Test Railway Vehicle. Q. Rep. RTRI (Railw. Tech. Res. Inst. ) 2021, 62, 16–21. [Google Scholar] [CrossRef] [PubMed]
- Pomykała, A.; Engelhardt, J. Concepts of Construction of High-Speed Rail in Poland in Context to the European High-Speed Rail Networks. Socio-Econ. Plan. Sci. 2023, 85, 101421. [Google Scholar] [CrossRef]
- Lu, S.-M. A Low-Carbon Transport Infrastructure in Taiwan Based on the Implementation of Energy-Saving Measures. Renew. Sustain. Energy Rev. 2016, 58, 499–509. [Google Scholar] [CrossRef]
- Mlinaric, T.J.; Ponikvar, K. Energy Efficiency of Railway Lines. PROMET-Traffic Transp. 2011, 23, 187–193. [Google Scholar] [CrossRef]
- Janić, M. Estimation of Direct Energy Consumption and CO2 Emission by High Speed Rail, Transrapid Maglev and Hyperloop Passenger Transport Systems. Int. J. Sustain. Transp. 2021, 15, 696–717. [Google Scholar] [CrossRef]
- Blanco-Castillo, M.; Fernández-Rodríguez, A.; Fernández-Cardador, A.; Cucala, A.P. Eco-Driving in Railway Lines Considering the Uncertainty Associated with Climatological Conditions. Sustainability 2022, 14, 8645. [Google Scholar] [CrossRef]
- He, P.; Zhang, J.; Chen, L. Time Is Money: Impact of China-Europe Railway Express on the Export of Laptop Products from Chongqing to Europe. Transp. Policy 2022, 125, 312–322. [Google Scholar] [CrossRef]
- Pomfret, R. The Eurasian Landbridge: Implications of Linking East Asia and Europe by Rail. Res. Glob. 2021, 3, 100046. [Google Scholar] [CrossRef]
- Pomfret, R. The Eurasian Landbridge and China’s Belt and Road Initiative: Demand, Supply of Services and Public Policy. World Econ. 2019, 42, 1642–1653. [Google Scholar] [CrossRef]
- Lu, J.; Li, H. Can High-Speed Rail Improve Enterprise Capacity Utilization? A Perspective of Supply Side and Demand Side. Transp. Policy 2022, 115, 152–163. [Google Scholar] [CrossRef]
- Rao, P.S. Forecasting the Demand for Railway Freight Services. J. Transp. Econ. Policy 1978, 12, 7–26. [Google Scholar]
- Khan, M.Z.; Khan, F.N. Estimating the Demand for Rail Freight Transport in Pakistan: A Time Series Analysis. J. Rail Transp. Plan. Manag. 2020, 14, 100176. [Google Scholar] [CrossRef]
- Betarelli, A.A.; Domingues, E.P.; Hewings, G.J.D. Transport Policy, Rail Freight Sector and Market Structure: The Economic Effects in Brazil. Transp. Res. Part A Policy Pract. 2020, 135, 1–23. [Google Scholar] [CrossRef]
- Marchetti, D.; Wanke, P. Efficiency of the Rail Sections in Brazilian Railway System, Using TOPSIS and a Genetic Algorithm to Analyse Optimized Scenarios. Transp. Res. Part E Logist. Transp. Rev. 2020, 135, 101858. [Google Scholar] [CrossRef]
- Miljkovic, D.; Price, G.K.; Hauser, R.J.; Algozin, K.A. The Barge and Rail Freight Market for Export-Bound Grain Movement from Midwest to Mexican Gulf: An Econometric Analysis. Transp. Res. Part E Logist. Transp. Rev. 2000, 36, 127–137. [Google Scholar] [CrossRef]
- Kramarz, M.; Przybylska, E.; Wolny, M. Reliability of the Intermodal Transport Network under Disrupted Conditions in the Rail Freight Transport. Res. Transp. Bus. Manag. 2022, 44, 100686. [Google Scholar] [CrossRef]
- Pittman, R.; Jandová, M.; Król, M.; Nekrasenko, L.; Paleta, T. The Effectiveness of EC Policies to Move Freight from Road to Rail: Evidence from CEE Grain Markets. Res. Transp. Bus. Manag. 2020, 37, 100482. [Google Scholar] [CrossRef]
- Central Statistical Office. Transport—Activity Results in 2010; CSO, Trade and Services Division: Warsaw, Poland, 2011. [Google Scholar]
- Central Statistical Office. Transport—Activity Results in 2011; CSO, Trade and Services Division: Warsaw, Poland, 2012. [Google Scholar]
- Central Statistical Office. Transport—Activity Results in 2012; CSO, Trade and Services Division: Warsaw, Poland, 2013. [Google Scholar]
- Central Statistical Office. Transport—Activity Results in 2013; CSO, Trade and Services Division: Warsaw, Poland, 2014. [Google Scholar]
- Central Statistical Office. Transport—Activity Results in 2014; CSO, Trade and Services Division: Warsaw, Poland, 2015. [Google Scholar]
- Central Statistical Office. Transport—Activity Results in 2015; CSO, Trade and Services Division: Warsaw, Poland, 2016. [Google Scholar]
- Central Statistical Office. Transport—Activity Results in 2016; CSO, Trade and Services Division: Warsaw, Poland, 2017. [Google Scholar]
- Central Statistical Office. Transport—Activity Results in 2017; CSO, Trade and Services Division: Warsaw, Poland, 2018. [Google Scholar]
- Central Statistical Office. Transport—Activity Results in 2018; Statistics Poland, Statistical Office in Szczecin: Szczecin, Poland, 2019. [Google Scholar]
- Central Statistical Office. Transport—Activity Results in 2019; Statistics Poland, Statistical Office in Szczecin: Szczecin, Poland, 2020. [Google Scholar]
- Central Statistical Office. Transport—Activity Results in 2020; Statistics Poland, Statistical Office in Szczecin: Szczecin, Poland, 2021. [Google Scholar]
- Central Statistical Office. Transport—Activity Results in 2021; Statistics Poland, Statistical Office in Szczecin: Szczecin, Poland, 2022. [Google Scholar]
- GDP, PPP (Current International $) | Data. Available online: https://data.worldbank.org/indicator/NY.GDP.MKTP.PP.CD?end=2020&start=2010 (accessed on 20 February 2023).
- Knowledge Databases. Available online: http://swaid.stat.gov.pl/EN/SitePages/StronaGlownaDBW.aspx (accessed on 20 February 2023).
- Urolagin, S.; Sharma, N.; Datta, T.K. A Combined Architecture of Multivariate LSTM with Mahalanobis and Z-Score Transformations for Oil Price Forecasting. Energy 2021, 231, 120963. [Google Scholar] [CrossRef]
- Liu, D.; Qi, X.; Fu, Q.; Li, M.; Zhu, W.; Zhang, L.; Abrar Faiz, M.; Khan, M.I.; Li, T.; Cui, S. A Resilience Evaluation Method for a Combined Regional Agricultural Water and Soil Resource System Based on Weighted Mahalanobis Distance and a Gray-TOPSIS Model. J. Clean. Prod. 2019, 229, 667–679. [Google Scholar] [CrossRef]
- Dańska-Borsiak, B. Dynamiczne Modele Panelowe w Badaniach Ekonomicznych; Wydawnictwo Uniwersytetu Łódzkiego: Łódź, Poland, 2011. [Google Scholar]
- Fan, Y.; Shi, X. Wald, QLR, and Score Tests When Parameters Are Subject to Linear Inequality Constraints. J. Econom. 2023. [Google Scholar] [CrossRef]
- Staszczyk, A. Stacjonarność Danych Panelowych a Konwergencja Cenowa Na Przykładzie Importu Do Krajów UE. Stud. Ekon. Zesz. Nauk. Uniw. Ekon. W Katowicach 2017, 324, 129–141. [Google Scholar]
- Levin, A.; Lin, C.-F.; James Chu, C.-S. Unit Root Tests in Panel Data: Asymptotic and Finite-Sample Properties. J. Econom. 2002, 108, 1–24. [Google Scholar] [CrossRef]
- Im, K.S.; Pesaran, M.H.; Shin, Y. Testing for Unit Roots in Heterogeneous Panels. J. Econom. 2003, 115, 53–74. [Google Scholar] [CrossRef]
- Karavias, Y.; Tzavalis, E. A Fixed-T Version of Breitung’s Panel Data Unit Root Test. Econ. Lett. 2014, 124, 83–87. [Google Scholar] [CrossRef]
- Breitung, J.; Brüggemann, R.; Lütkepohl, H. Structural Vector Autoregressive Modeling and Impulse Responses. In Applied Time Series Econometrics; Lütkepohl, H., Krätzig, M., Eds.; Themes in Modern Econometrics; Cambridge University Press: Cambridge, UK, 2004; pp. 159–196. ISBN 978-0-521-83919-8. [Google Scholar]
- Choi, I. Unit Root Tests for Panel Data. J. Int. Money Financ. 2001, 20, 249–272. [Google Scholar] [CrossRef]
- GeoNames. Available online: http://www.geonames.org/ (accessed on 1 February 2023).
- Microsoft—Create a Map Chart in Excel. Available online: https://support.microsoft.com/en-us/office/create-a-map-chart-in-excel-f2cfed55-d622-42cd-8ec9-ec8a358b593b (accessed on 1 February 2023).
- TomTom. Available online: https://www.tomtom.com/en_gb/ (accessed on 1 February 2023).
- Bing Maps Platform—A Mapping Platform from Microsoft. Available online: https://www.microsoft.com/en-us/maps (accessed on 1 February 2023).
- Scherbakov, A.; Lunyakov, M.; Smirnov, V.; Kaigorodova, V.; Verbova, N. Options for Placement and Transport of Bulk Goods by Rail. Transp. Res. Procedia 2022, 63, 1498–1504. [Google Scholar] [CrossRef]
- Kowalska, S.; Bonk, D. Evaluation of Model Shift in Freight Transport: Case Study of Poland. Eur. Res. Stud. J. 2021, 24, 851–862. [Google Scholar] [CrossRef] [PubMed]
- Arikan, Y.; Şen, T.; Çam, E. A Study of Energy Efficiency in Rail Vehicles. El-Cezeri J. Sci. Eng. 2020, 7, 223–235. [Google Scholar] [CrossRef]
- 2021-22 UIRR Report: European Road-Rail Combined Transport; International Union for Road-Rail Combined Transport (UIRR): Brussels, Belgium, 2022.
- Wojewódzka-Król, K. Rozwój Technologii Intermodalnych. In Transport. Nowe Wyzwania; Wojewódzka-Król, K., Załoga, E., Eds.; Wydawnictwo Naukowe PWN: Warszawa, Poland, 2016. [Google Scholar]
- Bernacki, D.; Lis, C. Elimination of Modal Collision: Railway Bridge over the Regalica River. Sci. J. Marit. Univ. Szczec. 2019, 131, 43–52. [Google Scholar] [CrossRef]
- NIK o Barierach Rozwoju Transportu Intermodalnego—Najwyższa Izba Kontroli. Available online: https://www.nik.gov.pl/aktualnosci/bariery-rozwoju-transportu-intermodalnego.html (accessed on 13 April 2023).
- Aeroflex. Available online: https://aeroflex-project.eu/ (accessed on 14 April 2023).
- Fenix Network—European Federated Network of Information EXchange in LogistiX. Available online: https://fenix-network.eu/ (accessed on 14 April 2023).
- UIRR—International Union for Road-Rail Combined Transport—FENIX—European Federated Network of Information EXchange in LogistiX. Available online: https://www.uirr.com/en/projects/ongoing/item/28-fenix-european-federated-network-of-information-exchange-in-logistix/34-ongoing.html (accessed on 14 April 2023).
- European Commission—Have Your Say: International Freight and Passenger Transport—Increasing the Share of Rail Traffic. Available online: https://ec.europa.eu/info/law/better-regulation/have-your-say/initiatives/13134-International-freight-and-passenger-transport-increasing-the-share-of-rail-traffic_en (accessed on 12 April 2023).
- McKinsey & Company European Rail Freight Transformation | McKinsey. Available online: https://www.mckinsey.com/industries/travel-logistics-and-infrastructure/our-insights/bold-moves-to-boost-european-rail-freight (accessed on 12 April 2023).
- Gholamizadeh, K.; Zarei, E.; Yazdi, M. Railway Transport and Its Role in the Supply Chains: Overview, Concerns, and Future Direction. In The Palgrave Handbook of Supply Chain Management; Sarkis, J., Ed.; Springer International Publishing: Cham, Switzerland, 2022; pp. 1–28. ISBN 978-3-030-89822-9. [Google Scholar]
- Rodziewicz, K.; Engel, P.; Plutecka, I.; Kowalska, J.; Boratyńska-Karpiej, E.; Wiśniewski, K.; Wydra, T.; Fitak, M.; Sztybor, T. Kierunki Rozwoju Transportu Intermodalnego Do 2030 r. z Perspektywą Do 2040 r.; Centrum Unijnych Projektów Transportowych: Warszawa, Poland, 2020. [Google Scholar]
- Cichosz, M. Synchromodality-as-a-Service—Innowacyjny model transportu towarów. Stud. Prace Kolegium Zarządzania Finans. 2018, 169, 57–73. [Google Scholar] [CrossRef]
- Rentschler, J.; Elbert, R.; Weber, F. Promoting Sustainability through Synchromodal Transportation: A Systematic Literature Review and Future Fields of Research. Sustainability 2022, 14, 13269. [Google Scholar] [CrossRef]
- Perboli, G.; Musso, S.; Rosano, M.; Tadei, R.; Godel, M. Synchro-Modality and Slow Steaming: New Business Perspectives in Freight Transportation. Sustainability 2017, 9, 1843. [Google Scholar] [CrossRef]
- Urbański, P. Review of Freight High Speed Railway (HSR). Rail Veh. /Pojazdy Szyn. 2022, 2022, 49–61. [Google Scholar] [CrossRef]
- Oudenaren, J.V. Crisis and Renewal: An Introduction to the European Union; Rowman & Littlefield: Lanham, MD, USA, 2021; ISBN 978-1-5381-3128-2. [Google Scholar]
- Schultz-Wildelay, M.; Lang, A.; Wörmann, C.; Koller, R.; Troger-Gruber, R.; Wright, P.; Guenther, E.; Joos, J.; Harzbecker, H.; Smiltinsh, A.; et al. Longer Trains: Facts & Experiences in Europe. Results of the CER Working Group on Longer and Heavier Trains; Community of European Railway and Infrastructure Companies (CER) AISBL: Brussels, Belgium, 2016. [Google Scholar]
- Bocheński, T.; Palmowski, T.; Studzieniecki, T. The Development of Major Seaports in the Context of National Maritime Policy. The Case Study of Poland. Sustainability 2021, 13, 12883. [Google Scholar] [CrossRef]
- ERTMS: Discover the World Deployment Map. Available online: https://www.ertms.net/ (accessed on 12 April 2023).
- Singh, P.; Elmi, Z.; Krishna Meriga, V.; Pasha, J.; Dulebenets, M.A. Internet of Things for Sustainable Railway Transportation: Past, Present, and Future. Clean. Logist. Supply Chain 2022, 4, 100065. [Google Scholar] [CrossRef]
- Muñuzuri, J.; Onieva, L.; Cortés, P.; Guadix, J. Using IoT Data and Applications to Improve Port-Based Intermodal Supply Chains. Comput. Ind. Eng. 2020, 139, 105668. [Google Scholar] [CrossRef]
- Pollehn, T.; Ruf, M.; König, R. Evaluating the Effects of Automation Components in Service Networks of Rail Freight. J. Rail Transp. Plan. Manag. 2021, 20, 100267. [Google Scholar] [CrossRef]
- Zeybek, H. Customer Segmentation Strategy for Rail Freight Market: The Case of Turkish State Railways. Res. Transp. Bus. Manag. 2018, 28, 45–53. [Google Scholar] [CrossRef]
- Potter, A.; Soroka, A.; Naim, M. Regional Resilience for Rail Freight Transport. J. Transp. Geogr. 2022, 104, 103448. [Google Scholar] [CrossRef]
- Europe’s Rail (A Body of the European Union): About S2R. Available online: https://rail-research.europa.eu:443/about-shift2rail/ (accessed on 12 April 2023).
- Europe’s Rail (A Body of the European Union): Lists All Shift2Rail Projects. Available online: https://projects.shift2rail.org/ (accessed on 12 April 2023).
- Europe’s Rail. Work Programme 2022-2024. Draft Amendment N° 2 Adopted by the EU-Rail Governing Board on 8 September 2022; ANNEX to GB decision n° 10/2022; Europe’s Rail: Brussels, Belgium, 2022. [Google Scholar]


Disclaimer/Publisher’s Note: The statements, opinions and data contained in all publications are solely those of the individual author(s) and contributor(s) and not of MDPI and/or the editor(s). MDPI and/or the editor(s) disclaim responsibility for any injury to people or property resulting from any ideas, methods, instructions or products referred to in the content. |
© 2023 by the authors. Licensee MDPI, Basel, Switzerland. This article is an open access article distributed under the terms and conditions of the Creative Commons Attribution (CC BY) license (https://creativecommons.org/licenses/by/4.0/).