Article

Preliminary Results of Heat Transfer and Pressure Drop Measurements on Al2O3/H2O Nanofluids through a Lattice Channel

Department of Industrial Engineering, University of Rome “Tor Vergata”, Via del Politecnico 1, 00133 Rome, Italy
*
Author to whom correspondence should be addressed.
Energies 2023, 16(9), 3835; https://doi.org/10.3390/en16093835
Submission received: 28 March 2023 / Revised: 17 April 2023 / Accepted: 24 April 2023 / Published: 29 April 2023
(This article belongs to the Special Issue Nanofluids Heat Transfer II)

Abstract

:
A nanofluid is composed of a base fluid with a suspension of nanoparticles that improve the base fluid’s thermophysical properties. In this work, the authors have conducted experimental tests on an alumina-based nanofluid (Al2O3/H2O) moving inside a 3D-printed lattice channel. The unit cell’s lattice shape can be considered a double X or a double pyramidal truss with a common vertex. The test channel is 80 mm long and has a cross-sectional area, without an internal lattice with that has the dimensions H × W, with H = 5 mm and W = 15 mm. A nanofluid and a lattice duct can represent a good compound technique for enhancing heat transfer. The channel is heated by an electrical resistance wound onto its outer surface. The heat transfer rate absorbed by the nanofluid, the convective heat transfer coefficients, and the pressure drops are evaluated. The experimental tests are carried out at various volumetric contents of nanoparticles (φ = 1.00%, φ = 1.50% and φ = 2.05%) and at various volumetric flow rates (from 0.2 L/min to 2 L/min). The preliminary results show that in the range between 0.5 L/min ÷ 2.0 L/min, the values of convective heat transfer coefficients are greater than those of pure water (φ = 0) for all concentrations of Al2O3; thus, the nanofluid absorbed a higher thermal power than the water, with an average increase of 6%, 9%, and 14% for 1.00%, 1.50% and 2.05% volume concentrations, respectively. The pressure drops are not very different from those of water; therefore, the use of nanofluids also increased the cooling efficiency of the system.

1. Introduction

Choi and Eastman [1] coined the term “nanofluid”, which is nanoparticles dispersed in conventional liquids, such as water and ethylene glycol, forming a new type of fluid used for heat transfer enhancement and produced through a suspension of nanometer-sized particles. Nanofluids were introduced in the second half of the 1900s, following the need to increase the efficiency of many devices used to exchange heat, but also in the civil, aerospace, and medical fields [2,3,4]. Lee et al. [5] published one of the first experimental papers on nanofluids and studied the improvement in thermal conductivity of water/copper oxide, water/alumina and glycol/alumina.
Nanofluids have several heat transfer applications because of the thermal conductivity increase and so have better thermophysical properties than conventional fluids [6]. Several properties, such as the volumetric fraction of nanoparticles; the size, shape, and species of the nanoparticles and base fluid; the temperature and pH; the Brownian motion of nanoparticles; and the aggregation of the nanoparticles play important roles in the increase of heat transfer characteristics of nanofluids. In fact, numerous physical phenomena affect heat transfer in nanofluids: clusters, the thermophoresis in the nanofluids, the Brownian motion of the base fluid, the formation of adsorbate nanolayers, and the scattering of phonons at the solid–liquid interface, etc. [7]. One physical phenomenon can predominate over another, and this one depends on various parameters, such as temperature and the size and volume fraction of the nanoparticles [8].
In the study carried out by Scott et al. [9], hybrid nanofluids as a new class of nanofluids were presented, and the study underlined that more research is needed before their actual application in industry. The advantages of hybrid nanofluids are due to the synergistic effect through which they provide favorable properties to each constituent. Their use is still limited because, although stable, hybrid nanofluids remain difficult to achieve due to the difficult selection and synthesis of materials.
The applications of graphene nanofluids in heat pipes, heat exchangers, solar collectors, and pool boiling devices are presented in Lin et al. [10], which showed their applications in terms of economics and the environment. Reviews of the state-of-the-art research on nanofluids are given in Trisaksri and Wongwises [11], Yu et al. [12], and Mohammed et al. [13].
The application of nanofluids for increasing heat transfer is widely done in various heat exchanger applications. The advent of nanofluids has allowed the construction of smaller heat exchangers, because lower mass flow rates are required. In the review [14], various investigators analyzed diverse nanofluids in circular, triangular, and square ducts that were being considered for various applications, such as heat exchangers, refrigerators, engines, and solar thermal systems. It has been demonstrated that introducing oil as a base fluid enhances the thermal performance of the components. Ma et al. [15] carried out a numerical study on laminar flow and convection at the entry region of microchannels with heat flux and temperature boundary conditions. The results showed the dependence of the apparent friction factor from the Reynolds number and the influence of the axial heat transfer on the Nusselt number, taking into account the entry region. The efficiency obtained demonstrated that the nanofluids in the entrance region provide heat transfer enhancement as well as good economy.
In the work of Cieśliński et al. [16], a theoretical study about the influence of nanoparticles and temperature (20–70 °C) on the Nusselt number and convective coefficient was carried out for a nanofluid during turbulent flow in a horizontal and round tube. It was shown that even for small mass fractions (0.1–5%) of nanoparticles (Al2O3), an increase in heat transfer took place, and that enhancement probably was due to the transport mechanisms. Abdelaziz et al. [17] carried out a comparative numerical study on mixed convective heat transfer and pressure drop in the developed flow region in an isothermal horizontal tube with three nanofluids—simple (water and Al2O3, TiO2, or Cu), ionic ([C4mim] [NTf2]/Al2O3, ionic nanofluids being prepared by dispersing nanoparticles in ionic liquids), and hybrid (water and Al2O3 + Cu). The authors showed an enhancement of the average Nusselt number of about 15.5% for Water and Al2O3 with a volume fraction of 2%. For hybrid one no enhancement is found, while for ionic nanofluid an enhancement of the Nusselt number of about 37% with a concentration of 2.5% was noticed.
Wai et al. [18] reported experimental and numerical investigations of jet impingement with the aim of cooling devices with nanofluids. The application of nanofluids in jet impingement is used in many engineering fields due to their promising heat dissipation ability. However, the main problem is an abnormal increase in the friction factor and pressure drop. Alammar and Mohammed [19] simulated a heterogeneous nanofluid flow in pipes. They used two different base fluids, ethylene glycol and water, and carried out a numerical study in microchannels showing that base fluids with higher Prandtl numbers result in higher heat transfer enhancement.
Zeng et al. [20] studied numerically the effect of using a nanofluid and rectangular groove microchannel; an increase in the thermal performance was found with respect to a conventional smooth microchannel (Nusselt number 38.5% larger with the same nanofluid).
The papers reported above [14,15,16,17,18,19,20] show that the application of nanofluids for increasing heat transfer is widely investigated in different heat exchanger applications, and nanofluid has allowed for the construction of smaller heat exchangers, because lower mass flow rates are required, as mentioned above.
The aim of this paper is to match the advantage of nanofluid itself and its possible use in reticular ducts already widely used by many researchers to increase heat transfer.
The reticular channels find their origin in cellular and porous materials. Cellular and porous materials have become the most promising lightweight multifunctional materials, such as metal foams and periodic cellular materials, as well as lattice truss structure (e.g., pyramidal lattice, tetrahedral lattice, Kagome lattice) [21]. Lattice frame material based on the tetrahedral cell was studied by Kim et al. [22] and Kim, Hodson and Lu [23], who analyzed forced air convection on an ultralightweight aluminum lattice material, depending on the orientation of the same. The heat transfer performance was almost the same overall, the pressure drop in a cell was found almost the same overall, and the pressure drop in a cell was about 30% and 60% of the dynamic pressure for several Reynolds numbers.
Shen et al. [24] compared two sandwich panels, single-layered Kagome and Wire-woven Bulk Kagome (WBK) with the same porosity. Heat transfer and local flow characteristics were studied, and it was found that single-layered Kagome provides a higher Nusselt number (26–31%) with respect to WBK, while the Reynolds number comprised between 3995–8710.
Other ultralightweight materials with a lattice structure are X-type structures [25]. The unit cell was formed by two staggered struts with respect to the classic pyramidal structure and made by bending the sheet metal along rows of staggered nodes; thus, the folded structure was brazed with upper and lower foils forming sandwich panels. The structure thus appeared more resistant to inelastic buckling than the pyramidal truss core.
Yan et al. [26] presented an enhanced convective heat transfer by a newly developed X-type lattice, removing heat up to two times higher than the periodic cellular materials.
As demonstrated by the scientific literature reported above, the use of a nanofluid flowing in a standard smooth duct enhances the heat exchange. On the other hand, a gain in the heat exchange performance can also be obtained by the structure itself of the X-type lattice printed inside the duct. In fact, as attested by Petracci et al. [27], the flow of a traditional fluid (e.g., air) in a reticular channel enhances the heat exchange. The present paper reports the heat exchange improvement due to the combined effect of both nanofluid and reticular channel. The scientific literature is lacking on this topic, and this paper would fill that gap.
The paper presents preliminary results of heat transfer and pressure drop measurements on Al2O3/H2O nanofluids that flow through a double X-type reticular duct. The tests were carried out with different concentrations of alumina and at different volumetric flow rates. The lattice duct is 3D printed and has to be used as a heat exchanger for cooling the cold plate of a remote processing unit. The porosity inside the channel is 75%. In previous work, the authors tested the same channel with air [27].

2. Al2O3/H2O Nanofluid, Test Channel and Experimental Apparatus

The nanofluid used in the experimental test was composed of water as the base fluid and alumina nanoparticles with dimensions of 7 nm. It was purchased at the TEC STAR with a mass fraction equal to 20% (volume fraction of about 6%), a pH of 5, and a zeta potential equal to +41.8 mV. The purchased nanofluid was diluted with deionized water to obtain three different concentrations, 1%, 1.5%, and 2% of volume fraction; it underwent magnetic stirring first and then ultrasound treatment for about an hour using an ultrasonic bath (Starsonic 90) with a frequency of 28 to 34 kHz for its stabilization.
In this study, preliminary tests were carried out on the nanofluid described above, with different concentrations of alumina and at different volumetric flow rates. As already reported, the volumetric concentrations chosen were 1.00%, 1.50%, and 2.05%, corresponding to 3.83%, 5.66%, and 7.62% of concentration by mass. The volumetric flow rates are between 0.2 L/min and 2.0 L/min. The experiments are conducted by fixing the thermal flux generated by the Joule effect by varying the flow rate of fluid flowing into the channel. A DC generator supplies to the test channel (TC) a power equal to about 160 W (equal to 76.27 kW/m2), which corresponds to an electrical current circulating in the circuit equal to I = 1.30 A and heater resistance Rhe = 94.70 Ω (diameter, electrical resistivity, and length of the Ni-Cu heating wire are known). Results of the fluid Al2O3/H2O for all the concentrations tested have been compared with those obtained with water alone in the same conditions.
The Test Channel (lattice duct) is 3D printed and must be used as a heat exchanger for cooling the cold plate of a remote processing unit. The duct has a length of 80 mm and an internal structure composed of an x-shaped lattice. Figure 1 shows the Test Channel (TC) and reports the lattice structure with respect to the x-z plane (y = 0 in the cartesian reference of the laboratory). Table 1 summarizes the lattice TC dimensions.
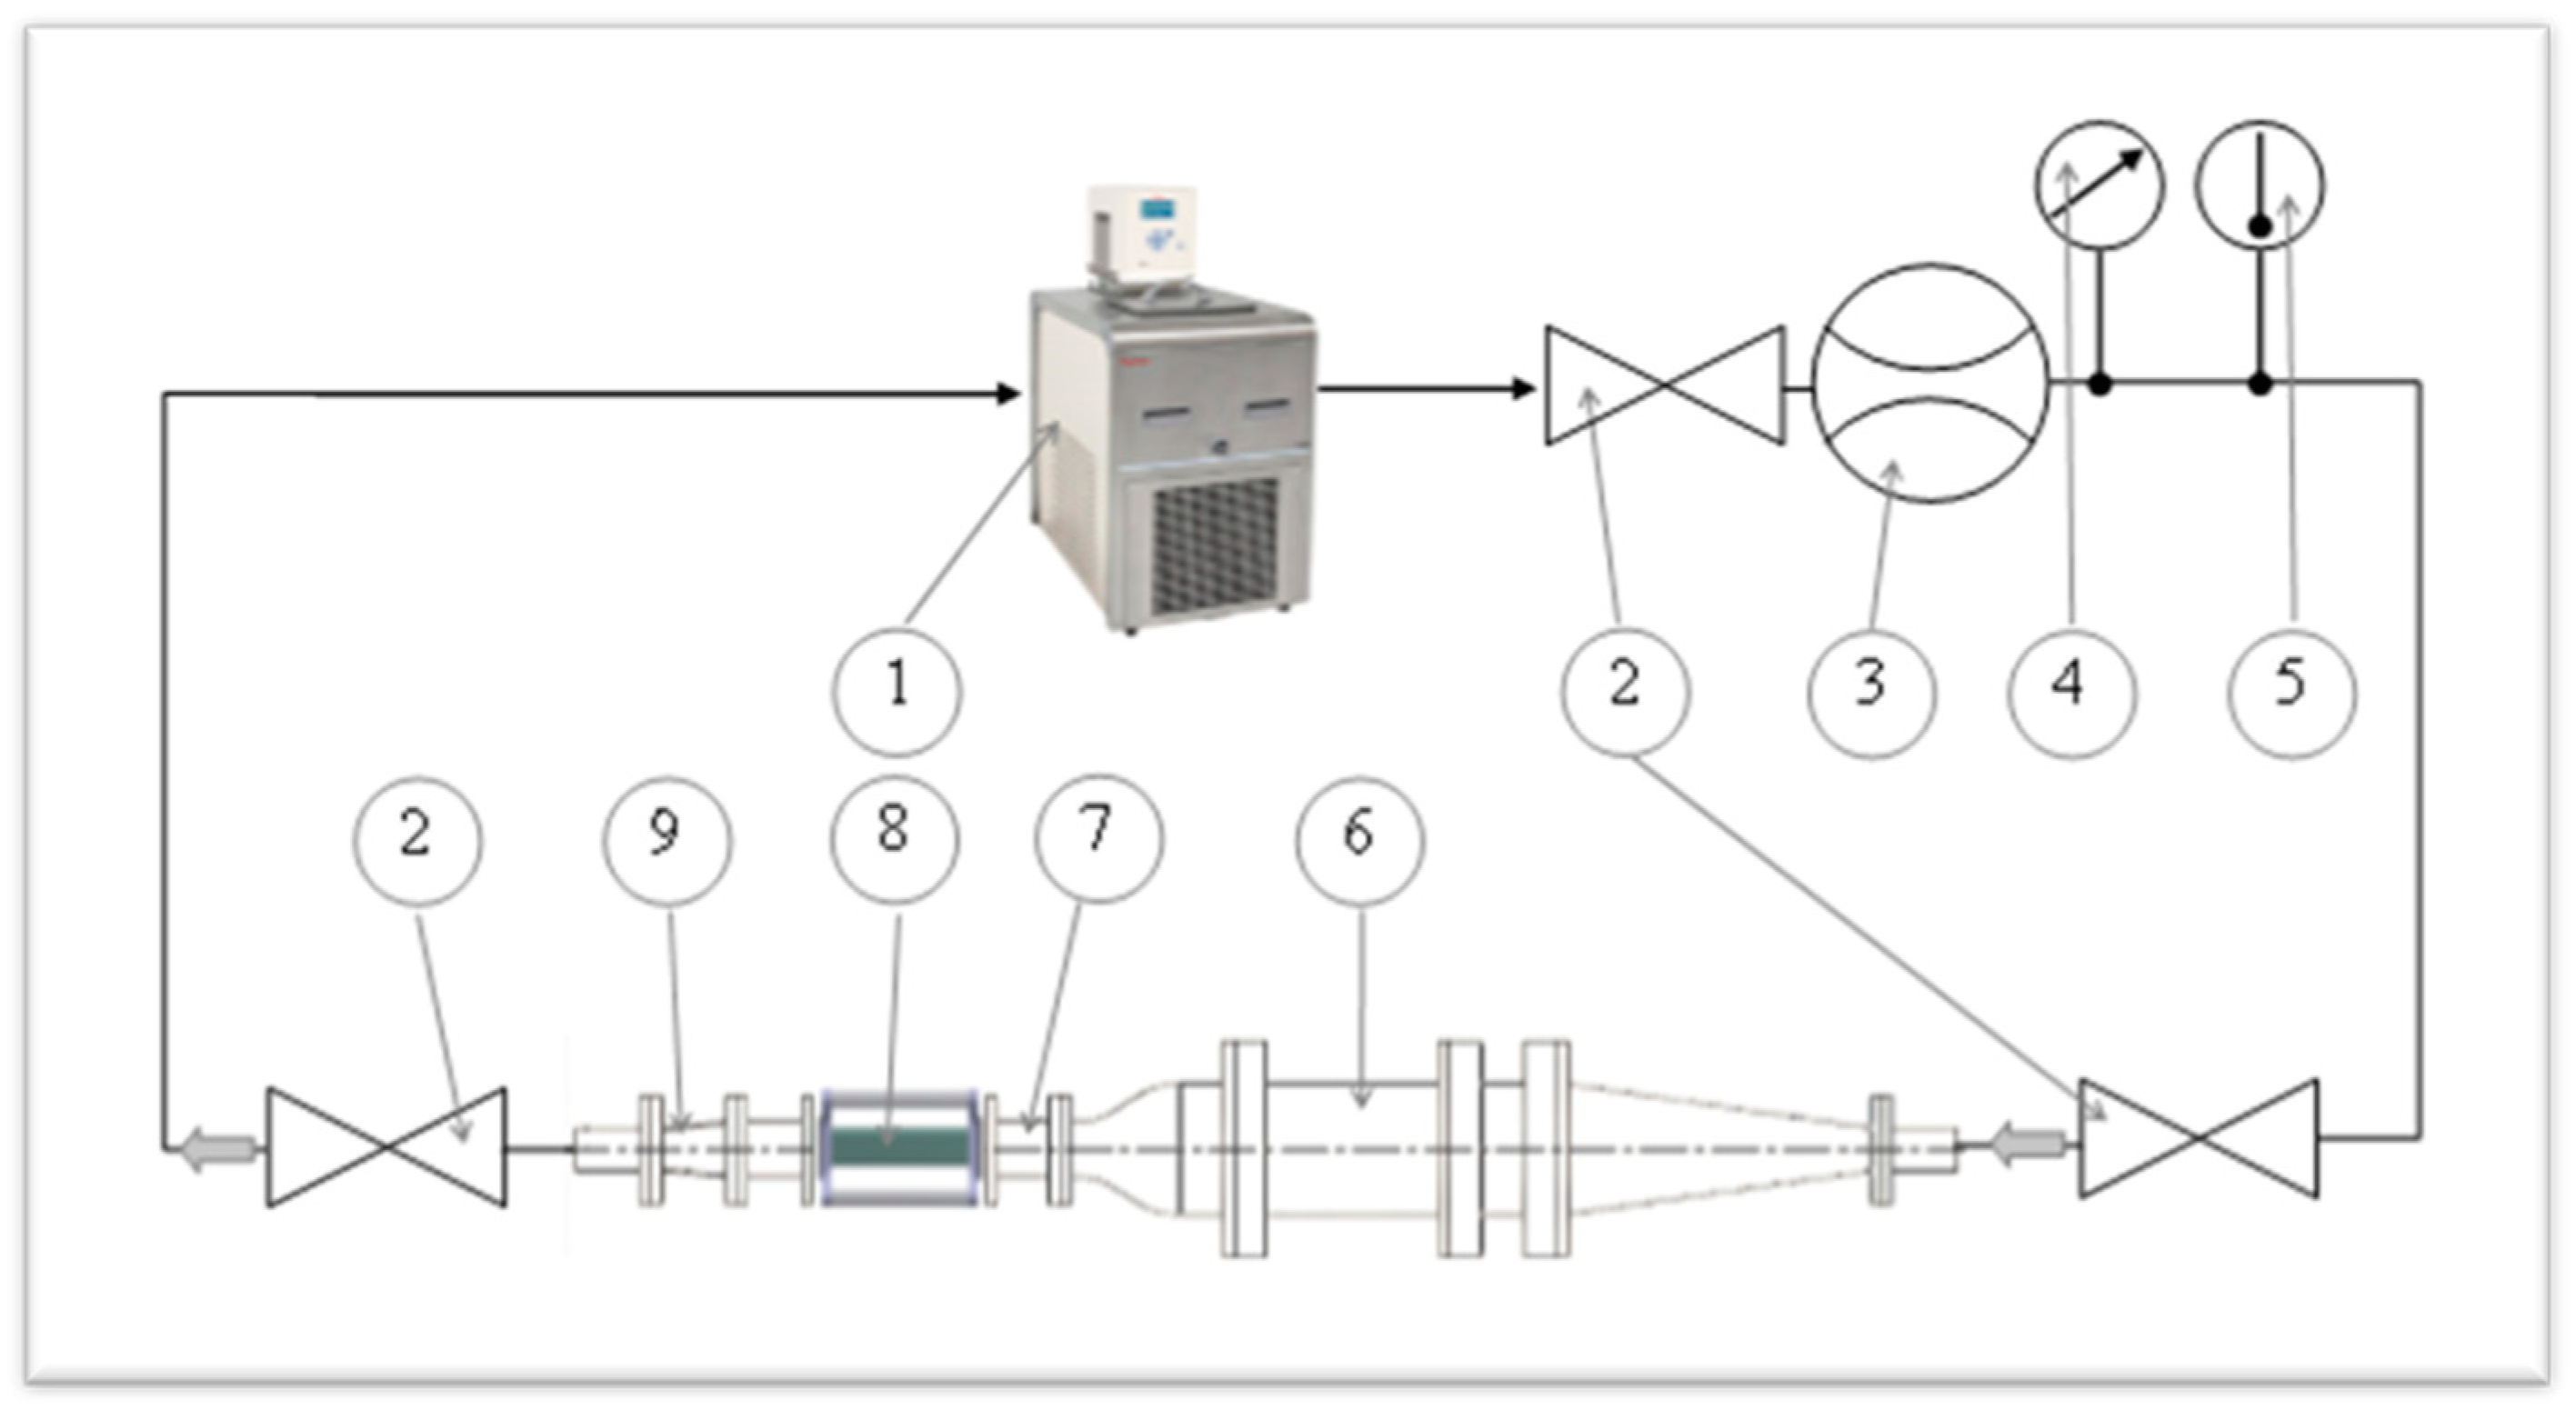
The porosity of the channel is 75%. The authors carried out preliminary tests in their laboratory. The experimental apparatus used for the measurements is the same as that used to carry out experimental tests on air [27]. To obtain valid and accurate results, it is essential to set up a controlled feeding circuit that guarantees the repeatability of the tests. The apparatus is provided with a pre-test plenum, to ensure a flat velocity profile at the inlet of the test duct and with a downstream diffuser, to recover the kinetic energy. The circuit is closed and is equipped with components reported in Figure 2.
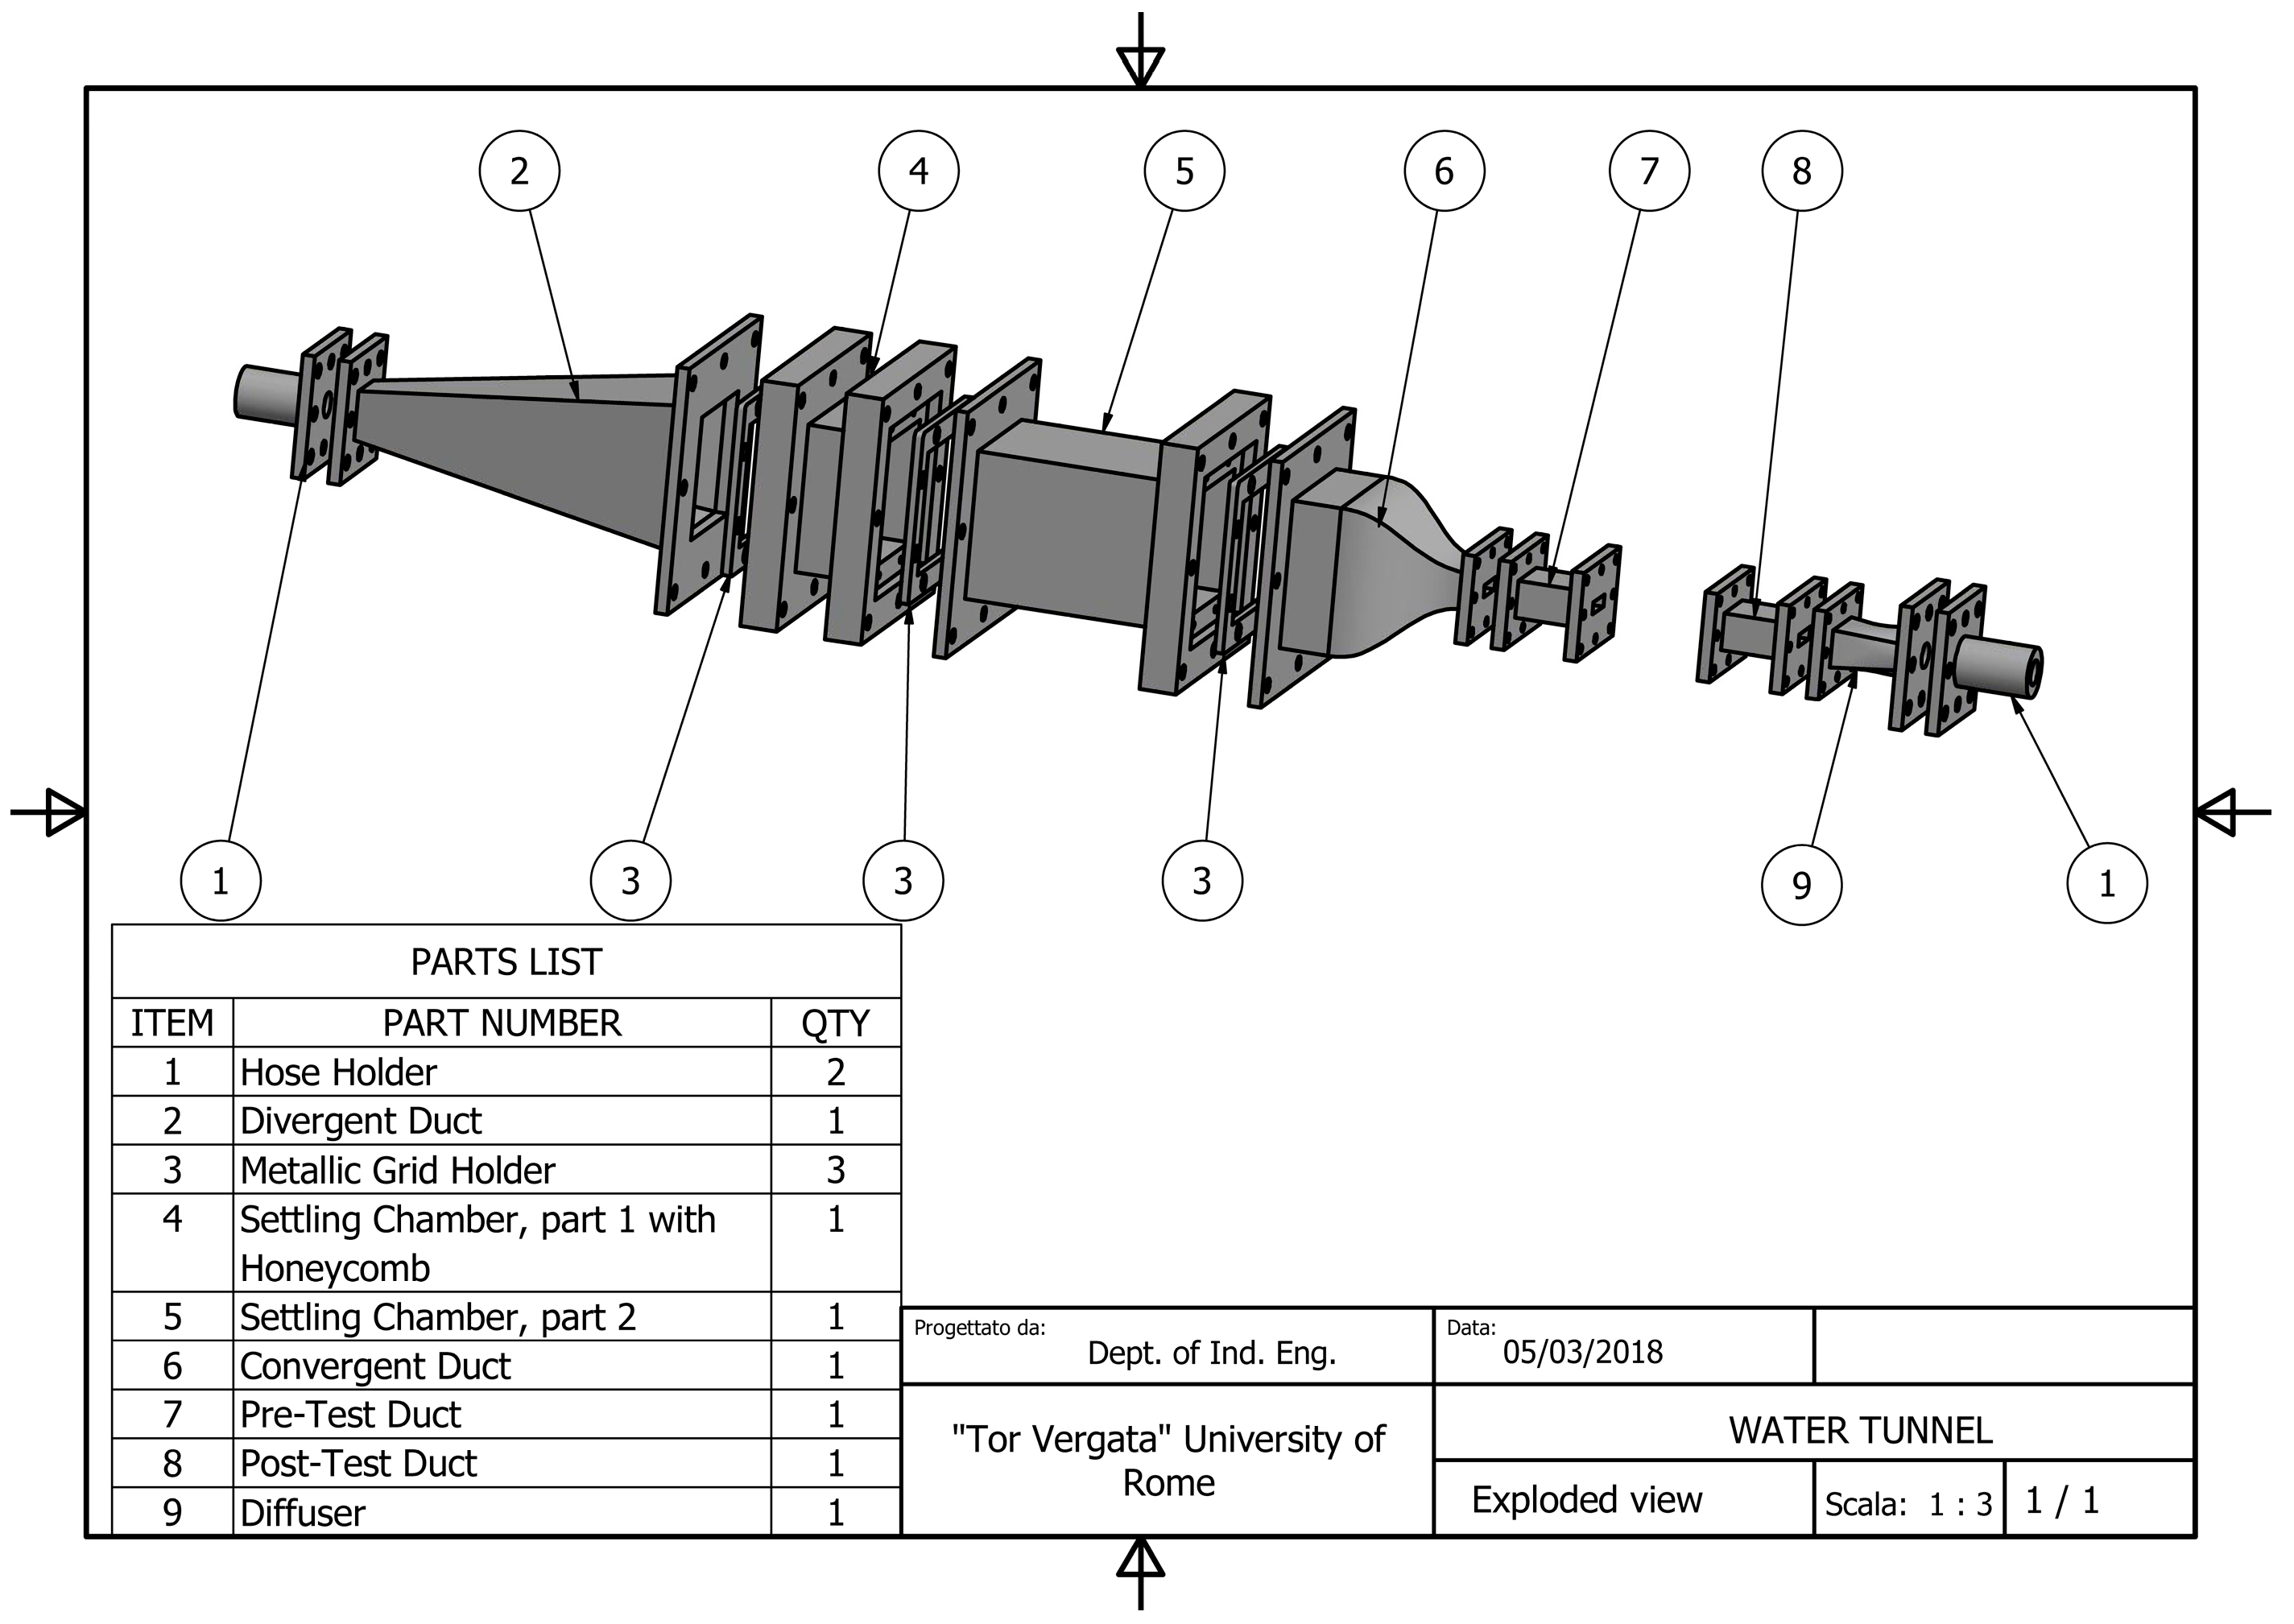
To allow temperature and pressure measurements at the inlet of test section, a short rectangular constant section duct is located just after the convergent, connected to the test channel by a flange. The pre-test or supply duct (SD) has a length of 35 mm and a rectangular section of 15 mm width and 5 mm height. An equal rectangular channel, referred to as the post-test duct in Figure 3, is placed after the lattice one, to allow temperature and pressure measurements at the outlet.
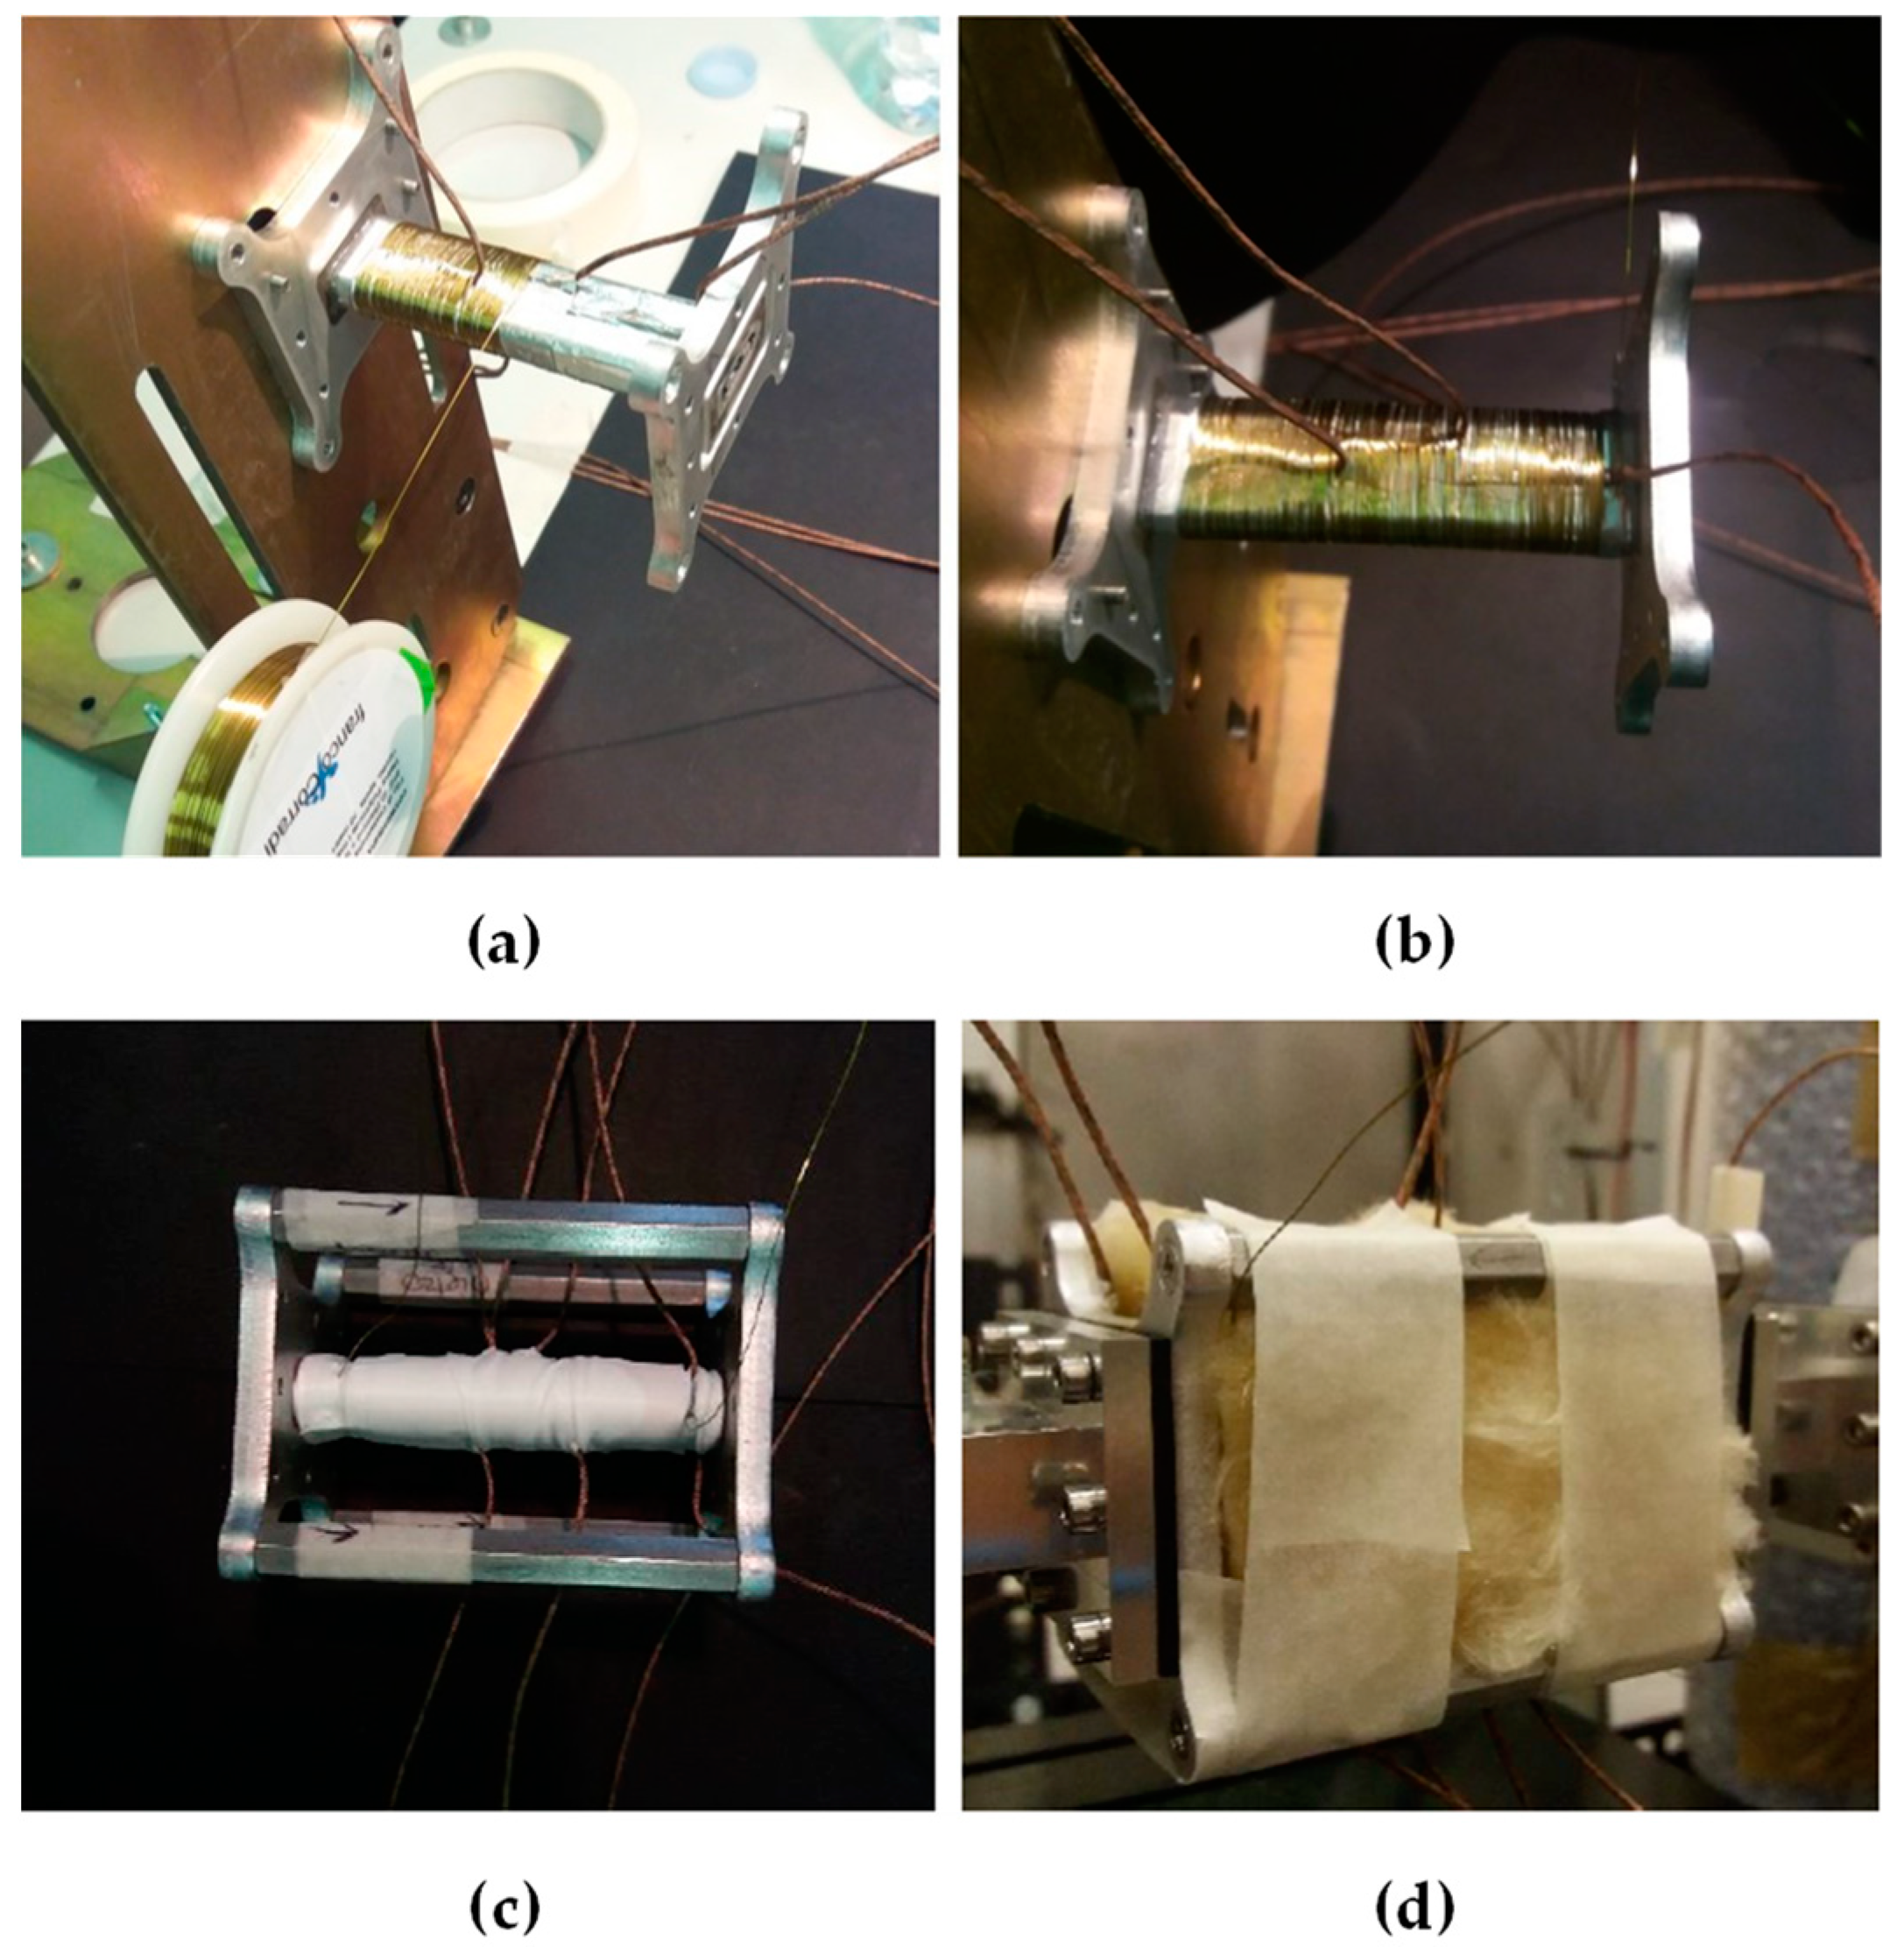
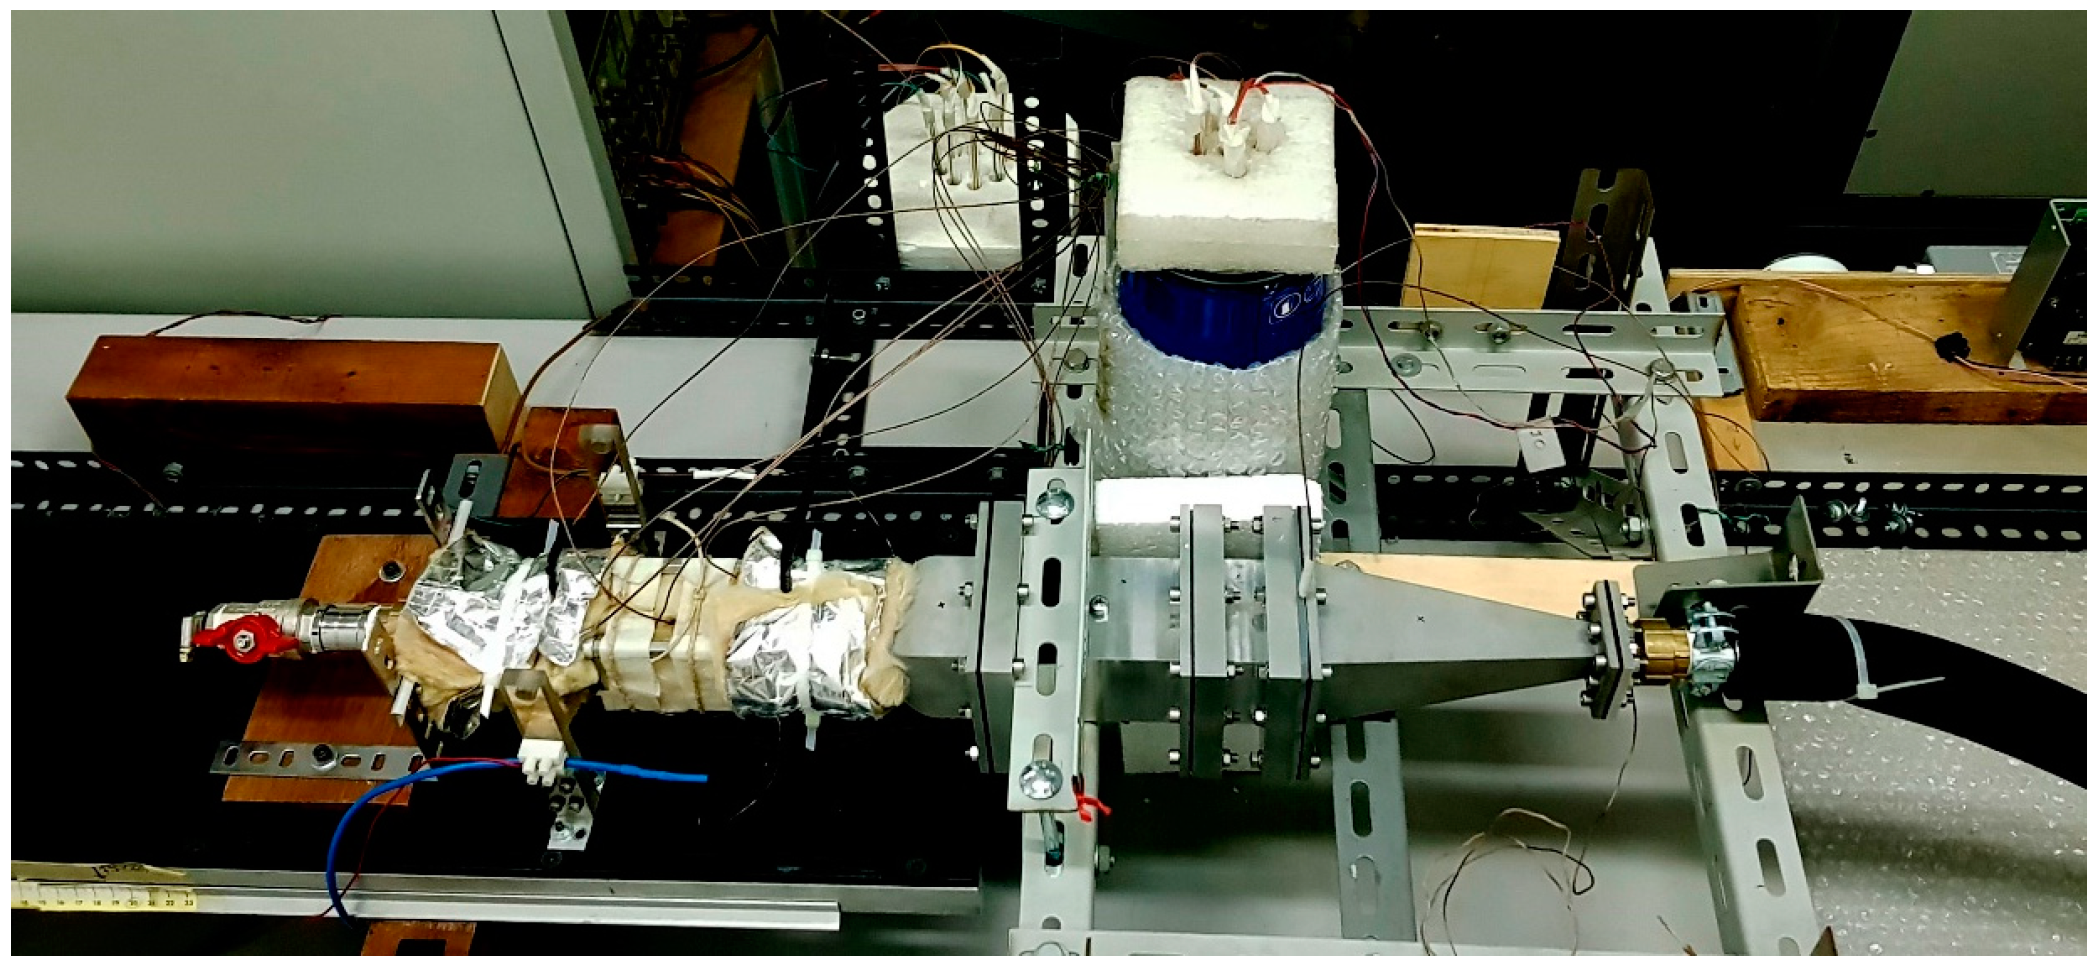
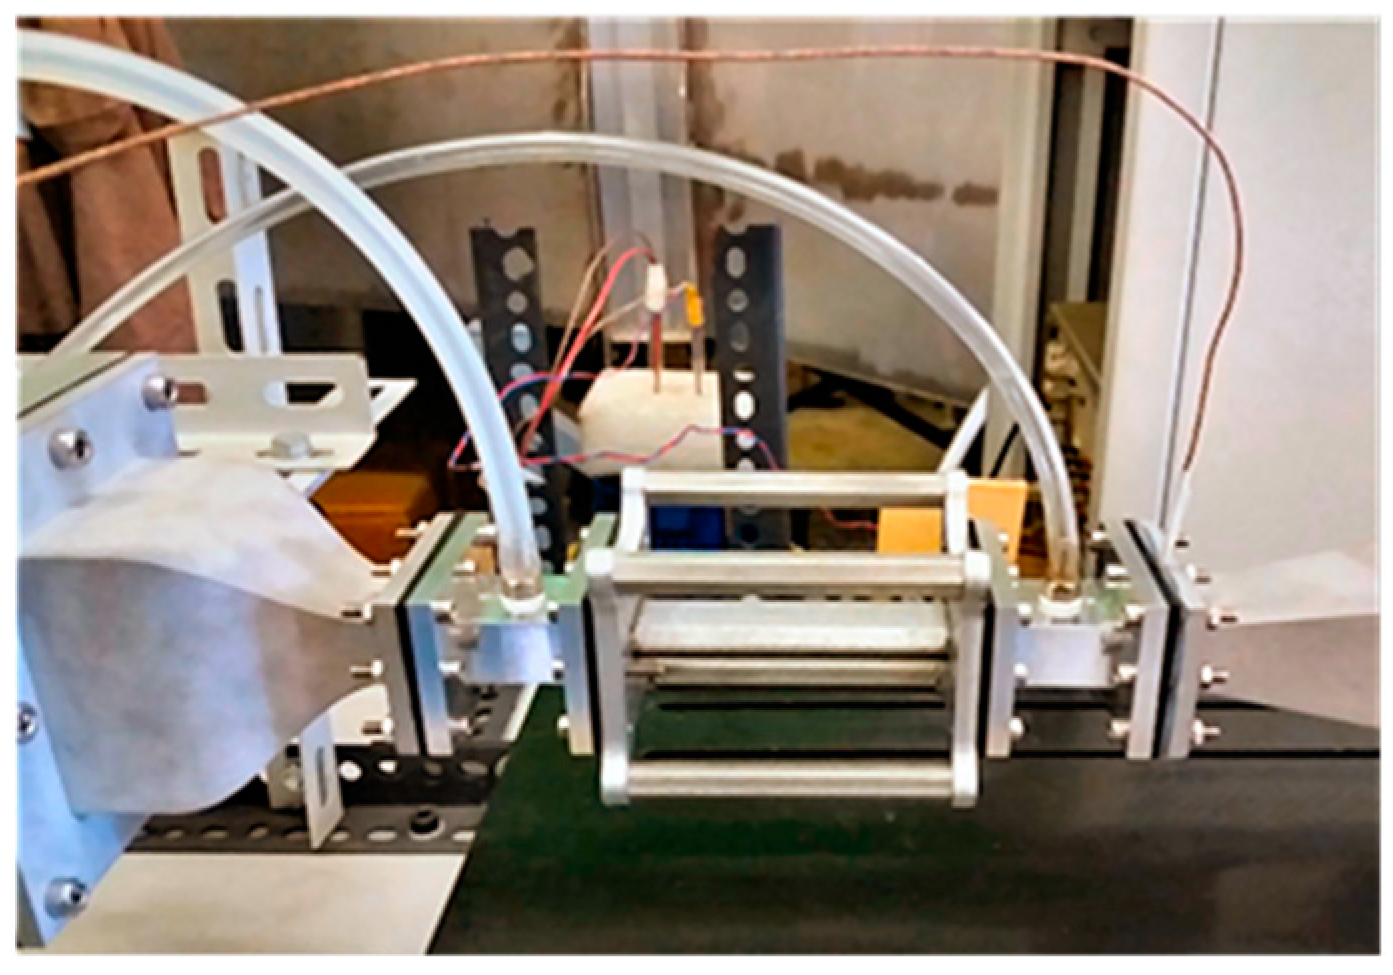
To study the behavior as a heat exchanger, the test channel TC was heated through a constantan metal wire (Ni-Cu 43/57 with diameter d = 0.254 mm and electric resistivity equal to 4.97 × 10⁻⁷ Ωm at 20 °C), which was wound externally to the duct (see Figure 4a,b) and covered with Teflon (Figure 4c). Finally, the entire flanged structure is insulated with a 2 cm layer of rockwool with aluminum foil (Figure 4d and Figure 5).
The heater was connected to an electric generator and a standard resistor shunt. In each experiment, temperatures, mass flow rate, electrical resistance of the heater, and dissipated power were measured. Seven J-type thermocouples are located equally spaced along the external tube of the lattice, in the middle, from x = 1 cm to x = 7 cm. An adhesive aluminum tape keeps the thermocouple heads pressed, ensuring both contact with the external surface of the tube and, at the same time, a homogeneous base surface on which to place the constantan metal wire heater and to realize a uniform heat flux. In addition to the 7 thermocouples of the lattice channel, there are 5 other temperature sensors. Two thermocouples measure the temperatures of the flanges to evaluate the heat flow dispersed by conduction and 2 are for measuring the temperature of the flow entering and leaving the duct, located in the pre- and post-ducts. The fifth thermocouple measures the external temperature of the rockwool to estimate the thermal flux by conduction through the insulation. Each sensor is connected to a data acquisition multimeter.
The apparatus was then equipped with a pressure transducer with static pressure holes for pressure measurements. Figure 6 shows a sketch of the test channel and static pressure holes.

3. Physical and Thermophysical Properties of the Nanofluid

The physical and thermophysical properties are required to calculate the heat dissipated by the nanofluids, the mass flow rate, and the dimensionless number (Nu, Re, Pr). In the following equations are reported the formulas used to calculate them. The physical and thermophysical properties depend on the volume fraction of the particle. The particle volume fraction can be evaluated by:
φ = ρ f w ρ f w + ( 1 w ) ρ p
with w particle weight fraction, ρf the fluid base density, ρp the particle density.
The nanofluid density ρnf is [28]:
ρ n f = φ ρ p + ( 1 φ ) ρ f
The nanofluid specific heat cnf is:
c n f = ( 1 φ ) ( ρ c ) f + φ ( ρ c ) p ( 1 φ ) ρ f + φ ρ p
with cf the water specific heat
The nanofluid thermal conductivity is calculated as [29]:
k n f k f = k p + 2 k f 2 φ ( k f k p ) k p + 2 k f + φ ( k f k p )
The nanofluid dynamic viscosity is calculated as [30]:
μ n f μ f = 1 1 34.8 ( d p d f ) 0.3 φ 1.03
with µf the water dynamic viscosity, df is the fluid base molecular diameter equal to
d f = 0.1 ( 6 M N π ρ f ) 0.33
M is the fluid base molecular weight and N the Avogadro number.
The nanofluid kinematic viscosity is:
ν n f = μ n f ρ n f
and the nanofluid Prandtl number is:
Pr n f = ν n f α n f = ν n f ρ n f c n f k n f
with αnf nanofluid thermal diffusivity.

4. Results and Discussion

4.1. Heat Transfer Measurements

The purpose is to evaluate the convective heat transfer; therefore, it is necessary to estimate this contribution. The total power rate is the sum of the heat transfer by forced convection, conduction to the supports, and conduction towards the external ambient through the insulation, according to the relationship:
Q ˙ tot = R h e I 2 = Q ˙ f c + Q ˙ cd - s + Q ˙ cd - ext
where I is the electrical current and Rhe the electrical resistance of the heater. The subscript “cd-s” for axial conduction to supports, “cd-ext” for conduction through insulation and “fc” for forced convection, which is given by the relation:
Q ˙ f c = R h e I 2 ( Q ˙ cd - s + Q ˙ cd - ext )
The same heat flow can be obtained by writing an energy balance (eb) on the coolant fluid. The enthalpy variation of the flow passing through the reticular duct is equal to the heat absorbed Q ˙ eb in the convective exchange, according to the relationship:
Q ˙ eb = Q ˙ = Δ H ˙ = m ˙ c n f Δ T measured = m ˙ c n f ( T n f ,   OUT T n f ,   IN )
where
  • ( T nf ,   OUT T nf ,   IN ) is the difference between the nanofluid temperature at the post-test duct and the temperature at the inlet measured in the pre-test duct;
  • m ˙ = ρ n f V ˙ is the mass flow rate in kg/s, with ρnf the nanofluid density (calculated with Equation (2)) and V the measured volumetric flow rate;
  • cnf is the nanofluid specific heat calculated with Equation (3).
The coolant temperature difference between the inlet and outlet can be either measured or calculated directly from energy balance:
Δ T calculated = Q ˙ f c m ˙ c n f
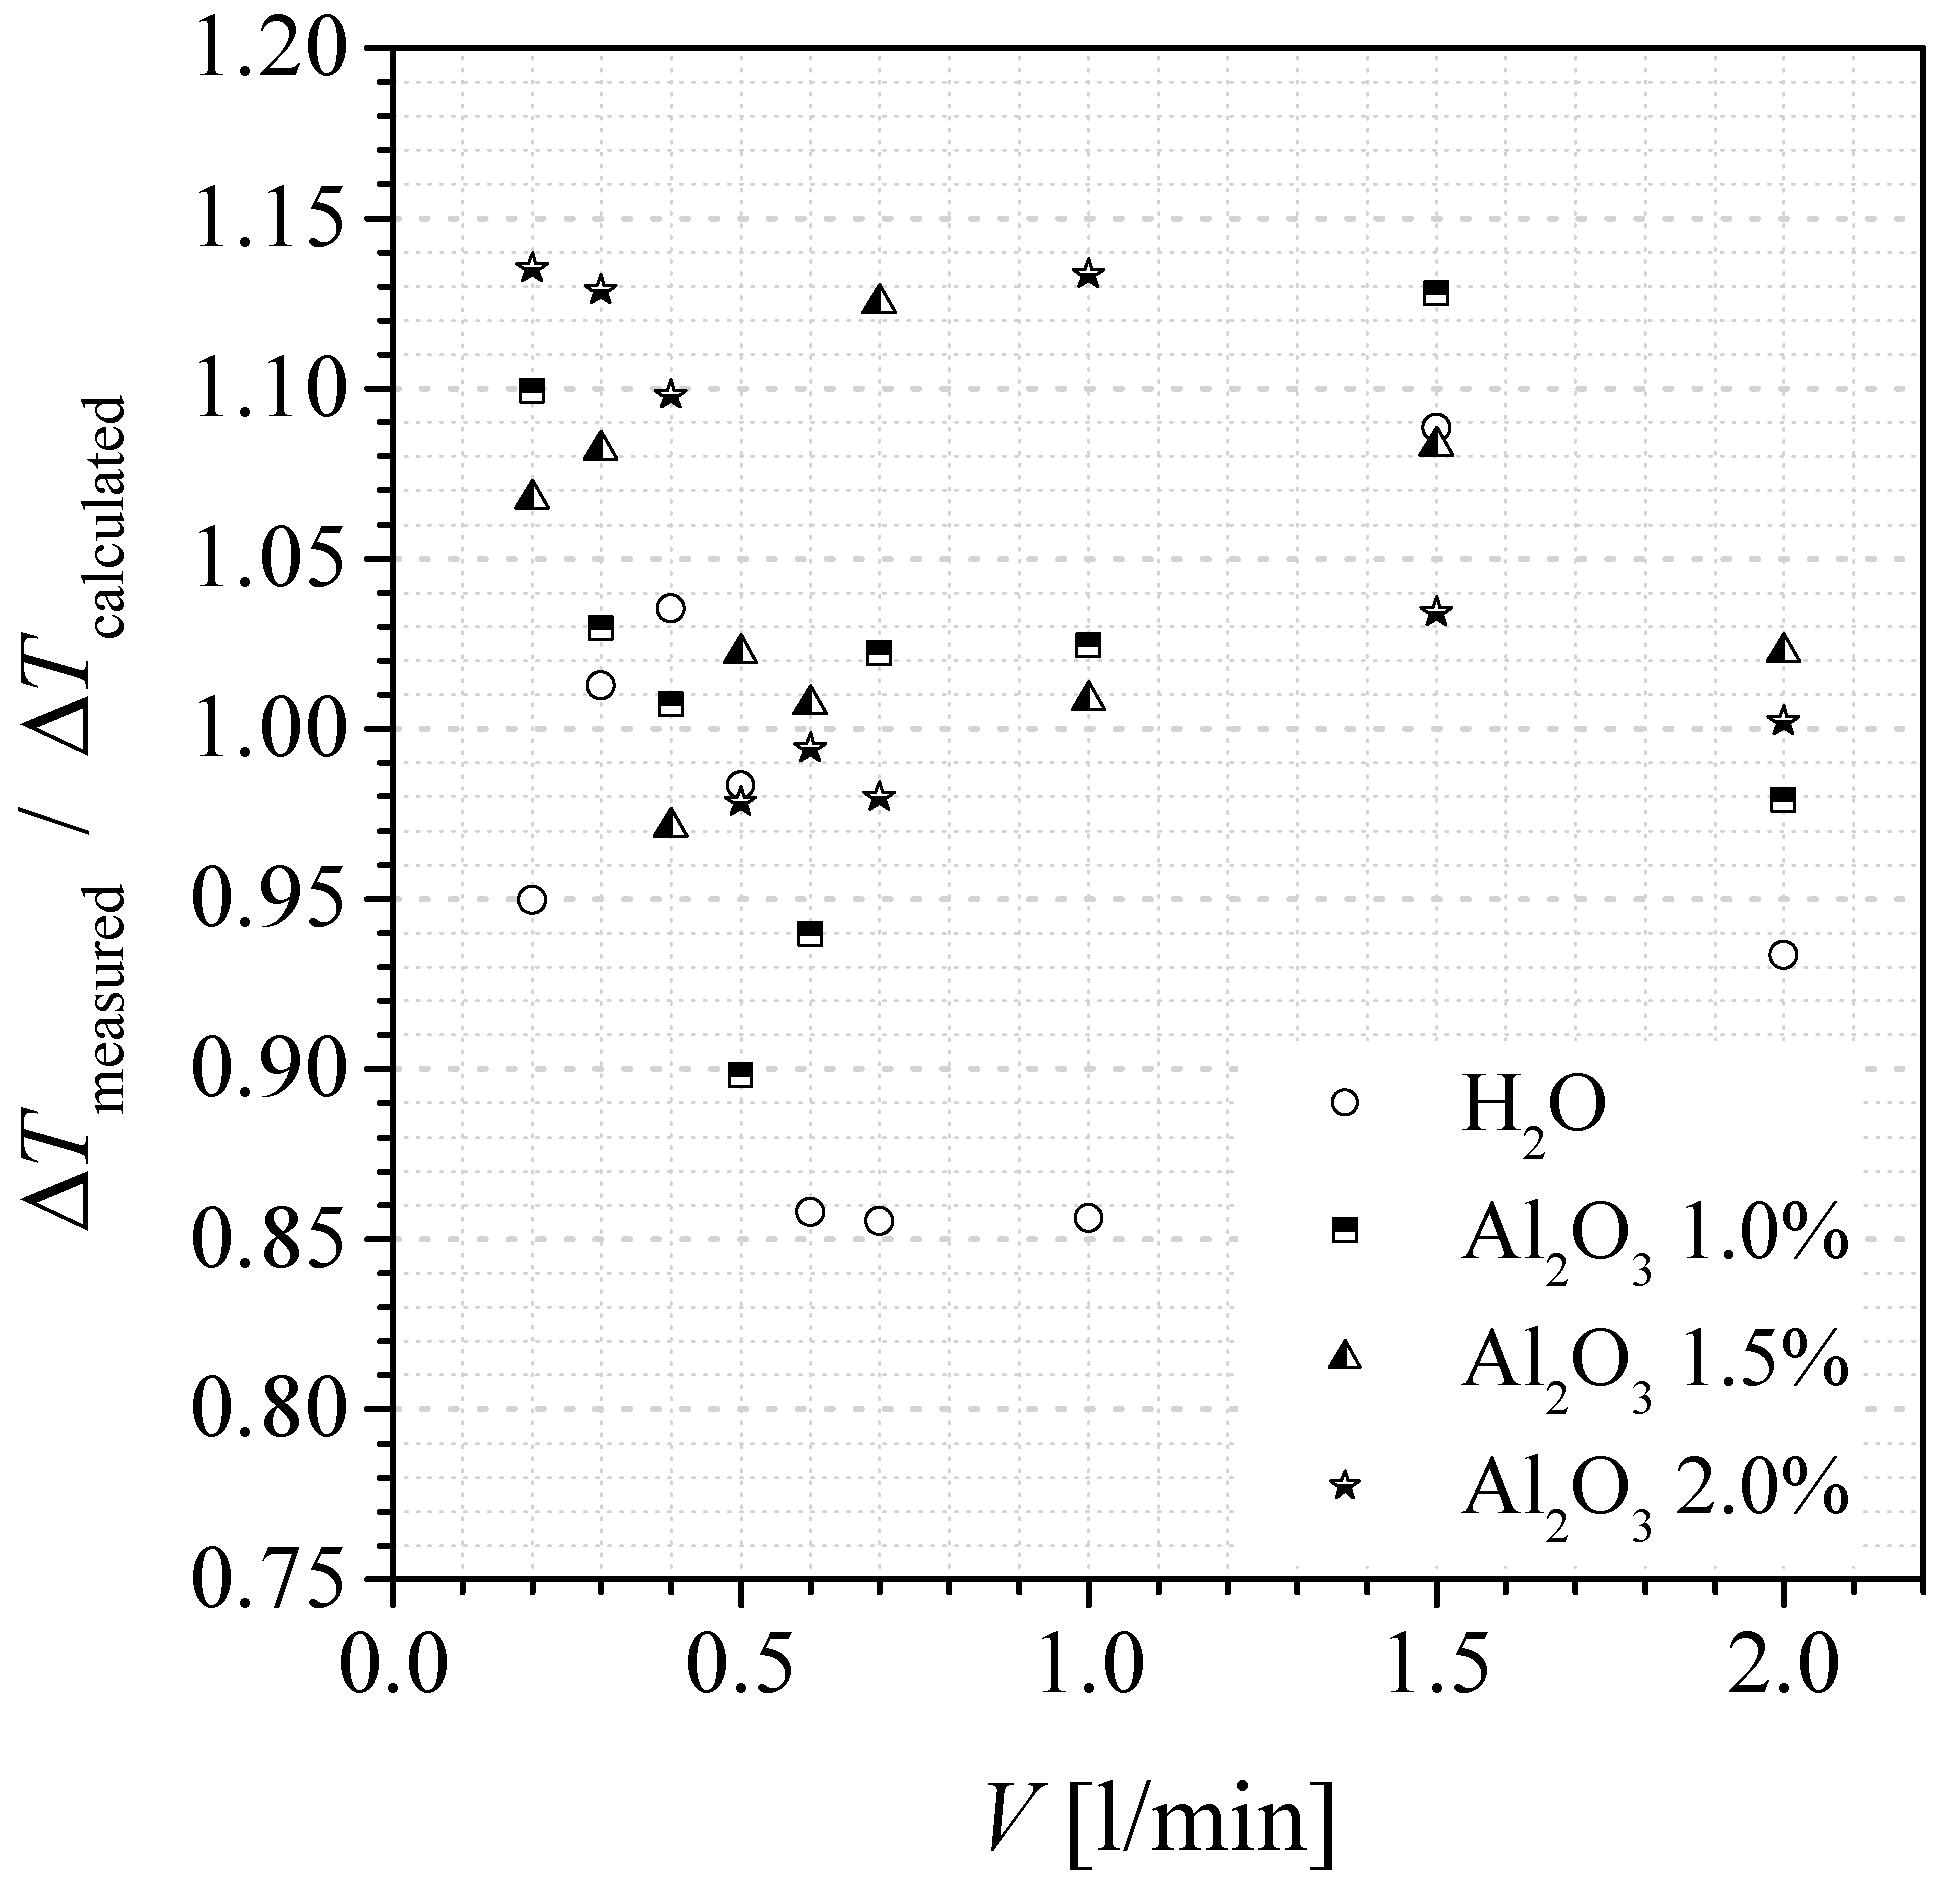
Figure 7 plots the ratio Δ T measured / Δ T calculated as a function of volume flow rate for the two levels of heat input: the measured values were within ±15% of predicted values.
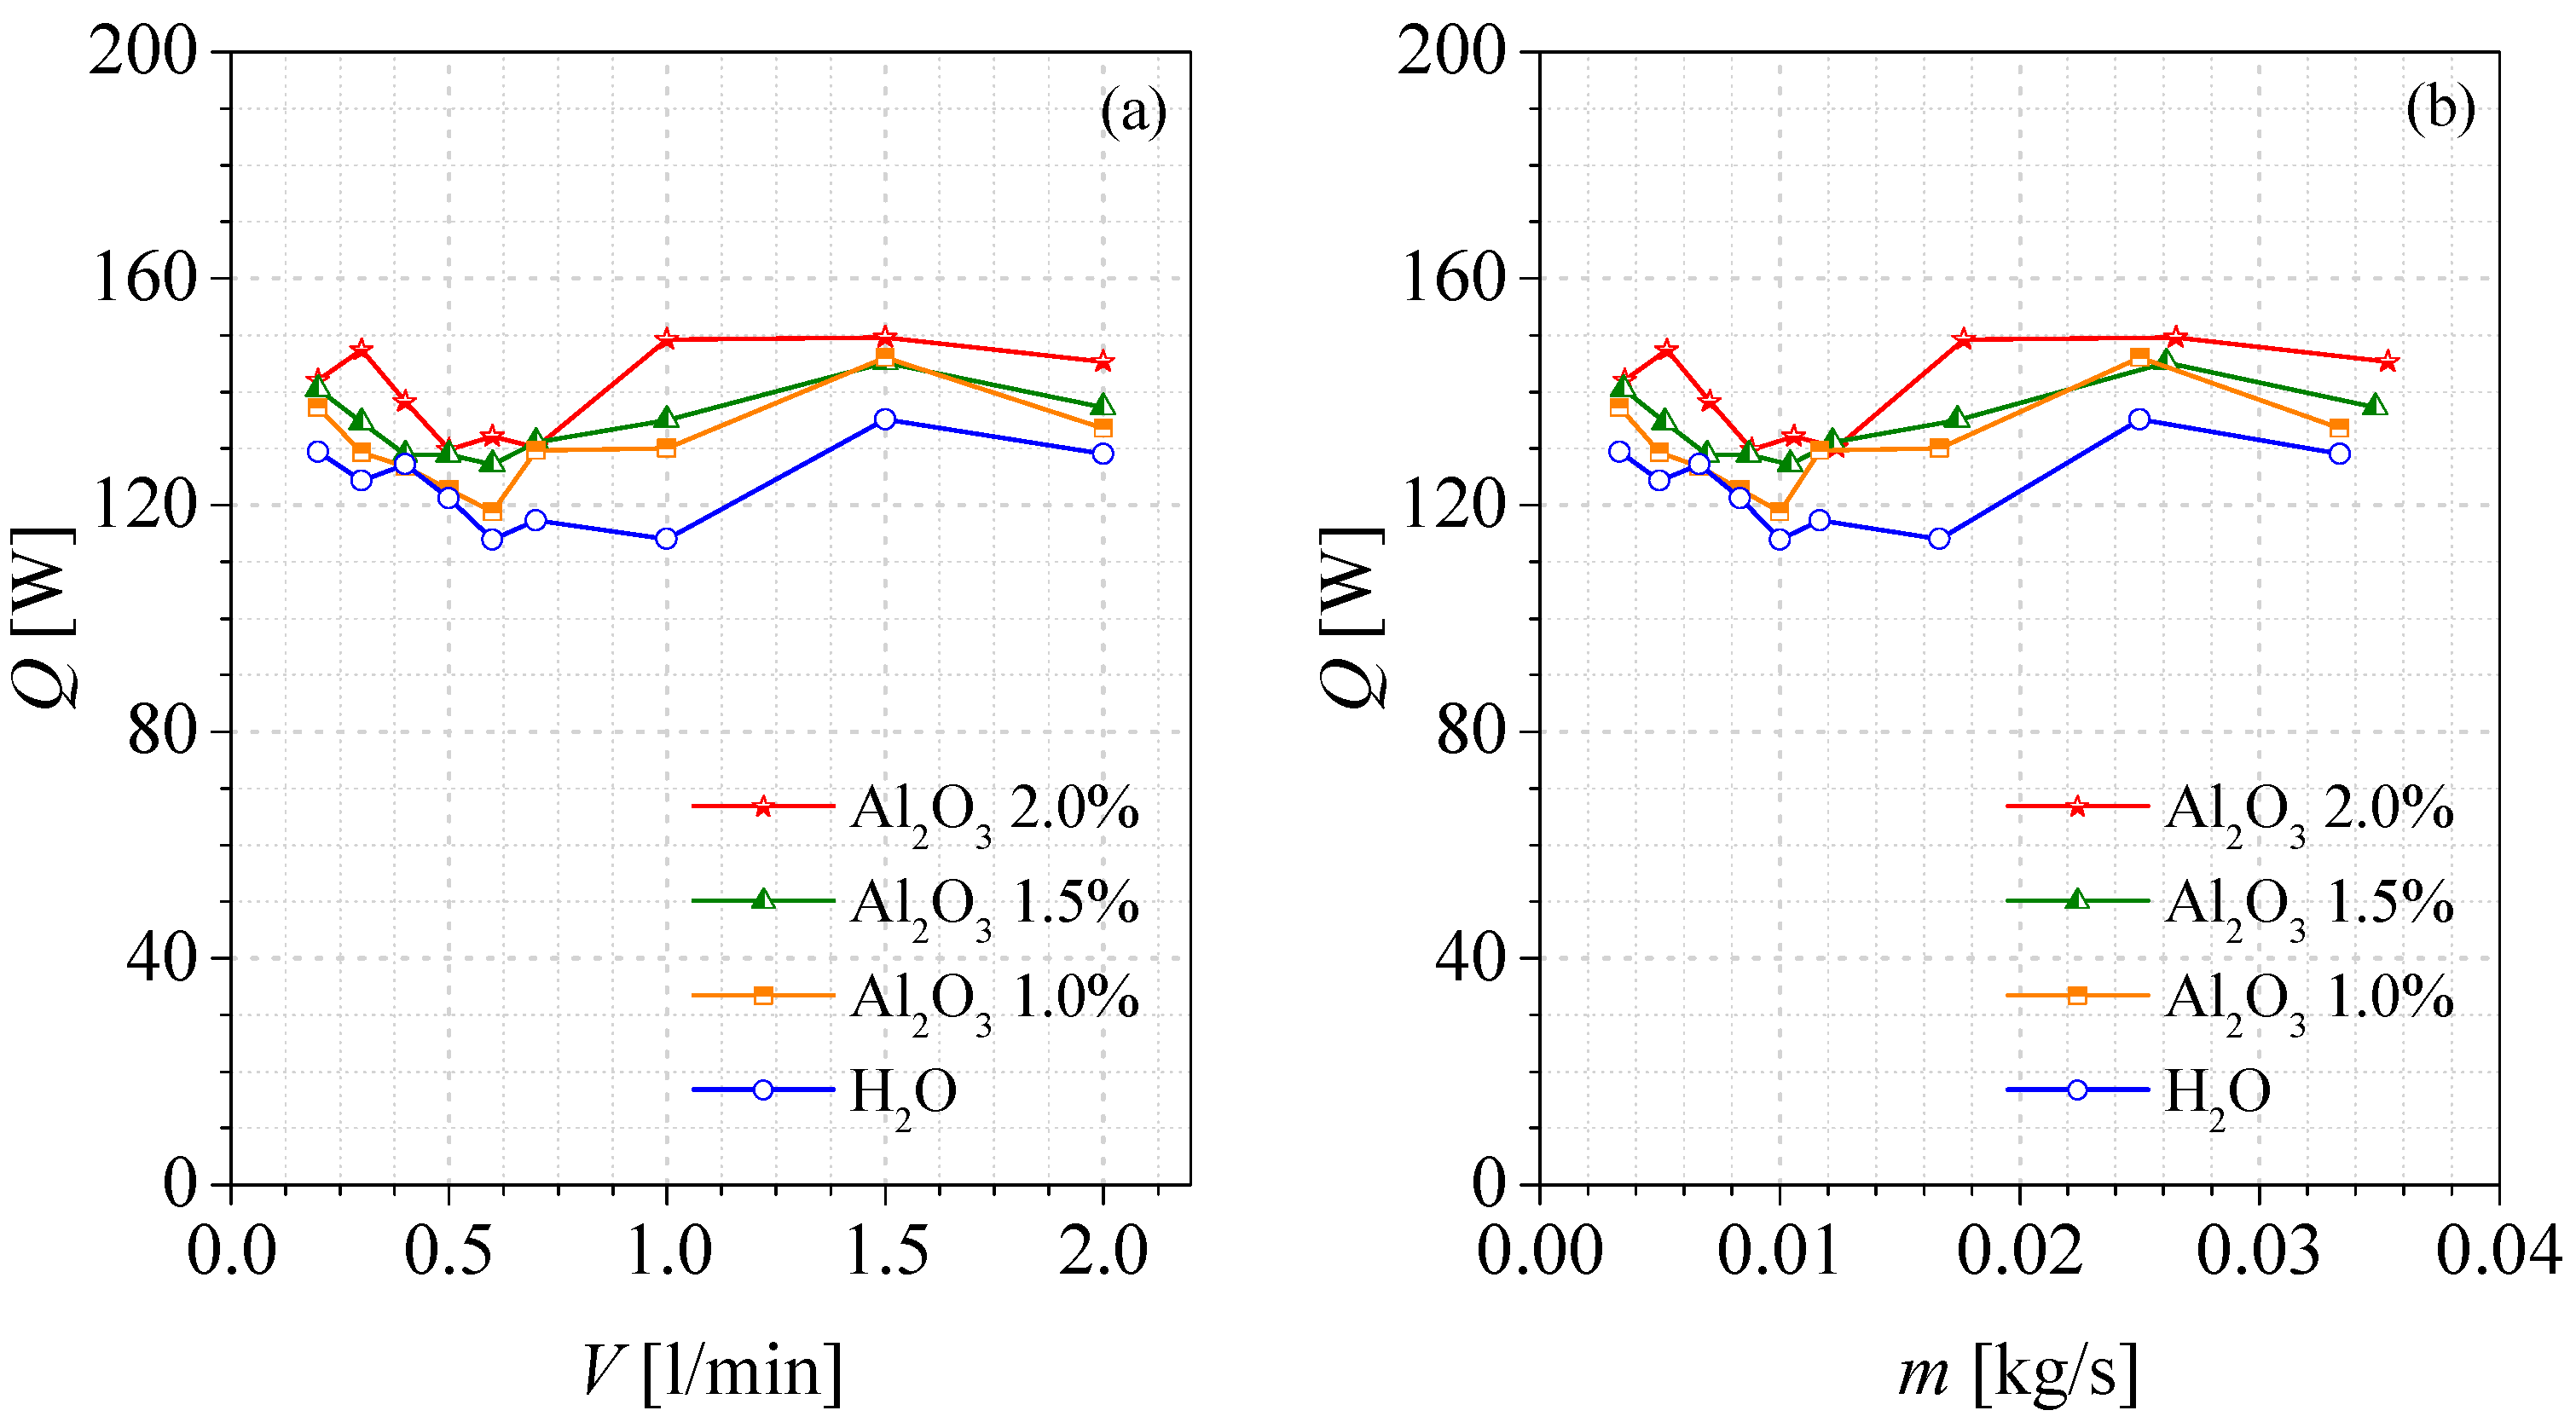
Figure 8 shows, for different volumetric fractions, the heat powers dissipated by the nanofluid by forced convection, calculated by Equation (11), and both reported versus the volumetric (a) and mass (b) flow rate. It can be seen that the nanofluid dissipates at a greater heat transfer rate than water for all volumetric fractions and for each tested flow rate. The maximum heat transfer rate removed is equal to about 150 W, obtained for the concentration of 2%, which corresponds to about 7.2 W/cm2.
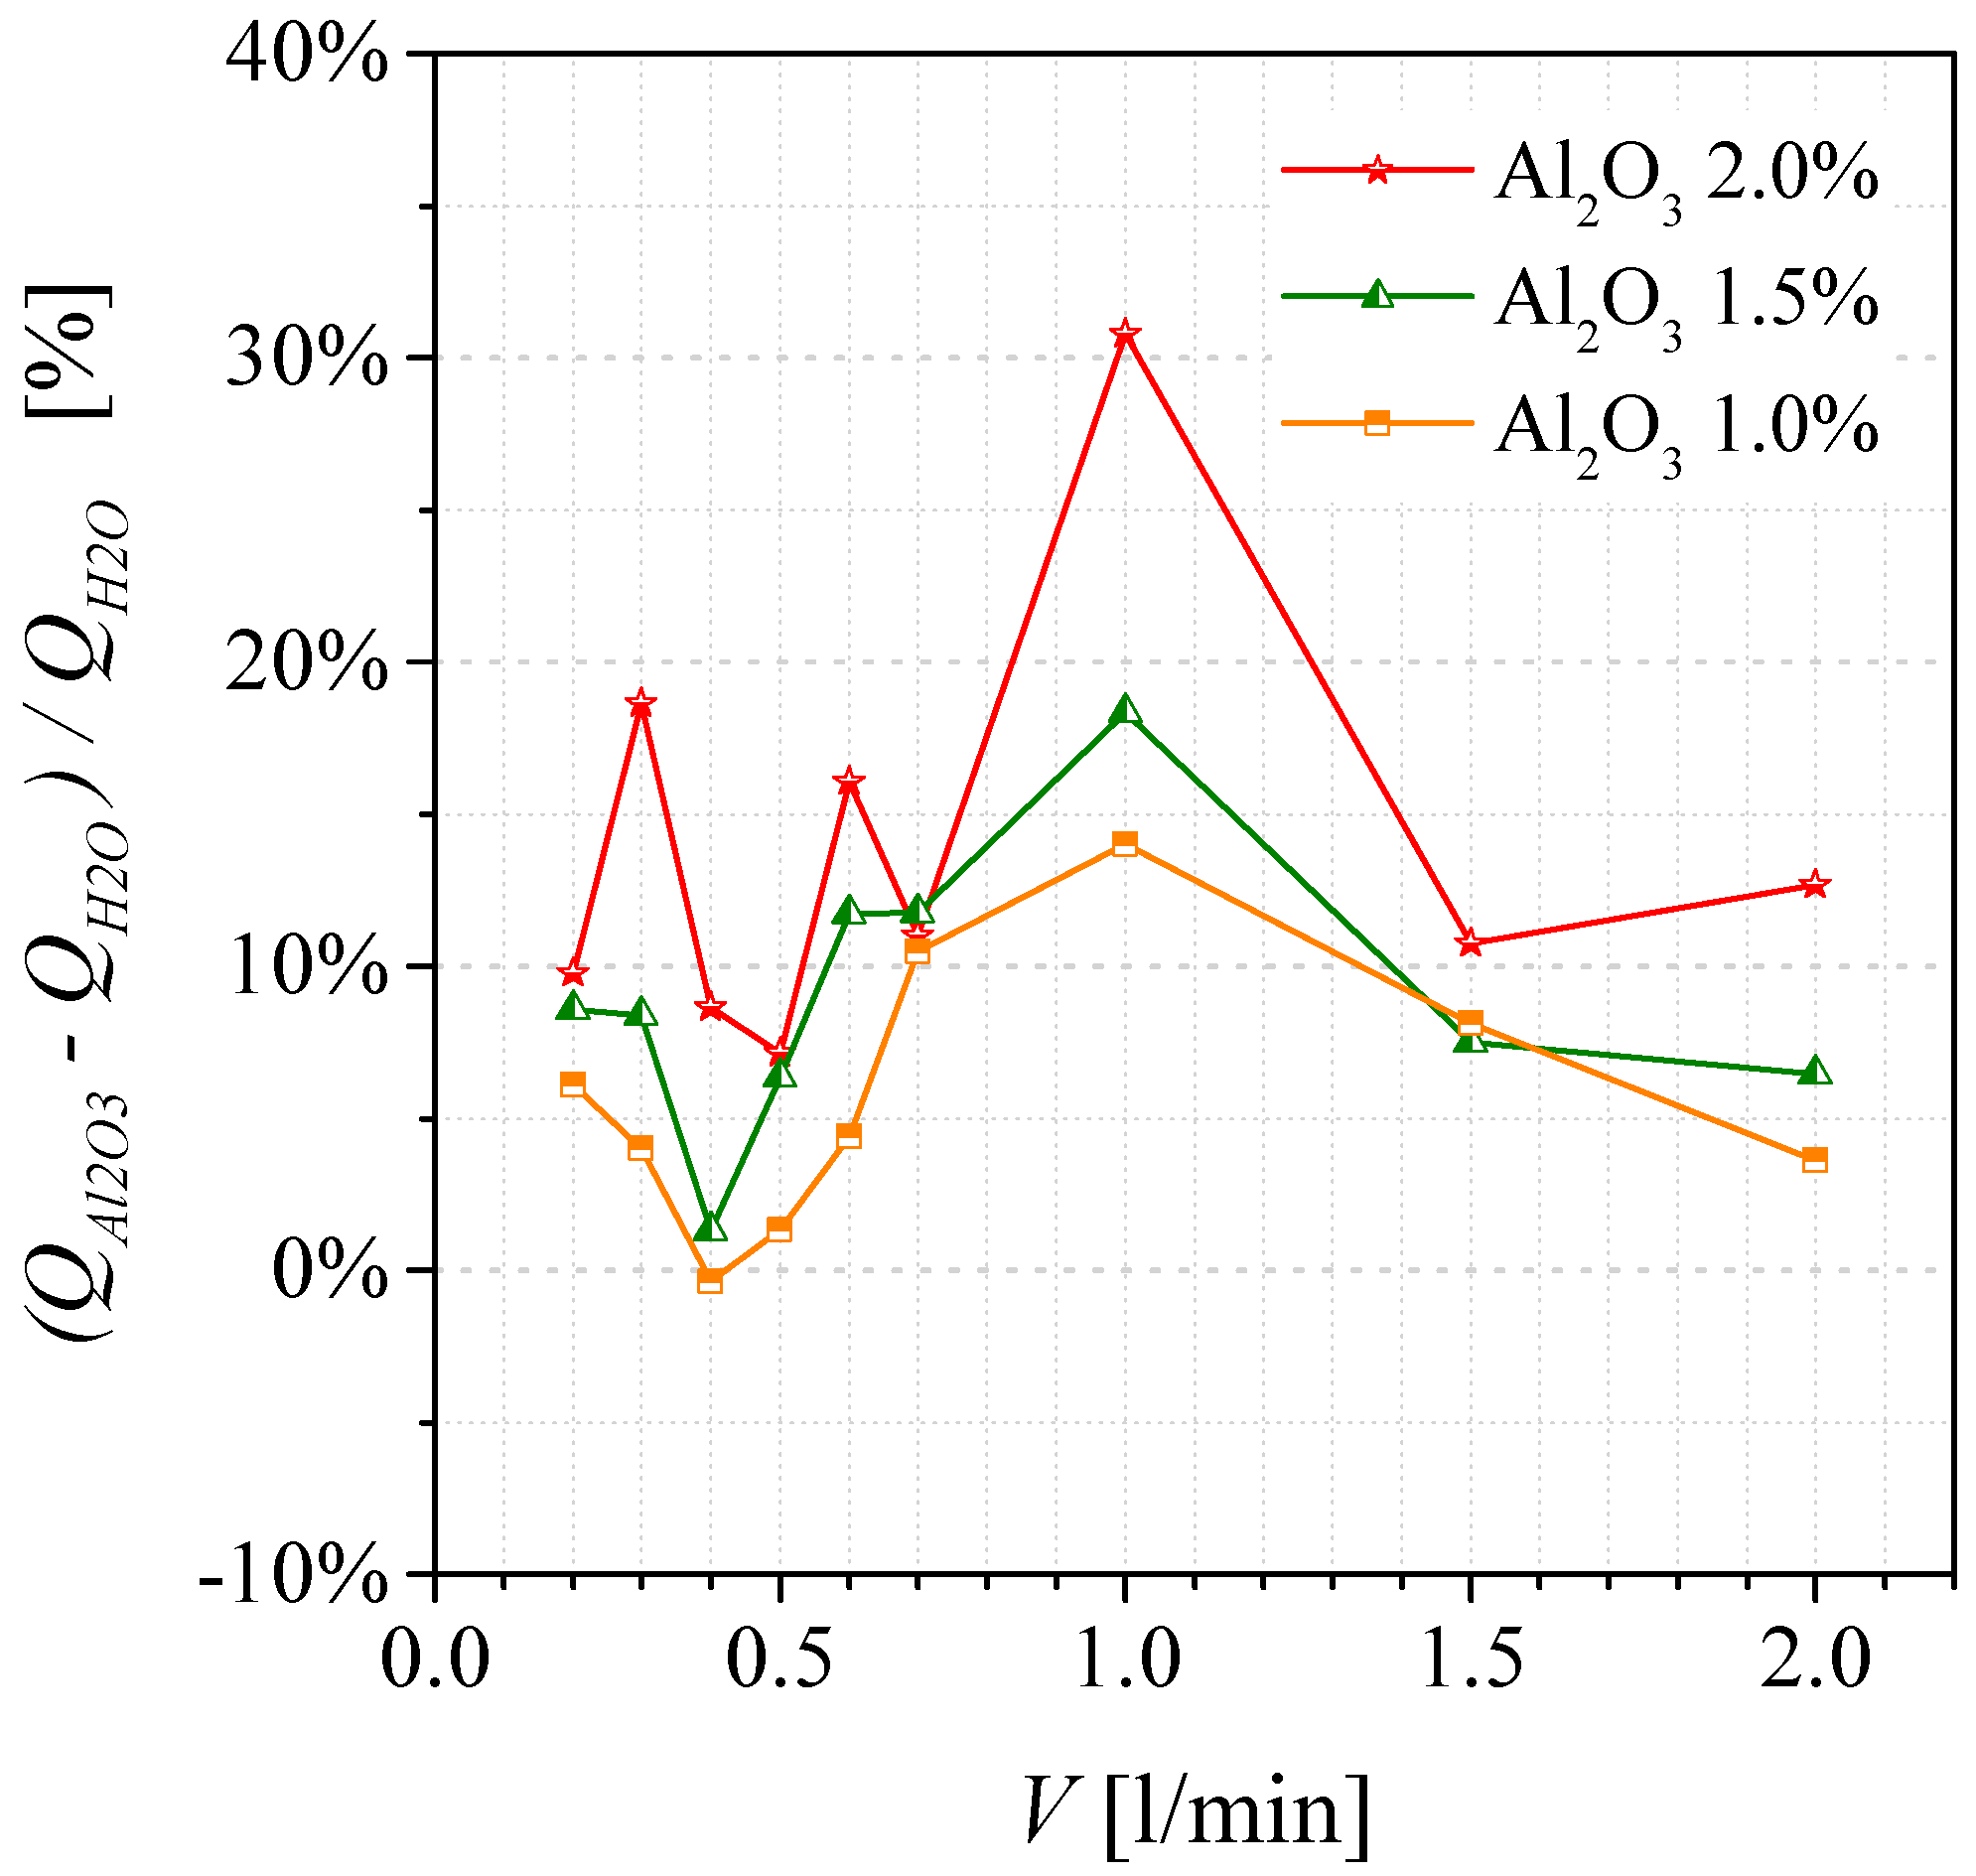
Figure 9 shows the percentage increase of the heat power absorbed by the nanofluid compared to that of the water, versus the volumetric flow rate. The nanofluid with the highest volumetric fraction (2%) presents the greatest increase, which reaches 30%, in correspondence with the volumetric flow equal to 1.0 L/min.
To evaluate the performance of the duct in the heat exchange, the local convective heat transfer coefficient is first defined, in correspondence with the position of the thermocouples placed along the duct. The local convective coefficient is therefore defined as
h ( x ) = ( Q ˙ / A ) T ( x ) T n f ( x ) = ( Q ˙ e b / A ) T ( x ) T n f ( x )
where A is the outer surface of the test channel, around which the heater is wrapped. Since it is a problem under uniform flow heat flux conditions, the local nanofluid temperature, Tnf(x), is supposed to vary linearly between the value measured at the inlet and that measured at the outlet from the lattice channel. T(x) represents the thermocouple temperature value, that is the local wall temperature. Because the thermocouples are equidistant, the area-averaged heat transfer coefficient, h, is defined as
h = 1 L 0 L h ( x ) d x = ( Q ˙ e b / A ) L 0 L 1 T ( x ) T n f ( x ) d x i h ( x i ) n
where n is the number of thermocouples along the external surface, while xi represents their local positioning, from x = 1 cm to x = 7 cm.
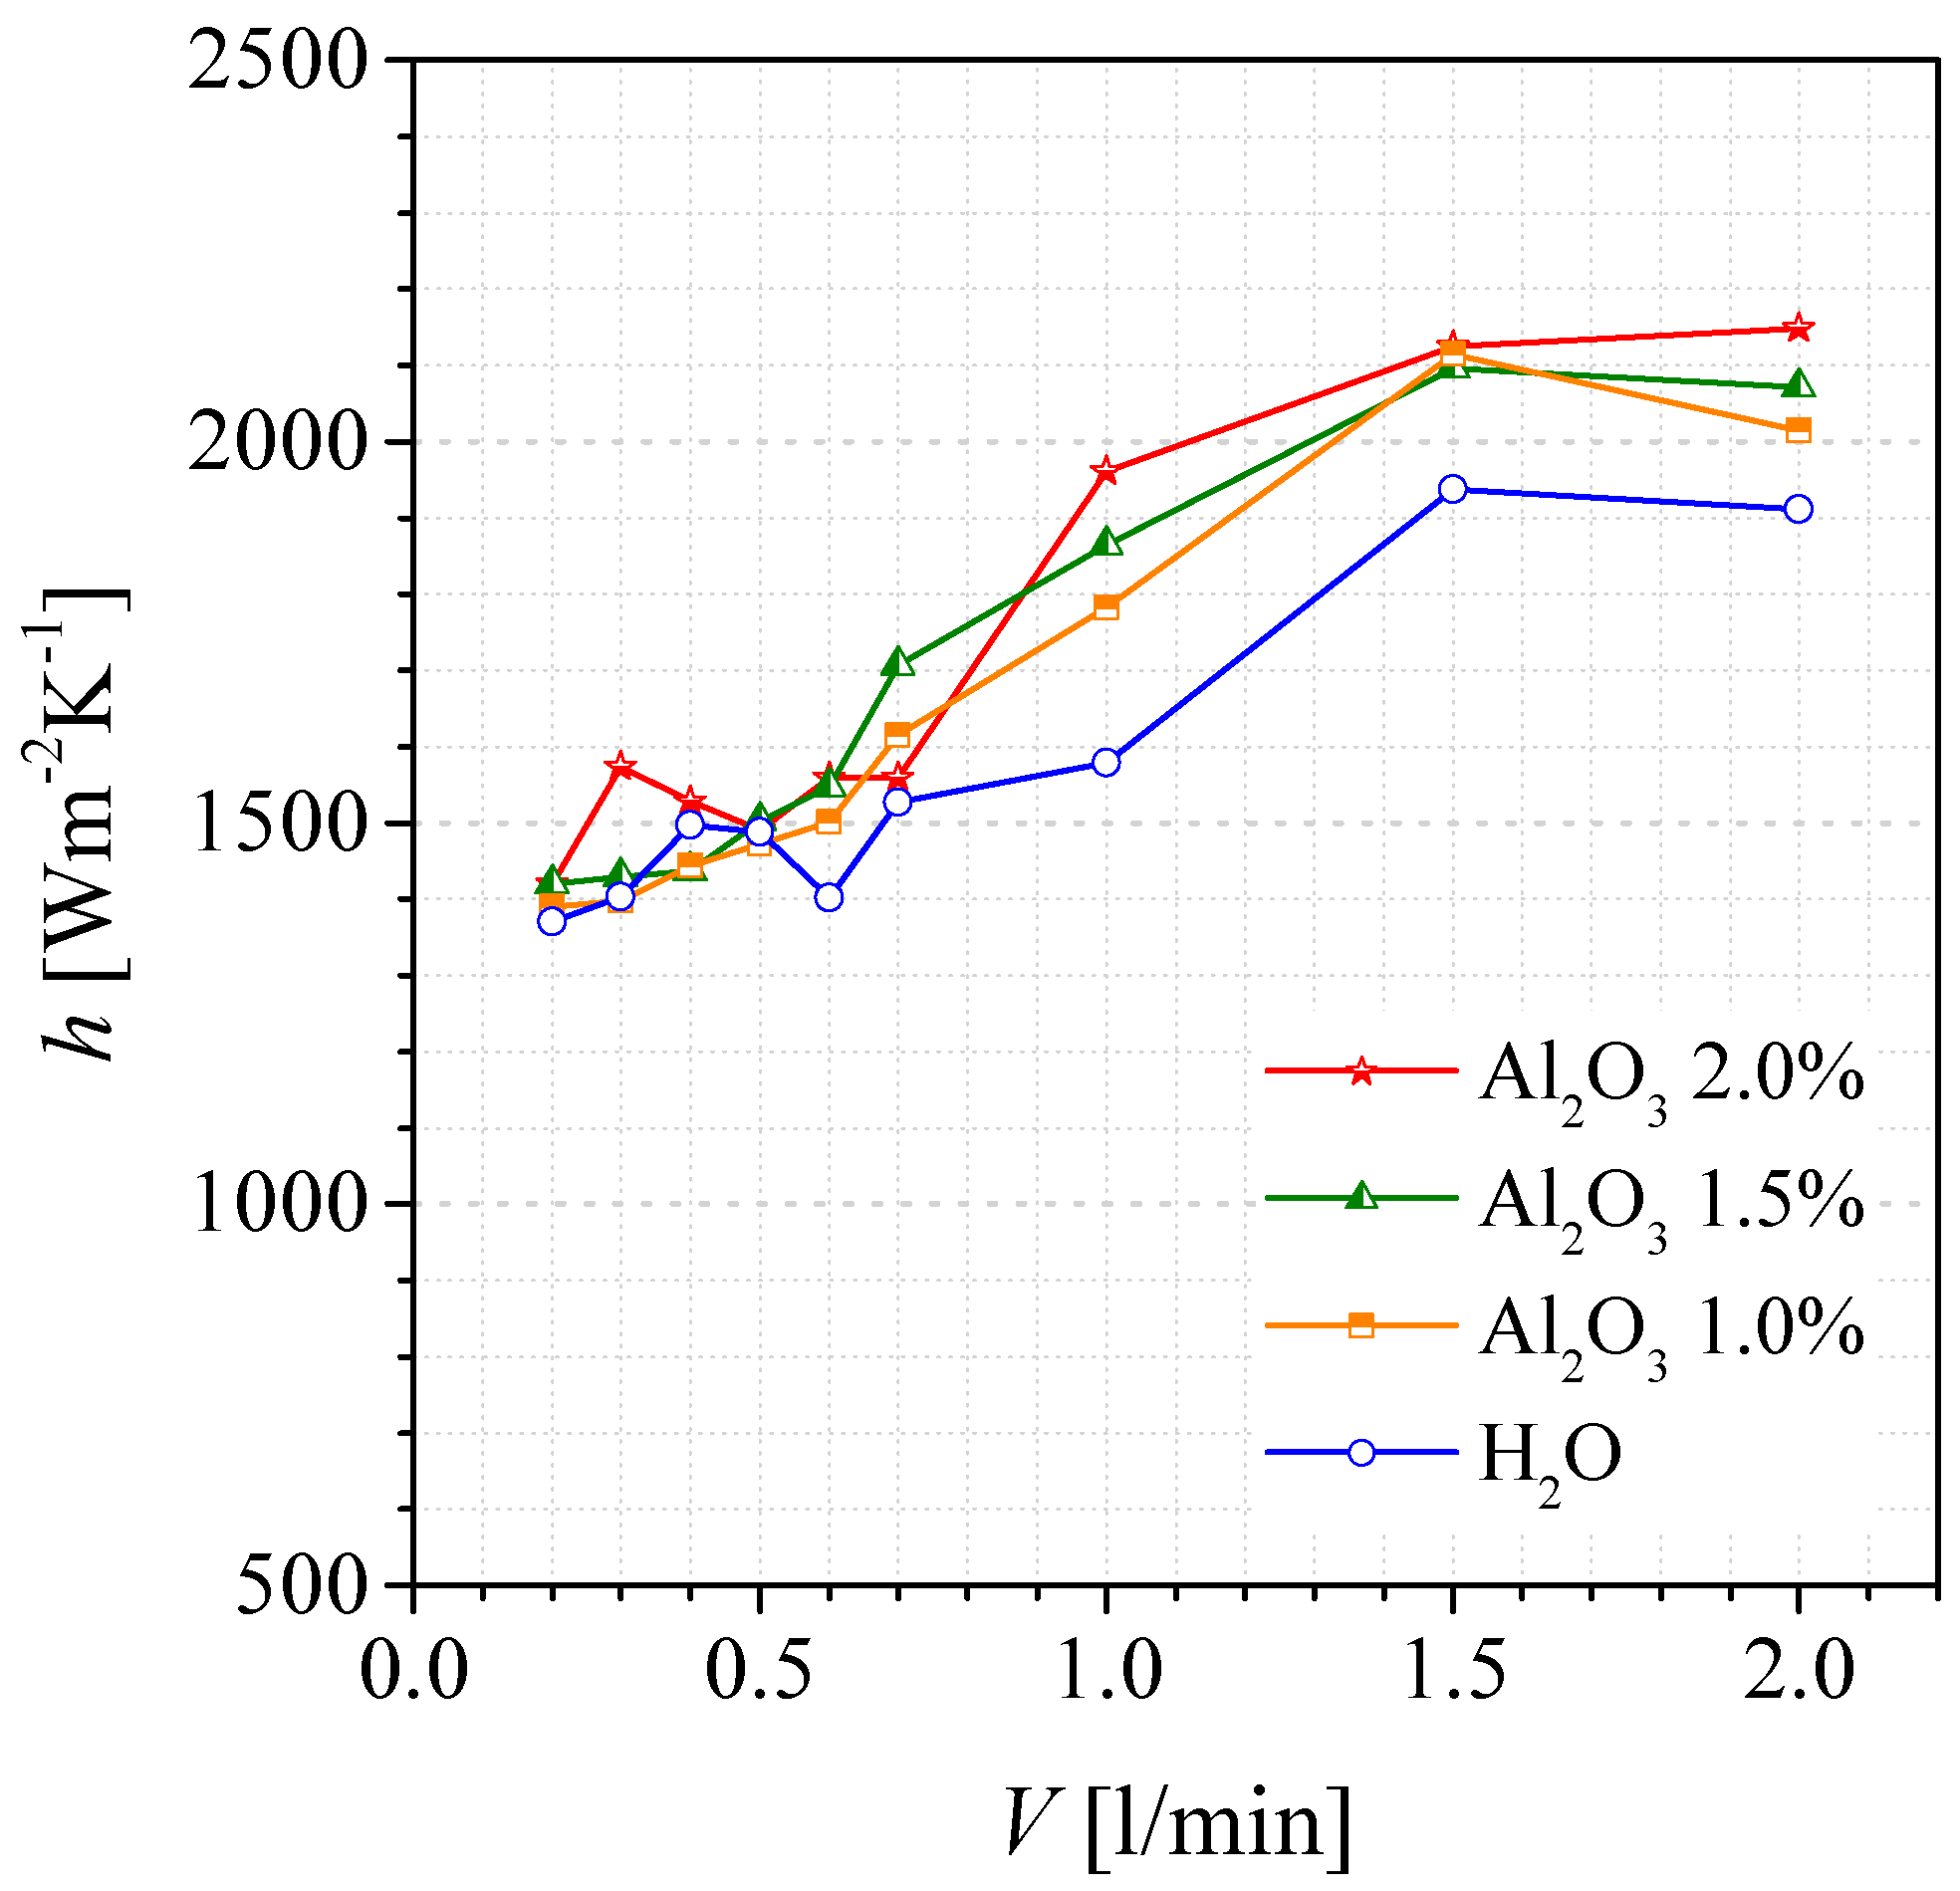
Figure 10 shows the mean convective heat transfer coefficient versus the volumetric flow rate at different volumetric fractions. The h coefficient for nanofluids is higher than that of water for flow rates greater than 0.6 L/min. For volumetric flows between 0.2 and 0.5 L/min the behavior is not unique and only the higher concentration seems to guarantee a better heat exchange than water alone.
If Figure 8 highlights the effectiveness of the nanofluid with respect to water, for each concentration and flow rate, Figure 10 introduces some doubts on the advisability of introducing nanofluids at lower flow rates in forced convection.
By making the evaluation of the thermal performance of the various fluids dimensionless, the Nusselt number is introduced as a function of the hydraulic diameter of the reticular duct as follows:
Nu D h - TC = h D h - TC k n f
with h mean convective coefficient, knf thermal conductivity of the fluid (nanofluid or water, calculated with Equation (4)) and Dh-TC = 1.51 mm the hydraulic diameter referred to test channel.
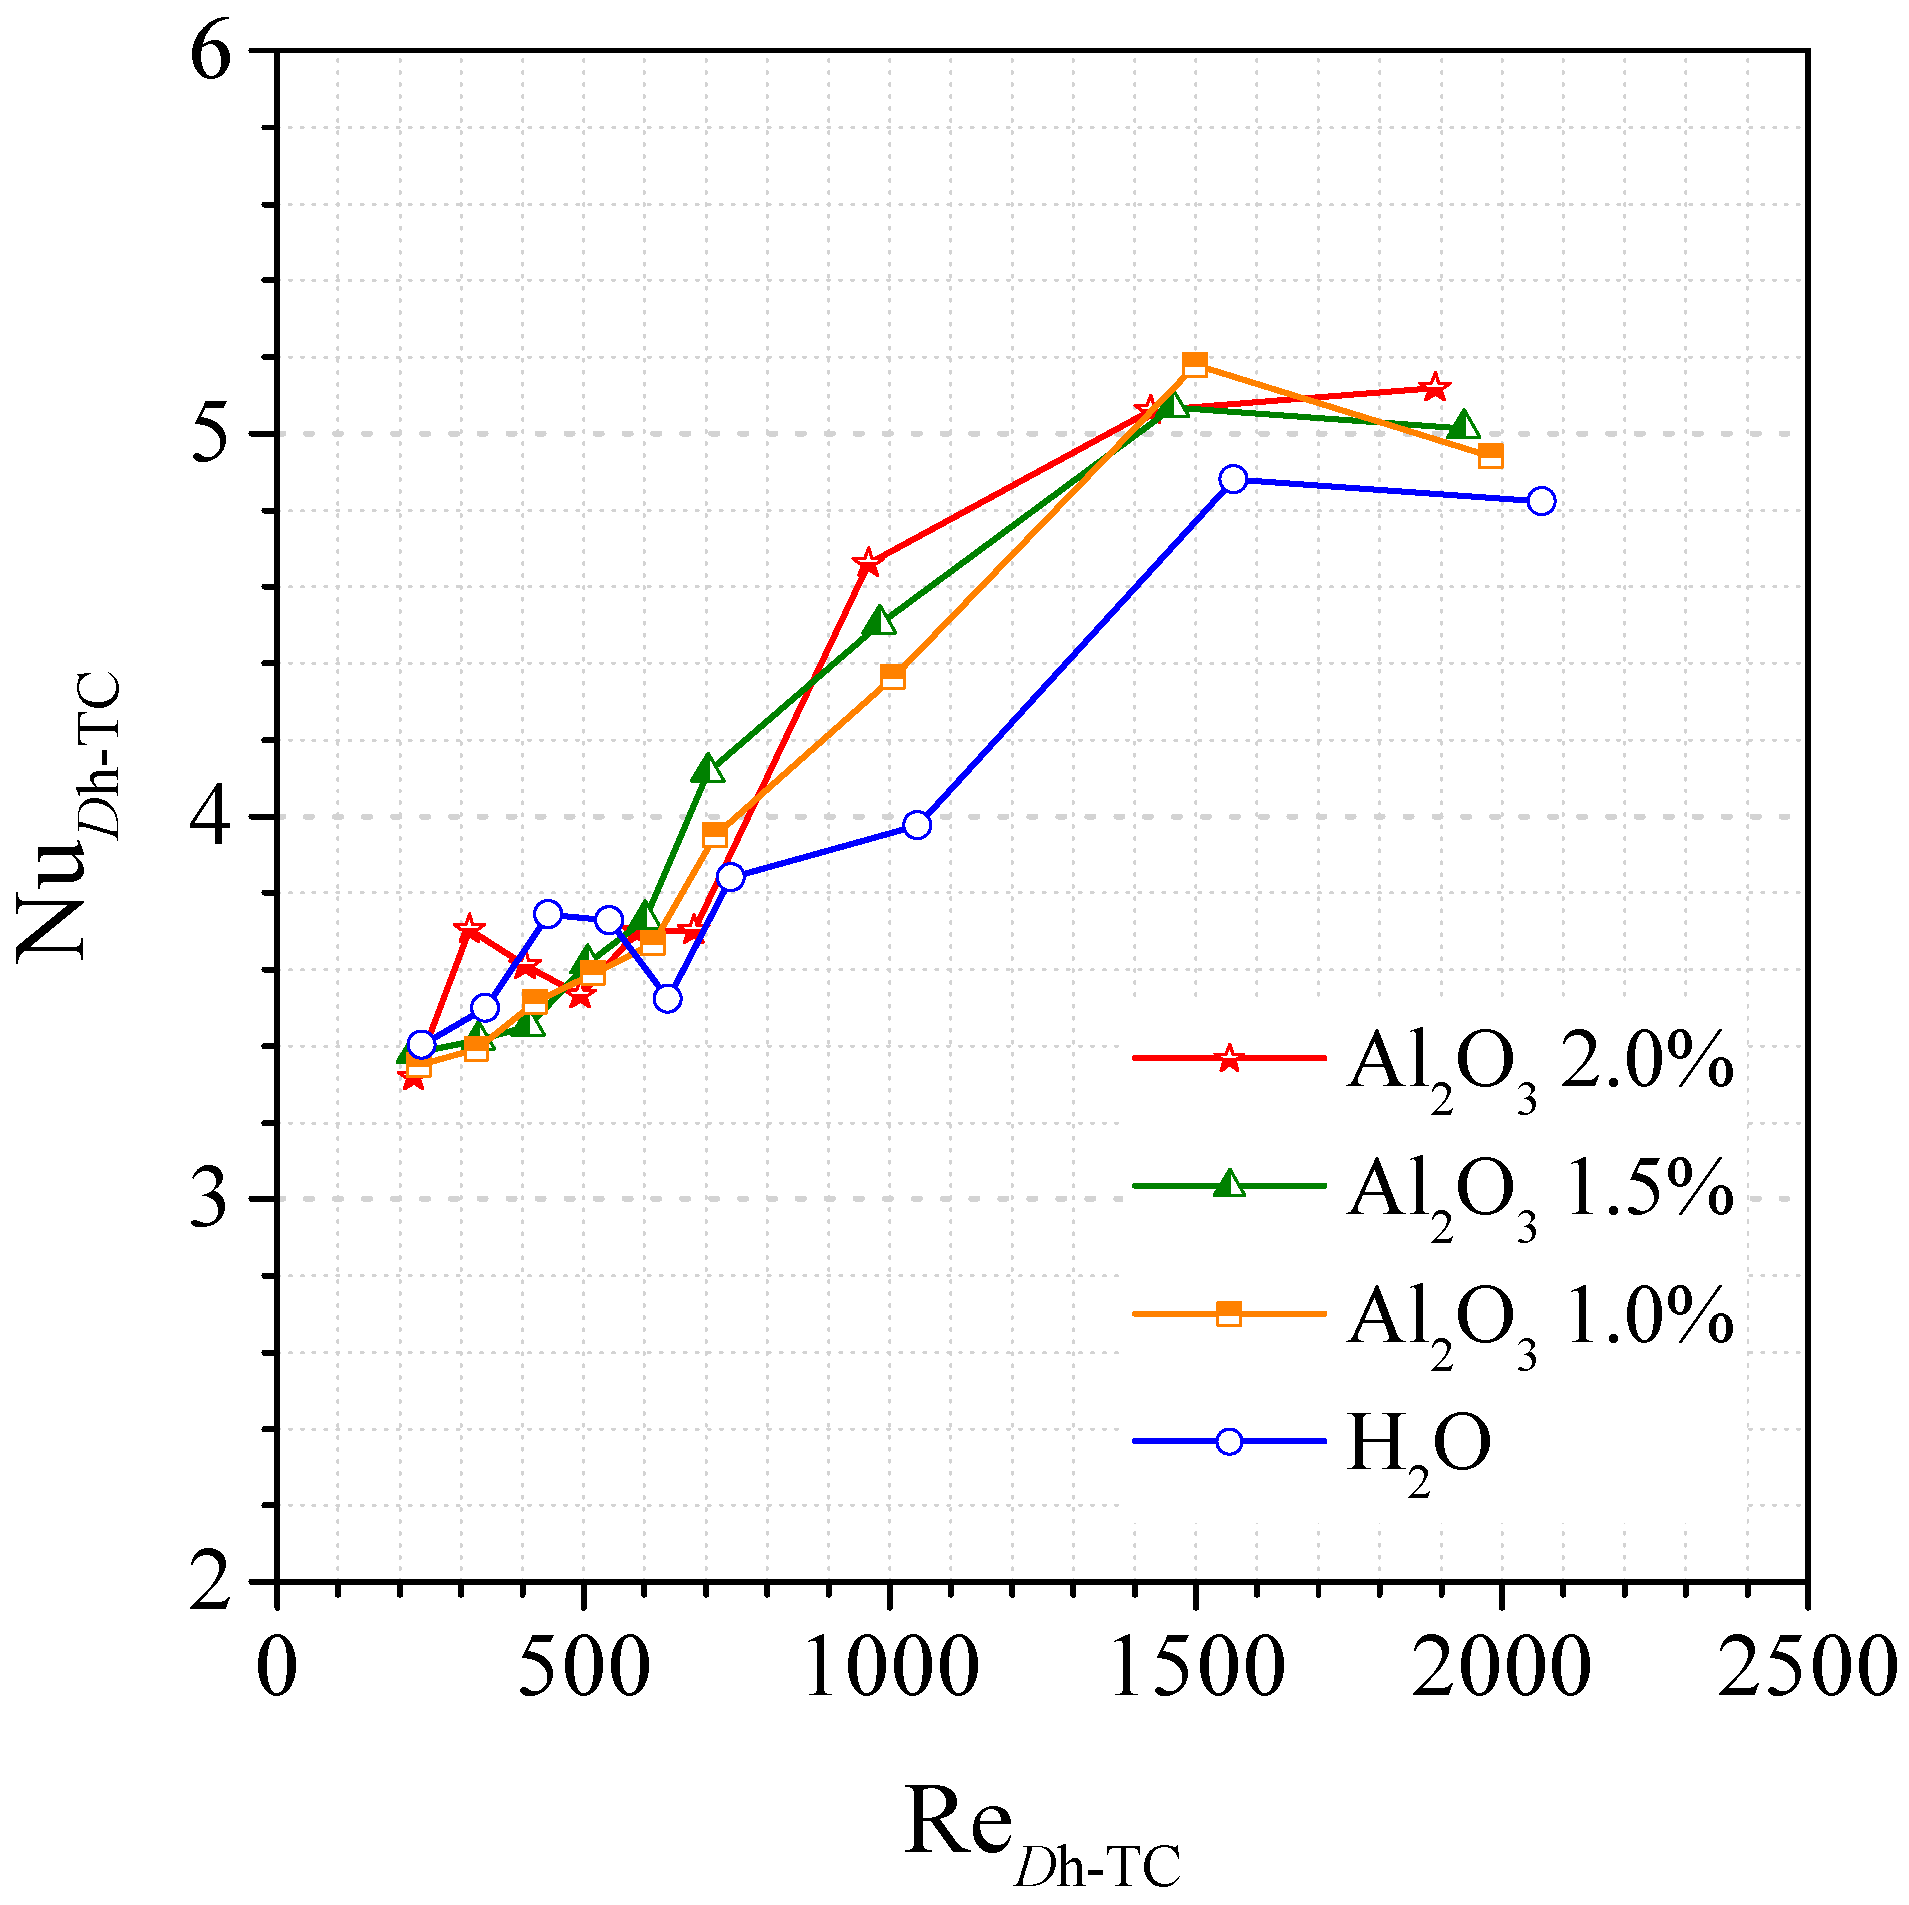
Figure 11 reports the mean Nusselt number versus the Reynolds number, thus calculated:
Re D h - TC = w T C D h - TC ν n f
where wTC is the mean fluid velocity in m/s, which varies in the range 0.14 m/s < wTC < 1.37 m/s for 0.2 L/min < V < 2 L/min, υnf is the kinematic viscosity in m2/s (Equation (7)).
The trends in Figure 11 confirm the results of Figure 10, highlighting more the effectiveness of the nanofluid for Reynolds numbers higher than 600, with a peak of the Nusselt number equal to about 5 around Re = 1500.
For flow rates lower than Reynolds equal to 500, the values of the Nusselt number do not seem to fully justify the use of the nanofluid, being the convective exchange in some cases lower than that of water alone. In any case, further measures are needed to evaluate this aspect.
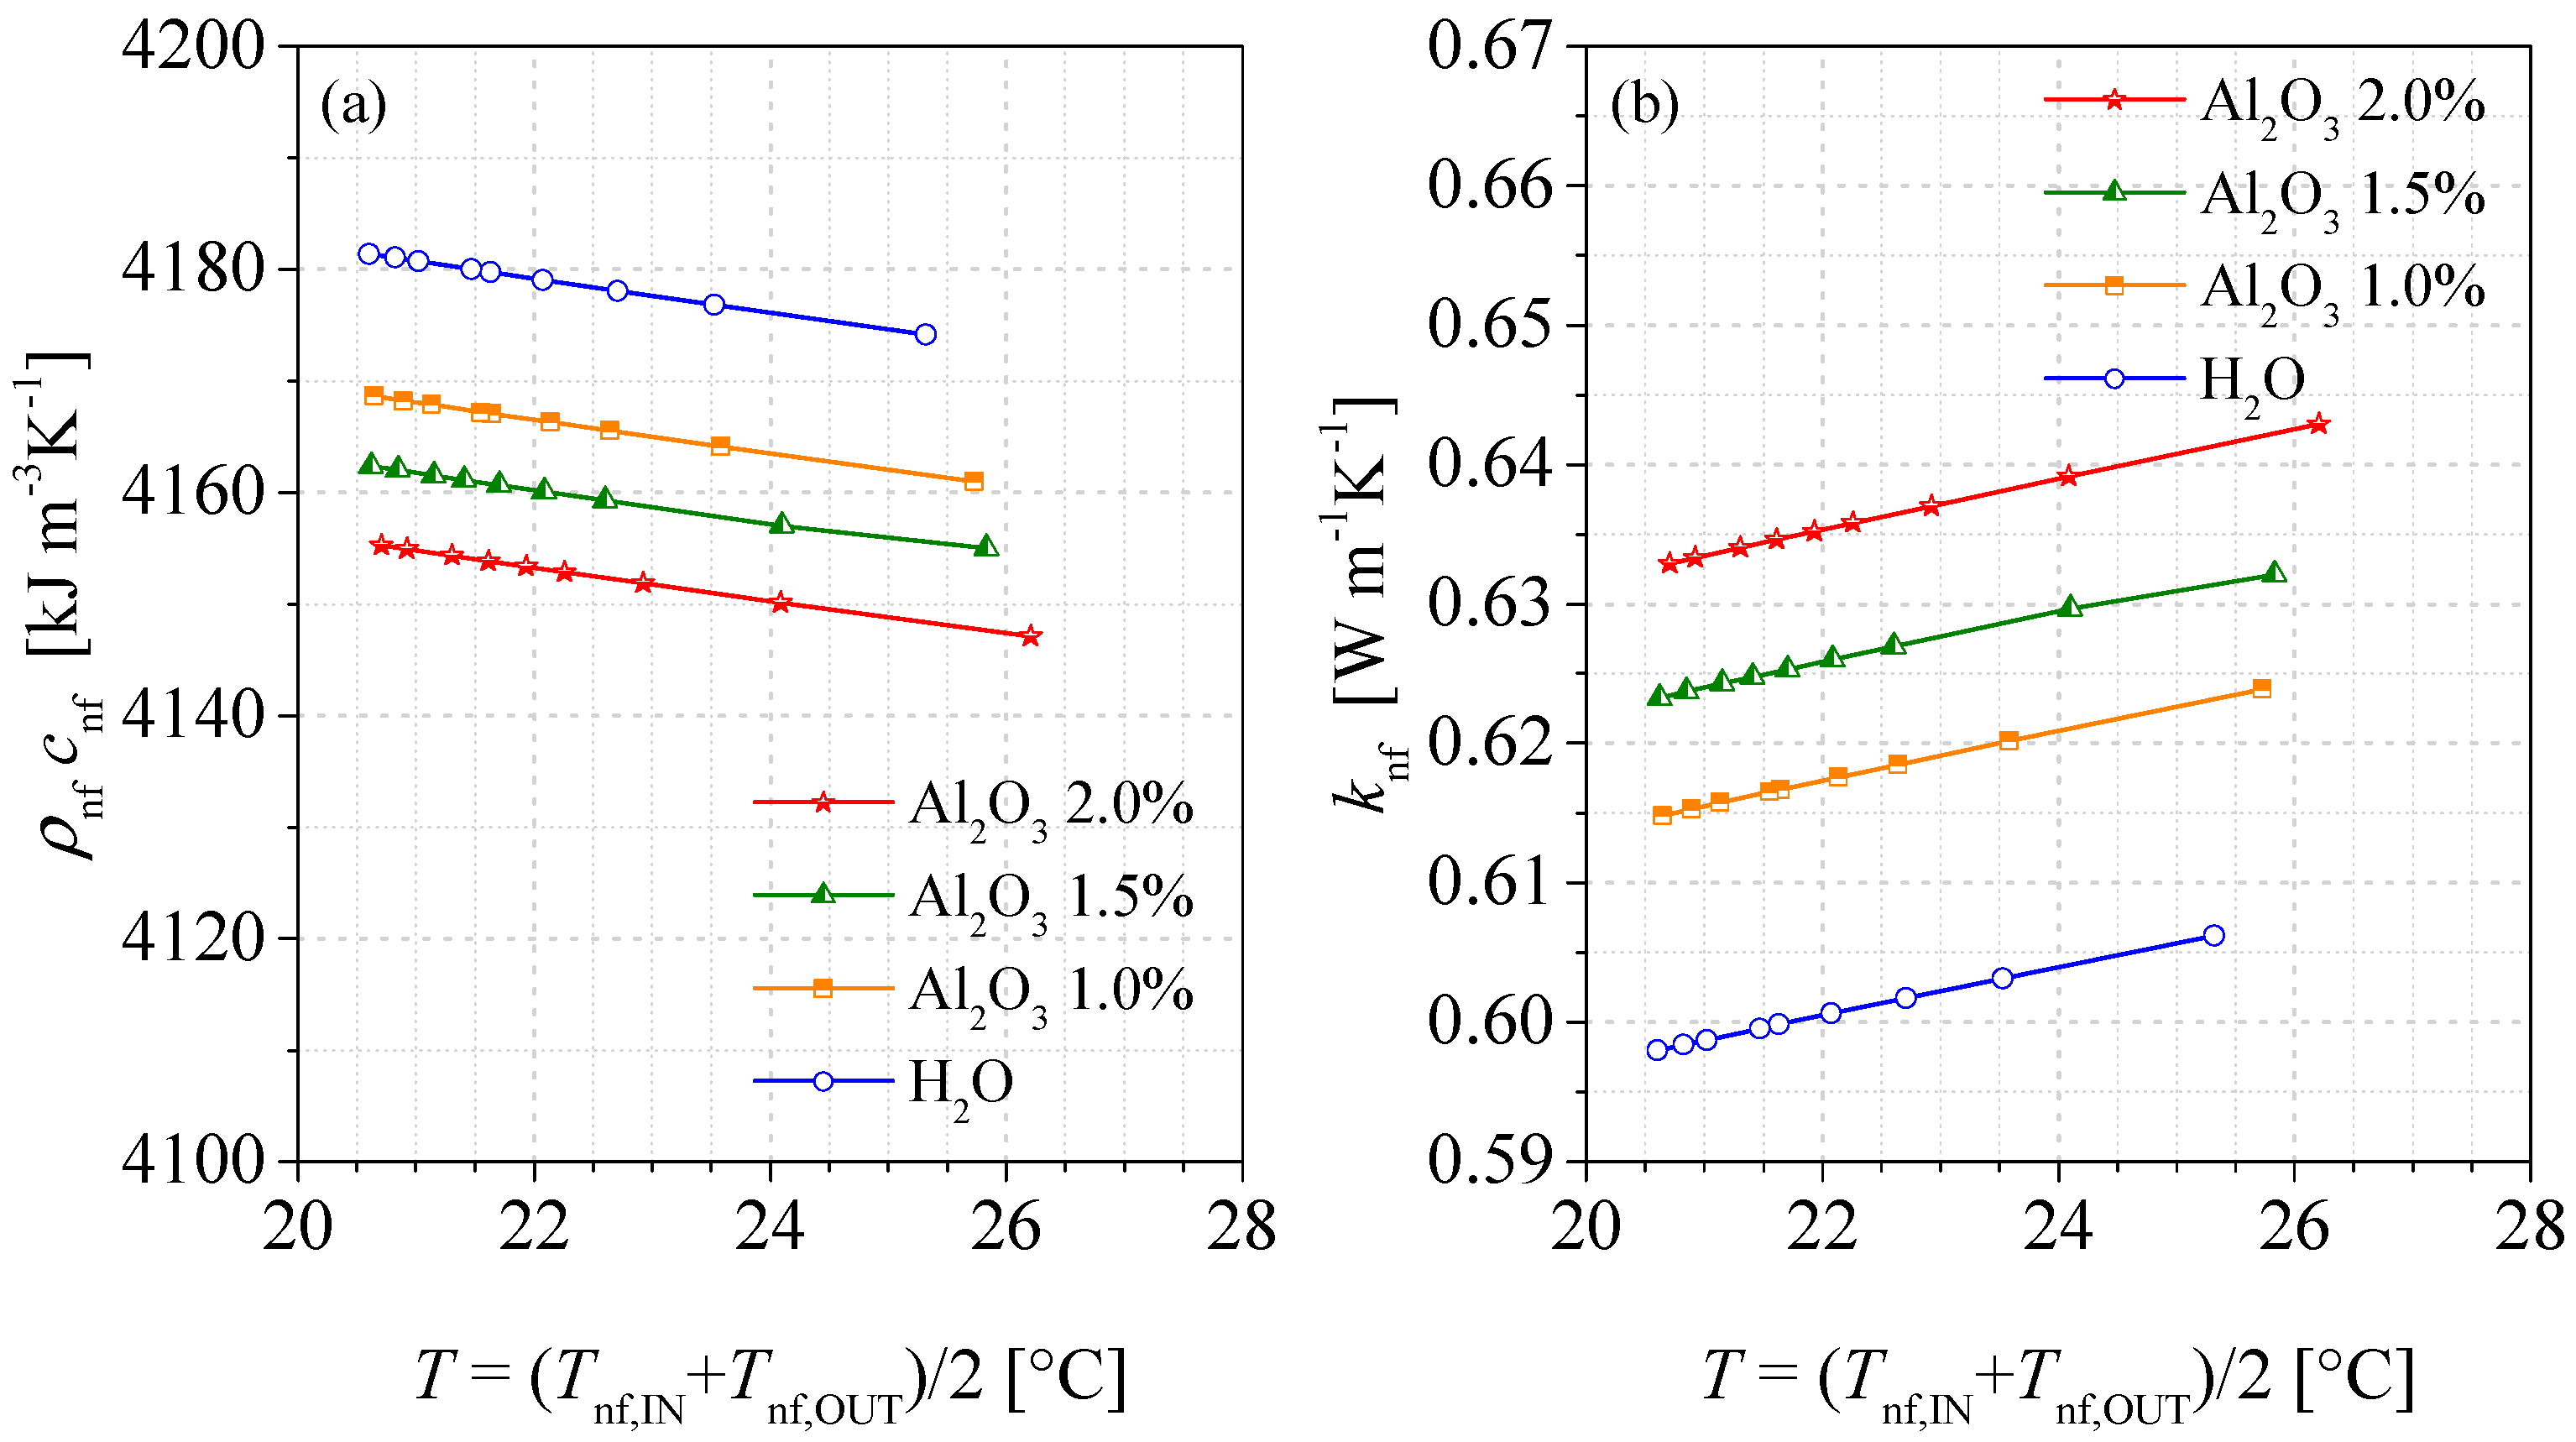
To explain this behavior, Figure 12 and Figure 13 are proposed, in which some thermophysical properties of the fluids are reported.
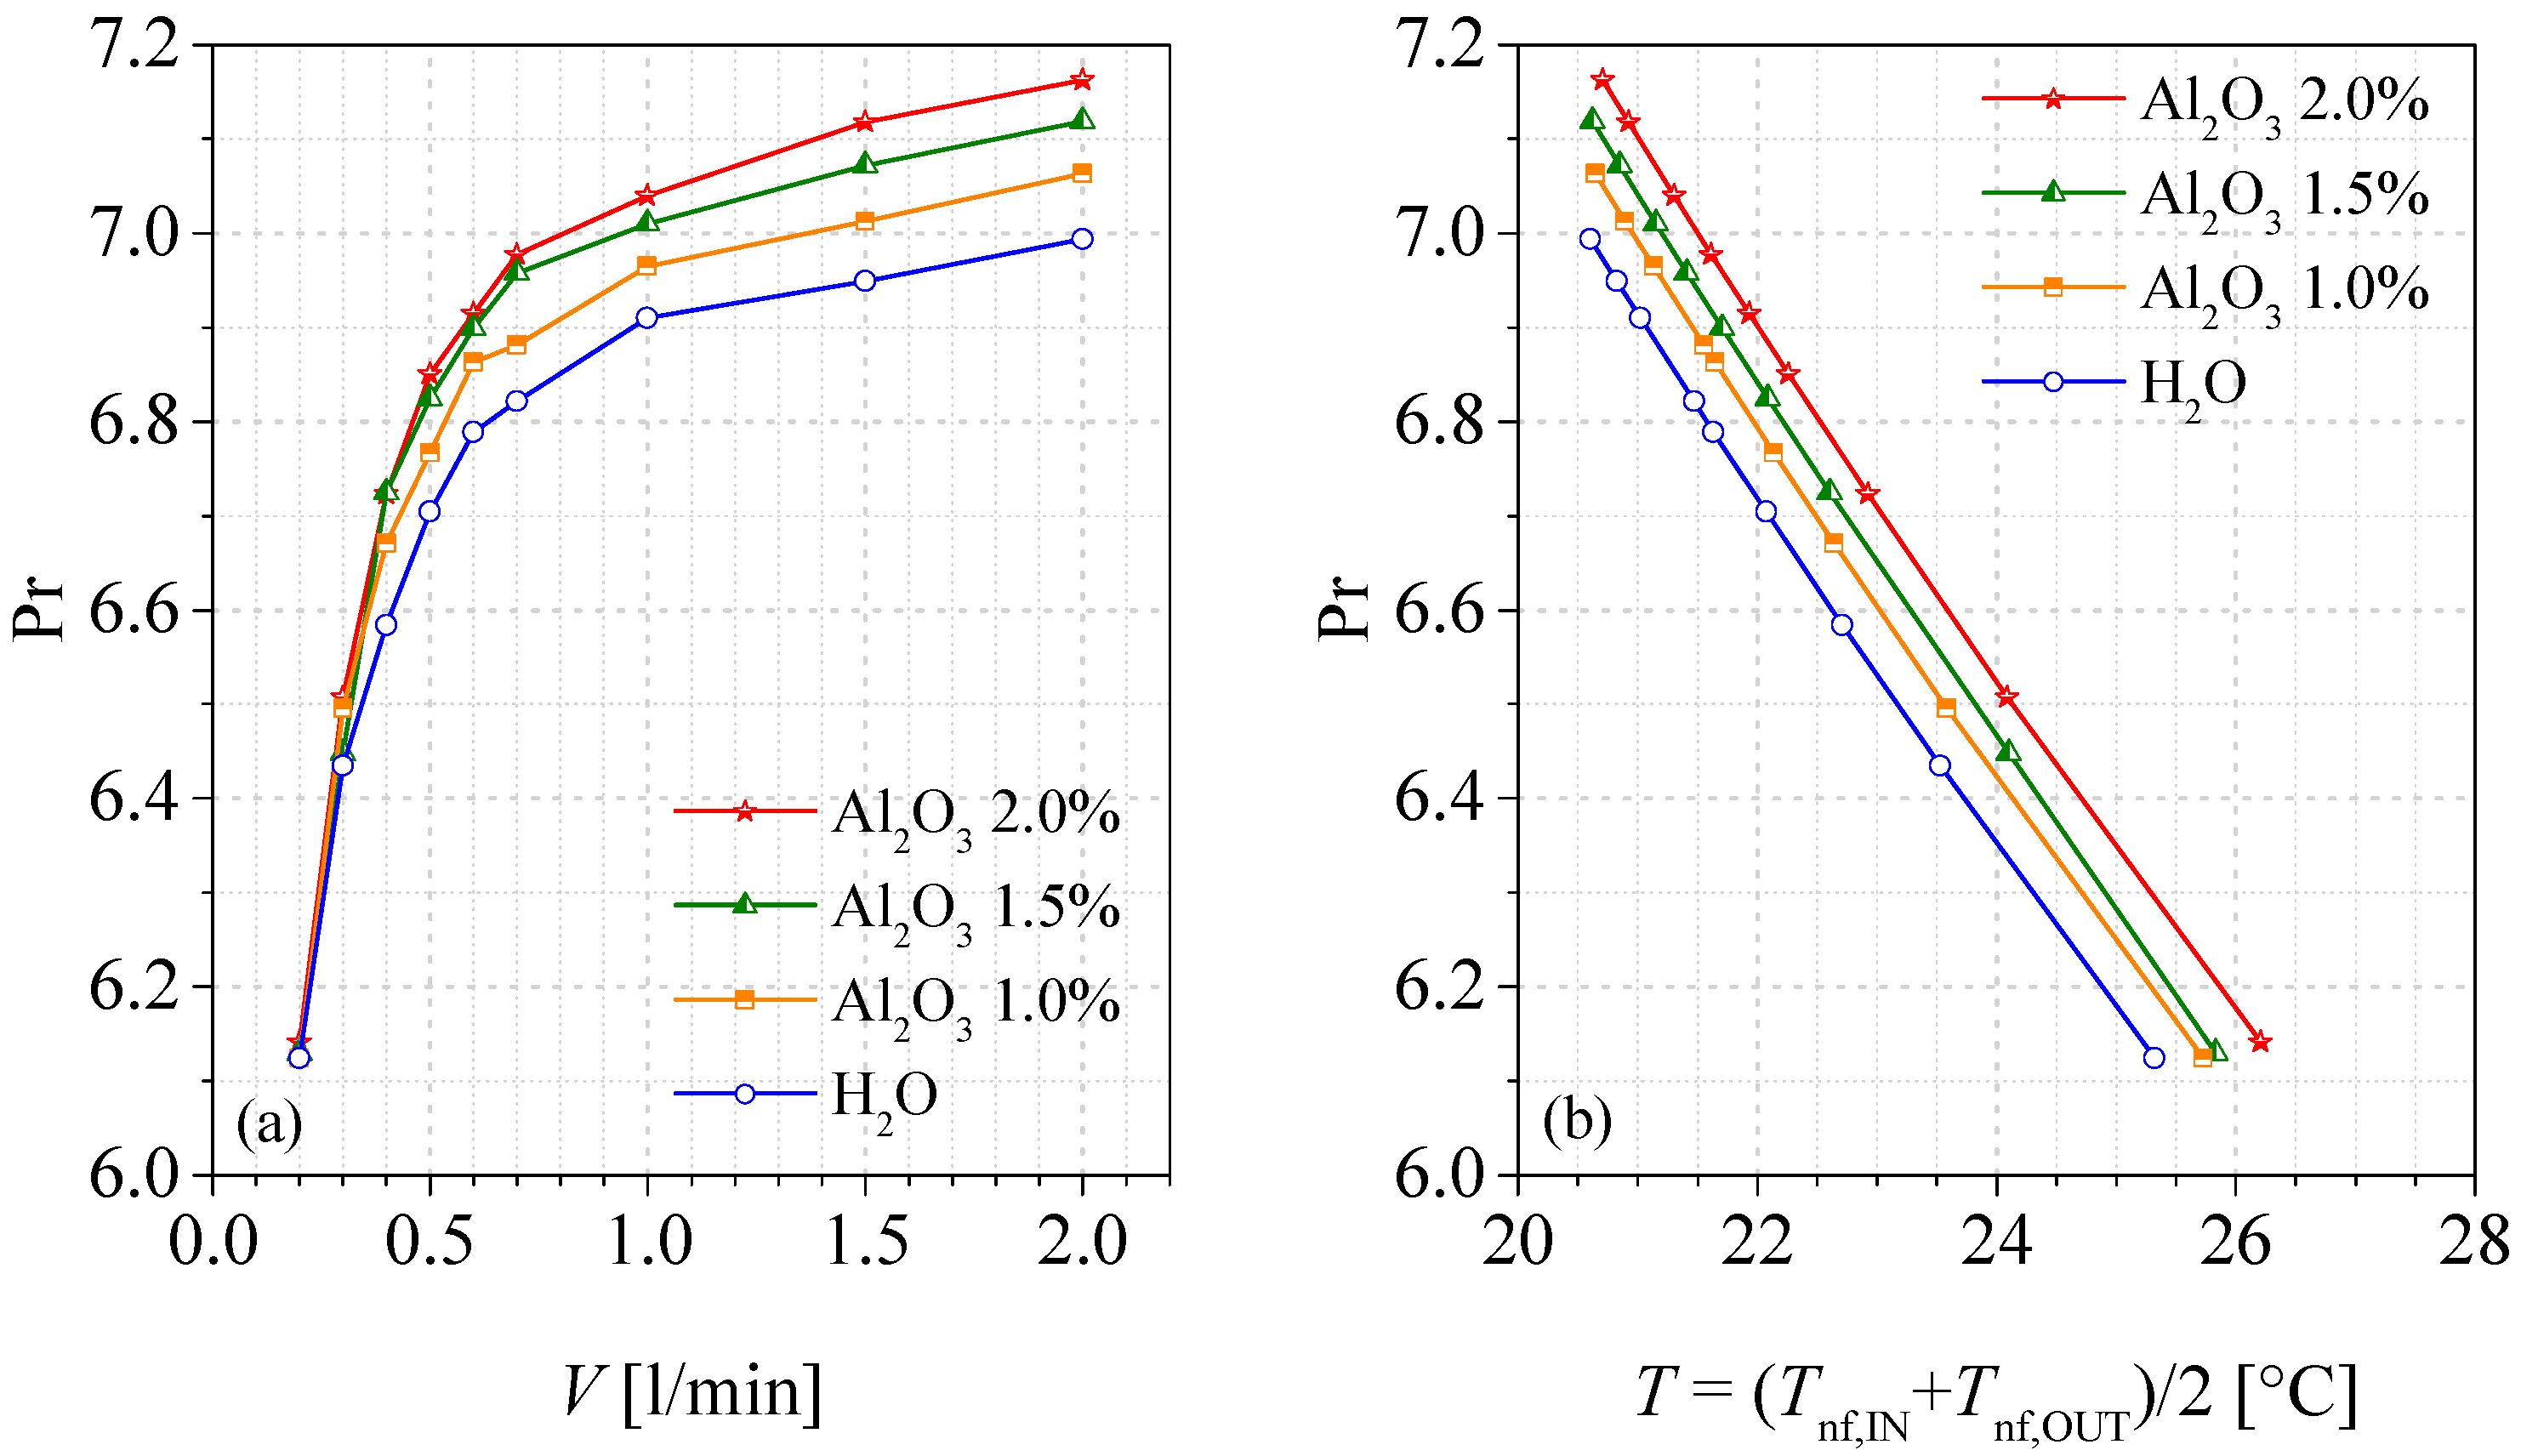
Figure 12 shows the trend of the thermal capacity (a) and of the thermal conductivity (b) as the average flow temperature varies, while Figure 13 reports the Prandtl number as function of both volumetric flow rate (a) and average temperature (b).
The representation with respect to the flow rate implies the dependence on the temperature because as the mass flow rate in the duct increases, at the quasi-constant inlet temperature T nf ,   IN , the outlet temperature T nf ,   OUT decreases and with it the average temperature of the nanofluid inside the duct. The thermophysical properties were calculated at this average temperature.
The representation as a function of the volumetric flow facilitates the comparison between the various nanofluid concentrations, but, for completeness, Table 2 and Table 3 show respectively the inlet and outlet temperatures of the cooling fluid: the lower average temperature corresponds to the higher flow rate and vice versa.
The average temperature ( T nf ,   IN + T nf ,   OUT ) / 2 varies between about 26 °C and 20 °C and for higher flow rates there is a sort of saturation effect, i.e., for flow rates greater than 1 L/min, the T n f , O U T temperatures are very close to each other, and significant percentage variations are not appreciated.
From Figure 12, the heat capacity is greater for water because, although the density of the nanofluid increases as the concentration increases, its specific heat decreases with respect to that of water. Conversely, the conductivity of nanofluids is clearly higher than water alone due to the presence of the alumina particles.
These opposing behaviors influence the heat exchange, favored, with the same volumetric flow rate, both by the high specific heat and by the greater conductivity of the fluid.
Therefore, to help explain the trends in Figure 11, the Prandtl number is shown in Figure 13. The figure shows that for low flow rates the Prandtl values are very close to each other as the concentration changes; thus, the Nusselt numbers are very close to each other. At higher volumetric flow rates, however, the difference is more evident, in favor of nanofluids. Hence, a higher Prandtl number seems to explain, in part, the higher Nusselt.
In any case, since this is preliminary work, further comments are deferred to subsequent insights supported by new measurements.
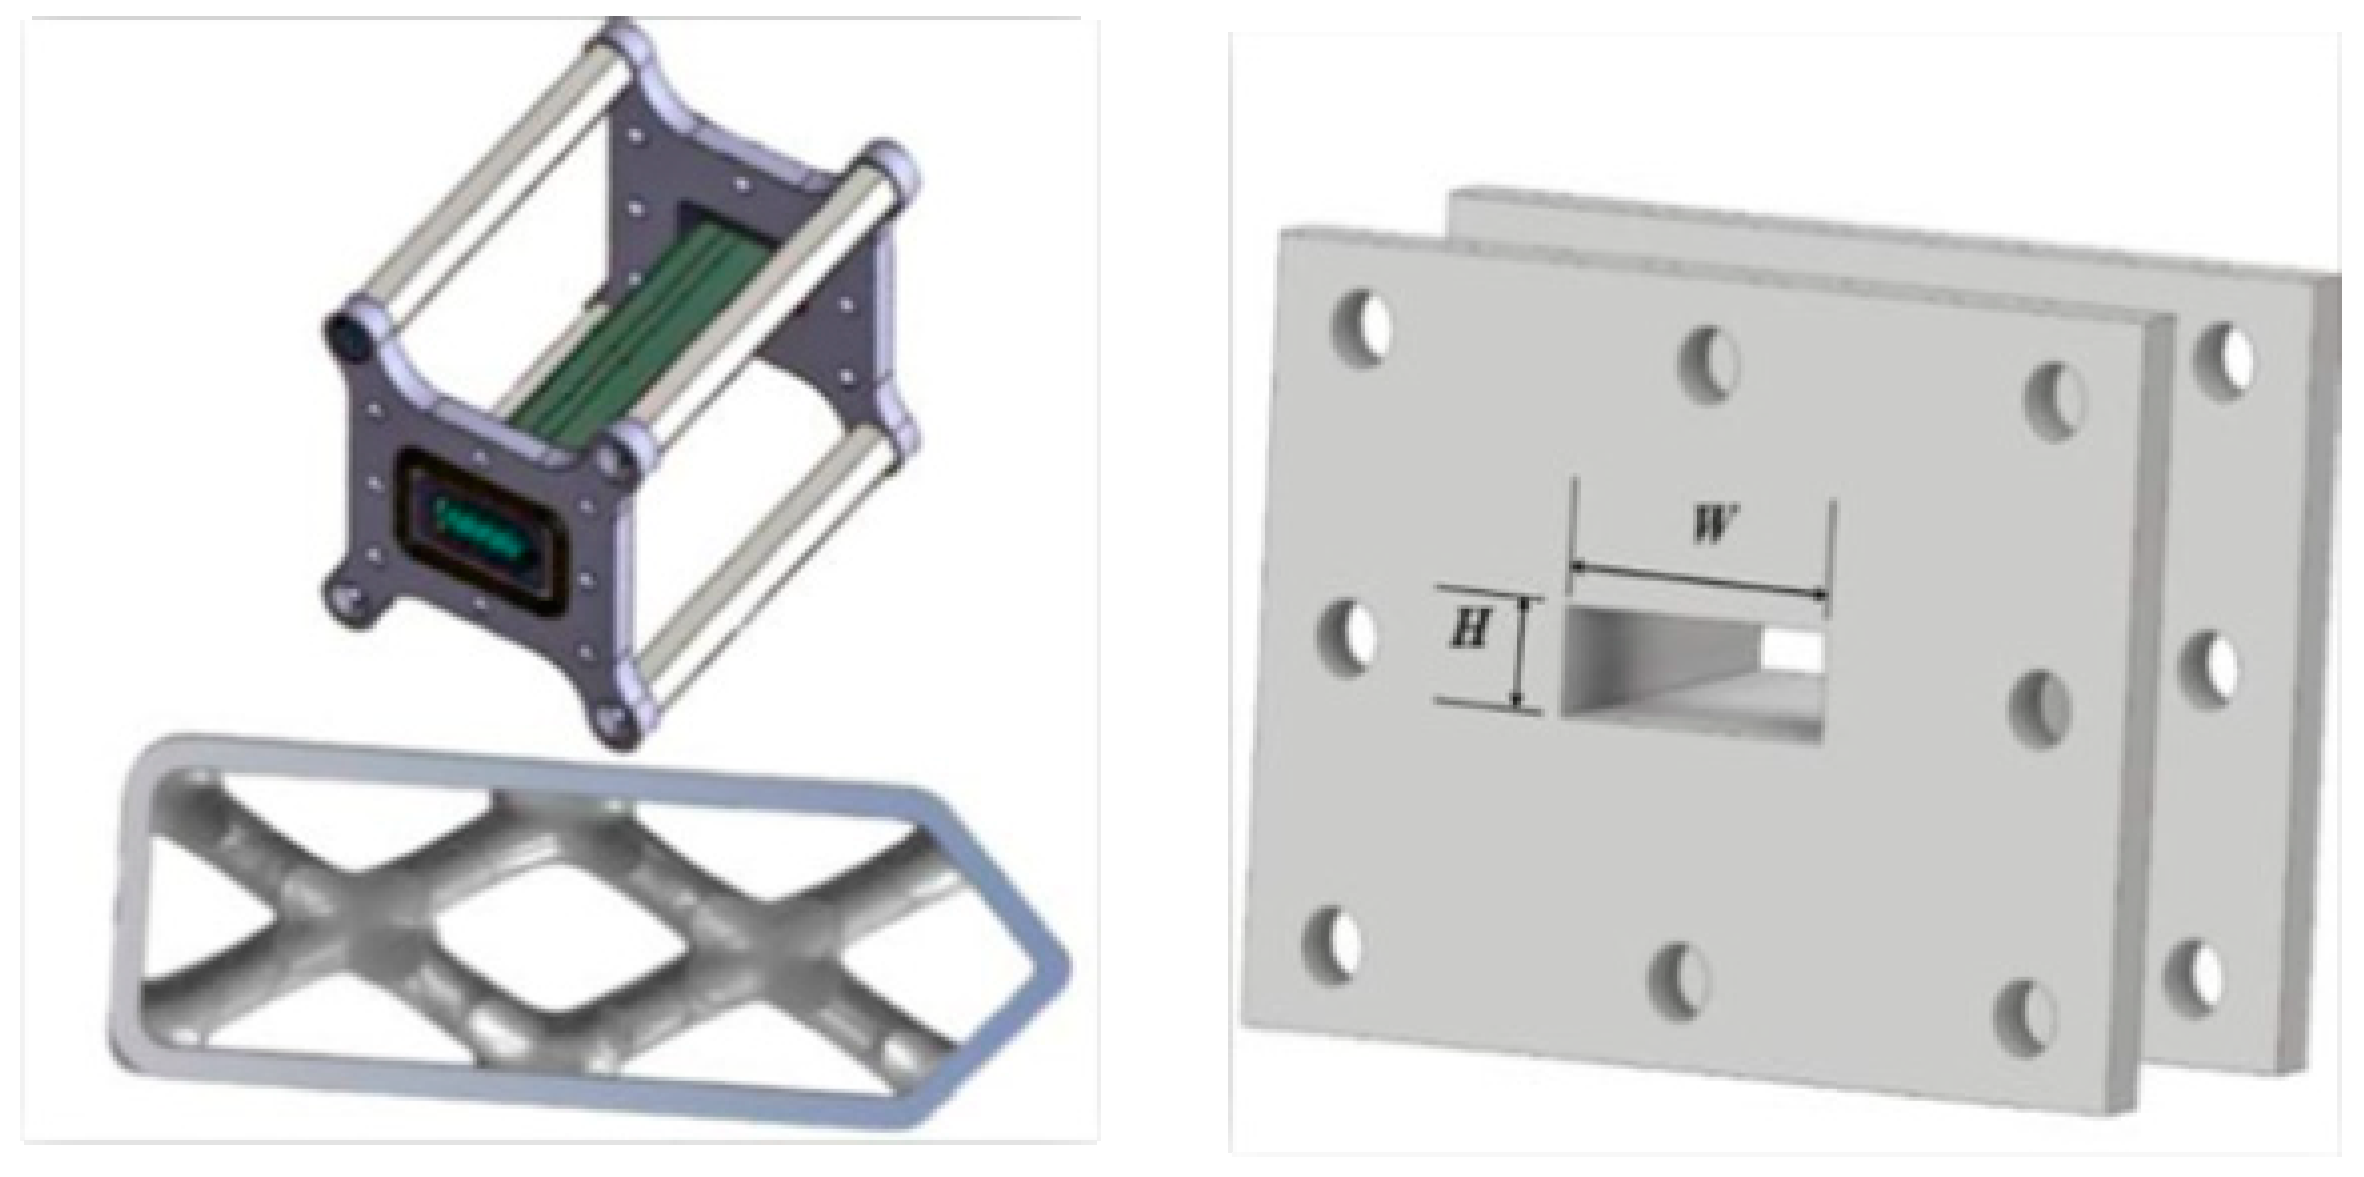
Finally, a comparison with the scientific literature is proposed to evaluate the thermal performance of the reticular duct compared to the smooth duct, without any reticular structure, with dimensions H × W, the same as the supply duct (SD) or Pre-Test duct reported in Figure 14.
To allow a homogeneous comparison, a new characteristic length, both for the Reynolds number and for the Nusselt number, has been introduced, choosing the hydraulic diameter of the rectangular duct.
The hydraulic diameter is defined as:
D h - SD = 4 H W 2 ( H + W ) = 7.5 mm
The Reynolds number is:
Re D h - SD = w F C D h - SD ν n f
where wFC is the fluid velocity in the feed channel in m/s, which varies in the range 0.04 m/s < wTC < 0.44 m/s for 0.2 L/min < V < 2 L/min
Therefore, the Nusselt number has been defined as:
Nu D h _ SD = h D h _ SD k n f
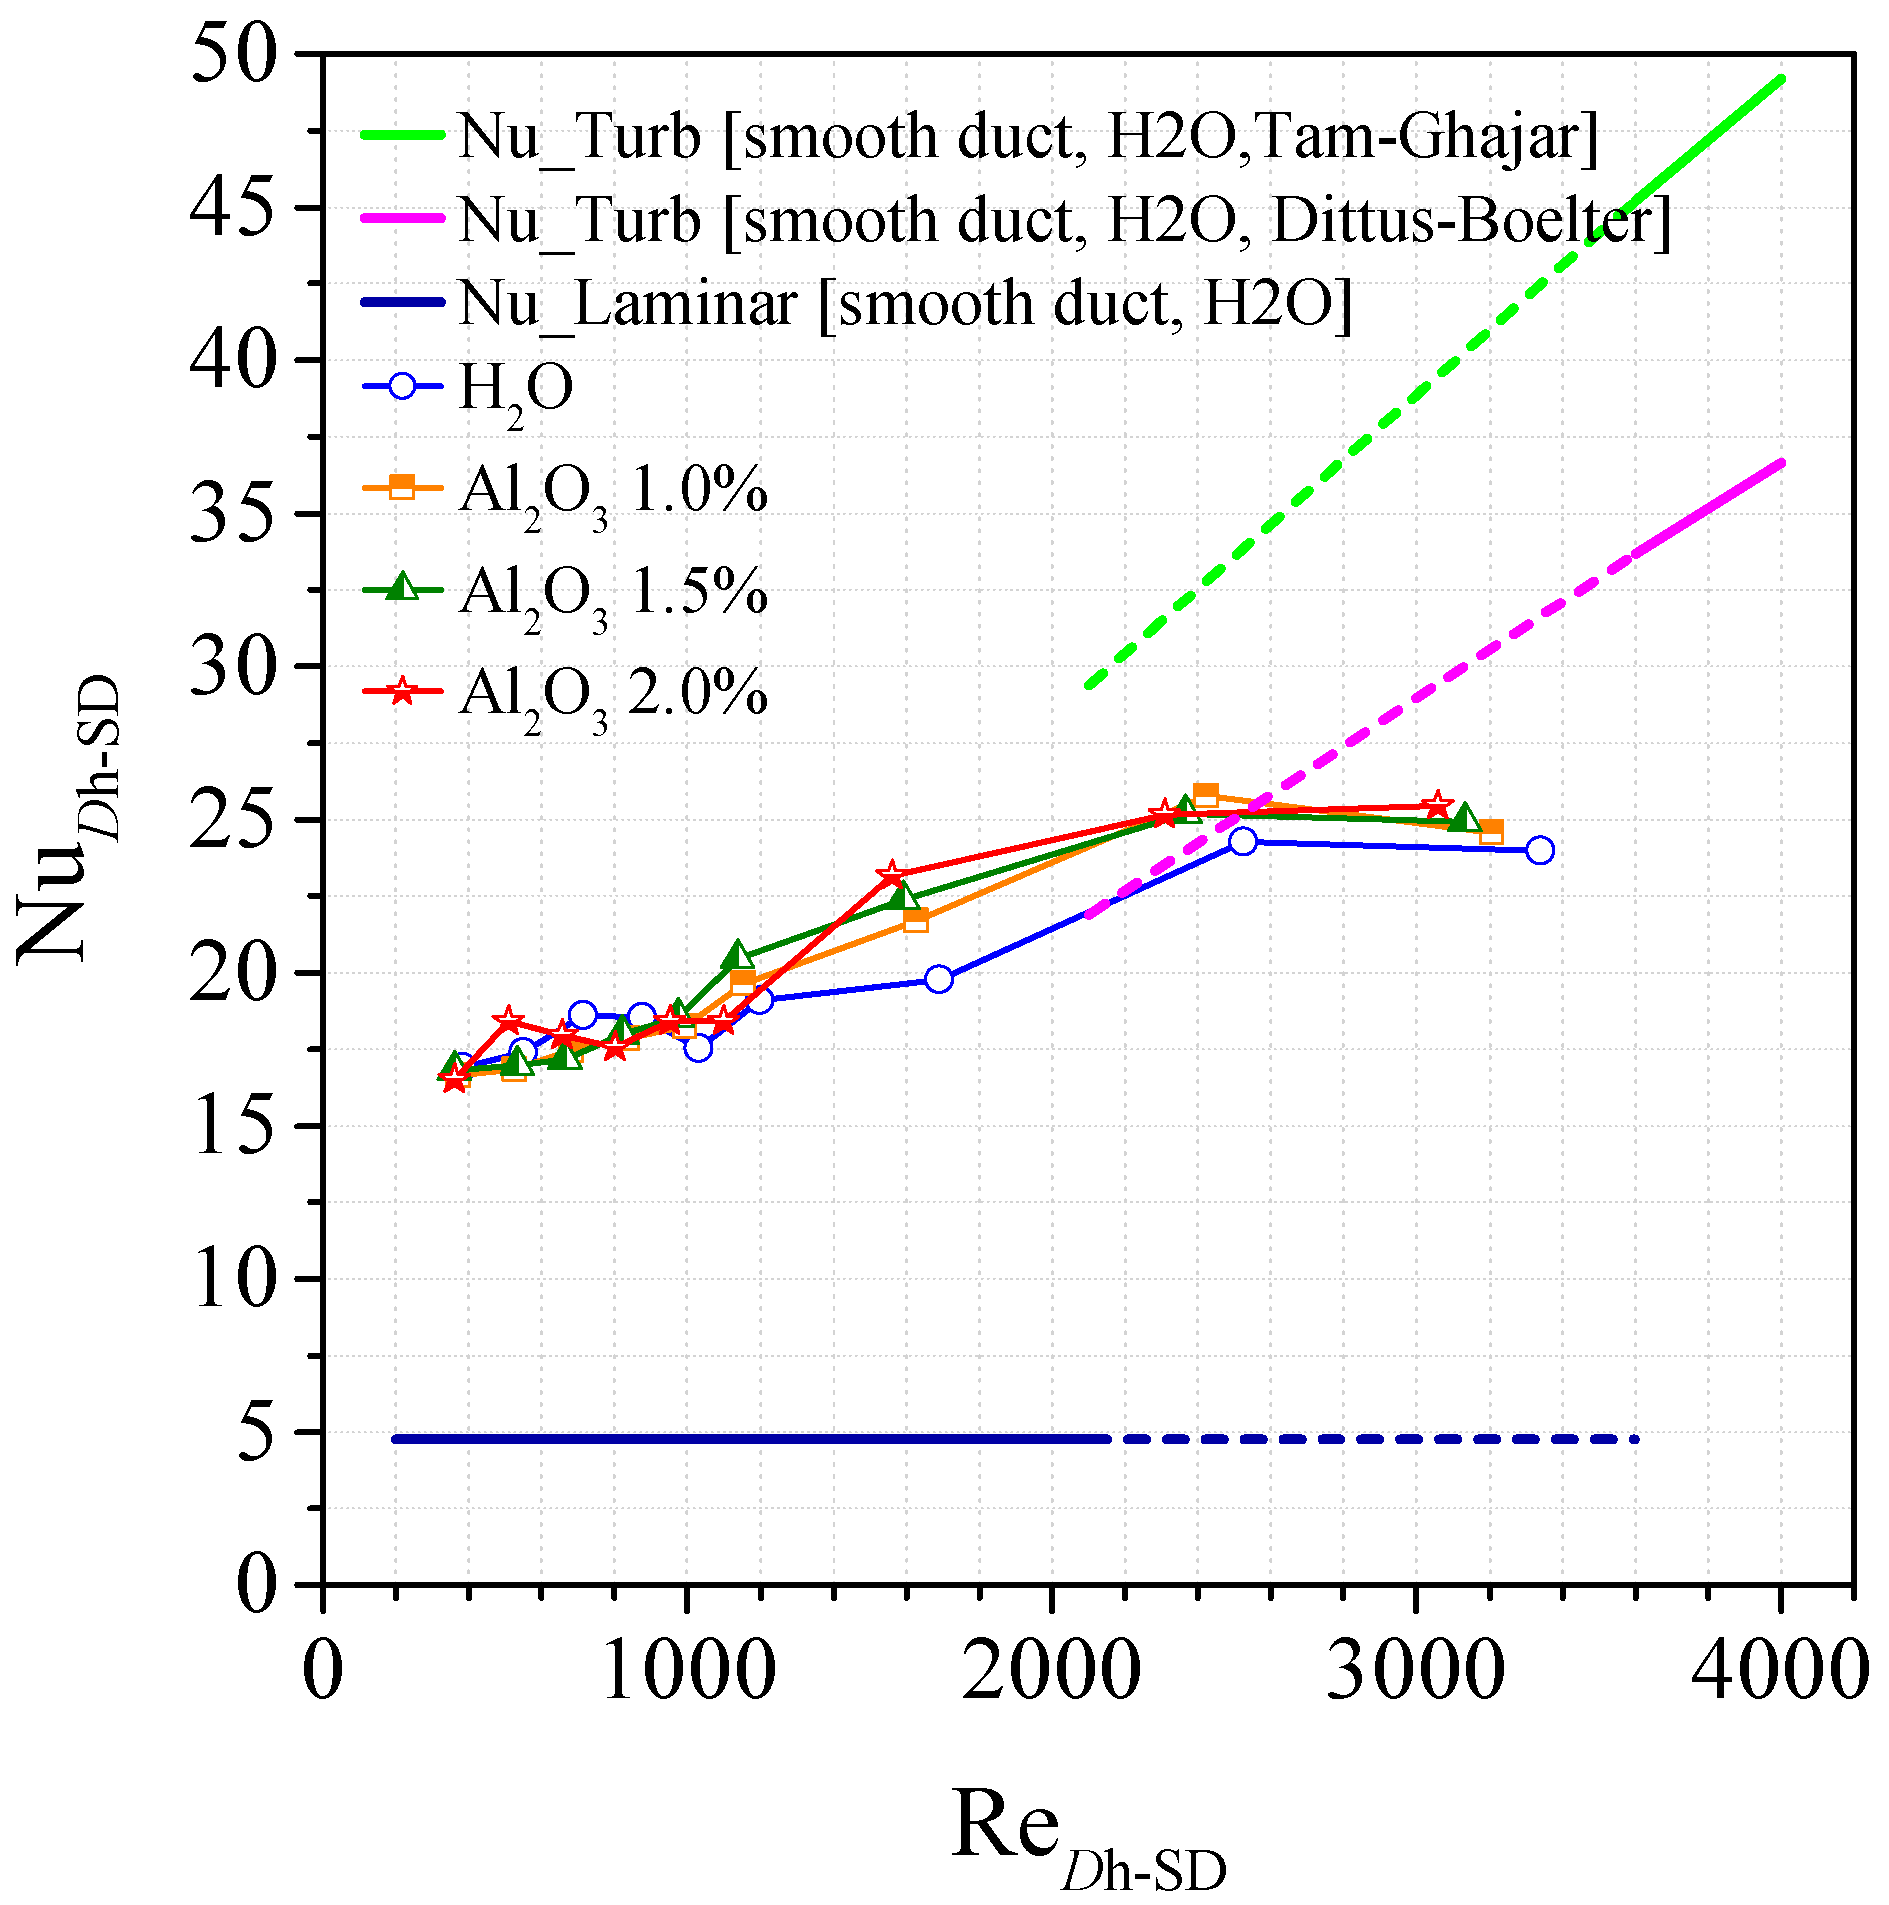
Figure 15 compares the average Nusselt numbers measured in this work with some empirical correlations for laminar (Re < 2100) and turbulent flows (Re > 2100). For laminar flow, the Nusselt number is equal to 4.79 for a ratio W/H = 3 [31], while for turbulent flow, two empirical correlations are reported:
Nu D h _ SD = 0.036 Re D h _ SD 0.8 Pr 0.386 ( L D h _ SD ) 0.054
Nu D h _ SD = 0.023 Re D h _ SD 0.8 Pr 0.4
The Dittus–Bolter correlation [32], presented in Equation (20), is valid for a fully hydrodynamically developed flow condition, while the Tam–Ghajar [33] relation, proposed in Equation (21), is for a conjugate problem.
Figure 15 highlights the convenience of the lattice channel with respect to the smooth duct in the laminar regime, being the mean Nusselt number from three to five times higher. On the contrary, in the turbulent regime, defined with respect to the smooth duct, the lattice channel performs worse than the free duct.

4.2. Pressure Drops Measurements

The pressure drops measurements were carried out by a differential transducer, and Figure 6 shows the position of the static pressure holes, placed in the pre- and post-test ducts.
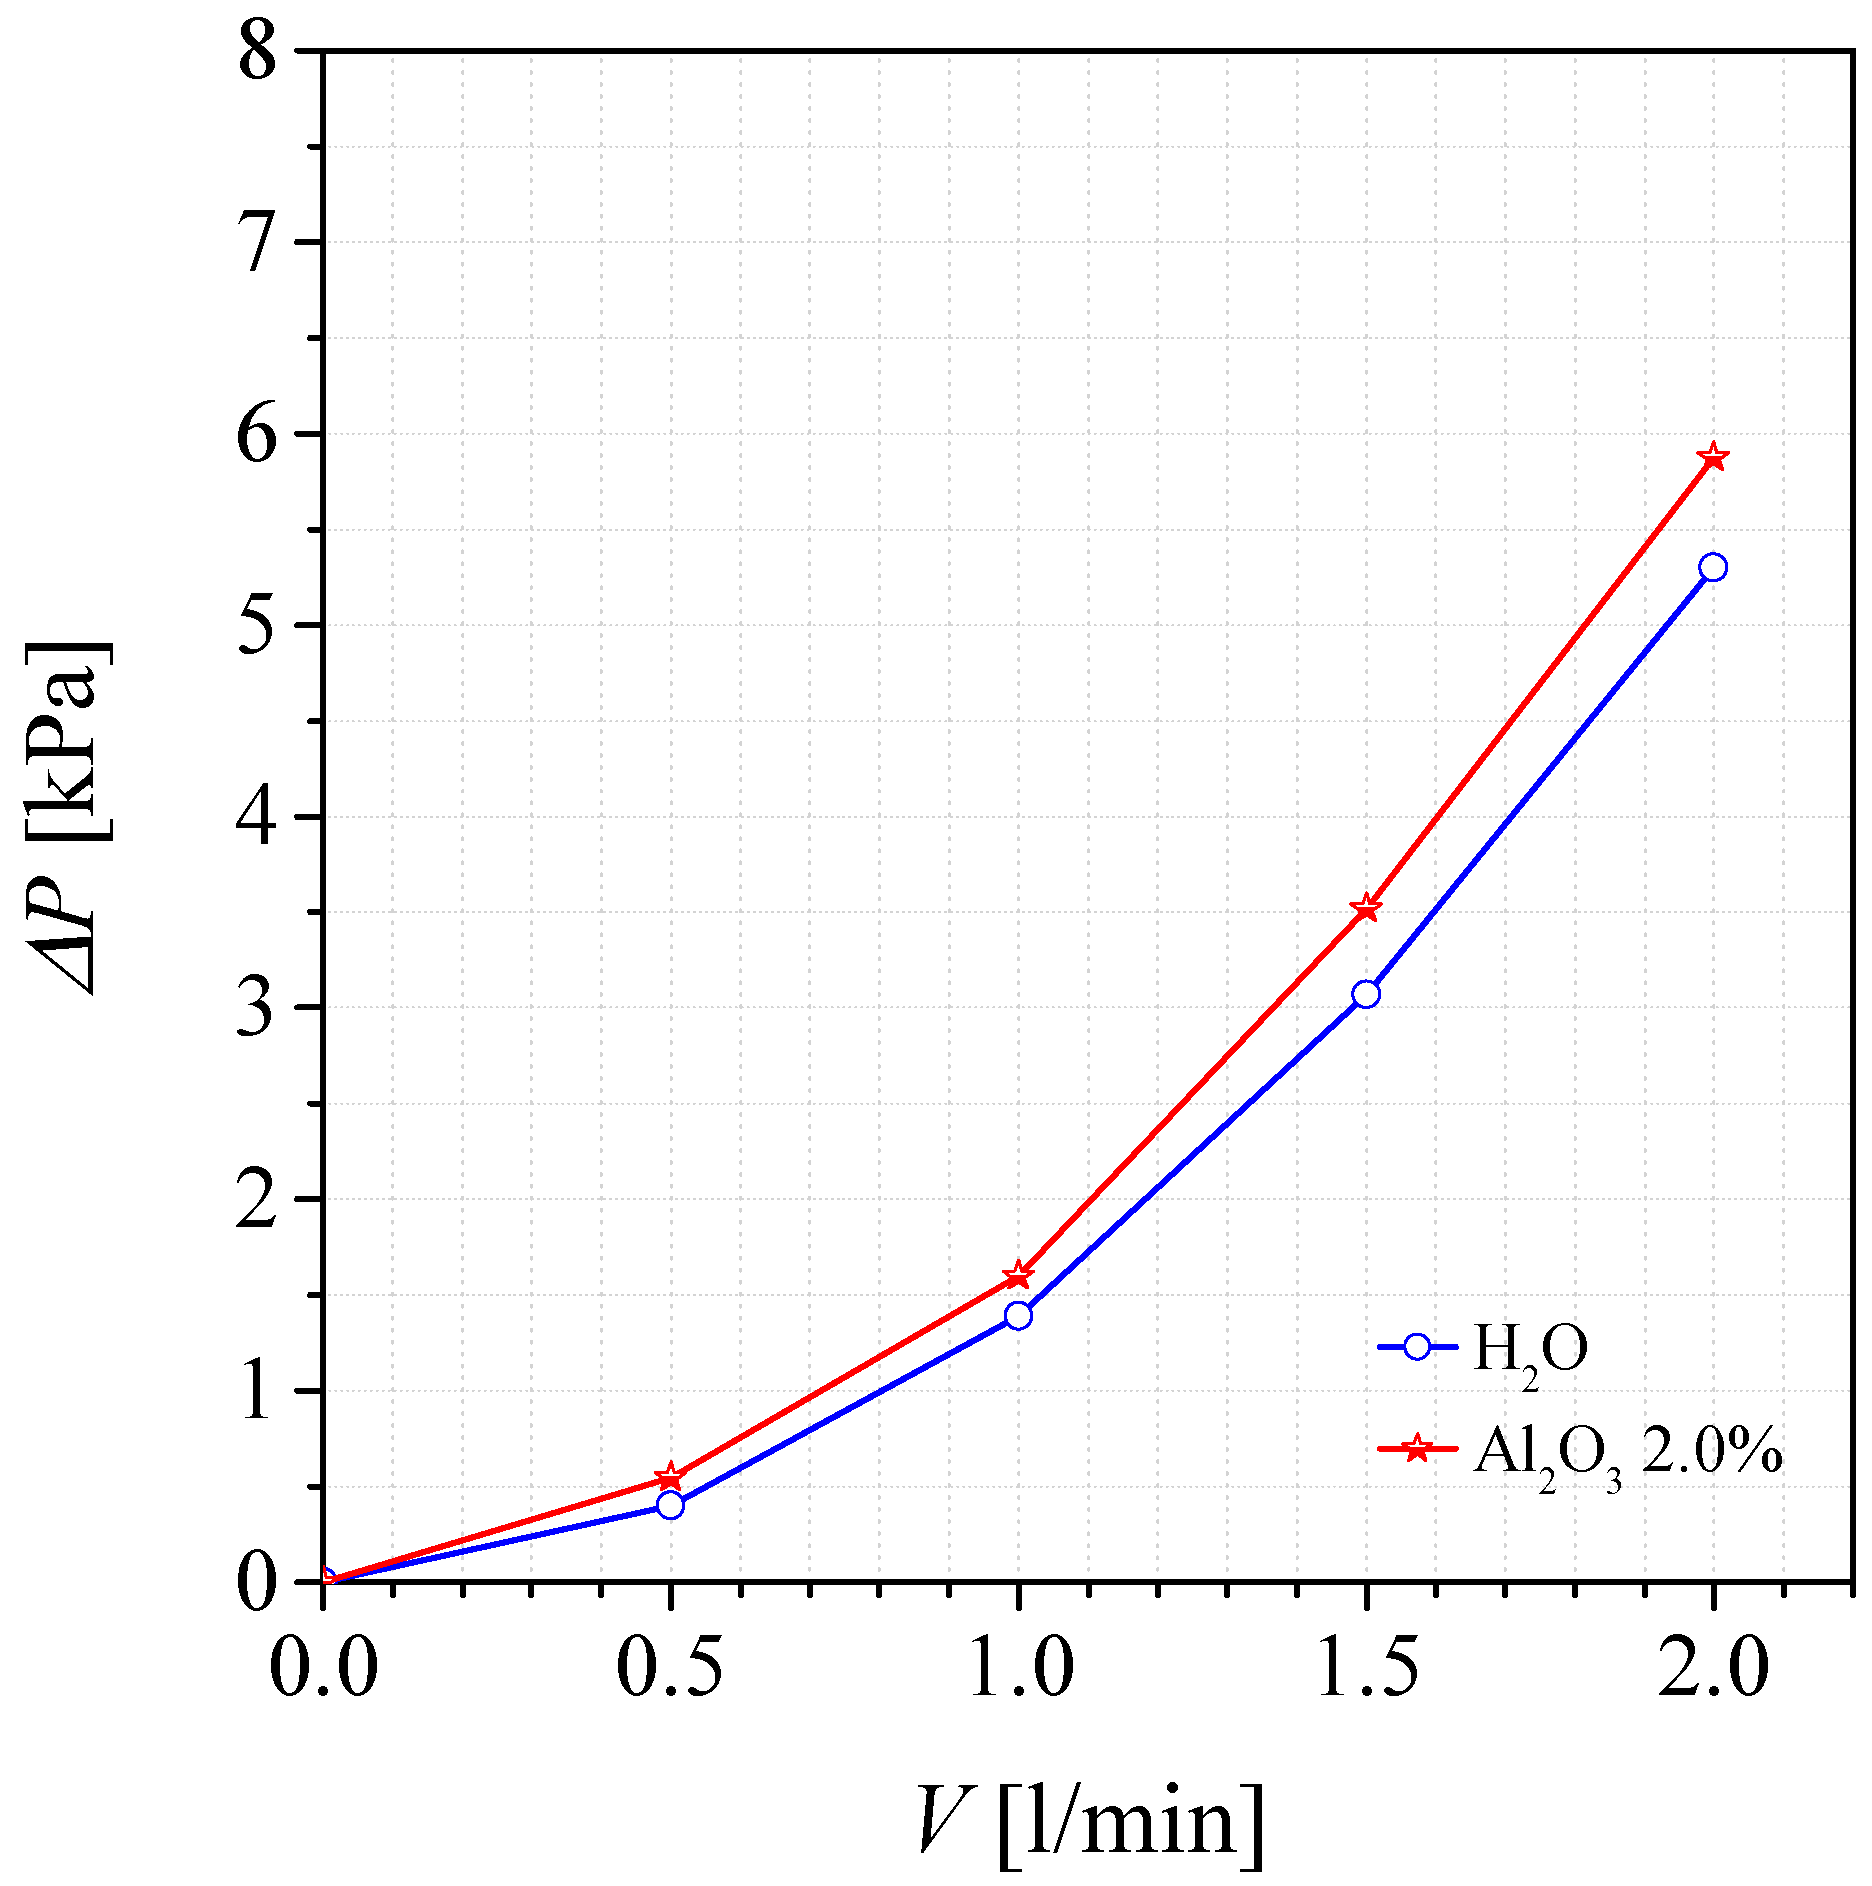
Figure 16 shows the pressure drops at 20 °C as a function of the volumetric flow; it can be seen that the values for water and for the nanofluid are not very different from each other.
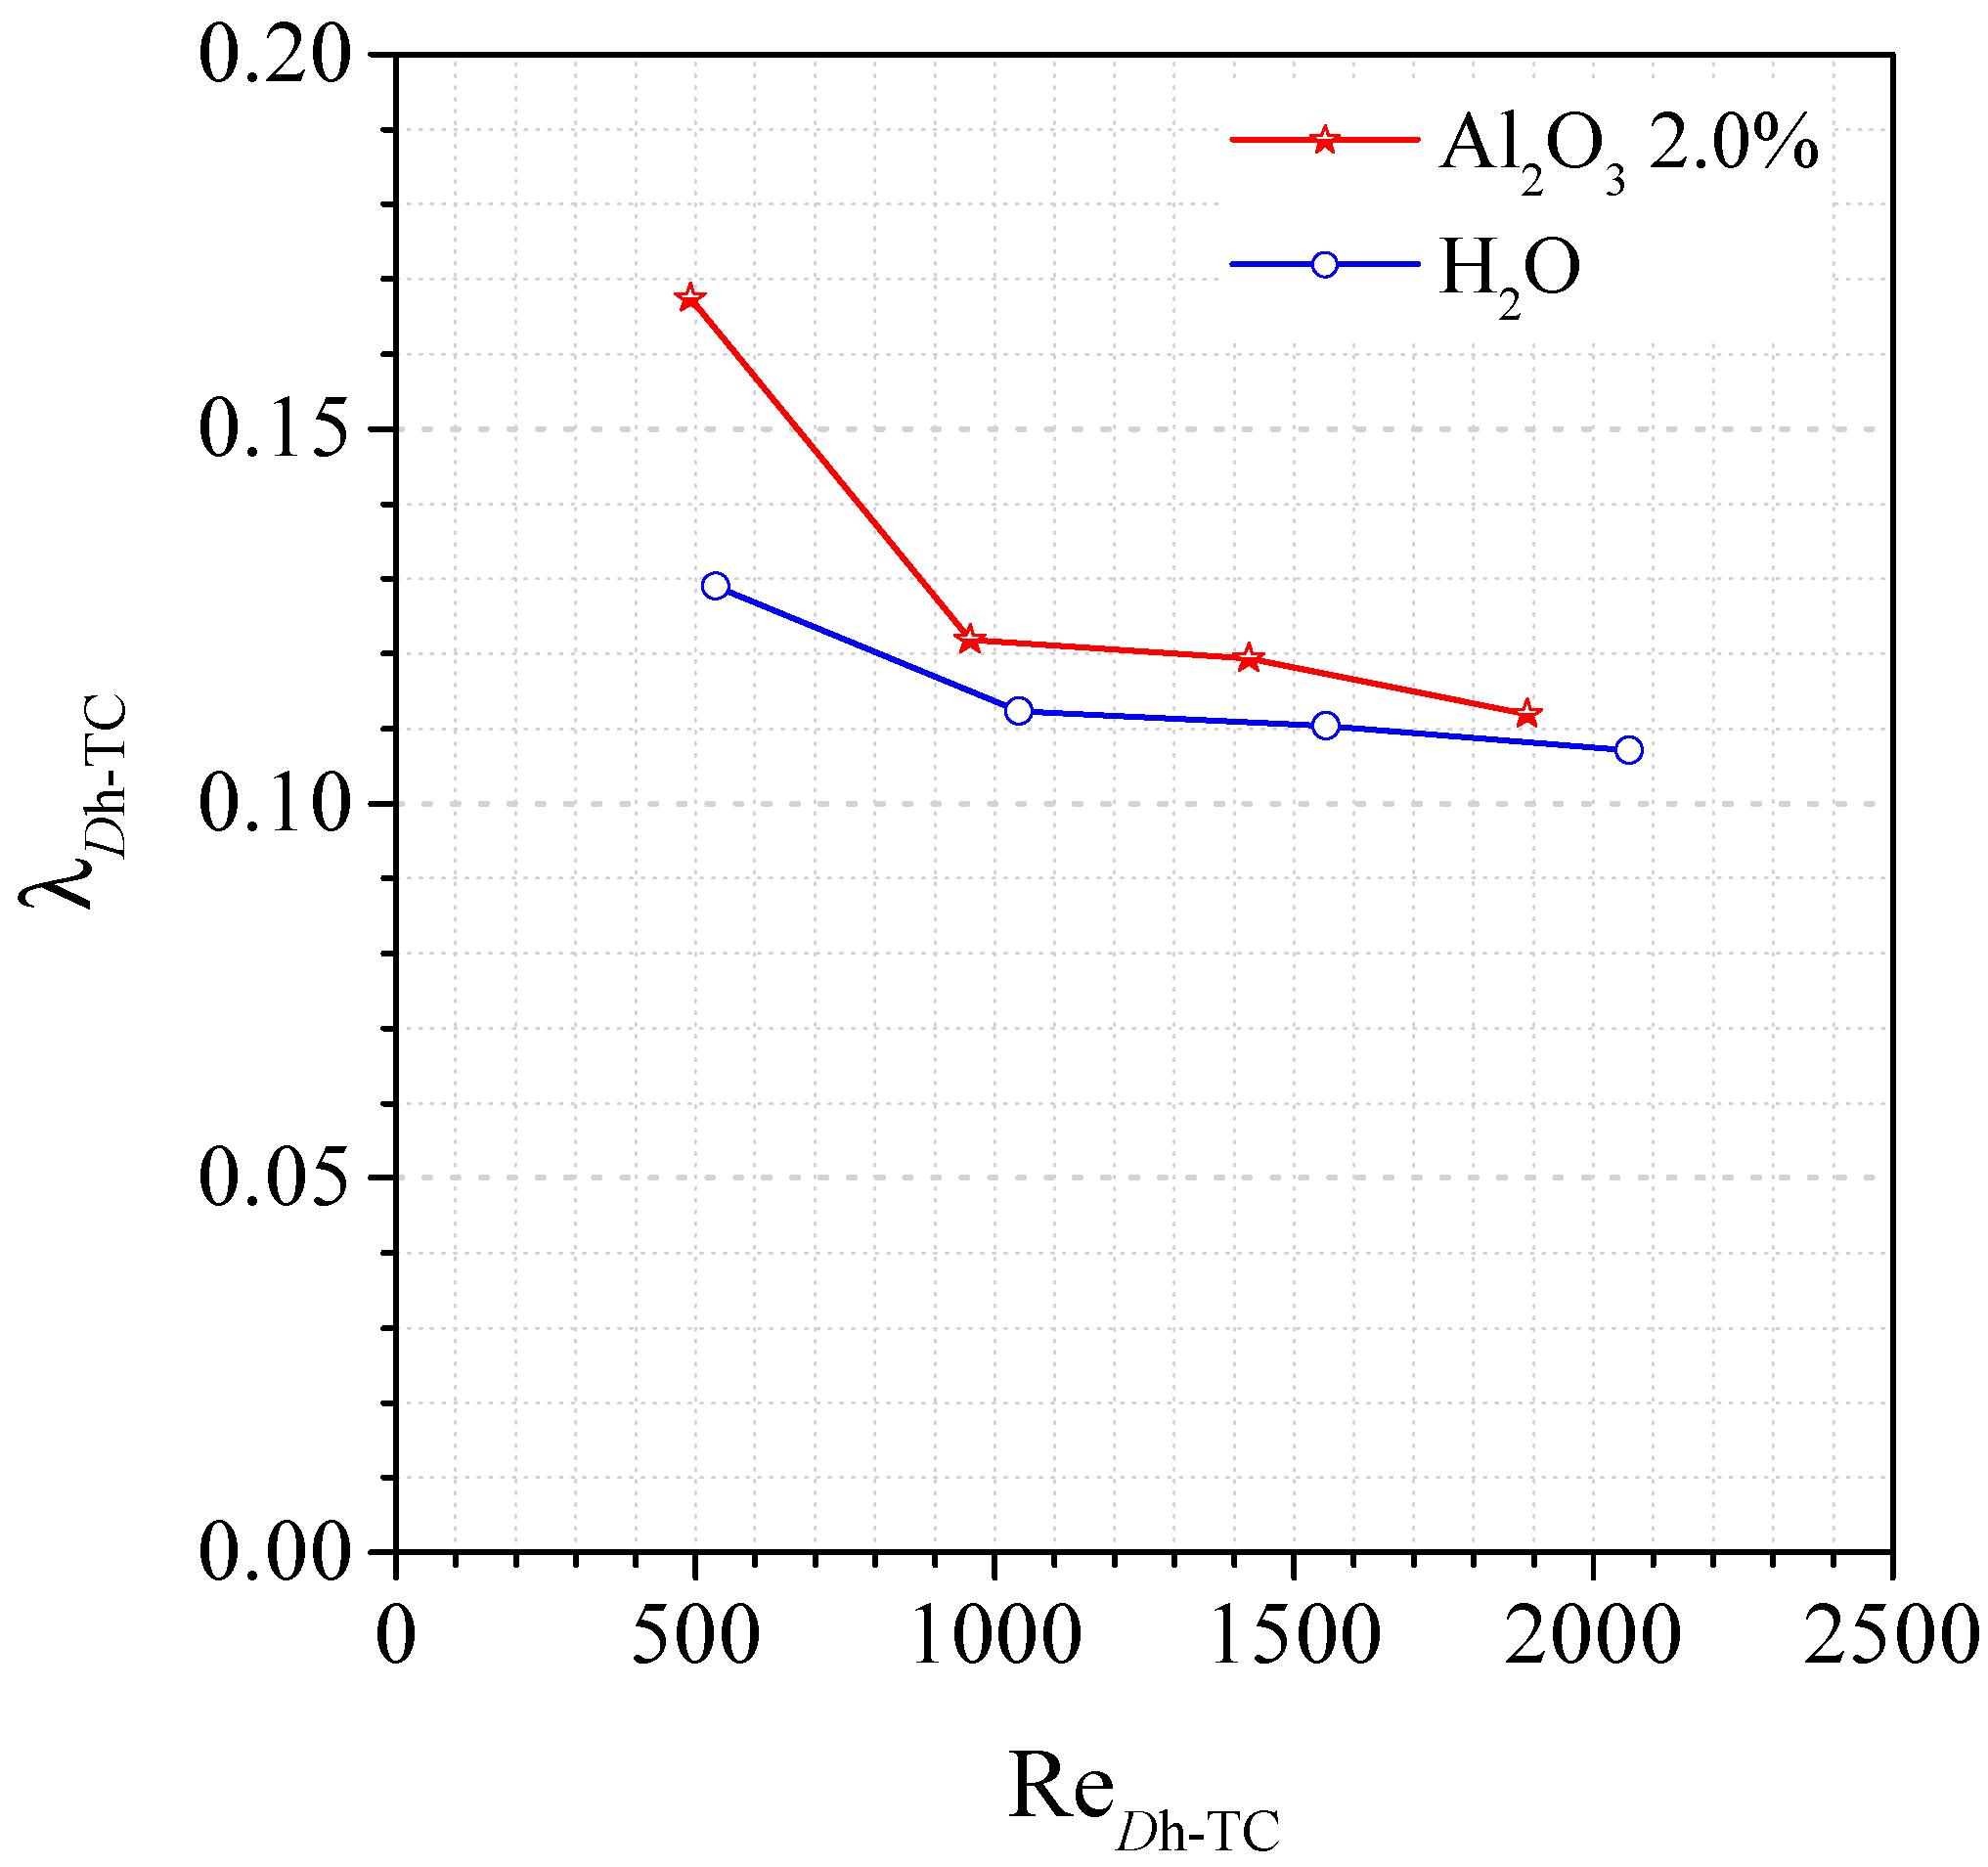
Therefore it is possible to determine the coefficient of friction, after measuring the pressure drops, according to:
λ D h - TC = 2 Δ p TEST D h - TC L ρ n f w TC 2
Thus, applying the Darcy–Weisbach formula (Equation (22)), the friction factor of the nanofluid versus the Reynolds number is always higher than that of water (Figure 17).

4.3. Experimental Uncertanties

Uncertainty analysis is carried out using the engineering method of [34]. Uncertainties are evaluated under three conditions:
  • Error distribution is Gaussian according to the central limit theorem;
  • Contribution of each variable to the global uncertainty is reciprocally independent;
  • Measurement accuracy is expressed with a confidence level of 95%.
The errors are referred as random if they vary during the experiment, valuable by the standard deviation of a representative measurements sample, and systematic if they are static and assimilable to a mean value deviation. In the case of multiple samples per measurement, each measurement itself can be represented by the mean sample value, and the uncertainty can be calculated using the bias (B) and the average precision index (S), which describe, respectively, the fixed error and the sample standard deviation. Both are calculated based on the sensitivity to the specific error source, and they are quite similar, respectively, to the error of Type B and Type A according to the classification proposed in [35].
All the samples of measurement are multiple. For each physical quantity, Xi, the uncertainty is expressed by the following equation:
δ X i - 0 . 95 = [ B X i 2 + ( t S X ¯ i ) 2 ] 1 2
The value of the multiplier t (Student’s test) is set equal to 2 according to the confidence interval (95%) and the sample degrees of freedom (more than 30). Moreover, the definition used is
S X ¯ i = S X i N
The measurement error theory suggests that the result R of an experiment can be determined by a series of N measurements, a single quantity Xi, and an interpolating criterion, thus
R = R ( X 1 , X 2 , , X i , , X N )
The R result for measurement bias and precision index are described by
B R = [ i = 1 N ( R X i B X i ) 2 ] 1 2 S R = [ i = 1 N ( R X i S X i ) 2 ] 1 2
The global uncertainty can be expressed by:
δ R 0 . 95 = [ B R 2 + ( t S R ) 2 ] 1 2
while the percentage uncertainty is δ R 0 . 95 / R [ % ] .
The static characteristics of the instruments used for volumetric flow and pressure measurements are summarized in Table 4. The volume flow rate is measured by the Dwyer flowmeters arranged in parallel to satisfy the tested flow regimes. The pressure drops measurements were carried out with the Dwyer 690C3 differential transducer.

4.3.1. Friction Factor Uncertainty

The main error sources, due to the use of Equation (22), are the following:
  • Differential pressure measurement;
  • Velocity evaluation.
The main error source in the pressure drops is represented by the pressure transducer accuracy, so the percentage uncertainty is greater than ±20% at a lower flow rate and decreases quickly to a value of ±2.5% when the volume flow rate is equal to 2 L/min.
The average flow velocity is obtained as a ratio between the flow rate and a reference section which can be the section of the supply duct or the minimum flow passage section of the lattice channel. According to the chosen section, the following quantities are defined
w TC = V ˙ S min T C
w SD = V ˙ S S D
In Equations (23) and (24), the flowmeter accuracy is the main source of error, with a percentage of uncertainty equal to ±4.5% when the volume flow rate is equal to 0.5 L/min, ±10% for 2 L/min.
Finally, in the friction factor evaluation, the average percentage of uncertainty is equal to ±25%.

4.3.2. Nusselt Number Uncertainty

The main error sources in the evaluation of the convective heat transfer coefficients, according to Equation (13), are the temperature measurements, the dependence on electrical quantities (voltage difference and electric current from the data acquisition system) necessary to estimate the dissipated electrical power due to the Joule effect, and the contribution to heat transfer due to conduction to the supports and conduction towards the external ambient through the insulation.
For each thermocouple, the experimental uncertainty is equal to ±0.1 °C as a consequence; instead, the relative uncertainty on the temperature difference between the duct and the fluid is less than ±1.5%.
For the heat flux exchanged in the lattice channel, taking into account the considerations summarized in Figure 7, the uncertainty can be calculated as ±15% of Q ˙ eb = Q ˙ .
The final uncertainty on the convective heat transfer coefficient is an average of ±16.9%, which can be considered the same for the Nusselt number, because the contribution to the uncertainty of the characteristic length and of the thermal conductivity can be negligible.

5. Conclusions

As previously reported, in the scientific literature there are many studies on the improvement of heat transfer in fluids or nanofluids flowing inside traditional channels, or simple fluids (air/water) inside reticular channels. However, there are no results obtained on the heat exchange of nanofluids inside the lattice channel, made for example in 3D printing. So, in this study, the preliminary results of heat transfer and pressure drop measurements on Al2O3/H2O nanofluids flowing through a double X lattice channel are presented. The results were compared to pure water flowing through the same duct. The channel was heated by a fixed thermal flux equal to 160 W. Experimental tests were carried out with different volume concentrations of nanoparticles (φ = 1.00%, φ = 1.50% and φ = 2.05%) and different volumetric flow rates (0.2 L/min to 2 L/min). The following considerations based on the measurement results can be drawn:
  • The heat power absorbed by the nanofluid results are higher than heat power absorbed by pure water for each volumetric concentration of nanoparticles and for each volumetric flow rate (an average increase of 6%, 9%, and 14% for 1.00%, 1.50%, and 2.05% volume concentrations, respectively, has been estimated);
  • The heat convective coefficient of nanofluid is greater than water when the volumetric flow rate is greater than 0.5 L/min; however, there is not a significant difference when volumetric flow rate ranges from 0.2 and 0.5 L/min;
  • When the volumetric flow rate is greater than 1 L/min, the heat convective coefficient results are almost the same (saturation effect);
  • The pressure drop of nanofluids is almost the same as that of pure water;
  • In laminar flow, the lattice channel (crossed by water or nanofluids independently) gives better thermal performances compared to the smooth duct..The aim of this paper is to match the advantage of nanofluid itself and its possible use in reticular ducts already widely used by many researchers to increase heat transfer, and although this paper represents a preliminary study to estimate the heat transfer enhancement due to both nanofluids and lattice structure, it can be concluded that nanofluids that flow through a reticular duct represent a combination that increases the heat exchange when volumetric flow rate is greater than 0.5 L/min and when the laminar regime is assured. Moreover, given that the pressure drop of nanofluids is almost the same as that of pure water, the use of nanofluids represents a solution that increases the cooling efficiency of heat exchange. Certainly, traditional fluids can be handled more easily; the use of nanofluids involves higher production and maintenance costs considering the phenomena to which they could be subject, such as sedimentation or clustering.

Author Contributions

Conceptualization, S.C. and I.P.; Methodology, S.C., M.P. and I.P.; Formal analysis, S.C., M.P. and I.P.; Investigation, S.C., M.P. and I.P.; Resources, S.C., M.P. and I.P.; Writing—original draft preparation, S.C., M.P. and I.P.; Writing—review and editing, S.C., M.P. and I.P.; Visualization, S.C., M.P. and I.P.; Supervision, S.C., M.P. and I.P.; Project administration, S.C. and I.P. All authors have read and agreed to the published version of the manuscript.

Funding

This research received no external funding.

Institutional Review Board Statement

Not applicable.

Informed Consent Statement

Not applicable.

Data Availability Statement

The data presented in this study are available on request from the corresponding author.

Conflicts of Interest

The authors declare no conflict of interest.

Nomenclature

Latin
Asurface [m2]
Cspecific heat [J·kg−1·K−1]
ddiameter [m]
Ddiameter [m]
Hconvective heat transfer coefficient [W·m−2·K−1]
Hinner duct height [m]
Ielectrical current [A]
Kthermal conductivity [W·m−1·K−1]
Llength of the lattice channel [m]
Mmolecular weight [kg·mol−1]
m ˙ mass flow rate [kg·s−1]
NAvogadro number [mol−1]
NuNusselt number [-]
Ppressure [Pa]
PrPrandtl number [-]
Q ˙ heat transfer rate [W]
Relectrical resistance [Ω]
ReReynolds number [-]
Wparticle weight fraction [-] or velocity [m·s−1]
Winner duct width [m]
Ttemperature [°C] or [K]
V ˙ volumetric flow rate [m3·s−1] or [l·min−1]
Greek
Athermal diffusivity [m2·s−1]
Δdifference [-]
Φparticle volume fraction [-]
Λfriction factor [-]
Μdynamic viscosity [kg·m−1·s−1]
Νkinematic viscosity [m2·s−1]
Ρdensity [kg·m−3]
Subscripts
Cdconduction
beenergy balance
Ffluid
Fcforced convection
Heheater
Nfnanofluid
Pparticle
SDsupply duct
Tottotal
TCtest channel

References

  1. Choi, S.U.S.; Eastman, J.A. Enhancing thermal conductivity of fluids with nanoparticles. In Proceedings of the ASME, San Francisco, CA, USA, 12–17 November 1995. [Google Scholar]
  2. Li, J.; Zhang, X.; Xu, B.; Yuan, M. Nanofluid research and applications: A review. Int. Commun. Heat Mass Transf. 2021, 127, 105543. [Google Scholar] [CrossRef]
  3. Sheremet, M.A. Applications of nanofluids. Nanomater 2021, 11, 1716. [Google Scholar] [CrossRef] [PubMed]
  4. Zhang, Y.; Zhou, Y. The recent progress of nanofluids and the state-of-art thermal devices. Highlights Sci. Eng. Technol. 2022, 13. [Google Scholar] [CrossRef]
  5. Lee, S.; Choi SU, S.; Li, S.; Eastman, J.A. Measuring Thermal Conductivity of Fluids Containing Oxide Nanoparticles. J. Heat Transf. 1999, 121, 280–289. [Google Scholar] [CrossRef]
  6. Corasaniti, S.; Bovesecchi, G.; Gori, F. Experimental thermal conductivity of alumina nanoparticles in water with and without sonication. Int. J. Thermophys. 2021, 42, 23. [Google Scholar] [CrossRef]
  7. Lenin, R.; Joy, P.A.; Bera, C. A review of the recent progress on thermal conductivity of nanofluid. J. Mol. Liq. 2021, 338, 116929. [Google Scholar] [CrossRef]
  8. Bovesecchi, G.; Corasaniti, S.; Costanza, G.; Piccotti, F.; Potenza, M.; Tata, M.E. Heat Conduction and microconvection in nanofluids: Comparison between theoretical models and experimental results. Aerospace 2022, 9, 608. [Google Scholar] [CrossRef]
  9. Scott, T.O.; Ewim, D.R.E.; Eloka-Eboka, A.C. Hybrid nanofluids flow and heat transfer in cavities: A technological review. Int. J. Low Carbon Technol. 2022, 17, 1104–1123. [Google Scholar] [CrossRef]
  10. Lin, H.; Jian, Q.; Bai, X.; Li, D.; Huang, Z.; Huang, W.; Feng, S.; Cheng, Z. Recent advances in thermal conductivity and thermal applications of graphene and its derivatives nanofluids. Appl. Therm. Eng. 2023, 218, 119176. [Google Scholar] [CrossRef]
  11. Trisaksri, V.; Wongwises, S. Critical review of heat transfer characteristics of nanofluids. Renew. Sustain. Energy Rev. 2007, 11, 512–523. [Google Scholar] [CrossRef]
  12. Yu, W.; France, D.; Choi, S.; Routbort, J. Review and Assessment of Nanofluid Technology for Transportation and Other Applications; No. ANL/ESD/07-9; Argonne National Lab. (ANL): Argonne, IL, USA, 2007. [Google Scholar]
  13. Mohammed, H.; Bhaskaran, G.; Shuaib, N.; Saidur, R. Heat transfer and fluid flow characteristics in microchannels heat exchanger using nanofluids. Renew. Sustain. Energy Rev. 2011, 15, 1502–1512. [Google Scholar] [CrossRef]
  14. Kumar, S.; Sharma, M.; Bala, A.; Kumar, A.; Maithani, R.; Sharma, S.; Alam, T.; Kumar Gupta, N.; Sharifpur, M. Enhanced heat transfer using oil-based nanofluid flow through Conduits: A Review. Energies 2022, 15, 8422. [Google Scholar] [CrossRef]
  15. Ma, H.; He, B.; Su, L.; He, D. Heat transfer enhancement of nanofluid flow at the entry region of microtubes. Int. J. Therm. Sci. 2023, 184, 107944. [Google Scholar] [CrossRef]
  16. Cieśliński, J.T.; Lubocki, D.; Smolen, S. Impact of temperature and nanoparticle concentration on turbulent forced convective heat transfer of nanofluids. Energies 2022, 15, 7742. [Google Scholar] [CrossRef]
  17. Abdelaziz, A.H.; El-Maghlany, W.M.; El-Din, A.A.; Alnakeeb, M.A. Mixed convection heat transfer utilizing nanofluids, ionic nanofluids, and hybrid nanofluids in a horizontal tube. Alex. Eng. J. 2022, 61, 9495–9508. [Google Scholar] [CrossRef]
  18. Wai, O.J.; Gunnasegaran, P.; Hasini, H. A review on experimental and numerical investigations of jet impingement cooling performance with nanofluids. Micromachines 2022, 13, 2059. [Google Scholar] [CrossRef] [PubMed]
  19. Alammar, K.N.; Mohammed, A. Flow and heat transfer characteristics of heterogeneous nanofluids in pipes. In Proceedings of the ASME, Denver, CO, USA, 11–17 November 2011. [Google Scholar]
  20. Zeng, X.; Hao, Y.; He, T.; Mao, N. A numerical study on heat transfer characteristics of a novel rectangular grooved microchannel with nanofluids. Energies 2022, 15, 7187. [Google Scholar] [CrossRef]
  21. Wadley, H.N.G. Multifunctional periodic cellular metals. Philos. Trans. R. Soc. A 2006, 364, 31–68. [Google Scholar] [CrossRef]
  22. Kim, T.; Zhao, C.Y.; Lu, T.J.; Hodson, H.P. Convective heat dissipation with lattice-frame materials. Mech. Mater. 2004, 36, 767–780. [Google Scholar] [CrossRef]
  23. Kim, T.; Hodson, H.P.; Lu, T.J. Fluid-flow and endwall heat-transfer characteristics of an ultralight lattice-frame material. Int. J. Heat Mass Transf. 2004, 47, 1129–1140. [Google Scholar] [CrossRef]
  24. Shen, B.; Yan, H.; Xue, H.; Xie, G. The effects of geometrical topology on fluid flow and thermal performance in Kagome cored sandwich panels. Appl. Therm. Eng. 2018, 142, 79–88. [Google Scholar] [CrossRef]
  25. Zhang, Q.; Han, Y.; Chen, C.; Lu, T. Ultralight X-type lattice sandwich structure (I): Concept, fabrication and experimental characterization. Sci. China Ser. E-Technol. Sci. 2009, 52, 2147–2154. [Google Scholar] [CrossRef]
  26. Yan, H.B.; Zhang, Q.C.; Lu, T.J.; Kim, T. A lightweight X-type metallic lattice in single-phase forced convection. Int. J. Heat Mass Transf. 2015, 83, 273–283. [Google Scholar] [CrossRef]
  27. Petracci, I.; Corasaniti, S.; Potenza, M.; Santoro, D.; Consolini, L.; Gori, F. In a 3D printed lattice channel for a combined hydrodynamic and thermal entry length problem. Appl. Therm. Eng. 2023. submitted for publication. [Google Scholar]
  28. Ghambari, M.; Rezazadeh, G. A MEMS-based methodology for measurement of effective density and viscosity of nanofluids. Eur. J. Mech.–B Fluids 2021, 86, 67–77. [Google Scholar] [CrossRef]
  29. Maxwell, J.C.A. Treatise on Electricity and Magnetism; Clarendon Press: Oxford, UK, 1881. [Google Scholar]
  30. Corcione, M. Empirical correlating equations for predicting the effective thermal conductivity and dynamic viscosity of nanofluids. Energy Conv. Manag. 2011, 52, 789–793. [Google Scholar] [CrossRef]
  31. Kays, W.M.; Crawford, M.E. Convection Heat and Mass Transfer, 3rd ed.; McGraw-Hill: New York, NY, USA, 1993. [Google Scholar]
  32. Kreith, F.; Manglik, R.M.; Bohn, M.S. Principles of Heat Transfer, 7th ed.; Cengage Learning: Boston, MA, USA, 2011. [Google Scholar]
  33. Tam, L.M.; Ghajar, A.J. Transitional heat transfer in plain horizontal tubes. Heat Transfer Eng. 2006, 27, 23–38. [Google Scholar] [CrossRef]
  34. Moffat, R.J. Describing the Uncertainties in Experimental Results. Exp. Therm. Fluid Sci. 1988, 1, 3–17. [Google Scholar] [CrossRef]
  35. JCGM 100:2008; Evaluation of Measurement Data—Guide to the Expression of Uncertainty in Measurement. Naitional Oceanic and Atmospheric Administration: Washington, DC, USA, 2008.
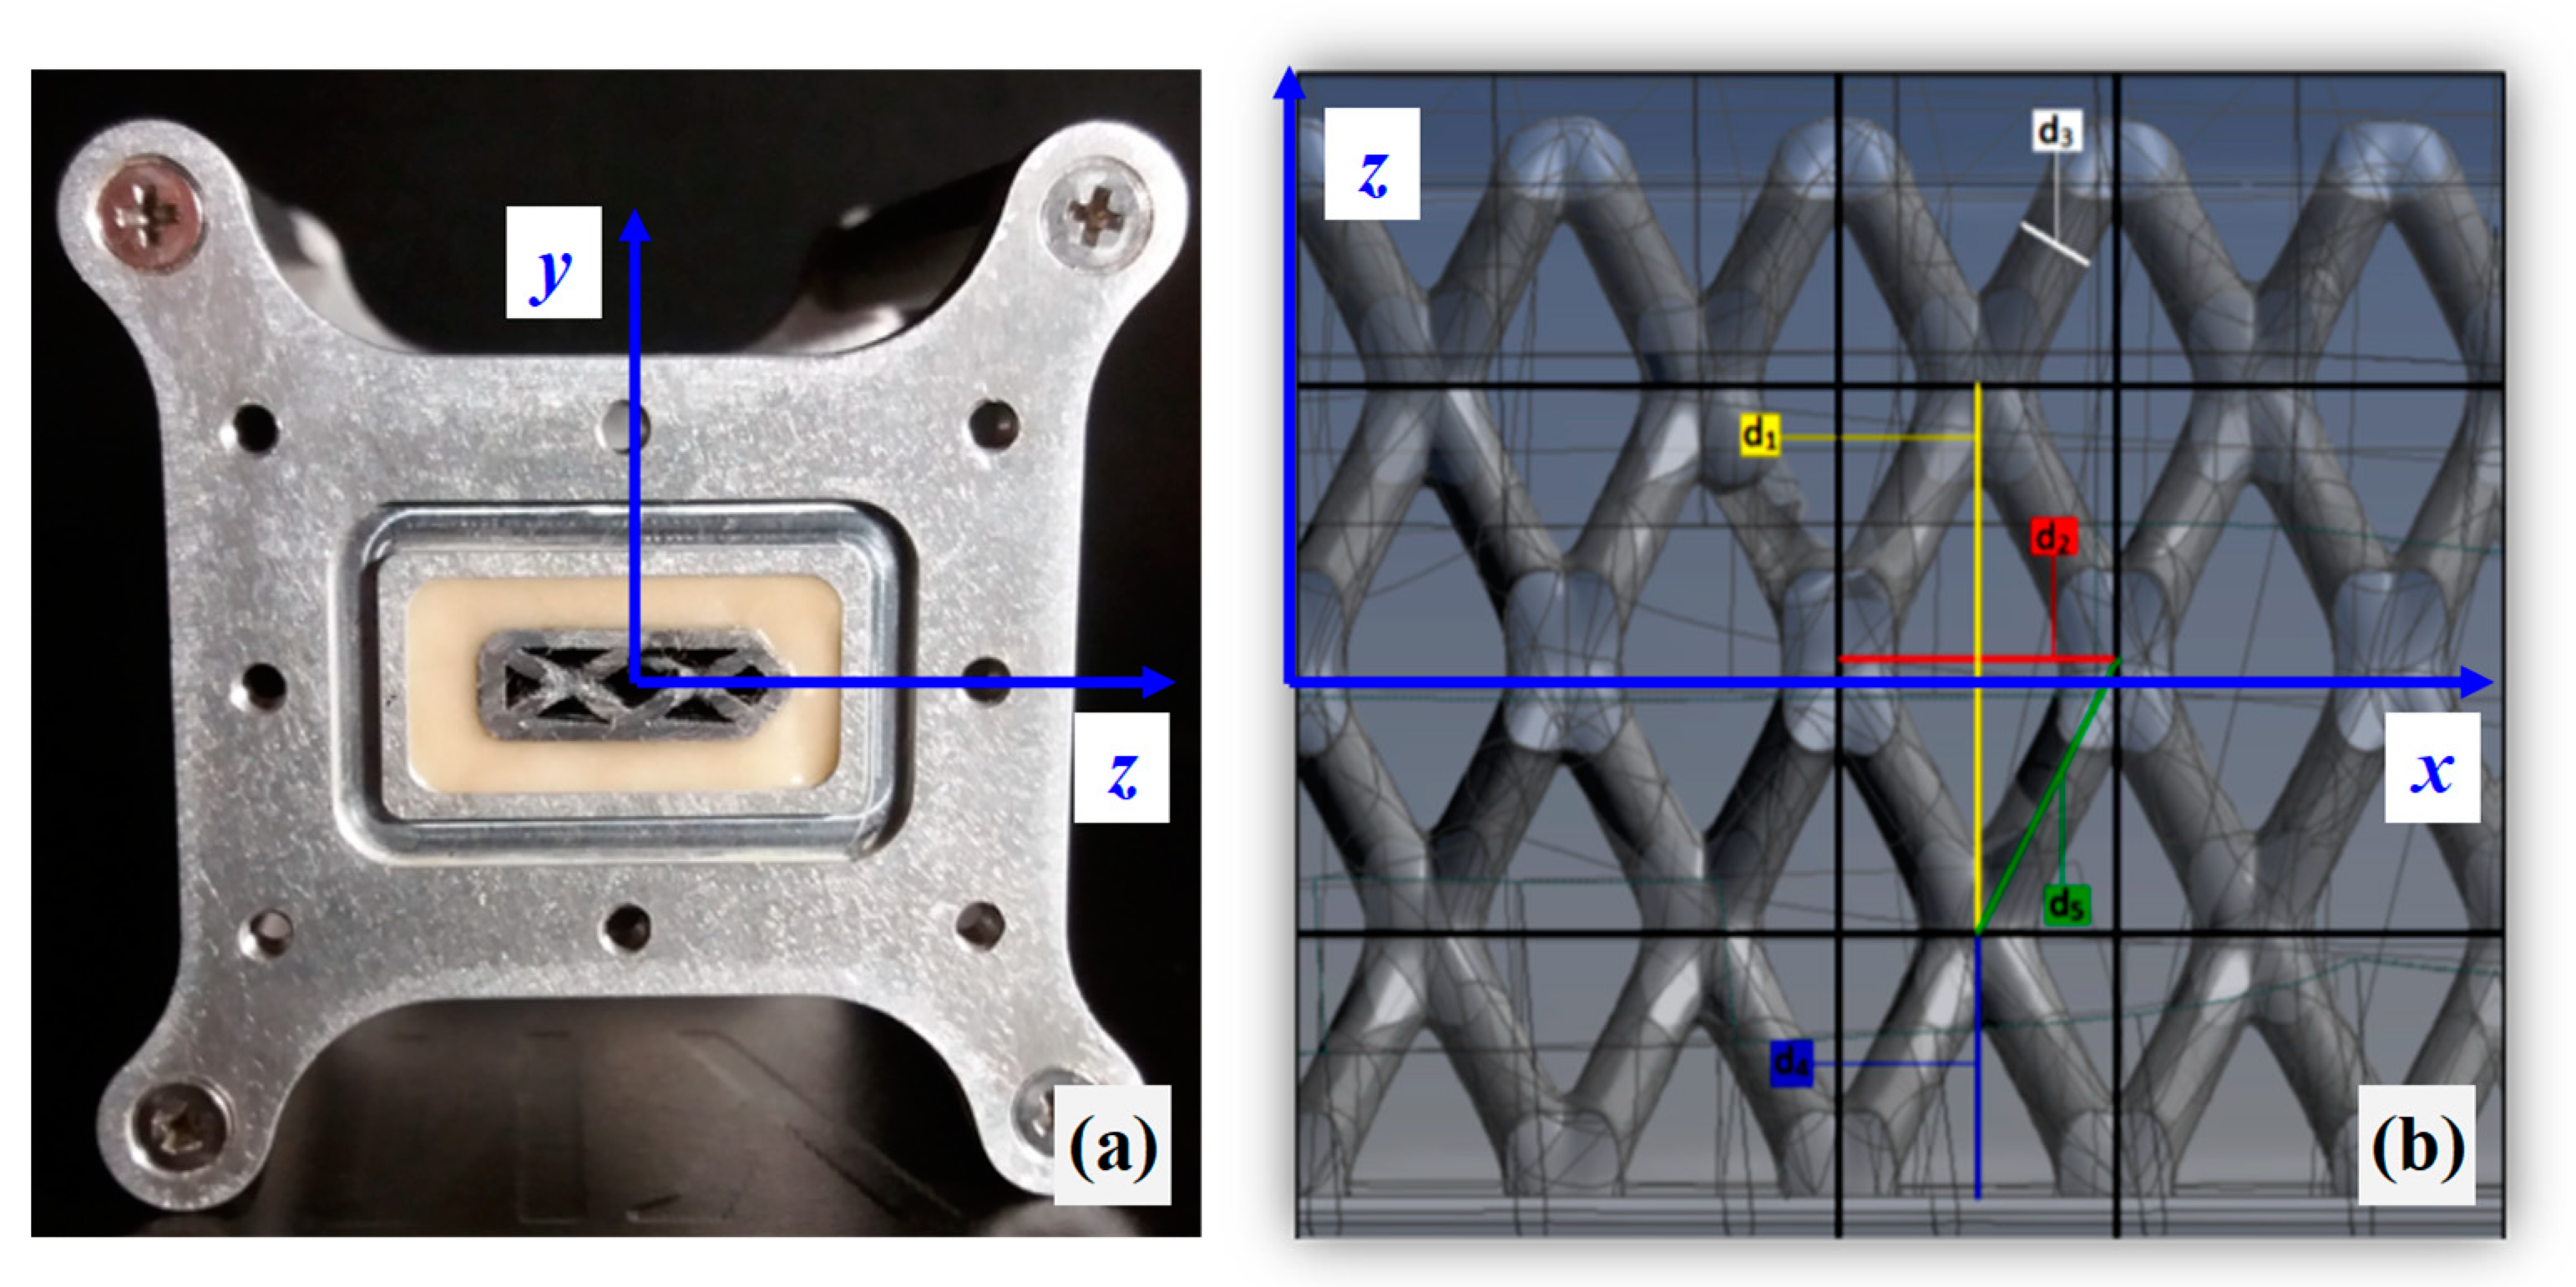
Figure 1. Test channel (a) and cross-section (b) according to xz plane (y = 0). The reticular dimensions, from d1 to d5, are summarized in Table 1. The main flow goes in x direction, from inlet to exit section.
Energies 16 03835 g001
Figure 2. Sketch of pneumatic circuit to feed the test channel: (1) cryo-thermostat, (2) valve, (3) flowmeter, (4) pressure gauge, (5) temperature sensor, (6) small water tunnel, (7) pre-test duct, (8) lattice test channel, (9) diffuser with rectangular to circular section connection.
Energies 16 03835 g002
Figure 3. Water tunnel design for testing the lattice channel.
Energies 16 03835 g003
Figure 4. Realization of the heater wrapped around the test channel (ac) and TC thermal insulation (d).
Energies 16 03835 g004
Figure 5. Part of experimental apparatus with TC thermally insulated.
Energies 16 03835 g005
Figure 6. Lattice channel (without heater), pre- and post-ducts with static pressure points: the flow goes from left to right.
Energies 16 03835 g006
Figure 7. Error estimation by comparing measured temperature with that calculated from enthalpy balance equation, with Δ T = T n f ,   OUT T n f ,   IN .
Energies 16 03835 g007
Figure 8. Heat transfer rate dissipated by the fluid, at different concentrations, versus volumetric flow rate (a) and versus mass flow rate (b).
Energies 16 03835 g008
Figure 9. Percentage increase of the heat power absorbed by the nanofluid compared to water versus volumetric flow rate.
Energies 16 03835 g009
Figure 10. Mean convective coefficient versus volumetric flow at the different volumetric fractions.
Energies 16 03835 g010
Figure 11. Mean Nusselt number versus ReDh TC number at the different volumetric fractions.
Energies 16 03835 g011
Figure 12. Thermophysical properties of the nanofluids: thermal capacity (a) and of the thermal conductivity (b) versus the average flow temperature.
Energies 16 03835 g012
Figure 13. Prandtl number of nanofluids versus the volumetric flow rate (a) and the average flow temperature (b).
Energies 16 03835 g013
Figure 14. Reticular duct (TC) on the left and supply duct (SD) on the right.
Energies 16 03835 g014
Figure 15. Mean Nusselt number versus ReDh-SD number at the different volumetric fractions and comparison with empirical correlations.
Energies 16 03835 g015
Figure 16. Pressure drops measurements in the Test Channel.
Energies 16 03835 g016
Figure 17. Friction factor versus Reynolds number at different volumetric fraction.
Energies 16 03835 g017
Table 1. Lattice Test Channel (TC) dimensions.
ParameterDescription Value
d 1   [ mm ] distance between the centres of two unit-cells, z direction 7.07
d 2   [ mm ] distance between the centres of two unit-cells, x direction4.06
d 3   [ mm ] diameter of each internal segment of the unit cell 2.09
d 4   [ mm ] distance between the centre of the unit-cell and the duct base3.42
d 5   [ mm ] length of the single pillar of the unit-cell4.06
L   [ mm ] length of the lattice channel, x direction80
H   [ mm ] inner duct height5
W   [ mm ] inner duct width15
t   [ mm ] wall thickness1
Dh-TC [mm]hydraulic diameter of frontal section (yz plane)1.51
Smin-TC [mm2] minimum flow passage section24.4
Table 2. Inlet nanofluid temperature Tnf,IN for all volumetric flow rates and for each concentration.
V [L/min]H2OAl2O3 (1.0%)Al2O3 (1.5%)Al2O3 (2.0%)
0.220.720.820.821.1
0.320.620.520.420.5
0.420.420.420.320.4
0.520.320.320.220.4
0.620.320.220.220.3
0.720.320.220.220.3
1.020.220.220.220.2
1.520.220.220.120.2
2.020.120.220.120.2
Table 3. Outlet nanofluid temperature T nf ,   OUT for all volumetric flow rates and for each concentration.
V [L/min]H2OAl2O3 (1.0%)Al2O3 (1.5%)Al2O3 (2.0%)
0.230.030.730.931.3
0.326.526.727.827.6
0.425.024.924.925.4
0.523.824.023.924.1
0.623.023.123.223.5
0.722.722.922.723.0
1.021.822.122.122.4
1.521.521.621.521.6
2.021.121.121.121.2
Table 4. Characteristics of flowmeters and pressure transducer.
TypeModelRangeAccuracy
FlowmeterDwyer, RMB 82D-SSV0.06 ÷ 0.73 L/min3% of full scale
FlowmeterDwyer, RMA 85D-SSV0.8 ÷ 6.2 L/min3% of full scale
Pressure transducerDwyer, 629C010 ÷ 35 kPa±0.5% of full scale
Disclaimer/Publisher’s Note: The statements, opinions and data contained in all publications are solely those of the individual author(s) and contributor(s) and not of MDPI and/or the editor(s). MDPI and/or the editor(s) disclaim responsibility for any injury to people or property resulting from any ideas, methods, instructions or products referred to in the content.