Abstract
Direct air capture (DAC) is considered one of the mitigation strategies in most of the future scenarios trying to limit global temperature to 1.5 °C. Given the high expectations placed on DAC for future decarbonisation, this study presents an extensive review of DAC technologies, exploring a number of techno-economic aspects, including an updated collection of the current and planned DAC projects around the world. A dedicated analysis focused on the production of synthetic methane, methanol, and diesel from DAC and electrolytic hydrogen in the European Union (EU) is also performed, where the carbon footprint is analysed for different scenarios and energy sources. The results show that the maximum grid carbon intensity to obtain negative emissions with DAC is estimated at 468 gCO2e/kWh, which is compliant with most of the EU countries’ current grid mix. Using only photovoltaics (PV) and wind, negative emissions of at least −0.81 tCO2e/tCO2 captured can be achieved. The maximum grid intensities allowing a reduction of the synthetic fuels carbon footprint compared with their fossil-fuels counterparts range between 96 and 151 gCO2e/kWh. However, to comply with the Renewable Energy Directive II (REDII) sustainability criteria to produce renewable fuels of non-biological origin, the maximum stays between 30.2 to 38.8 gCO2e/kWh. Only when using PV and wind is the EU average able to comply with the REDII threshold for all scenarios and fuels, with fuel emissions ranging from 19.3 to 25.8 gCO2e/MJ. These results highlight the importance of using renewable energies for the production of synthetic fuels compliant with the EU regulations that can help reduce emissions from difficult-to-decarbonise sectors.
1. Introduction
Current global greenhouse gas (GHG) emissions reach up to almost 50 GtCO2e every year, 40% higher than emissions in 1990 [1]. To limit the global temperature to 1.5 °C above pre-industrial levels (1850–1900), global CO2 emissions need to reach net zero by 2050, according to the United Nations Intergovernmental Panel on Climate Change (IPCC) model pathways, relying heavily on negative emissions towards the second half of the century [2]. All 1.5 °C IPCC pathways with no or limited overshoot include carbon dioxide removals (CDR) on the order of 100–1000 GtCO2 over this century, requiring up to ~10 GtCO2/year removed in 2050 and ~17 GtCO2/year in 2100 [2]. Similarly, most of the 400 scenarios with at least a 50% chance of limiting global temperature increase at 2 °C analysed by the IPCC in the Fifth Assessment Report [3] include large-scale deployment of various negative emissions technologies (NETs) [4]. These technologies can help offset emissions of certain sectors that are difficult to decarbonise, such as heavy industries or aviation. According to the International Energy Agency (IEA) “Net-Zero Emissions by 2050” Scenario (NZE), which is compatible with limiting the temperature rise to 1.5 °C, almost 2 Gt of carbon removal is expected to occur on a global scale through bioenergy with carbon capture and storage (BECCS) and direct air capture with carbon storage (DACCS) by 2050 [5]. Of these, ~980 Mt CO2/year is projected to be captured using direct air capture (DAC) by 2050 and 85 Mt CO2/year by 2030 [6]. The net zero scenarios in the Special Report on Global Warming of 1.5 °C (IPCC SR1.5) increase the amount of CO2 captured and stored using BECCS and DACCS to up to 3.5–16 Gt in 2050 [5]. These numbers evince the need for large-scale demonstration plants to reduce costs and reach technological maturity. In fact, the IEA’s NZE indicates that almost half of the CO2 emission reductions in 2050 are expected to come from technologies currently at the demonstration or prototype phase. This means that an important innovation effort needs to take place to bring these technologies to market on time [5].
In the European Union, the total GHG emissions in 2021 were 3.78 GtCO2e, 14% lower than 2010 levels [7]. Europe is aiming to become the world’s first climate-neutral continent by 2050, with the announcement of the EU Green Deal in 2019 [8]. The EU Green Deal has climate action at its core, including ambitious measures not only to reach net zero emissions by 2050 but also to invest in cutting-edge research and innovation while preserving the natural environment. To put Europe on track to reach climate neutrality by 2050, the EU launched the 2030 Climate Target Plan, proposing to raise the 2030 emissions target from the previous 40% to at least 55% compared with 1990 levels [9]. To implement this increased ambition, the “Fit for 55” legislative package was announced in July 2021 [10]. The latest REPowerEU plan [10], adopted due to the current geopolitical risks and energy market disruptions, accelerates the process of the green transition [11]. Policy support is considered one of the most critical factors for the future development and scaling up of NETs technologies. In December 2021, the European Commission launched the Sustainable Carbon Cycles Communication with the objective of putting in place a regulatory framework for certification of carbon removals, which started in late 2022 [12]. One of the aspirational objectives of this action is to remove and permanently store through industrial technologies 5 MtCO2/year from the atmosphere by 2030. This framework aims to standardise the monitoring, reporting, and verification (MRV) methodologies for carbon accounting to provide high-quality carbon removals. NETs, including DAC, are part of the technologies included in the future certification, which will help to enable the growth of these technologies. The Innovation Fund, funded by the EU ETS and planning to provide approximately EUR 38 billion from 2020 to 2030, is another mechanism that was put in place by the EU in 2020 to help the achievement of the net zero emissions target [13]. It is the world’s largest funding programme for the deployment of innovative low-carbon technologies at scale, including NETs and DAC, and it comprises net carbon removals as part of the award criteria. In November 2021, the EU-Catalyst partnership was also launched by the European Commission, the European Investment Bank, and Breakthrough Energy Catalyst aiming to mobilise approximately EUR 820 million between 2022 and 2026 to accelerate the deployment and commercialisation of innovative low carbon technologies in Europe, with DAC being one of the three technologies eligible for funding [14]. Including CDRs in the EU ETS could also provide suitable incentives for the development of DAC and further accelerate its growth [15].
Since the release of the long-term strategy “A Clean Planet for All” in 2018, carbon removals have been present in EU climate modelling scenarios that aim to reach net zero emissions by 2050. Two of these long-term scenarios (LTS) reach carbon neutrality by 2050, one relying more on negative emissions technologies (1.5TECH), while the other relies less on these technologies and focuses more on changes in business and consumption patterns towards a circular economy [16]. In these two scenarios, the total amount of CO2 captured and stored/used in 2050 to reach net zero is estimated at approximately 600 MtCO2e. The two NETs considered in the model are BECCS and DAC, with the main purpose of compensating for unabated emissions, especially in non-CO2 emitting sectors [17]. The projections allocate 210 MtCO2e and 123 MtCO2e to DAC in the 1.5TECH and 1.5LIFE scenarios in 2050, respectively [16]. Similarly, the latest scenarios released by the European Commission as part of the “Fit for 55” package also include BECCS and DAC, with a total of 547 MtCO2 captured and stored/used (synthetic fuels and materials) in 2050 in the MIX scenario. In this scenario, 152 MtCO2e of carbon removals are allocated to DAC [10].
Globally, DAC needs to move to the gigatonne scale removals by 2050 and reach the megatonne scale by 2030 in order not to miss the 2050 target [18]. An important factor to consider when evaluating the role of DAC in mitigation scenarios and the comparison with other negative emissions technologies is the ability to scale up at the required levels. This is especially critical for sorbent production (including potential chemical pollutants and extra energy needs to produce the sorbents) and for electricity and heat supply. If future DAC deployments fail to meet the targets assumed in terms of deployment at scale, this could lead to a global temperature overshoot of up to 0.8 °C [19].
This study has two main objectives reflected in the different sections. The first one (covering Section 2 and Section 6) is to provide an updated and extensive review of DAC technologies and the current state of the art, including operational and planned facilities. Furthermore, the most important technological aspects and challenges of DAC (energy demand, sorbents, carbon footprint, etc.), and economic aspects are also discussed. The second is focused on synthetic fuels production from CO2 captured through DAC. A literature review of synthetic fuels is provided in Section 3. Section 4 and Section 5 include a carbon footprint analysis of DAC and synthetic fuels production using electrolytic hydrogen in the EU. The analysis is performed at the country level, considering different future scenarios in the EU (“EU Reference Scenario 2020” and “Fit for 55”) and different combinations of energy sources (grid, PV, and wind).
2. DAC State of the Art
The number of studies in the literature analysing the feasibility of DAC as a climate change mitigation option have increased significantly in the last few years due to the growing presence of such technologies (together with other CDRs) in future decarbonisation scenarios [19,20,21,22]. It is generally agreed that the current status of DAC technologies is still far from its future expectations, which is considered by most to be an important risk when it comes to relying on this technology as a mitigation strategy in the future. The main concerns are related to cost, energy sources, and scaling-up capacity, which are further exacerbated by the lack of investment and policy support needed to reach the scale required in some of the decarbonisation scenarios. Many studies perform techno-economic analyses aiming to provide the current status of the main challenging aspects [23,24,25,26,27]. Some others focus on deeper analyses of the main two technologies (solid and liquid) [28,29,30], cost [31,32,33], or new sorbent developments [34,35,36,37,38], among other topics. The following sections provide more details on some of these aspects.
Regarding the high-energy consumption of DAC, there are a growing number of studies investigating the potential use of low-cost renewable energies as energy sources, including making use of the excess energy. DAC has shown good flexibility when coupled with intermittent and volatile wind power when the capture process is optimized [39]. A technical and economical sustainability study combining DAC with PV and wind energy has also shown great coupling benefits in the Maghreb region, obtaining a Levelised Cost of DAC (LCOD) of ~55 EUR/tCO2 in 2050, with a potential reduction up to 50% considering a negligible area demand [40]. In addition, in the Maghreb region (Morocco), the capture cost of a DAC hybrid PV–wind–battery system has been analysed as a case study, obtaining an LCOD of 222–133 EUR/tCO2 in 2020 and down to 54–32 EUR/tCO2 in 2050 for a conservative scenario [24]. This study also performs a wider techno economic analysis evaluating the different DAC technologies, capital expenditures, energy demands, and costs under two scenarios combining different DAC capacities and financial learning rates [24]. The results indicate that commercialisation in the 2020s and massive implementation in the 2040s and 2050s could reduce DAC cost significantly, becoming a competitive solution compared with carbon capture from point sources. The role of low temperature DAC systems is highlighted due to the lower cost of heat supply and the possibility of using waste heat. In California, DAC powered by excess renewable energy could be able to capture ~1 million tonnes of CO2 per year, reaching up to 20–140 million tonnes during 2030–2050 with increased PV penetration [41]. This study also underlines the large operational flexibility of the system across a wide range of capacity factors and concludes that energy consumption and net GHG emissions could be lower than the average range of carbon dioxide removal technologies. In Europe, a study shows that up to 500 MtCO2/year could be captured using only excess renewable energy [42]. A recent survey conducted amongst 18 experts on NETs and DAC drew a number of conclusions and insights [43]. Low consensus is observed regarding the best DAC technology in the market at the present time. The experts also reported a lack of reliable information regarding the actual cost of DAC. Despite the fact that projections show a significant decrease over time (from estimated current levels of 500–600 USD/tCO2), costs will continue to remain high (approximately 200 USD/tCO2 in 2050). The two most important limitations to future DAC growth are energy use and policy support, while the development of new sorbents, process designs, and energy sources are highlighted as key aspects to reduce the future costs.
2.1. DAC Main Technologies
2.1.1. Solid Adsorption
The solid adsorption technology uses a weak base as sorbent (normally an amine). In this case, the adsorbent material that sits inside the collectors captures the CO2 contained in the air that is drawn in by the fans. When the adsorbent becomes saturated, the collector closes, and the desorption process begins. The adsorbent is regenerated by heating it to 80–100 °C and lowering the pressure to 0.2–0.3 atm [44]. With this process, the CO2 is released and collected in high-purity and concentration, and the sorbent is subsequently cooled down and ready for the next cycle [44,45]. In one of the current modules from the Swiss company Climeworks, the full cycle lasts approximately 3.5 h, with the desorption process taking approximately 30–40 min [44]. Climeworks current sorbent also adsorbs the water vapor in the air, which increases the energy needs during the regeneration of the sorbent, especially in humid environments. Drier conditions are, therefore, preferred for this process. For each tonne of CO2 captured, one tonne of water can be produced under moderate climate conditions [44].
Since its foundation in 2009, the Swiss company Climeworks has deployed 18 DAC projects throughout Europe, with the second commercial plant under construction in Iceland [46]. The company’s scale-up target is to reach the multi-megatonne capacity by 2030 and deliver gigatonne capacity by 2050. Details on the main projects from Climeworks can be found in Table S7 of the Supplementary Material. Climeworks’ DAC is a modular technology based on solid adsorption, with an initial capacity of 50 tCO2 per module, which has the advantage that collectors can be assembled as needed to match the target size [45]. The current Climeworks assembly line can produce up to 150 CO2 collectors per year, which is equivalent to removing 7500 tCO2 [47]. A life-cycle assessment (LCA) based on Climeworks’ data from the Hinwil and Hellisheidi plants shows that this technology, combined with permanent storage, can reach a net CO2 removal efficiency of 85.4% to 93.1% (using wind and depending on the heat source) [30]. The study also shows that net efficiency can be further increased in the future to reach 96% and 96.6% using wind power [47].
The U.S. company Global Thermostat has also been developing solid-sorbent-based DAC technology since its foundation in 2010. Details on the main projects can be found in Table S8 of the Supplementary Material. Global Thermostat has also included the possibility of integrating flue gases into their system called DAC-PLUS [18]. The flue gas is injected into the panels during the last step before regeneration, allowing the use of low-cost natural gas to power the plant with a very low additional capital required. This results in a reduction of cost for net carbon removals.
2.1.2. Liquid Absorption
The liquid adsorption technology uses a strong liquid base (normally a hydroxide) that flows through the surface of the contactor, binding chemically with the CO2 from the air. Using a strong base facilitates the absorption of CO2; however, as it creates a stronger chemical bond, the solvent regeneration is more complex, requiring higher temperatures (~900 °C) than the ones used for solid sorbents. In this case, as opposed to solid sorbents, water is needed throughout the process, as it evaporates in the CO2 contactor. Dry and hot conditions that increase the water losses as well as low temperatures that increase the viscosity of the solvent are less preferable for this type of process [44].
Based in Canada, Carbon Engineering has been developing liquid absorption technology since 2009 [48]. Three plant configurations with variations in the power system, oxygen supply, and CO2 compression are being designed for different markets [29]. The baseline configuration is designed for combination with permanent storage (delivering CO2 at specifications appropriate for pipelines), and it is fully powered by natural gas to reach to the high temperatures needed. The CO2 emissions from the natural gas are captured by the plant and mixed with the CO2 from the air. A second variation also considers the use of electricity to cover part of the energy needs and would be suitable for locations with low-carbon energies at low cost. Finally, the third variation is optimized to provide CO2 for synthetic fuels production. In this case, the DAC plant is assumed to be coupled with an electrolyser to produce hydrogen that would also provide the oxygen needed for the capture process [29]. One of the advantages of liquid absorption DAC technology is the possibility of using the already existing industrial equipment of different sectors, thus facilitating the deployment at scale. For instance, the air contactor is based on industrial cooling towers, the pellet reactor has been used in the water treatment industry, the slaker in the pulp and paper industry, and the calciner in the cement and metals industries [18]. Details on the main projects from Carbon Engineering can be found in Table S9 of the Supplementary Material.
There are advantages and disadvantages in both solid and liquid DAC systems. Solid-based systems require low operating costs and low energy input, as the desorption temperature is lower (therefore, they can be powered by geothermal energy, waste heat, or renewables through heat pumps). They also present greater modularity than liquid DAC since the contactor configuration is segmented, allowing individual unit regeneration and facilitating the scaling-up process [49]. However, these systems do not operate on a continuous basis, and the collectors need to be sealed from the ambient air during the regeneration process when temperature, pressure, and humidity are controlled. In addition, solid-based systems require developing sorbents with high performance, low cost, and long economic life in impure ambient air [29]. Liquid-based systems can be operated continuously, can use inexpensive cooling-tower hardware and, as the liquid surface is continuously renewed, it allows very long contactor lifetimes despite dust and atmospheric contaminants [29]. The highly integrated nature of the system reduces modularity, reaching an economic optimum at approximately 1 MtCO2/year. However, some of the large process equipment (e.g., calciner and slaker) provides benefits in terms of economies of scale, providing an advantage for large-scale operations [49]. On the other hand, the regeneration system is complex, expensive, requires higher temperatures (currently using natural gas), and water is needed to replace the water loss during the process in dry environments [29].
2.2. Energy Use and Sorbents
Current DAC technologies require large amounts of energy, especially during the desorption process. Electricity is needed mainly to operate the fan that passes the air through the CO2 collector (which depends on the pressure drop) and the vacuum pumps, while thermal energy is used in the desorption process to heat up the collector [30]. The future energy needs to meet large-scale deployments of DAC compared with other mitigation and negative emissions strategies is one of the key challenges that is causing some skepticism. For instance, to remove 30 GtCO2/year (roughly the CDR rate considered by a number of models to keep global warming well below 2 °C by 2100 [19,50]), DACCS would require about 50 EJ/year of electricity (more than half of today’s total electricity production and approximately 10–15% of the projections in 2100) and 250 EJ/year of heat (more than half of today’s final energy consumption globally) [19,51,52].
For solvent-based technologies, findings available in literature show ranges of electricity use between 361 and 500 kWh/tCO2 and heat between 5.3 and 8.1 GJ/tCO2 [19]. For solid-sorbent-based technologies, the values are in the range of 166–305 kWh/tCO2 for electricity and 4.4–7.2 GJ/tCO2 for heat [19]. Carbon engineering and Climeworks have also published a detailed description of their DAC processes, including energy inputs [29,30]. Carbon engineering reports an energy use of 8.81 GJ/tCO2 for their baseline plant configuration (fully powered by natural gas), delivering CO2 at specifications appropriate for pipelines for permanent storage [29]. For the configuration that uses electricity as part of the energy supply, the energy inputs reported are 5.25 GJ/tCO2 of natural gas and 366 kWh/tCO2 of electricity [29]. It is important to note that these energy balances reported are not based on real data from a commercial plant, since Carbon Engineering’s first commercial plant is still under development and only the pilot plant (which tests only certain high-risk units) is currently running. The energy data reported are based on simulations and models of the individual units’ operations that are ultimately fed by a combination of vendor data and data from the pilot plant [29]. On the other hand, a recently published Climeworks’ LCA study reports the actual measured values of energy use in their commercial plants in Hinwil (Switzerland) and Hellisheidi (Iceland) on the basis of daily averaged data. To run such plants, it is used an electric power of 700 kWh/tCO2 and a heat supply (below 100 °C) of 11.9 GJ/tCO2 (in comparison with the 2.77 GJ/tCO2 thermal energy required by a power plant with amine CCS [44]). In a future scenario based on Climeworks’ energy targets, taking into account heat recovery and optimization potential, the electricity use is expected to decrease to 500 kWh/tCO2 and the heat supply to 5.4 GJ/tCO2 [30].
Sorbent production is another challenge of DAC technologies, not only in terms of availability but also regarding the energy needs. A sorbent-focused techno-economic analysis concluded that sorbents should be able to stand tens, if not hundreds of thousands of regeneration cycles to be economically viable [34]. The cost can be optimised by setting an appropriate cycle time on the basis of the existing correlation with loading capacity. The study highlights cycle duration and stability of the sorbent (normally neglected) as key parameters to consider in a DAC cost analysis [34]. Solid adsorption technology has gained ground thanks to the need of lower temperatures for sorbent regeneration [25,49]; however, the liquid absorption technology also presents a good potential for commercialisation if more efficient absorbents with lower regeneration costs can be developed [53]. Regarding liquid DAC, the current market for the production of sodium or potassium hydroxides (today only obtained as a side product of chlorine) would allow capturing 300–500 MtCO2/year. However, sodium hydroxide production is a very energy-intensive process, requiring 611–1055 kWh/tCO2 captured, more than twice the electricity needed to operate a DACCS plant [19]. For solid DAC, according to an LCA study using data from the currently operating Climeworks plants [30], the energy consumption of the production of six adsorbents evaluated ranges between 36 and 188 kWh/tCO2 captured (including production and end of life). Currently, the plants’ sorbent consumption (amine on silica) is 7.5 g/kgCO2 captured; however, a reduction to 3 g/kgCO2 captured is foreseen in the future. The study concluded that to capture 1% of the global annual CO2 emissions in 2019 (0.368 GtCO2/year), approximately 18% of the ethanolamine and synthetic amorphous silica (primary materials) produced globally today would be needed. However, ethanolamine needs to be further processed to produce the amine used for the sorbent (polyethyleneimine), whose current market size is considerably small, requiring, in this case, a 10-fold increase to sustain the DAC capacity considered. Nonetheless, despite the small market size of polyethyleneimine today, the production scale is well-established for polymeric materials, so no limitation is foreseen in this regard. In terms of energy consumption, the production of 1 kg of polyethyleneimine requires 2.35–12.6 MJ of heat from natural gas and 0.27–0.42 kWh of electricity [30].
2.3. Carbon Footprint
It is important to analyse the full lifecycle of a DAC process to evaluate the real carbon removals. The carbon capture efficiency is defined as the net amount of CO2 captured by the plant since the amount of carbon captured from the atmosphere is partially offset by the emissions from adsorbent production, plant construction, end of life, and operation of the DAC plant (e.g., energy supply) [54]. The type of energy used is a key parameter to achieve net carbon removals using DAC, since electricity is the largest contributor to the carbon footprint and presents a linear dependency [30,54]. The carbon removal efficiency is the ratio of the total avoided CO2 emissions by the system to the CO2 captured, and it is calculated adding the emissions due to CO2 transport and storage to the carbon capture efficiency [30,54].
An LCA from Climeworks’ first commercial plants in Hinwil (Switzerland), which uses electricity and waste heat, and in Hellisheidi (Iceland), which uses geothermal energy, shows that these two plants can provide CO2 with a negative carbon footprint from cradle-to-gate today using waste heat or electricity with a carbon footprint lower than 500 gCO2e/kWh when using a heat pump [30]. These plants result in a carbon capture efficiency from cradle-to-gate of 93.1% and 85.4%—carbon footprint of −0.93 and −0.85 tCO2e/tCO2 captured, respectively—increasing in the future to 95% and 88.8% considering certain performance targets [55]. The carbon footprint of plant construction and adsorbents production play a more important role in scenarios that use clean electricity, as in the case of the plant in Iceland where they contribute up to a total of 59% to the carbon footprint of the captured CO2. The carbon capture efficiency reaches its maximum when using wind power, with values between 95.1 and 96.4% depending on the heat source. When looking at the full LCA from cradle-to-gate, negative emissions can be achieved when the final destination of the CO2 is permanent underground storage. In this case, storage has a low impact and both carbon removal and carbon capture efficiencies are very similar. If the CO2 is used for the production of synthetic fuels (therefore reaching carbon neutrality only in the best-case scenario), the LCA reveals that only in countries with a grid carbon footprint lower than ~120 gCO2e/kWh, synthetic methane produced using CO2 from DAC would have a lower carbon footprint than fossil-based methane [30]. Such is the case today in Iceland, Norway, Sweden, and France.
For the liquid DAC, considering the full lifecycle with permanent storage and electricity from a natural gas combined-cycle plant with a carbon footprint of 500 gCO2e/kWh, the carbon removal efficiency is estimated at 62%. If solar power is used to generate the required electricity, the efficiency increases to 84% [54]. Two more scenarios are analysed considering variations in a number of parameters, including the carbon footprint of the electricity source. In the optimistic scenario (using PV), the carbon removal efficiency is estimated at 92%, while in the pessimistic scenario (using coal), it is 10% [54]. Most of the emissions are caused by the energy demand (65% for electricity and 32% for heat), while water and material use contribute less than 1% to the total emissions. A second LCA analyses a DAC system on the basis of data from Carbon Engineering’s pilot plant paired with Fischer–Tropsch synthesis (FT) to produce synthetic diesel. Assuming an electricity carbon footprint of 13 gCO2e/kWh (hydropower-based electricity), the estimated emissions are 0.51 tCO2e/tCO2 captured or 29 gCO2e/MJ including combustion [56]. To produce synthetic fuels with a lower carbon footprint than conventional petroleum diesel, the electricity carbon footprint should be lower than 139 gCO2e/KWh [56]. It is important to note that an oxy-fired natural gas calciner is used in this process, generating additional CO2 emissions from natural gas, which are also captured and combined with the CO2 from the air to produce the new fuel. If an electric calciner is used, the carbon footprint of the fuel would be reduced to 12 gCO2e/MJ. A second study analysing the production of FT fuels with Carbon Engineering’s data and different energy sources obtained plant efficiencies between 22.6 and 36.5% and CO2 removal efficiencies between 31 and 68.3% [57].
3. Synthetic Fuels Pathways
3.1. Definition and State of the Art
CO2 captured from DAC can be coupled with hydrogen to produce synthetic fuels, also named power-to-liquids (PtL), power-to-gas, or power-fuels when hydrogen comes from electrolysis [58]. When such fuels are produced from renewable sources, they offer an alternative to biofuels to decarbonise the transport sector towards the most recent targets imposed by the European Commission [59]. In the EU context, these fuels fall under the category of renewable fuels of non-biological origin (RFNBOs), according to the recast Renewable Energy Directive (RED II) [60]. They are defined as a category of fuels produced from hydrogen derived from renewable energy (except biomass sources) in the form of heat or electricity and from CO2 derived from fossil sources, such as flue gases, DAC technologies, and other non-renewable and natural sources. These fuels can be fully drop-in fuels or chemicals, not requiring further conversion/upgrading steps to be used in the market. They do not require dedicated infrastructures for distribution and storage [61], although no composition or blending standards have been developed so far.
Even though synthetic fuels conversion technologies have been developed for decades, today there are only a relatively limited number of these plants, most of them still at demonstration scale [62]. Among the available technologies developed so far, the output fuels could be methane for natural gas vehicles and/or directly injected into the natural gas grids; synthetic drop-in liquid fuels for gasoline, diesel, or jet fuel (also including other hydrocarbons, depending on the marked demand); or other fuels/chemicals as alcohols or ammonia. Hydrocarbons produced from synthesis processes are mainly paraffins, which lead to cleaner combustion than their fossil counterparts and contain an aromatic fraction [63]. Thus, they can potentially meet more stringent limits than the current commercial blends [64], making them really interesting to meet both environmental targets in terms of GHGs emissions and pollutants reduction. Methanol as an energy carrier or chemical can also be produced, which could be of high interest for biodiesel production and other applications. Today, biodiesel is produced mainly using fossil-derived methanol that impacts negatively on its carbon footprint [65]; therefore, adding a fully renewable component along its supply chain will contribute significantly to reducing the carbon footprint. Moreover, methanol could also be used as a blending component for maritime fuels [66]. Other pathways to produce synthetic fuels are possible but still at early stages of development, such as direct solar fuel synthesis and others. Although 220 projects of synthetic fuels have been identified in 20 different countries worldwide, the current facilities in the EU are still at demonstration scale at approximately TRL 6 [62]. France and Germany are the leading countries planning to install approximately 500 MW of capacity by 2025 [67]. It is essential to provide adequate incentives for the development of RFNBOs to become cost-competitive; for this reason, the upcoming Horizon Europe programme [68] will provide more support for scaling up and building demonstration plants. In parallel, other programs, such as the Innovation Fund [13], Connecting Europe Facility [69], InvestEU [70], and EU Catalyst partnership [14], will contribute to the sector development towards the EU targets for 2030.
When it comes to fuel production using CO2 from DAC, the studies in the literature are scarce. Two studies based on life cycle assessments have been performed on the production of FT-derived fuels using data from Carbon Engineering’s DAC pilot plant (liquid-based DAC), analysing the carbon footprint of the new fuel, the amount of fuel produced, the cost and the plant, and CO2 removal efficiencies [56,57]. A similar life cycle assessment has been performed using data from Climeworks plants (solid-based DAC) for the production of methane [30]. More details of these studies can be found in Section 2.3. Methanol production using DAC is also analysed in the literature as a valuable compound that can be used as a fuel and chemical. One of the studies analyses a wind-DAC-to-methanol stand-alone system, obtaining efficiencies of ~50% and a cost of 750–800 EUR/tonne methanol [71]. The second study focuses on evaluating how synergies between DAC and the synthetic fuel production (heat and process integration and use of by-products) affect the efficiency of the whole system, concluding that solar-to-fuel efficiencies up to 10.2% can be reached compared with the 8.8% efficiency when no synergies are implemented [72].
3.2. EU Legislation
Hydrogen is considered one of the main pillars of Europe’s decarbonisation strategy for the near future, offering an alternative solution for transport, industrial applications, or synthetic fuel production. However, without reliable systems and infrastructures dedicated to hydrogen generation, new initiatives towards fuels production are still limited. According to the European Green Deal [8], hydrogen is considered today one of the main energy vectors towards EU carbon neutrality by 2050; however, some techno-economic, sustainability, and legislative barriers do still exist. In an effort to close this gap, the European Commission promoted the sector development with the communication “A hydrogen strategy for a climate-neutral Europe” [73], which recently updated its targets to more ambitious achievements through the RePowerEU plan by setting the objective to produce 10 Mt of domestic hydrogen and import another 10 Mt by 2030 [11]. To attain this goal, the Commission announced the creation of a new European Hydrogen Bank to guarantee the future purchase of hydrogen and create a market by investing EUR 3 billion [74]. The prospective role of hydrogen is also recognised in the Member States’ Recovery and Resilience Plans, with a central role in the Recovery and Resilience Facility (RRF) [75]. The first Important Project of Common European Interest (IPCEI) has also been approved by the Commission in July for EUR 5.4 billion of investments, and it involves 15 Member States [76]. In addition, the “Next Generation EU” recovery fund [77] (to support the member states after the Covid crisis) is stimulating the development of new clean technologies, including hydrogen, to boost its market uptake.
The Renewable Energy Directive recast (EU 2018/2001) or REDII [60] sets the framework towards targets and sustainability criteria for alternative renewable transport fuels, including Renewable Fuels of Non-Biological Origin (RFNBOs), that can be produced using additional renewable energy production. Otherwise, if grid electricity is used, a reliable methodology (recently published in two delegated acts integrating the RED II [78,79]) has been proposed to properly assess the real carbon footprint of such fuels. RFNBOs are defined by the European Commission as “liquid and gaseous fuels the energy content of which is derived from renewable sources other than biomass”, and according to the new proposal for the revision of RED II released in July 2021, they can be counted towards Member States’ targets of renewable energy only if the GHG emissions savings from their use are at least 70% compared with a fossil fuel comparator (FFC) set at 94 gCO2e/MJ [10]. The proposal for the revision of RED II includes the renewable energy additionality criteria as well as the GHG methodology to assess emissions from RFNBOs. This revision also replaces the 14% target of renewable energy in transport (as set by RED II) to a 13% GHG intensity reduction target by 2030. It also includes sub-targets, such as a 2.6% share (on an energy basis) of RFNBOs in the transport sector and a 50% share of RFNBOs in hydrogen consumption in industry by 2030. Moreover, the revision excludes the use of multipliers, thus resulting in a real target that guarantees equal volumes of renewable fuels replacing fossil fuels. The only multiplier maintained is based on a figure of 1.2× for advanced biofuels and RFNBOs in aviation and maritime sectors. Finally, RFNBOs can also contribute to the targets imposed by ReFuel EU and FuelEU Maritime [80,81], which set a target of 63% of SAFs in the commercial jet blend and 75% GHGs emissions reduction intensity by 2050.
3.3. Case Studies
This study selects three pathways for synthetic fuels production using hydrogen produced from electrolysis and CO2 captured from DAC, followed by the synthesis reactions (i.e., stand-alone thermochemical reactors as those used in the chemical industry). Exhaustive descriptions of the technologies assumed in this work are reported and discussed in the literature [82,83].
This study considers only specific selected pathways focusing on synthetic methane and methanol. A third case derived from methanol synthesis to produce synthetic diesel is also analysed. Diesel fuel has been selected as the main representative one for the category of liquid hydrocarbons. The rationale behind this concept lies in the fact that market demand can rapidly change, especially during the last years following the COVID-19 crisis and more recently with the war in Ukraine. This solution would also cover a broader range of products compared with a traditional oil refinery, with a faster adaptation. In particular, this concept would allow to shift between methane/methanol and hydrocarbons production with a limited capital investment (CAPEX), since synthetic gas and liquids production affects only 15% and 17% of the total plant investment, respectively [61]. The conversion pathways analysed in this study are summarised in Figure 1.
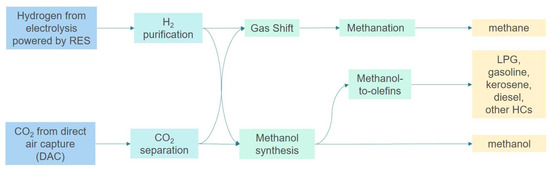
Figure 1.
Synthetic fuels production pathways considered in this study.
4. Data and Methodology
LCA data from solid DAC plants (Climeworks) are used in the calculations of the carbon footprint and the production of the three synthetic fuels [30]. LCA data from liquid DAC are not considered in this study since current configurations always consider a certain input of natural gas for heat [29], while the focus of this analysis is to evaluate the different options to power DAC using only electricity. The production of three fuels (methane, methanol, and diesel), using CO2 from DAC and hydrogen via electrolysis, is evaluated according to the reactions below:
Methane production through methanation reaction: CO2 + 4H2 => CH4 + 2H2O
Methanol production from H2 and CO2 synthesis: CO2 + 3H2 => CH3OH + H2O
Diesel production from methanol as direct dimethyl ether (DME) synthesis [84]:
2CH3OH => CH3-O-CH3 + H2O
Olefin synthesis: CH3-O-CH3 => (CH2)2 + 2H2O
Oligomerization: 0.5 n (CH2)2 => CnH2n
Hydrogenation: CnH2n + H2 =>CnH2n + 2
A number of cases and scenarios with projections are considered in the analysis. The first case assumes the use of grid electricity to power DAC and produce hydrogen (grid case); the second case assumes the use of PV and wind energy for DAC and hydrogen production (PV&Wind case); and the third case assumes DAC powered by grid electricity and hydrogen produced using PV and wind (hybrid case). Two EU energy scenarios, “EU Reference Scenario 2020” and “Fit for 55-MIX” (referred as REF2020 and FF55 hereafter) are considered for the current and future electricity generation and grid carbon footprint at the EU country level [10,85]. The REF2020 scenario builds on EU and Member State policies concerning energy, transport, and climate adopted as of the end of 2019, including some EU policies considered adopted at the end of 2019, although not published until 2020 [85]. The FF55 scenario is based on the “Fit for 55” package that aims to reduce net GHG emissions by at least 55% by 2030 compared with 1990. More specifically, the MIX scenario is defined to do this by relying on a carbon price signal extension to road transport and buildings and a strong intensification of energy and transport policies [10]. The year 2020 is considered to be the current status and the common starting point for both scenarios. The FF55 scenario provides projections until 2030; therefore, only the 2030 values are presented for this scenario. Instead, REF2020 provides projections until 2050; therefore, the values for 2030 and 2050 are also presented for this scenario. It is assumed that the synthetic fuels are produced in Europe near the fuel markets; therefore, transport of synthetic fuels into Europe is not evaluated in this study. The carbon footprints of the fossil equivalents for the three synthetic fuels analysed are also shown in the results for comparison. The REDII threshold is also included, which represents 70% GHG emissions reduction compared with the FFC.
Table 1 summarises the data with the sources used in the analysis.

Table 1.
Data used in the analysis.
For the cases in which PV and wind electricity are assumed as the energy sources (either to power DAC or to produce hydrogen), a combined weighted average carbon footprint is calculated, considering the share of PV and wind in the energy mix and the PV and wind carbon footprint data obtained from the literature [86,87].
Figure 2 presents the share of PV and wind in the energy mix, the combined carbon footprint, and the grid carbon footprint for the REF2020 and FF55 MIX scenarios. As it can be observed, the grid carbon footprint (represented by the size of the circles) decreases in 2030 (for both scenarios) and 2050 compared with REF2020 for most of the countries. The combined PV&Wind share in the grid mix is expected to increase in the future in all the member states; however, the carbon footprint of the combined PV&Wind mix (shown on the x-axis) will change on the basis of the share of these two sources. The countries with more wind energy installed will benefit from a lower PV&Wind combined carbon footprint since the carbon footprint of wind energy is lower than PV in all countries, according to the literature sources used [86,87].
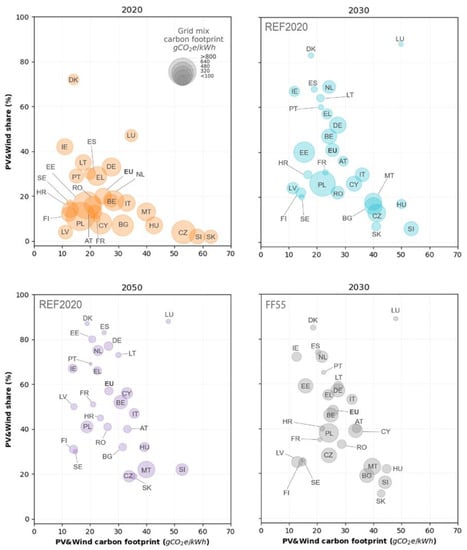
Figure 2.
PV&Wind share in the grid mix and its combined carbon footprint for the EU member states in 2020 (present), 2030 REF2020, 2050 REF2020, and 2030 FF55. The circles’ sizes indicate the grid mix footprint.
To calculate the CO2 emissions from the methanol-to-diesel conversion pathway, the calculation scheme proposed in RESD1 from JECv5 has been considered [84]. The model assumes a downstream process to methanol production, considering methanol and hydrogen as feedstock, reacting together in a series of transformations towards paraffins production (in the range of diesel fuels). The formulae used is reported here as follows:
where the corrective factors consider the stoichiometric ratios of the multiple reactions that occurred, reaction efficiency, and reactor geometry. Further details of the reaction schemes and the technology deployed have been recently reported in the literature [91]. Finally, the system boundaries are based on a cradle-to-gate approach; hence, the carbon intensity of the selected fuel is calculated up to the plant outlet and evaluated in grams of CO2 equivalent per MJ of fuel.
Diesel emissions [gCO2e/MJ] = Methanol emissions × 1.113 + Hydrogen emissions × 0.0245
5. Results
This section presents the results of the carbon footprint analysis for the direct air capture process and the production of three synthetic fuels: methane, methanol, and diesel. The results are expressed at EU country level for the years 2020, 2030, and 2050 for three different cases of energy sources (grid, PV&Wind, and hybrid) and two scenarios (REF2020 and FF55).
The carbon footprint of the DAC process is shown in Figure 3, considering the use of the grid and PV&Wind as energy sources. In 2020 using the grid mix, there are five countries in which the carbon footprint of DAC is above zero (Bulgaria, Cyprus, Czech Republic, Estonia, and Poland) with values ranging from 0.007 to 0.747 tCO2e/tCO2 captured. The high carbon intensity of the grid in these countries due to the large presence of fossil fuels, currently does not allow them to obtain negative emissions using DAC. In 2030 for the REF2020 scenario, all countries except Poland can obtain negative emissions using DAC, and in 2050 REF2020 and 2030 FF55, all countries deliver negative emissions. Sweden is the country with the highest negative emissions potential using DAC, obtaining a carbon footprint of −0.864 tCO2e/tCO2, already captured in 2020 using the grid (37 gCO2e/kWh) thanks to the high penetration of hydropower in the country’s mix. It is followed by France, Denmark, and Spain, for which an important presence of nuclear energy and renewables decrease the carbon footprint of the grid mix. The EU aggregated carbon footprint of DAC using the grid is −0.407, −0.586, −0.708, and −0.794 tCO2e/tCO2 captured in 2020, 2030 REF2020, 2030 FF55, and 2050 REF2020, respectively. A grid carbon footprint of 468 gCO2e/kWh is the threshold above which the DAC carbon footprint starts being positive. This is in line with the results presented in [30]. When using PV&Wind as the energy source for the DAC process, all countries are able to obtain negative emissions of at least −0.81 tCO2e/tCO2 captured starting already in 2020, with little but variable changes in the future depending on which of these two energy sources is further developed in each country. The EU aggregated carbon footprint of DAC remains at approximately −0.89 tCO2e/tCO2 captured for all the years and scenarios. The country values of DAC carbon footprint for the different scenarios and years can be found in detail in Table S2 of the Supplementary Material.
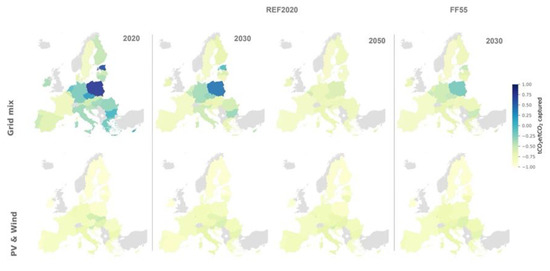
Figure 3.
Carbon footprint of DAC (tCO2e/tCO2 captured) in the EU member states for the grid mix and PV&Wind cases for the years 2020, 2030 REF2020, 2050 REF2020, and 2030 FF55.
The production of synthetic methane, methanol, and diesel using DAC and hydrogen from electrolysis is also analysed.
Figure 4 shows the CO2 emissions throughout the different stages of methanol production: hydrogen production, CO2 capture using DAC, fuel synthesis (negligible compared with the other stages and, therefore, not shown in the figure), and combustion. The equivalent figures for methane as well as the results for the hybrid case of methanol can be found in the Supplementary Material (Figures S1 and S2) since they follow a similar logic (the different stages for diesel are not included since the methanol pathway has been chosen for its production). For the year 2020 when using the grid to power DAC and produce hydrogen, hydrogen production is clearly the most important contributor to the CO2 emissions due to the carbon intensity of the grid. It represents up to 77% of the total emissions in Poland (527 gCO2e/MJ). As seen in Figure 3, in Bulgaria, Cyprus, Czech Republic, Estonia, and Poland, DAC contributes with positive emissions, and in the case of Poland, these are almost equivalent to the emissions from combustion (69 gCO2e/MJ). At the EU level, hydrogen production contributes, with 75% to the total emissions (170 gCO2e/MJ). In this case, it is important to take into account that the total emissions are reduced by 16% due to the negative emissions from DAC. In Sweden, on the other hand, the negative emissions from DAC almost compensate for all the combustion emissions, which in combination with the low emissions from hydrogen production, result in a total carbon footprint of 30 gCO2e/MJ for methanol. In 2030, the carbon footprint is reduced significantly compared with 2020; such is the case for Croatia, Lithuania, and Greece, which present a reduction of more than 70%. The values for FF55 2030 are indicated along with the REF2020 scenario in Figure 4, represented by thinner dashed bar graphs. The biggest reduction compared with REF2020 is observed in countries with the highest carbon footprint. In 2050, the carbon footprint of hydrogen production becomes smaller than combustion emissions in all countries except for Malta and Belgium, which do not appear to have a significant reduction of grid carbon intensity throughout the years, always staying close to 2020 values. When looking at the case of using PV&Wind for DAC and hydrogen production, the total carbon footprint of methanol production is rather stable for all countries, ranging from 13 to 45 gCO2e/MJ for all years.
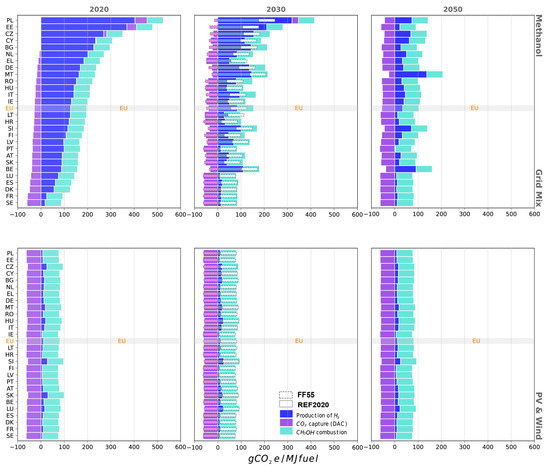
Figure 4.
Methanol production emissions for the grid mix and PV&Wind cases; REF2020 and FF55 scenarios for 2020, 2030, and 2050. The 2030 graph includes both scenarios; the FF55 values are indicated with dashed bars and the REF2020 values with solid bars.
In Figure 5, the total carbon footprints of synthetic methane, methanol, and diesel for the different years, scenarios, and cases are presented. The carbon footprints of the fossil equivalents are also included in the figures for comparison (natural gas (64 gCO2e/MJ), fossil methanol (91.6 gCO2e/MJ), and diesel (92.2 gCO2e/MJ)). The REDII threshold for RFNBOs is also included, which represents the 70% GHG emissions reduction threshold (i.e., 28.2 gCO2e/MJ) compared with a fossil fuel comparator (FFC) set at 94 gCO2e/MJ. Fuels produced at a lower carbon intensity can potentially count towards the REDII targets as RFNBOs. The current REDII LCA methodology does not account for emissions from construction, decommissioning, or waste disposal of the infrastructures; however, the emission factors from PV and wind used in this study consider a wider range of upstream emissions [86,87]. Therefore, the results obtained in this study in terms of compliance with the REDII threshold are considered conservative. The values presented in the figure can be found in the Supplementary Material (Tables S3–S5).
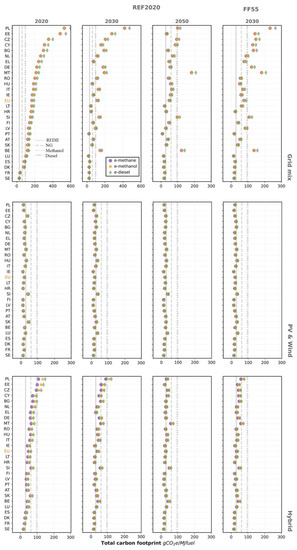
Figure 5.
Carbon footprint of e-methane, e-methanol, and e-diesel for the different cases (grid mix, PV&Wind, and hybrid) and years/scenarios (2020, 2030 REF2020, 2050 REF2020, and 2030 FF55). The fossil equivalents (natural gas, methanol, and diesel) and the RED II threshold are also included.
Using the grid in 2020, only a few countries can produce the fuels considered with a lower carbon footprint than their fossil equivalent. This is the case for Sweden, France, Denmark, and Spain for methanol; Sweden, France, and Denmark for diesel; and Sweden and France for methane. With regard to the REDII threshold (28.2 gCO2e/MJ), currently only Sweden would produce methane below this value (27.3 gCO2e/MJ). The maximum grid carbon footprints that allow for production of each of the fuels with lower or equal carbon footprint as their fossil equivalents are 96 gCO2e/kWh for methane, 137.6 gCO2e/kWh for methanol, and 121.3 gCO2e/kWh for diesel. To comply with the REDII threshold, the maximum grid carbon footprints are 38.8 gCO2e/kWh for methane, 35.3 gCO2e/kWh for methanol, and 30.2 gCO2e/kWh for diesel. As a comparison, an LCA from Carbon Engineering (liquid DAC) obtained a carbon footprint of 29 gCO2e/MJ for FT-derived diesel when using electricity from a grid with a carbon intensity of 13 gCO2e/kWh, and if the plant were using an electric calciner, the carbon footprint would be reduced to 12 gCO2e/MJ [56]. Instead, our results show a carbon footprint of 18 gCO2e/MJ when using the same electricity carbon intensity (for solid DAC). In 2030 REF2020, ten more countries can produce at least one of the three fuels analysed with a lower carbon footprint than their fossil equivalent, although the EU average remains above all the fossil values. However, for 2030 FF55, not only are these countries able to produce two or the three fuels evaluated with lower emissions than their fossil equivalent, but also three more countries as well as the EU average for methanol and diesel (78 and 88 gCO2e/MJ) fall below the fossil thresholds. Regarding the RED II threshold in 2030 REF2020, Sweden, France, Denmark, Luxembourg, and Portugal are compliant for methane and methanol production, while only Luxembourg and Portugal remain below the threshold also for diesel. In comparison, for FF55, these five countries and Spain are all able to produce the three fuels with a carbon footprint below the RED II threshold, while Croatia can do so for methane and methanol only. Finally, in the year 2050 REF2020, a majority of the countries can produce at least one fuel, and in many cases, the three fuels, with lower emissions than their fossil equivalent. However, with regard to the REDII threshold, the results are very similar to 2030 FF55. The EU average, on the other hand, does not comply with the REDII threshold for any of the fuels, years, or scenarios, presenting the lowest values in 2050 REF2020 (48.9, 51, and 57.6 gCO2e/MJ for methane, methanol, and diesel, respectively).
In the case of using PV&Wind as the energy source, all countries are able to produce the three fuels with lower carbon emissions than their fossil equivalent for all the years. In addition, most of the countries can comply with the REDII threshold, depending on the year, the fuel, the scenario, and, ultimately, on the share of wind and solar energy, with values ranging between 10.8 and 51.2 gCO2e/MJ. In 2020, Slovakia, Slovenia, Hungary, Malta, and Czech Republic are not able to produce any of the fuels with a lower carbon footprint than the REDDII threshold. Throughout all the years and scenarios, Slovenia, Hungary, and Malta are the only countries in which the production of all three fuels exceeds the REDII threshold. The EU average, however, complies with it for all fuels, years, and scenarios, with values ranging between 19.3 and 25.8 gCO2e/MJ.
In comparison with the grid case, the hybrid case (that assumes grid use for DAC and PV&Wind for hydrogen production) allows to more countries with higher grid carbon footprints to produce fuels in compliance with the REDII threshold, since hydrogen production is the most limiting component in terms of carbon emissions. In contrast to the “grid case”, the EU average in this case is able to produce methane in 2050 with lower emissions than the REDII threshold.
6. Additional Considerations
6.1. CO2 Transport and Permanent Storage
As an alternative to the production of synthetic fuels, the CO2 captured using DAC can also be stored permanently underground producing negative emissions overall from cradle-to-gate. The two main CO2 storage options are in saline formations and existing oil fields for Enhanced Oil Recovery (EOR). Saline formation storage has been used for the past 25 years in the North Sea, with a total of more than 20 Mt of CO2 stored. Storage with EOR has been taking place for almost 50 years, mainly in the U.S. [92,93]. Other options for CO2 storage are in depleted oil and gas fields (at demonstration level) [93] as well as storage in Basalt and ultramafic rocks and storage in coal seams through Enhanced Coal Bed Methane (ECBM) production [94]. The conversion of CO2 into an inactive compound with a high combustion point, is considered a long-term CO2 storage solution that promotes sustainability by reducing emission risks at later stages [24]. According to the IPCC, when the geological reservoirs fulfil certain requirements (e.g., proper selection and management), they are highly likely to retain more than 99% of the sequestered CO2 over 100 years and likely to retain 99% over 1000 years [95].
Currently, CO2 is compressed and transported mainly through pipelines. Pipeline transportation is a safe and well-established means of transportation that can be optimal in the case of large volumes, with capacities between 1 and 5 million tonnes per year and for distances between 100 and 500 km [24]. CO2 can also be transported by train, ship, or truck. Large-scale transportation by ships and rail is, however, a practice not yet applied [94]. Ship transport becomes more cost effective for long distances (>2400 km) over pipelines due to its advantages in terms of flexibility and scalability. On the other side, CO2 for ship transport needs to be liquefied, increasing the overall costs.
In Europe, the CCS Directive constitutes the regulatory framework across EU countries for the implementation of CCS technologies [96]. In 2013, the availability of permanent geological storage capacity in Europe was estimated at more than 300 Gt of CO2 (more than 200 GtCO2 in the North Sea) or 117 GtCO2, as a more conservative capacity [97]. To put it in context, the total CO2 emissions from EU power generation and industry in 2013 were approximately 2.2 GtCO2. For instance, “Longship” is a full-scale CCS value chain project announced by the government of Norway in 2020, planning to capture 800 thousand tonnes of CO2 per year from industrial sources. The transport and storage facilities, developed by Northern Lights, will transport by ship and pipelines up to 1.5 million tonnes of CO2 per year to be stored offshore under the North Sea. The first phase of the project will be completed in 2024, while the second phase is foreseen to transport an additional capacity of 3.5 million tonnes CO2 per year [98,99].
6.2. Area and Water Requirements
An important advantage of DAC over other NETs, such as BECCS, is that it requires a considerably lower amount of water (5–20 vs. 545–682 tH2O/tCO2 captured) and land (0.1–1.5 vs. 2731–16,362 m2/tCO2 captured) [19], making it specially suited for water and land scarce regions. However, DAC’s land and water requirements are also highly dependent on the energy source and technology used.
Table S6 in the Supplementary Material summarises the water and land requirements gathered from the literature for the different DAC technologies and energy sources. The water requirements depend on the ambient air temperature and humidity, while the land footprint is higher for DAC plants using PV and wind as energy sources. For instance, to capture 1% of global CO2 emissions (0.368 GtCO2/year), 3683 DAC plants covering an area of 29 km2 would be needed. The total area increases by 445 km2 and 4450 km2 if wind and PV are used as energy sources, respectively. In comparison, BECCS would require at least 100,000 km2 [30].
6.3. DAC Costs and the Future CO2 Pricing Boundary Condition for Technology Costs
There is a large uncertainty regarding current and future DAC costs due to the initial stages of deployment. The current cost that has been reported in the literature is based on some operating facilities, pilot plants, and various simulations [24,29,45]. Most of the projections anticipate a technological learning potential similar to PV technology development in the early 2000′s. However, many of the underlying assumptions are different, such as the initial cost and the energy sources. The learning rate approach that calculates the cost decrease rates according to the capacities installed (not based on the time series) is more adequate, since without learning from installation experiences, time alone will not lower the cost components. However, with this approach, the projected future costs decrease ignores the fact that there will be a need for enormous financial aid at the beginning of the learning curve until enough capacity is installed. To put DAC cost in context, other nature-based carbon removal solutions, such as reforestation, today costs less than 47 EUR/tCO2, although with a considerably higher land and water use. Carbon price, on the other hand, provides a proxy value of the cost of current available carbon removal solutions (depending on the sectors covered by the EU ETS in the future). If DAC remains at a much higher cost compared with the carbon price, it will not be able to deliver the expected CO2 removal at a competitive cost.
Figure 6 presents the EU ETS carbon price forecast and the DAC cost projections from various sources derived from the literature. As of August 2022, the EU ETS carbon price is 83.84 EUR/tCO2, having peaked at 96.99 EUR/tCO2 in February 2022 [100], significantly higher than some projections carried out in 2016 (~15 EUR/tCO2). More recent projections from the year 2022 forecast an increasing EU ETS carbon price of 85.45 EUR/tCO2, on average, between 2022 and 2025 and 99.63 EUR/tCO2 between 2026 and 2030, caused by the final stages of a number of EU policy proposals from the “Fit for 55” package [101]. To become cost competitive (cost reductions to the level of the carbon price) and reach large-scale deployment, DAC technologies require a decrease in cost through technological learning and a higher future carbon price. As depicted in Figure 6, even following the most optimistic learning curves, the earliest cost competitiveness of the technology is not expected to arrive before 2035. It is important to add that today, only Climeworks is providing a real price on permanent carbon removals through DAC selling credits at 1000 EUR/tCO2 [45], far more expensive compared with most of the values in the literature, as can be observed in Figure 6. One important reason for the high cost is that CO2 markets are limited and cannot provide enough revenue to offset the capture cost [102]. Addressing this gap between DAC cost and carbon price will likely involve public intervention in the early stages of DAC deployment. This could include re-investing a portion of the revenues from the carbon market, as is the case of the Innovation Fund, which uses revenues from the EU ETS [13]. The ambitious EU funding programs mentioned previously (REPowerEU and Innovation Fund) set a good example in this policy direction that could be followed by other key international players. As carbon capture is a public benefit, the international diplomacy to include all stakeholders is vital in the early financing. This will provide the necessary incentives to bridge the cost gaps at the initial stages of the technology learning until DAC becomes a profitable option for private investment based on the future carbon price. According to some studies, the most optimistic DAC technology scenarios can become feasible for carbon prices over 80 EUR/tCO2 [103].
Another aspect to explore, one that may affect future DAC deployment, is transport and storage cost for permanent storage. The cost of CO2 storage depends on the location and type of storage site, the reservoir capacity, and the injectivity (the ratio of injection rate per unit of pressure difference between the injection pressure and reservoir pressure), ranging between 2 and 20 EUR/tCO2. Large, onshore, depleted oil and gas fields with high injectivity are at the lower end of the range, while small, offshore, deep saline aquifers with low injectivity are at the higher end [104]. The cost of CO2 transport, on the other hand, depends on capacities and distance, with pipelines exhibiting the widest range between 1.5 and 43.6 EUR/tCO2 and between 3.4 and 51.7 EUR/tCO2 for onshore and offshore storage respectively. Truck and railway transportation costs are estimated at approximately 13–7.3 EUR/tCO2, respectively, while cost of shipping transportation varies between 11 and 20 EUR/tCO2 [104].

Figure 6.
Cost of DAC from the literature and EU ETS carbon price with future projections (light and dark colours refer to maximum and minimum values, respectively, of a cost range). Sources: DAC cost [6,24,27,29,31,44,45,105,106,107,108,109] and EU ETS carbon price [100].
Figure 6.
Cost of DAC from the literature and EU ETS carbon price with future projections (light and dark colours refer to maximum and minimum values, respectively, of a cost range). Sources: DAC cost [6,24,27,29,31,44,45,105,106,107,108,109] and EU ETS carbon price [100].

6.4. DAC Projects
Currently, there are 19 operational direct air capture plants in the world concentrated in Europe, U.S.A. and Canada [6]. Most of them are selling or are planning to sell the CO2 captured to the market for various applications [6,44,47,110]. All these plants together are capturing, in total, more than 10 ktCO2/year by the end of 2021 [6].
In addition to Climeworks, Carbon Engineering, and Global Thermostat, several new companies and start-ups have been emerging in the last few years, focusing their efforts on reducing cost and energy use [18]. Details on the existing and planned DAC projects around the world can be found in Tables S7–S10 of the Supplementary Material.
7. Discussion
A number of limitations were encountered during this analysis for which future work could help improve the results. Firstly, the availability of up-to-date data on PV and wind carbon footprint in the literature is very limited, with only one overall value for wind power from 2013 and country data for PV from 2011. Further work could focus on developing up-to-date and future projections of PV and wind carbon footprints, which would increase the accuracy of the results. Future work could also focus on geospatial analysis of the optimal locations for DAC and hydrogen production according to future RES availability in the different countries. Regarding fuel production, future work could expand this study, analysing additional fuels conversion pathways targeting the EU mid-term policy scenarios for the transport sector, such as liquid hydrocarbons ready to be used in hard-to-decarbonise sectors, such as aviation, shipping, and heavy road freight transport.
Most of the future scenarios trying to limit global temperature to 1.5 °C above pre-industrial levels already include some sort of carbon removals, including DAC. The high uncertainty surrounding DAC, especially in terms of energy use, scale-up capacity, and cost, creates some scepticism when relying upon this technology in future scenarios to reduce emissions since a possible failure to meet the deployment targets could lead to a global temperature overshoot. In Europe, the EU Green Deal has set the path towards net zero emissions by 2050, and the latest REPowerEU plan is accelerating the green transition. The “Fit for 55” scenario already considers the introduction of DAC in 2035, which implies that more large-scale demonstration plants will need to be deployed to reduce the cost and reach maturity. Currently, 10 ktCO2/year are being removed with DAC globally, and the largest commercial plant is removing 4 ktCO2/year (with two future plants in the pipeline of 35 ktCO2/year and 1MtCO2/year). In contrast, 200 MtCO2 are expected to be removed from DAC in the EU to reach carbon neutrality by 2050, and the aspirational goal for EU sustainable carbon cycles is to remove 5 MtCO2/year by 2030. The gap between current DAC capacities and CO2 removals targets is clearly very large. To overcome this challenge and enable the future deployment of DAC at scale—which will also contribute to reducing the cost overtime—policy development and governmental support in the early stages are key. A few programs have been put in place in the last few years in the EU (i.e., Innovation Fund, EU-Catalyst partnership, and the Sustainable Carbon Cycles certification framework) that are expected to incentivize the development of DAC on a large scale in the future. Modularity is also an important factor to enable faster deployment on that scale. Regarding energy use, DAC technologies that require lower temperatures and can be fully powered by RES or waste heat are better positioned in terms of energy availability and independence from fossil fuels. During the first period of scaling up pilot projects, the cost of DAC is substantially high; however, it is expected to decrease with a combination of more installations and technological advancements that will contribute to the technology’s learning curve, as it has already occurred with other technologies, such as PV, wind, and (partially) lithium batteries. The economic viability of DAC technologies is highly dependent on the (future) carbon price developments that has become quite volatile due to sudden policy and geopolitical changes. Carbon price increase and the simultaneous DAC cost decrease is expected to bring an economic equilibrium that will enable DAC to become competitive. Public intervention in the early stages of DAC deployment and/or dedication of the carbon market revenues for the installation of pilot DAC projects is considered to be of high importance. From a policy perspective, EU funding programs (such as REPowerEU and Innovation Fund) can be proven vital for the future of DAC technology investments.
When coupled with electrolysers powered by renewable energies, DAC can also help to offset emissions from sectors difficult to decarbonise (e.g., energy intensive industries, aviation, and maritime) through the production of synthetic fuels, and it may potentially cover a large part of the RFNBOs share for the transport sector. Moreover, in a highly decarbonised future economy, CO2 availability from concentrated sources may be limited, and DAC could be a CO2 source for the production of carbon-based synthetic fuels needed in these residual sectors. Despite their conversion technologies being at early TRLs, the “Fit for 55” package introduced specific targets for RFNBOs with regard to their production, so their market uptake is expected soon. As with DAC, it is essential to provide adequate incentives for the development of synthetic fuels to make them cost competitive. Drop-in fuels can be very advantageous, as they are compatible with the existing fuel distribution and usage infrastructure, and moreover, some of these fuels can also be used in the industry as chemicals. The results of this study highlight the importance of using renewable energies (wind and solar) for synthetic fuel production if the REDII threshold for RFNBOs is to be met. This is fully in line with the “Fit for 55” targets and the recent REPowerEU plan whereby wind and solar energy production is expected to increase and, therefore, potentially be available for DAC and hydrogen production in order to produce compliant fuels and remove CO2 from the atmosphere.
8. Conclusions
The present study provides an in-depth review of direct air capture, exploring various technological and economical aspects as well as providing an overview of the current DAC projects around the world. It also performs an analysis of the current and future carbon footprint of the DAC technology in the EU countries under different cases and scenarios as well as its utilisation to produce three synthetic fuels (i.e., methane, methanol, and diesel).
The following conclusions can be drawn from this article:
- A grid carbon intensity of 468 gCO2e/kWh is the threshold below which DAC can deliver negative emissions. Currently, DAC powered by the grid electricity mix does not provide negative emissions in five EU countries (Bulgaria, Cyprus, Czech Republic, Estonia, and Poland); however, the lower grid carbon intensities would allow this in 2050 REF2020 and 2030 FF55.
- The average negative emissions using DAC in the EU range from −0.407 to 0.794 tCO2e/tCO2 captured for the different years and scenarios. If only PV&Wind are used to power DAC, all countries would already be able today to obtain negative emissions of at least 0.81 tCO2e/tCO2 captured.
- For the production of the considered fuels, currently only a few countries would be able to produce them with a lower carbon footprint than their fossil equivalent using the grid, and only Sweden would be able to comply with the REDII threshold (only for e-methane).
- The maximum grid carbon intensities that allow production of the selected fuels with lower or equal carbon footprints than their fossil equivalent are 96, 121, and 151 gCO2e/kWh for methane, diesel, and methanol, respectively.
- To comply with the REDII threshold, the maximum grid carbon intensity ranges between 30.2 and 38.8 gCO2e/kWh.
In 2050 REF2020, almost all countries are able to produce at least one of the synthetic fuels analysed and, in many cases, all three fuels with lower emissions than their fossil counterpart. However, only few countries are able to comply with the REDII threshold, and the EU average is always above it for all fuels, years, and scenarios. When using only PV&Wind, all countries are able to produce the three fuels with lower carbon emissions than their fossil equivalent, and most of them complying with the REDII threshold. In this case, the EU average would be also able to comply with the REDII for all fuels, years, and scenarios, with values ranging between 19.3 and 25.8 gCO2e/MJ. The hybrid case allows more countries to produce fuels compliant with the REDII threshold, since hydrogen production is the most influencing factor in terms of carbon emissions. In this case, in contrast to the grid case, the EU average would be able to produce methane in 2050 in compliance with the REDII requirements.
Supplementary Materials
The following supporting information can be downloaded at: https://www.mdpi.com/article/10.3390/en16093881/s1, Figure S1. Methane production emissions for the Grid mix and PV&Wind cases; REF2020 and FF55 scenarios for 2020, 2030, and 2050; Figure S2. Methane and methanol production emissions for the Hybrid case; REF2020 and FF55 scenarios for 2020, 2030, and 2050; Table S1. List of EU countries’ codes; Table S2. DAC carbon footprint; Table S3. Fuel total carbon footprint for the “Grid Case”; Table S4. Fuel total carbon footprint (gCO2e/MJ) for the “PV&Wind Case”; Table S5. Fuel total carbon footprint (gCO2e/MJ) for the “Hybrid Case”; Table S6. Area and water requirements of DAC technologies; Table S7. Main projects from Climeworks; Table S8. Main projects from Global Thermostat; Table S9. Main projects from Carbon Engineering; Table S10. Other DAC companies. References [111,112,113,114,115,116,117,118,119,120,121,122,123,124,125,126] are cited in the Supplementary Materials.
Author Contributions
R.G.S., conceptualization, visualization, writing—original draft, writing—review and editing, investigation, formal analysis, and methodology; A.C., conceptualization, writing—original draft, writing—review and editing, investigation, and methodology; G.K., visualization, writing—review and editing, methodology, and software; M.B., writing—original draft, writing—review and editing, methodology, and formal analysis; S.S., writing—original draft, investigation, methodology, and supervision. All authors have read and agreed to the published version of the manuscript.
Funding
This research received no external funding.
Data Availability Statement
The data presented in this study are available in the present article “The role of direct air capture in EU’s decarbonisation and associated carbon intensity for synthetic fuels production” and the corresponding Supplementary Materials available, as mentioned above.
Conflicts of Interest
The authors declare no conflict of interest. The scientific output expressed is based on the current information available to the authors and does not imply a policy position of the European Commission.
References
- Our World in Data. GHG Emissions by Sector. 2020. Available online: https://ourworldindata.org/ghg-emissions-by-sector (accessed on 20 November 2022).
- IPCC. Special Report: Global Warming of 1.5 °C. Summary for Policymakers. 2018. Available online: https://www.ipcc.ch/sr15/chapter/spm/ (accessed on 20 November 2022).
- IPCC. AR5 Synthesis Report: Climate Change 2014. 2014. Available online: https://www.ipcc.ch/report/ar5/syr/ (accessed on 20 November 2022).
- EASAC. Negative Emission Technologies: What Role in Meeting Paris Agreement Targets? 2018. Available online: https://easac.eu/fileadmin/PDF_s/reports_statements/Negative_Carbon/EASAC_Report_on_Negative_Emission_Technologies.pdf (accessed on 20 November 2022).
- IEA. Net Zero by 2050—A Roadmap for the Global Energy Sector. 2021. Available online: https://www.iea.org/reports/net-zero-by-2050 (accessed on 20 November 2022).
- IEA. Direct Air Capture. 2022. Available online: https://www.iea.org/reports/direct-air-capture (accessed on 20 November 2022).
- Eurostat. Greenhouse Gas Emissions in the EU. 2022. Available online: https://ec.europa.eu/eurostat/statistics-explained/index.php?title=Quarterly_greenhouse_gas_emissions_in_the_EU#Greenhouse_gas_emissions (accessed on 4 March 2022).
- European Commission. Communication from the Commission to the European Parliament, the European Council, the Council, the European Economic and Social Committee and the Committee of the Regions. The European Green Deal. 2019. Available online: https://eur-lex.europa.eu/legal-content/EN/TXT/?uri=COM%3A2019%3A640%3AFIN (accessed on 20 November 2022).
- European Commission. Regulation of the European Parliament and of the Council on Establishing the Framework for Achieving Climate Neutrality and Amending Regulation (EU) 2018/1999 (European Climate Law). 2020. Available online: https://eur-lex.europa.eu/legal-content/EN/TXT/?uri=CELEX%3A32021R1119 (accessed on 20 November 2022).
- European Commission. Communication from the Commission to the European Parliament, the Council, the European Economic and Social Committee and the Committee of the Regions ‘Fit for 55’: Delivering the EU’s 2030 Climate Target on the Way to Climate Neutrality. 2021. Available online: https://eur-lex.europa.eu/legal-content/EN/TXT/?uri=CELEX:52021DC0550 (accessed on 20 November 2022).
- European Commission. Communication from the Commission to the European Parliament, the European Council, the Council, the European Economic and Social Committee and the Committee of the Regions REPowerEU: Joint European Action for More Affordable, Secure and Sustainable Energy. 2022. Available online: https://eur-lex.europa.eu/legal-content/EN/TXT/?uri=COM%3A2022%3A230%3AFIN (accessed on 20 November 2022).
- European Commission. Communication from the Commission to the European Parliament and the Council. Sustainable Carbon Cycles. 2021. Available online: https://eur-lex.europa.eu/legal-content/EN/TXT/?uri=CELEX%3A52021DC0800 (accessed on 20 November 2022).
- European Commission. Innovation Fund. 2020. Available online: https://ec.europa.eu/clima/eu-action/funding-climate-action/innovation-fund_en (accessed on 20 November 2022).
- European Commission. EU-Catalyst Partnership: Request for Proposals of Pioneering Green Technology Projects Is Launched. 2022. Available online: https://ec.europa.eu/info/news/eu-catalyst-partnership-request-proposals-pioneering-green-technology-projects-launched-2022-jan-11_en (accessed on 11 January 2022).
- Rickels, W.; Proelß, A.; Geden, O.; Burhenne, J.; Fridahl, M. Integrating Carbon Dioxide Removal into European Emissions Trading. Front. Clim. 2021, 3, 690023. [Google Scholar] [CrossRef]
- European Commission. In-Depth Analysis in Support on the COM(2018) 773: A Clean Planet for All—A European Strategic Long-Term Vision for a Prosperous, Modern, Competitive and Climate Neutral Economy. 2018. Available online: https://knowledge4policy.ec.europa.eu/publication/depth-analysis-support-com2018-773-clean-planet-all-european-strategic-long-term-vision_en (accessed on 20 November 2022).
- Capros, P.; Zazias, G.; Evangelopoulou, S.; Kannavou, M.; Fotiou, T.; Siskos, P.; De Vita, A.; Sakellaris, K. Energy-system modelling of the EU strategy towards climate-neutrality. Energy Policy 2019, 134, 110960. [Google Scholar] [CrossRef]
- Climeworks. Direct Air Capture Summit 2021. 2021. Available online: https://climeworks.com/news/direct-air-capture-summit-2021 (accessed on 10 January 2022).
- Realmonte, G.; Drouet, L.; Gambhir, A.; Glynn, J.; Hawkes, A.; Köberle, A.C.; Tavoni, M. An inter-model assessment of the role of direct air capture in deep mitigation pathways. Nat. Commun. 2019, 10, 3277. [Google Scholar] [CrossRef] [PubMed]
- Beuttler, C.; Charles, L.; Wurzbacher, J. The Role of Direct Air Capture in Mitigation of Anthropogenic Greenhouse Gas Emissions. Front. Clim. 2019, 1, 10. [Google Scholar] [CrossRef]
- Hanna, R.; Abdulla, A.; Xu, Y.; Victor, D.G. Emergency deployment of direct air capture as a response to the climate crisis. Nat. Commun. 2021, 12, 368. [Google Scholar] [CrossRef]
- Breyer, C.; Fasihi, M.; Bajamundi, C.; Creutzig, F. Direct Air Capture of CO2: A Key Technology for Ambitious Climate Change Mitigation. Joule 2019, 3, 2053–2057. [Google Scholar] [CrossRef]
- Ozkan, M.; Nayak, S.P.; Ruiz, A.D.; Jiang, W. Current status and pillars of direct air capture technologies. iScience 2022, 25, 103990. [Google Scholar] [CrossRef]
- Fasihi, M.; Efimova, O.; Breyer, C. Techno-economic assessment of CO2 direct air capture plants. J. Clean. Prod. 2019, 224, 957–980. [Google Scholar] [CrossRef]
- Erans, M.; Sanz-Pérez, E.S.; Hanak, D.P.; Clulow, Z.; Reiner, D.M.; Mutch, G.A. Direct air capture: Process technology, techno-economic and socio-political challenges. Energy Environ. Sci. 2022, 15, 1360–1405. [Google Scholar] [CrossRef]
- Broehm, M.; Strefler, J.; Bauer, N. Techno-Economic Review of Direct Air Capture Systems for Large Scale Mitigation of Atmospheric CO2. SSRN Electron. J. 2015. [Google Scholar] [CrossRef]
- Sabatino, F.; Grimm, A.; Gallucci, F.; Annaland, M.V.S.; Kramer, G.J.; Gazzani, M. A comparative energy and costs assessment and optimization for direct air capture technologies. Joule 2021, 5, 2047–2076. [Google Scholar] [CrossRef]
- Madhu, K.; Pauliuk, S.; Dhathri, S.; Creutzig, F. Understanding environmental trade-offs and resource demand of direct air capture technologies through comparative life-cycle assessment. Nat. Energy 2021, 6, 1035–1044. [Google Scholar] [CrossRef]
- Keith, D.W.; Holmes, G.; Angelo, D.S.; Heidel, K. A Process for Capturing CO2 from the Atmosphere. Joule 2018, 2, 1573–1594. [Google Scholar] [CrossRef]
- Deutz, S.; Bardow, A. Life-cycle assessment of an industrial direct air capture process based on temperature–vacuum swing adsorption. Nat. Energy 2021, 6, 203–213. [Google Scholar] [CrossRef]
- McQueen, N.; Psarras, P.; Pilorgé, H.; Liguori, S.; He, J.; Yuan, M.; Woodall, C.M.; Kian, K.; Pierpoint, L.; Jurewicz, J.; et al. Cost Analysis of Direct Air Capture and Sequestration Coupled to Low-Carbon Thermal Energy in the United States. Environ. Sci. Technol. 2020, 54, 7542–7551. [Google Scholar] [CrossRef]
- Ishimoto, Y.; Sugiyama, M.; Kato, E.; Moriyama, R.; Tsuzuki, K.; Kurosawa, A. Putting Costs of Direct Air Capture in Context. FCEA Working Paper Series: 002. SSRN Electron. J. 2017. [Google Scholar] [CrossRef]
- Sutherland, B.R. Pricing CO2 Direct Air Capture. Joule 2019, 3, 1571–1573. [Google Scholar] [CrossRef]
- Azarabadi, H.; Lackner, K.S. A sorbent-focused techno-economic analysis of direct air capture. Appl. Energy 2019, 250, 959–975. [Google Scholar] [CrossRef]
- Darunte, L.A.; Oetomo, A.D.; Walton, K.S.; Sholl, D.S.; Jones, C.W. Direct Air Capture of CO2 Using Amine Functionalized MIL-101(Cr). ACS Sustain. Chem. Eng. 2016, 4, 5761–5768. [Google Scholar] [CrossRef]
- Deng, Y.; Li, J.; Miao, Y.; Izikowitz, D. A comparative review of performance of nanomaterials for Direct Air Capture. Energy Rep. 2021, 7, 3506–3516. [Google Scholar] [CrossRef]
- Custelcean, R.; Williams, N.J.; Garrabrant, K.A.; Agullo, P.; Brethomé, F.M.; Martin, H.J.; Kidder, M.K. Direct Air Capture of CO2 with Aqueous Amino Acids and Solid Bis-iminoguanidines (BIGs). Ind. Eng. Chem. Res. 2019, 58, 23338–23346. [Google Scholar] [CrossRef]
- Sayari, A.; Liu, Q.; Mishra, P. Enhanced Adsorption Efficiency through Materials Design for Direct Air Capture over Supported Polyethylenimine. Chemsuschem 2016, 9, 2796–2803. [Google Scholar] [CrossRef] [PubMed]
- Li, C.; Shi, H.; Cao, Y.; Kuang, Y.; Zhang, Y.; Gao, D.; Sun, L. Modeling and optimal operation of carbon capture from the air driven by intermittent and volatile wind power. Energy 2015, 87, 201–211. [Google Scholar] [CrossRef]
- Breyer, C.; Fasihi, M.; Aghahosseini, A. Carbon dioxide direct air capture for effective climate change mitigation based on renewable electricity: A new type of energy system sector coupling. Mitig. Adapt. Strateg. Glob. Chang. 2020, 25, 43–65. [Google Scholar] [CrossRef]
- USingh, U.; Colosi, L.M. Capture or curtail: The potential and performance of direct air capture powered through excess renewable electricity. Energy Convers. Manag. X 2022, 15, 100230. [Google Scholar] [CrossRef]
- Wohland, J.; Witthaut, D.; Schleussner, C.-F. Negative Emission Potential of Direct Air Capture Powered by Renewable Excess Electricity in Europe. Earth’s Futur. 2018, 6, 1380–1384. [Google Scholar] [CrossRef]
- Shayegh, S.; Bosetti, V.; Tavoni, M. Future Prospects of Direct Air Capture Technologies: Insights From an Expert Elicitation Survey. Front. Clim. 2021, 3, 630893. Available online: https://www.frontiersin.org/article/10.3389/fclim.2021.630893 (accessed on 6 February 2021). [CrossRef]
- Herzog, H.J. Chapter 6: Direct Air Capture. In Greenhouse Gas Removal Technologies; The Royal Society of Chemistry: London, UK, 2022; Available online: https://pubs.rsc.org/en/content/ebook/978-1-83916-199-5 (accessed on 6 February 2021).
- Climeworks. CO2 Removal. Available online: https://climeworks.com/ (accessed on 6 February 2021).
- Climeworks. Climeworks Takes Another Major Step on Its Road to Building Gigaton DAC Capacity. 2022. Available online: https://climeworks.com/news/climeworks-announces-groundbreaking-on-mammoth?utm_source=Twitter&utm_medium=Social&utm_campaign=mammothannouncement&utm_content=mammothnews (accessed on 28 June 2022).
- Climeworks. Orca: The First Large-Scale Plant. Available online: https://climeworks.com/roadmap/orca (accessed on 8 September 2021).
- Carbon Engineering. Carbon Engineering. Available online: https://carbonengineering.com/our-story/ (accessed on 20 February 2003).
- McQueen, N.; Gomes, K.V.; McCormick, C.; Blumanthal, K.; Pisciotta, M.; Wilcox, J. A review of direct air capture (DAC): Scaling up commercial technologies and innovating for the future. Prog. Energy 2021, 3, 032001. [Google Scholar] [CrossRef]
- Tavoni, M.; Socolow, R. Modeling meets science and technology: An introduction to a special issue on negative emissions. Clim. Chang. 2013, 118, 1–14. [Google Scholar] [CrossRef]
- Realmonte, G.; Drouet, L.; Gambhir, A.; Glynn, J.; Hawkes, A.; Köberle, A.C.; Tavoni, M. Reply to “High energy and materials requirement for direct air capture calls for further analysis and R&D”. Nat. Commun. 2020, 11, 10–11. [Google Scholar] [CrossRef]
- Chatterjee, S.; Huang, K.-W. Unrealistic energy and materials requirement for direct air capture in deep mitigation pathways. Nat. Commun. 2020, 11, 10–12. [Google Scholar] [CrossRef]
- Lin, Q.; Zhang, X.; Wang, T.; Zheng, C.; Gao, X. Technical Perspective of Carbon Capture, Utilization, and Storage. Engineering 2022, 14, 27–32. [Google Scholar] [CrossRef]
- De Jonge, M.M.; Daemen, J.; Loriaux, J.M.; Steinmann, Z.J.; Huijbregts, M.A. Life cycle carbon efficiency of Direct Air Capture systems with strong hydroxide sorbents. Int. J. Greenh. Gas Control 2018, 80, 25–31. [Google Scholar] [CrossRef]
- Climeworks. Direct Air Capture Summit 2020. 2020. Available online: https://climeworks.com/news/direct-air-capture-summit-2020 (accessed on 8 September 2020).
- Liu, C.M.; Sandhu, N.K.; McCoy, S.T.; Bergerson, J.A. A life cycle assessment of greenhouse gas emissions from direct air capture and Fischer-Tropsch fuel production. Sustain. Energy Fuels 2020, 4, 3129–3142. [Google Scholar] [CrossRef]
- Marchese, M.; Buffo, G.; Santarelli, M.; Lanzini, A. CO2 from direct air capture as carbon feedstock for Fischer-Tropsch chemicals and fuels: Energy and economic analysis. J. CO2 Util. 2021, 46, 101487. [Google Scholar] [CrossRef]
- Malins, C. What role is there for electrofuel technologies in European transport’s low carbon future? Cerulogy Rep. 2017, 1–86. [Google Scholar]
- Panoutsou, C.; Germer, S.; Karka, P.; Papadokostantakis, S.; Kroyan, Y.; Wojcieszyk, M.; Maniatis, K.; Marchand, P.; Landalv, I. Advanced biofuels to decarbonise European transport by 2030: Markets, challenges, and policies that impact their successful market uptake. Energy Strat. Rev. 2021, 34, 100633. [Google Scholar] [CrossRef]
- EU. Directive (EU) 2018/2001 of the European Parliament and of the Council of 11 December 2018 on the promotion of the use of energy from renewable sources (recast). Off. J. Eur. Union 2018, L 328, 82–209. [Google Scholar]
- Soler, A. A look into the role of e-fuels in the transport system in Europe (2030–2050) (literature review): Concawe Low Carbon Pathways Joint Group (LCP JG). Concawe Rev. 2019, 28, 4–22. [Google Scholar]
- JEC v5 WtT-and-BEST. Database on Facilities for the Production of Advanced Liquid and Gaseous Biofuels for Transport. IEA Bioenergy Task 39. Available online: https://demoplants.best-research.eu/ (accessed on 17 June 2022).
- Styring, P.; Dowson, G.R.M.; Tozer, I.O. Synthetic Fuels Based on Dimethyl Ether as a Future Non-Fossil Fuel for Road Transport from Sustainable Feedstocks. Front. Energy Res. 2021, 9, 663331. Available online: https://www.frontiersin.org/article/10.3389/fenrg.2021.663331 (accessed on 12 May 2022). [CrossRef]
- Transport & Environment. Magic Green Fuels: Why Synthetic Fuels in Cars Will not Solve Europe’s Pollution Problems. 2021. Available online: https://www.transportenvironment.org/discover/magic-green-fuels-why-synthetic-fuels-in-cars-will-not-solve-europes-pollution-problems/ (accessed on 12 May 2022).
- Sebos, I. Fossil fraction of CO2 emissions of biofuels. Carbon Manag. 2022, 13, 154–163. [Google Scholar] [CrossRef]
- Svanberg, M.; Ellis, J.; Lundgren, J.; Landälv, I. Renewable methanol as a fuel for the shipping industry. Renew. Sustain. Energy Rev. 2018, 94, 1217–1228. [Google Scholar] [CrossRef]
- CWulf, C.; Zapp, P.; Schreiber, A. Review of Power-to-X Demonstration Projects in Europe. Front. Energy Res. 2020, 8, 191. Available online: https://www.frontiersin.org/article/10.3389/fenrg.2020.00191 (accessed on 12 May 2022).
- European Commission. Horizon Europe. Available online: https://ec.europa.eu/info/research-and-innovation/funding/funding-opportunities/funding-programmes-and-open-calls/horizon-europe_en (accessed on 12 May 2022).
- CINEA. Connecting Europe Facility. Available online: https://ec.europa.eu/inea/en/connecting-europe-facility (accessed on 12 May 2022).
- European Commission. InvestEU. Available online: https://ec.europa.eu/info/funding-tenders/find-funding/eu-funding-programmes/investeu_en (accessed on 12 May 2022).
- Bos, M.J.; Kersten, S.R.A.; Brilman, D.W.F. Wind power to methanol: Renewable methanol production using electricity, electrolysis of water and CO2 air capture. Appl. Energy 2020, 264, 114672. [Google Scholar] [CrossRef]
- Prats-Salvado, E.; Monnerie, N.; Sattler, C. Synergies between Direct Air Capture Technologies and Solar Thermochemical Cycles in the Production of Methanol. Energies 2021, 14, 4818. [Google Scholar] [CrossRef]
- European Commission. Communication from the Commission to the European Parliament, the Council, the European Economic and Social Committee and the Committee of the Regions A Hydrogen Strategy for a Climate-Neutral Europe; European Commission: Brussels, Belgium, 2020. [Google Scholar]
- European Commission. 2022 State of the Union Address by President von der Leyen. 2022. Available online: https://ec.europa.eu/commission/presscorner/detail/en/SPEECH_22_5493 (accessed on 14 September 2022).
- European Commission. Recovery and Resilience Facility. Available online: https://single-market-economy.ec.europa.eu/industry/strategy/hydrogen/funding-guide/eu-programmes-funds/recovery-and-resilience-facility_en (accessed on 28 October 2022).
- European Commission. State Aid: Commission Approves up to €5.4 Billion of Public Support by Fifteen Member States for an Important Project of Common European Interest in the Hydrogen Technology Value Chain. 2022. Available online: https://ec.europa.eu/commission/presscorner/detail/en/ip_22_4544 (accessed on 15 July 2022).
- European Commission. Communication from the Commission to the European Parliament, the European Council, the Council, the European Economic and Social Committee and the Committee of the Regions, Europe’s Moment: Repair and Prepare for the Next Generation; European Commission: Brussels, Belgium, 2020; p. 18. [Google Scholar]
- European Commission. Delegated Regulation for a Minimum Threshold for GHG Savings of Recycled Carbon Fuels and Annex. Available online: https://energy.ec.europa.eu/publications/delegated-regulation-minimum-threshold-ghg-savings-recycled-carbon-fuels-and-annex_en (accessed on 2 May 2023).
- European Commission. Delegated Regulation on Union Methodology for RFNBOs. Available online: https://energy.ec.europa.eu/publications/delegated-regulation-union-methodology-rfnbos_en (accessed on 2 May 2023).
- European Commission. Proposal for a Regulation of the European Parliament and of the Council on the Use of Renewable and Low-Carbon Fuels in Maritime Transport and Amending Directive 2009/16/EC; European Commission: Brussels, Belgium, 2021. [Google Scholar]
- European Commission. Proposal for a Regulation of the European Parliament and of the Council on Ensuring a Level Playing Field for Sustainable Air Transport; European Commission: Brussels, Belgium, 2021. [Google Scholar]
- Dieterich, V.; Buttler, A.; Hanel, A.; Spliethoff, H.; Fendt, S. Power-to-liquid via synthesis of methanol, DME or Fischer-Tropsch-fuels: A review. Energy Environ. Sci. 2020, 13, 3207–3252. [Google Scholar] [CrossRef]
- Thema, M.; Bauer, F.; Sterner, M. Power-to-Gas: Electrolysis and methanation status review. Renew. Sustain. Energy Rev. 2019, 112, 775–787. [Google Scholar] [CrossRef]
- Prussi, M.; Yugo, M.; De Prada, L.; Padella, M.; Edwards, R.; Lonza, L. JEC Well-to-Tank Report v5; EUR 30269 EN; Publications Office of the European Union: Luxembourg, 2020; ISBN 978-92-76-19926-7. JRC119036. [Google Scholar] [CrossRef]
- European Commission. EU Reference Scenario 2020: Energy, Transport and GHG Emissions: Trends to 2050; Publications Office of the European Union: Luxembourg, 2021; Available online: https://energy.ec.europa.eu/data-and-analysis/energy-modelling/eu-reference-scenario-2020_en (accessed on 12 May 2022).
- De Wild-Scholten, M.; Cassagne, V.; Huld, T. Solar Resources and Carbon Footprint of Photovoltaic Power in Different Regions in Europe. In Proceedings of the 29th EUPVSEC, Amsterdam, The Netherlands, 22–26 September 2014; pp. 3421–3430. [Google Scholar] [CrossRef]
- NREL. Wind LCA Harmonization. 2013. Available online: https://www.nrel.gov/docs/fy13osti/57131.pdf (accessed on 12 May 2022).
- Tenhumberg, N.; Büker, K. Ecological and Economic Evaluation of Hydrogen Production by Different Water Electrolysis Technologies. Chem. Ing. Tech. 2020, 92, 1586–1595. [Google Scholar] [CrossRef]
- Biograce. BioGrace Excel Tool V4. 2015. Available online: https://biograce.net/content/ghgcalculationtools/recognisedtool (accessed on 12 May 2022).
- Bongartz, D.; Doré, L.; Eichler, K.; Grube, T.; Heuser, B.; Hombach, L.E.; Robinius, M.; Pischinger, S.; Stolten, D.; Walther, G.; et al. Comparison of light-duty transportation fuels produced from renewable hydrogen and green carbon dioxide. Appl. Energy 2018, 231, 757–767. [Google Scholar] [CrossRef]
- Ruokonen, J.; Nieminen, H.; Dahiru, A.R.; Laari, A.; Koiranen, T.; Laaksonen, P.; Vuokila, A.; Huuhtanen, M. Modelling and Cost Estimation for Conversion of Green Methanol to Renewable Liquid Transport Fuels via Olefin Oligomerisation. Processes 2021, 9, 1046. [Google Scholar] [CrossRef]
- National Petroleum Council. Carbon Capture, Use, and Storage (CCUS) Report. 2019. Available online: https://dualchallenge.npc.org/downloads.php (accessed on 18 May 2022).
- Bui, M.; Adjiman, C.S.; Bardow, A.; Anthony, E.J.; Boston, A.; Brown, S.; Fennell, P.S.; Fuss, S.; Galindo, A.; Hackett, L.A.; et al. Carbon capture and storage (CCS): The way forward. Energy Environ. Sci. 2018, 11, 1062–1176. [Google Scholar] [CrossRef]
- Kearns, D.; Liu, H.; Consoli, C. Technology Readiness and Costs of CCS. 2021. Available online: https://www.globalccsinstitute.com/resources/publications-reports-research/technology-readiness-and-costs-of-ccs/ (accessed on 18 May 2022).
- IPCC. Carbon Capture and Storage. 2018. Available online: https://www.ipcc.ch/site/assets/uploads/2018/03/srccs_wholereport.pdf (accessed on 18 May 2022).
- European Commission. Implementation of the CCS Directive. 2009. Available online: https://ec.europa.eu/clima/eu-action/carbon-capture-use-and-storage/implementation-ccs-directive_es (accessed on 18 May 2022).
- European Commission. Communication from the Commission to the European Parliament, the Council, the European Economic and Social Committee and the Committee of the Regions on the Future of Carbon Capture and Storage in Europe. 2013. Available online: https://eur-lex.europa.eu/legal-content/EN/ALL/?uri=CELEX%3A52013DC0180 (accessed on 18 May 2022).
- Northern Lights. What We Do. Available online: https://norlights.com/what-we-do/ (accessed on 18 May 2022).
- Equinor. Northern Lights. Available online: https://www.equinor.com/energy/northern-lights (accessed on 18 May 2022).
- Trading Economics. EU Carbon Permits. Available online: https://tradingeconomics.com/commodity/carbon#:~:text= (accessed on 4 August 2022).
- IETA. GHG Market Sentiment Survey. 2022. Available online: https://www.ieta.org/resources/Documents/IETAGHGMarketSentimentSurveyReport2022.pdf (accessed on 18 May 2022).
- Lebling, K.; Leslie-Bol, H.; Byrum, Z.; Bridgwater, E. Direct Air Capture: Resource Considerations and Costs for Carbon Removal. 2022. Available online: https://www.wri.org/insights/direct-air-capture-resource-considerations-and-costs-carbon-removal (accessed on 5 July 2022).
- ING. Rising Carbon Prices Increase Viability of Low-Carbon Technologies. 2022. Available online: https://think.ing.com/articles/rising-carbon-prices-increase-viability-of-low-carbon-technologies (accessed on 20 March 2022).
- ZEP. The Cost of Subsurface Storage of CO2. 2019. Available online: https://zeroemissionsplatform.eu/wp-content/uploads/Cost-of-storage.pdf (accessed on 18 May 2022).
- IEA. Is Carbon Capture too Expensive? 2021. Available online: https://www.iea.org/commentaries/is-carbon-capture-too-expensive (accessed on 20 September 2021).
- Global Thermostat. We Have the Tech to Suck CO2 from the Air—But Can It Suck Enough to Make a Difference? 2019. Available online: https://globalthermostat.com/wp-content/uploads/2019/06/Fast-Company-We-have-the-tech-to-suck-CO2-from-the-air-06.11.19.pdf (accessed on 5 July 2022).
- Fuss, S.; Lamb, W.F.; Callaghan, M.W.; Hilaire, J.; Creutzig, F.; Amann, T.; Beringer, T.; Garcia, W.D.O.; Hartmann, J.; Khanna, T.; et al. Negative emissions—Part 2: Costs, potentials and side effects. Environ. Res. Lett. 2018, 13, 063002. [Google Scholar] [CrossRef]
- Zeman, F. Reducing the Cost of Ca-Based Direct Air Capture of CO2. Environ. Sci. Technol. 2014, 48, 11730–11735. [Google Scholar] [CrossRef]
- Paroussos, L.; Fragkos, P.; Capros, P. A Model-Based Analysis of the European Intended Nationally Determined Contribution. Studies 2016, 7, 16–36. Available online: https://www.iddri.org/sites/default/files/import/publications/st0716_miles-eu-indc-iccs.pdf (accessed on 18 May 2022).
- The Chemical Engineer. Climeworks Pioneering Air-Captured CO2 for Drinks Carbonation. Available online: https://www.thechemicalengineer.com/news/climeworks-pioneering-air-captured-co2-for-drinks-carbonation (accessed on 23 April 2021).
- Zeman, F. Energy and Material Balance of CO2 Capture from Ambient Air. Environ. Sci. Technol. 2007, 41, 7558–7563. [Google Scholar] [CrossRef]
- Climeworks. Capricorn. Available online: https://climeworks.com/roadmap/capricorn (accessed on 20 September 2022).
- Climeworks. Artic Fox. Available online: https://climeworks.com/roadmap/arctic-fox (accessed on 20 September 2022).
- Climeworks. Climeworks Launches Direct Air Capture Plant in Italy. News, 1 October 2018. Available online: https://climeworks.com/news/climeworks-launches-dac-3-plant-in-italy (accessed on 20 September 2022).
- Store&Go. The STORE&GO Demonstration Site at Troia, Italia. Available online: https://www.storeandgo.info/demonstration-sites/italy/ (accessed on 20 September 2022).
- Climeworks. Turning CO₂ into a High-Tech Resource: Carbon Black. Available online: https://climeworks.com/news/turning-co2-to-a-high-tech-resource-carbon-black (accessed on 20 September 2022).
- European Commission. Upscaling and Optimizing Subsurface, In Situ Carbon Mineralization as an Economically Viable Industrial Option. Available online: https://cordis.europa.eu/project/id/764760;https://www.carbfadiferenciadeix.com/direct-air-capture (accessed on 20 September 2022).
- Carbfix. Direct Air Capture. Available online: https://www.carbfix.com/direct-air-capture (accessed on 20 September 2022).
- Carbon Engineering. Air to Fuels. Available online: https://carbonengineering.com/air-to-fuels/ (accessed on 20 September 2022).
- Carbon Engineering. Engineering Begins on UK’s First Large-Scale Facility That Captures Carbon Dioxide out of the Atmosphere, (n.d.). Available online: https://carbonengineering.com/news-updates/uks-first-large-scale-dac-facility/ (accessed on 20 September 2022).
- Air Capture. Available online: https://www.aircapture.com/ (accessed on 20 September 2022).
- Carbon Capture. Available online: https://carboncapture.com/ (accessed on 20 September 2022).
- Carbyon. Available online: https://carbyon.com/%0D%0A (accessed on 20 September 2022).
- Heirloom. Available online: https://www.heirloomcarbon.com (accessed on 20 September 2022).
- Mission Zero Technologies. Available online: https://missionzero.tech (accessed on 20 September 2022).
- Soletair. Available online: https://www.soletairpower.fi/ (accessed on 20 September 2022).


Disclaimer/Publisher’s Note: The statements, opinions and data contained in all publications are solely those of the individual author(s) and contributor(s) and not of MDPI and/or the editor(s). MDPI and/or the editor(s) disclaim responsibility for any injury to people or property resulting from any ideas, methods, instructions or products referred to in the content. |
© 2023 by the authors. Licensee MDPI, Basel, Switzerland. This article is an open access article distributed under the terms and conditions of the Creative Commons Attribution (CC BY) license (https://creativecommons.org/licenses/by/4.0/).