Article

Techno-Economic Analysis of Thermochemical Conversion of Waste Masks Generated in the EU during COVID-19 Pandemic into Energy Products

1
Department of Production Engineering, Faculty of Mechanical Engineering and Design, Kaunas University of Technology, LT-51424 Kaunas, Lithuania
2
Lithuanian Energy Institute, Laboratory of Energy Systems Research, Breslaujos 3, LT-44403 Kaunas, Lithuania
3
Lithuanian Energy Institute, Laboratory of Combustion Processes, Breslaujos 3, LT-44403 Kaunas, Lithuania
*
Author to whom correspondence should be addressed.
Energies 2023, 16(9), 3948; https://doi.org/10.3390/en16093948
Submission received: 18 April 2023 / Revised: 25 April 2023 / Accepted: 27 April 2023 / Published: 8 May 2023

Abstract

:
During the COVID-19 pandemic, more than 24 billion pieces of surgical mask waste (WM) were generated in the EU region, with an acute shortage of their management and recycling. Pyrolysis and gasification are among the most promising treatments that were proposed to dispose of WMs and convert them into pyrolysis oil and hydrogen-rich syngas. This work aimed to investigate the techno-economic analysis (TEA) of both treatments in order to assess the feasibility of scaling up. The TEA was carried out using a discounted cash flow model and its data were collected from practical experiments conducted using a fluidised bed pyrolysis reactor and bubbling fluidised bed gasifier system with a capacity of 0.2 kg/h and 1 kg/h, respectively, then upscaling to one tonne/h. The technological evaluation was made based on the optimal conditions that could produce the maximum amount of pyrolysis oil (42.3%) and hydrogen-rich syngas (89.7%). These treatments were also compared to the incineration of WMs as a commercial solution. The discounted payback, simple payback, net present value (NPV), production cost, and internal rate of return (IRR) were the main indicators used in the economic feasibility analysis. Sensitivity analysis was performed using SimLab software with the help of Monte Carlo simulations. The results showed that the production cost of the main variables was estimated at 45.4 EUR/t (gate fee), 71.7 EUR/MWh (electricity), 30.5 EUR/MWh (heat), 356 EUR/t (oil), 221 EUR/t (gaseous), 237 EUR/t (char), and 257 EUR/t (syngas). Meanwhile, the IRR results showed that gasification (12.51%) and incineration (7.56%) have better economic performance, while pyrolysis can produce less revenue (1.73%). Based on the TEA results, it is highly recommended to use the gasification process to treat WMs, yielding higher revenue.

1. Introduction

During the last two years, the surgical mask waste (WM) has dramatically increased because of the outbreak of the COVID-19 pandemic, where the number of WMs generated per day had reached a few million masks [1,2]. As a result of their structure, which consists of several layers of non-degradable plastics such as polypropylene, polyethylene terephthalate, polyamide, etc. [3,4], many serious environmental burdens have appeared, accompanied by the generation of more microplastics, causing the pollution of the aquatic environment, ground water, and having effect on organisms [5,6]. However, WMs mainly contain hydrocarbons and many organic compounds made from petroleum compounds that can be recovered again using thermochemical techniques [7,8,9], thus avoiding landfill burdens of WMs such as soil, water and air pollution, as well as infection risks [10]. Additionally, it makes WMs a new source of value-added energy production that can be used to face severe energy shortages, especially in the light of geopolitical changes and conflicts [11]. The concept of converting WMs into energy products demonstrated high efficiency and an attractive management alternative when compared to other technologies, such as using them as fillers or even extracting raw materials, such as activated carbons [12].
The thermochemical conversion of waste has the potential to reduce waste volumes, decrease greenhouse gas emissions, and produce renewable energy and valuable products [13,14]. Pyrolysis and gasification are the two most common types of thermochemical treatments that have been used for reducing the volume of WMs and converting them into various flammable, chemical, hydrogen-rich compounds using thermogravimetry [15,16]. Additionally, pyrolysis kinetics have shown that it has a less complex reaction in terms of activation energy (232 kJ/mol) compared to other biomass species [17,18]. Even this complexity can be reduced down to 169 kJ/mol by using a catalyst (ZSM-5 zeolite) during the thermal reaction, allowing the recovery of 31% of the butanol complex [19]. However, the large amount of catalyst included (25 wt.%) is a significant barrier to scaling up, especially since it is not easy to regenerate the used catalyst [20]. Therefore, many laboratory investigations have been carried out in the absence of a catalyst using an experimental setup to avoid problems with catalysts and to obtain optimal conditions that can produce the highest syngas and oil production [21,22]. These studies concluded that at 500 °C (pyrolysis) and 800 °C (gasification), WMs can completely decompose with high abundances of oil, syngas, soot, and less tar. Additionally, environmental analysis has shown that both approaches have lower pollutant emissions [15,21]. However, these studies have focused on technical implications, process optimisation, and environmental effects without taking economic analysis into consideration. In order to scale up the experimental setup of the pyrolysis and gasification of WMs to industrial plants, it is necessary to study the techno-economic analysis (TEA) of both approaches in order to investigate their economic feasibility for the purpose of upgrading [23].
TEA is the common tool used to evaluate new and advanced technologies, including the pyrolysis and gasification process [24,25]. This type of evaluation can provide the main economic implications of the possibilities of converting WMs into energy products. In addition to determining the extent to which it can be applied, these approaches are integrated into the energy sector and used to choose suitable directions for the development and measurement of its policy [26]. This evaluation is also important for decision makers because it reflects the impacts on the whole society by creating a good source of abundant energy production, creating new jobs in the energy sector and tax revenues that contribute to the returns received by the countries [27]. Based on this, TEA was used to investigate the economic impacts of energy production from various wastes, such as agriculture, food, textiles, etc. [28,29,30]. These studies led to acceptable results that made these wastes a reasonable option for energy generation in many countries, with positive effects on gross domestic product and employment. However, the TEA for power production from WMs is still missing since it was introduced less than three years ago. In order to fill this gap, this research aims to study the TEA of converting WMs for oil and syngas production using thermochemical treatment, in particular pyrolysis and gasification treatments, which are classified as the best available emerged technology in R&D projects for treating masks [31]. The European Union (EU) region was designated as the site for the study, while the target of the study was to recycle 33 million WM pieces generated during the COVID-19 pandemic in the EU and to turn them into energy products based on two treatment scenarios: pyrolysis and gasification. The thermochemical plant data collected from the experimental setups had a capacity of 0.2–1 kg/h [15,16]; then, they were upscaled up to one tonne based on the mass balance concept. Since no market standard for the recycling of WMs has been established yet, incineration was considered as the market-standard recycling technology and the results of pyrolysis and gasification scenarios were compared to the incineration scenario [32]. Discounted payback (DPB), simple payback (SPB), net present value (NPV), internal rate of return (IRR), and sensitivity analysis were considered in all the suggested scenarios [33,34]. The potential impact of oil and syngas on the cost of energy production for all the scenarios was investigated. Finally, several technical and economic assumptions were collected from the literature, while all industrial data needed for scale-up plant capacities were taken from technical catalogues [35,36]. Although currently there is no strategy for separately collecting waste masks for any type of treatment, including thermal treatment, for the purpose of this study, it was assumed that some collection businesses were developed to be ready for any future unexpected pandemic, which could facilitate its management in the future without many restrictions. Additionally, such studies could promote investments into the development of various collection systems of masks.

2. Analysis of Feedstock

2.1. Analysis of WMs Generated in the EU during COVID-19 Pandemic

As mentioned above, WMs were used as a feedstock for treatment in the current research. According to EN149, 3299 11 70 filtering face pieces (FFPs) and 3299 11 79 protective face masks were produced and imported into the EU as respiratory protective devices for protection against particulate matter in 2021 with an estimated total weight of 133,019 tonnes [37]. Three-ply and KF94 masks were the most consumed types in the EU region during the COVID-19 pandemic period due to being cheap and having good protection and breathing performance. These kinds of masks are composed of two nonwoven fabrics and a single layer of molten-blown filter r. Based on previously performed FTIR analysis, 3PFM contains only one major functional group at 3004 cm−1 due to –OH groups, in addition to weak C–H group at 2950 cm−1 [17]. Additionally, according to their elemental and proximate analysis, these masks are distinguished by their higher carbon (85 wt.%) and volatile matter (>96 wt.%) contents [15,16,17]. In fact, in general WMs are durable and they can be crushed for disposal or storage purposes using a mechanical press or a machine designed for this purpose. The process typically involves placing the mask into a crushing chamber and the application of pressure until it is compressed into a smaller size [16]. Additionally, it is crucial to follow proper safety protocols when handling used face masks, as they may be contaminated with potentially hazardous materials [10]. Based on that, the collected WMs with dry basis undergo mechanical pre-treatment for size reduction and better flux heating exchange and transfer during the conversion process, where the quality of the formulating products is directly affected by the feedstock’s particle size [38]. The collected WMs were crushed and then converted into granules (Figure 1B,C). Then, the WM granules were sun-dried for a few days to remove some moisture content.

2.2. Definition of the Goal and Scope

The main objective of this research was to investigate the TEA feasibility of energy products derived from the pyrolysis and gasification of WMs produced in the EU during the COVID-19 pandemic period. The results were compared to the incineration of PP plastic waste as a main reference. The functional unit (FU) was defined in the present study as 1 tonne of the collected WMs, followed by upscaling up to the whole amount produced in the EU (133,019 tonnes), which was adjusted as a geographical background in the present study.

3. Technical Analysis

Waste treatment is defined as a service that can be used to avoid or mitigate environmental impact. The cost of this service is paid by the parties interested in waste handling and is usually indicated as a negative value. Additionally, it often refers to a “gate fee” in landfills or waste incineration plants, as the primary objective is waste treatment rather than the production of any product. However, some positive values can be obtained if there is a demand for particular materials previously considered as waste (based on the type of treatment scenarios). Energy generation from WMs and their yield and composition are related to the type of process and its application conditions. Thus, three scenarios were suggested to treat WMs and convert them into energy products. Incineration (scenario A) was selected as a standard recycling technology, while pyrolysis (scenario A) and gasification (scenario B) were selected as emerging technologies, and the suggested layout is shown in Figure 1. As shown in the schematic diagram, the collection and transportation processes were neglected in the suggested TEA model since no real industrial strategy has been developed for this yet. The TEA layout began with a pre-treatment of WMs using shredding and pelletising processes, followed by a main thermochemical treatment. The description of the suggested treatment of WM scenarios, layout and boundaries of each process are explained in detail in the following sections, including their yield assessment, energy balance, energy demand, boundaries and data collection.

3.1. Incineration Scenario

As mentioned above, this scenario represents the market-standard recycling technology in most of the EU countries. This treatment already exists on the industrial level and thus, there is no need for start-ups. The data were collected while incinerating polypropylene plastic (PP) waste. The TEA calculation of this scenario was performed according to “Medium Waste to Energy Combined Heat and Power (CHP) Systems”. In the case of TEA, this system is used to estimate up to 27 tonnes/h of waste [35]. Thus, this amount of waste was estimated and then decreased to 1 tonne of WMs. In this scenario, heat and electricity can be considered products that may be sold on the respective markets. As electricity is also used in waste treatment processes, we calculated the cost of heat produced to check its competitiveness in the district heat market.

3.2. Pyrolysis Scenario

The boundary conditions of the pyrolysis scenario of WMs were determined based on the results of real experiments for increasing plant capacity conducted on a laboratory scale with a plant capacity of 0.2 kg/h [15], and then they were verified commercially. The scalability of the pyrolysis reactor was determined based on the TEA studies in the literature. The crushed WMs were fed into the pyrolysis reaction chamber (fluidised bed reactor) in ambient nitrogen (N2) gas with a flow rate of 20 L/min at 500 °C for almost 1 h to produce oil, gas, and char products [15]. The heavy oil fraction could be collected at the bottom, while the formulated hot gases instantly passed through the cyclone to separate the tar fraction. Meanwhile, char stayed in the reaction chamber and could exit after turning the electricity off and cooling it.

3.3. Gasification Scenario

In the gasification scenario, the WM granules were continuously fed into a bubbling fluidised bed gasifier with a feeding rate of 4.46 g/min at 800 °C in a steam atmosphere with a steam flow rate of 6.83 g/min to synthesise syngas, tar, and char products [16], while the granules could be directly converted into hot vapours that rapidly went through the high-efficiency cyclone to condense the tar and char fractions. As shown in the pyrolysis and gasification boundaries, the WM feedstock and other energy consumed in different forms (e.g., electricity, heat) used in the thermal decomposition process are considered the main inputs. Additionally, there are other auxiliary inputs, such as chemicals and gases used to assist the degradation process. The outputs can be classified as energy (oil, gas, and syngas) and non-energy (char) products. Thus, the energy balance can be estimated for each scenario based on the energy inputs and outputs, which mainly depend on the applied temperature in the reaction. Additionally, the consumed and produced energy can be expressed in terms of the lower heating value (LHV). Finally, the fluidised bed pyrolysis and gasification reactors used for this analysis had a capacity of 1 tonne per run (1 tonne/h). The conversion system was coupled with a condenser unit (tar separation), cyclone (for soot separation), and a gaseous separator. This system was adopted in this study as an auto-thermochemical technique for the conversion of carbonaceous WM feedstock into syngas, oil, char, and a condensable gas mixture.

4. Economic Analysis

4.1. Model Selection

The TEA of alternatives to WM treatment was studied using the discounted cash flow model due to its flexibility in choosing the variables to be calculated and to generate others [39]. Additionally, this approach allows the calculation of SPB, NPV, DPB, and IRR factors based on some assumptions that can be gathered from the literature and available statistics, and it has the ability to estimate the required indicators for WM treatment and product costs [40].

4.2. Model Assumption

Usually, the construction time of conversion plants is taken into consideration in TEA studies, and it is mostly estimated at about two years. This means that the treatment of masks can start only two years after the recycling plants have been built, which does not make sense because WMs are classified as hazardous waste that cannot be kept for a long time and that have to be disposed of early to avoid the spread of infection. Therefore, it was difficult to consider the construction duration as a time factor in the current study and to wait for a new treatment plant to be built, and it was more logical to use some of the already-built recycling plants. Based on that, the financial data for both treatments (pyrolysis and gasification) were considered as an “overnight cost”, while this approach can be used for the comparison of the developed projects and the provision of simplistic cost as a ratio of maximum capacity. Accordingly, this factor was not included in the calculations, and it was replaced by the payment of rent and service for the plant, in addition to a gate fee for both treatments. This fee can be paid by the plant owner in the form of operators, electricity, chemicals, and gases. For simplicity, it can be called inputs, and all these elements were involved with variable costs. Regarding the unplanned outage factor, additional time for maintenance and emergency issues was indicated and can be estimated at 3% of the operating time [36].

4.3. Cost Analysis

4.3.1. Fixed and Variable Costs

The economic analysis of WM pyrolysis and gasification was performed using the annual cost approach, where the annual cost can be expressed as a sum of the fixed cost and the variable cost of the suggested scenarios. Additionally, in order to estimate the above-mentioned factors, firstly the fixed and variable costs of pyrolysis and gasification treatments should be explored. Variable costs include the changed expenses of nitrogen gas, WM feedstock, and thermal requirement, while the fixed costs are expenses that include the cost of operating labour, maintenance, overhead, and insurance [33]. Both costs were previously calculated by Fadhilah et al. (2023) and Zang et al. (2023) for pyrolysis and gasification, as shown in Table 1 [33,41]. Additionally, these costs were calculated in the “Danish Energy Agency” for incineration treatment [42]. These values were used “as it is” in the present research.

4.3.2. Net Present Value

The NPV factor is calculated as the sum of discounted annual cash flows using Equation (1) [41]. In this formula, t is the period (year) number; T is the project’s lifetime, which in this case is equal to the equipment’s lifetime; N C F t is the net cash flow in the year t , for the year in which investment to equipment is made; C 0 is equal to the investment cost; d r is the discount rate. The discount rate was assumed to be 10% based on the value reported in the literature [43].
N P V = t = 0   T   N C F t 1 + d r t

4.3.3. Simple Payback

The most common way to calculate SPB is to divide the initial investment by the annual net cash flow. However, this approach requires that the annual net cash flow be constant, which is difficult to achieve in practice due to price fluctuations [44]. The concept of average annual cash flow can help to overcome this problem, but payback time may be underestimated or overestimated depending on cash flow dynamics [45]. Therefore, each year of technology operation is simulated, and the payback time is measured when the cumulative cash flow is equal to the initial cost of equipment. In this case, the WM treatment cost and the price that can be obtained by selling the products of the process analyses are exogenously pre-defined.

4.3.4. Discounted Payback

The DPB shows the break-even point with respect to discounted cash flows (the NPV in the break-even point is equal to zero) [46]. Thus, it is determined similarly to the simple payback, only discounted cash flows are used in this case.

4.3.5. Internal Rate of Return

The IRR can be used to evaluate projects that may differ in size and duration. Due to the universal nature of the IRR indicator, the IRR was used as a primary tool in comparing WM treatment alternatives. The IRR indicator can be used to evaluate, compare, and rate investment alternatives according to their profitability. The IRR is defined as a discount rate that makes the NPV equal to 0 as shown in Equation (2) [47].
  t = 0 T N C F t 1 + I R R t = 0

4.3.6. Production Cost

In order to calculate the production cost of the suggested treatments, firstly, the required investment return level was decided in terms of the discount rate. Then, the NPV was assumed to be zero, and an equation was solved to find the corresponding WM treatment cost or the cost of the product obtained after the treatment, using one of these variables as an assumption. The market price of the treatment product (oil, syngas, char, and tar) was used when the WM treatment cost was calculated, and the alternative cost of waste treatment (e.g., landfilling or waste incineration) was used to calculate the cost of the treatment product. Through the proposed scenarios, multiple products can be obtained (heat, electricity, oil, syngas, etc.), and different products’ cost combinations may result in the same cash flows. Therefore, the cost was endogenously calculated for only one product, assuming possible income from other products’ sales based on their market prices.

4.3.7. Sensitivity Analysis

Sensitivity analysis (SA) is an approach used to investigate how sensitive the output of a model is to changes in its input parameters. Usually, numerous sensitivity studies are performed to investigate the cost of production and to indicate improvements needed for competitive purposes. The changes in production cost have a significant effect on the plant profitability. This sensitivity analysis can be conducted by varying the value of parameters and assumptions (have a strong impact on the performance and economics of the plant), then checking their effect on the major indicators. The SA of each scenario was assessed in the following steps. Firstly, the input variables were defined, then their probability functions were determined based on different probability distributions (e.g., rectangular, triangular, or normal distributions) [48]. Additionally, the output variables were defined in the same way. Afterwards, the sampling matrix was presented by pseudo-random sampling (Monte Carlo, MC) or quasi-random sampling (quasi-Monte Carlo, QMC) [49]. Finally, appropriate interval yields were established for the cumulative probability distribution of the model output, which can be used to calculate the standard deviation (σ) or confidence intervals. The analysis was performed using SimLab software. Regarding the definition of variables, since WM is medical waste, it should be disposed in a suitable way, and a gate fee has to be paid. The gate fee cost is the main variable cost of the inputs, while the costs of output products were the main output variables in each scenario, in particular, incineration (electricity and heat), pyrolysis (oil, gas, and char), and gasification (syngas, tar, and char). The gate fee was defined based on a uniform distribution in the interval of [−100:0], while the outputs were defined based on a normal distribution.

4.4. Data Collection

4.4.1. Pre-Treatments

The data (input heat and electricity, mass and energy balance, and output products) of the suggested pre-treatments were collected from the recent published articles dealing with the pyrolysis and gasification of WMs and the products resulting from the pyrolysis and gasification of WMs. The consumed energy in the shredding and pelletising processes of WMs was estimated at 0.011 kWh/kg and 0.096 kWh/kg, respectively [50,51]. It was assumed that the pre-treatment stage worked until all the generated amount of WMs were treated.

4.4.2. Incineration

Performance and cost data for the incineration scenario were directly collected from the existing industrial scale incinerators based on CHP systems. The catalogues of technological data issued by the Danish Energy Agency were used to ensure the consistency of the assumptions about the considered facemask treatment alternatives [42]. In the case of waste incineration, the catalogue of energy plants for electricity and district heating generation was used as the primary information source. A medium-sized waste-to-energy combined-heat-and-power plant (CHP) with a plant capacity of 27.16 tonne/h (79.97 MW) was used to describe the standard waste incineration technology and the benchmark for novel technological approaches to WM treatment. The key data (exogenous and endogenous variables) and its sources are summarised in Table 2.

4.4.3. Pyrolysis and Gasification Treatments

With regard to pyrolysis and gasification scenarios, both main treatments are classified as emerging technologies without no real commercial market related to the conversion of WMs, so the data needed for evaluation were collected according to two different main levels: laboratory and industrial. The laboratory level was allocated to collect data regarding the optimum operation conditions (e.g., temperature, flow rate, time, etc.), while the yield and composition of the formulated products formed individual scenarios, which were not available yet at the industrial scale. Meanwhile, the industrial level was allocated to collect data related to raw material costs, labour costs, financial costs, etc. based on the applicable market standards for pyrolysis and gasification technologies in the EU area, which helped to improve the accuracy of the economic analysis.

Laboratory Treatment Scale

The data in this section were collected from pyrolysis (0.2 kg/h) and gasification (1 kg/h) plants with small capacities. The laboratory results showed that WMs can be converted into oil, gaseous, and char products at 500 °C using pyrolysis vs. syngas, tar, and char products at 800 °C in the case of gasification, and their yields are summarised in Table 3 [15,16]. The yields of oil, tar, and char products were determined by weight, while the yield of gas and syngas was calculated by percentage difference. Additionally, the price values for these products were calculated based on the values reported in market prices or in the literature, and they are included in the same table [52,53,54]. These values were used as the initial data for the upscaling and modelling of 1 tonne/h industrial SMW pyrolysis and gasification plants.

Industrial Treatment Scale

Since pyrolysis and gasification already exist as industrial technologies for other feedstock [24,25,26,27,28,29], there is no need for start-ups, as these technologies can directly be used to reduce the implementation cost. In order to adapt the suggested technologies for the treatment of WMs, some general data were assumed. The pyrolysis and gasification plants were designed to treat one tonne of WMs/h with continuous feeding. Additionally, the costs of maintenance and other costs necessary to treat the full amount of WMs during the COVID-19 pandemic period were considered. The consumed energy in pyrolysis (at 500 °C) and gasification (at 800 °C) treatments was estimated as 600 kWh/kg and 3129 kWh/tonne, respectively [52,53]. Remaining missing data at the industrial level were estimated, as well as current data from the literature related to techno-economic studies of pyrolysis and gasification technologies of WMs, and all data are shown in Table 3. Based on the laboratory study about WM pyrolysis, and having upscaled up to one tonne, one tonne of WMs can produce 0.4226 tonne (oil), 0.0361 tonne (char), and 0.5413 tonne (gas) in the case of pyrolysis, while in the gasification case, one tonne of WMs can produce 0.897 tonne (syngas), 0.013 tonne (char), and 0.897 tonne (tar). The measured HHV for these products was 20.88 MJ/kg (oil), 47.26 MJ/Nm3 (syngas), 41.139 MJ/kg (tar), and 19.76 MJ/kg (char). The thermal energy needed for the pyrolysis of one tonne of WMs was estimated at 872.74 kWh [16,56].

5. Results and Discussion

5.1. Product Prices Analysis

Table 4 shows the prices of products obtained from each scenario based on the developed model. When compared to the commercial prices of the products (baseline), these output products had higher performance; special oil, gaseous, and char products had an improvement of 138%, 269%, and 296%, respectively. Meanwhile, tar and char- gasification proved lower performance. Synthetic gas (syngas), on the other hand, proved to perform almost as well as commercial products, whereas syngas showed similar performance to commercial products. On the other hand, based on the calculations, the feedstock price (gate fee cost) was estimated at 45.4 EUR/tonne (84% reduction) and 10% discount rate, which means that stakeholders do not need to overpay for the disposal of WMs. Despite the promising results and prices of manufactured products, this approach was used to evaluate the economic performance of each product separately without taking into account the impact of other products and the economic performance of all conversion processes. Finally, the calculated revenue generation from each scenario, including the SPB, NPV, DPB, and IRR, is shown in Table 5.

5.2. Evaluation of IRR Performance

Since each scenario had different output products, it was difficult to compare them based on the production cost, and the comparison was performed based on the IRR results, hence ensuring fair comparison and accuracy of the results. The IRR values calculated for all the suggested scenarios are illustrated in Table 5. As shown, the calculation showed that the IRR for incineration, pyrolysis, and gasification was calculated as 7.56%, 1.73%, and 12.51%, respectively. Obviously, pyrolysis had a lower performance with a chance of negative yield, while gasification proved to be the best method for processing WMs. The cumulative probability distribution of the IRR of all scenarios with different input and output variables is shown in Figure 2. The relationships were fitted using the QMC sampling approach. As shown in the figure, the IRR for pyrolysis lies to the left of the incineration and gasification scenarios; hence, it is the first-order stochastically dominated (FSD) item in both scenarios [57]. The results also show that the IRR for incineration was smaller than 7.6%, which means that there is a higher risk associated with the treatment of WMs in the EU region, in contrast to the treatment of WMs using gasification, where the IRR, under normal circumstances, was above 12.5%.

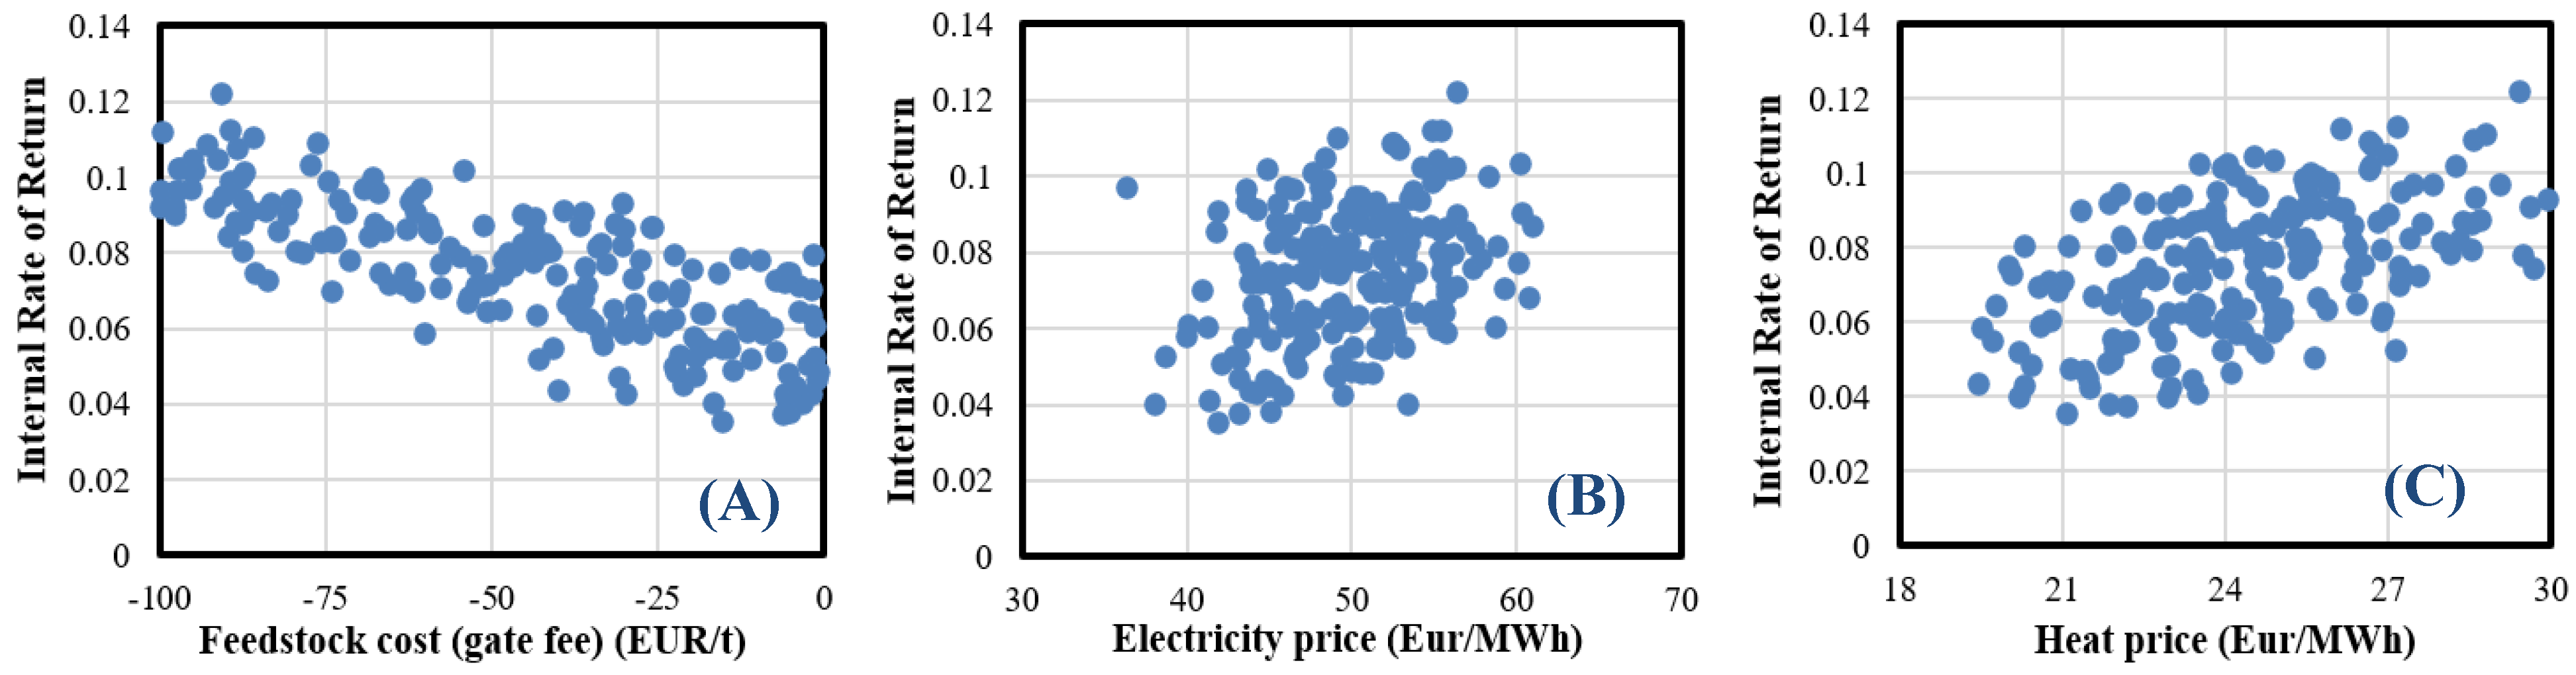
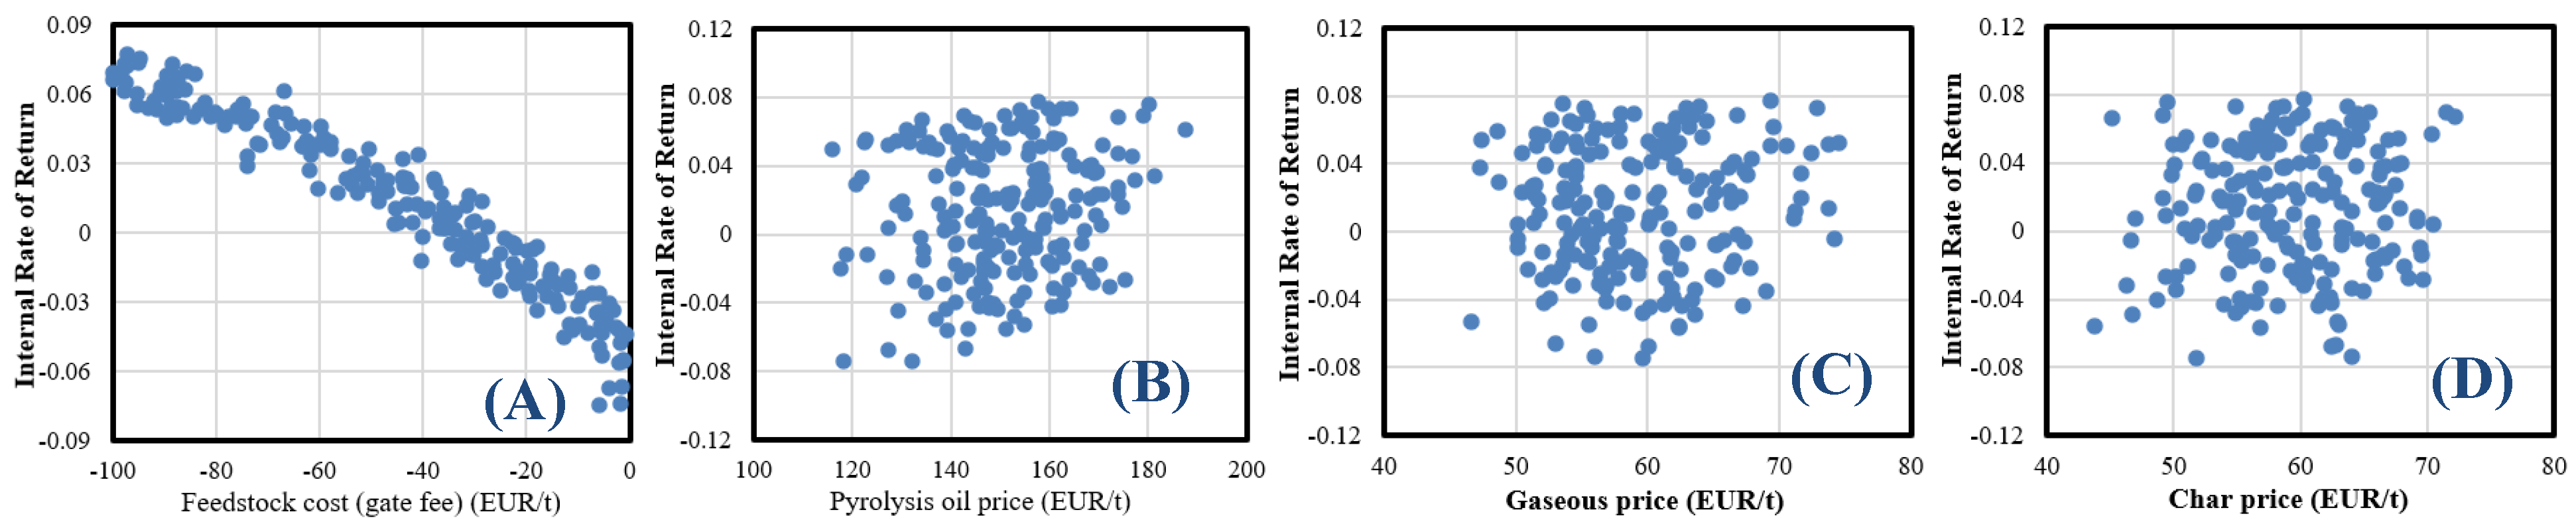
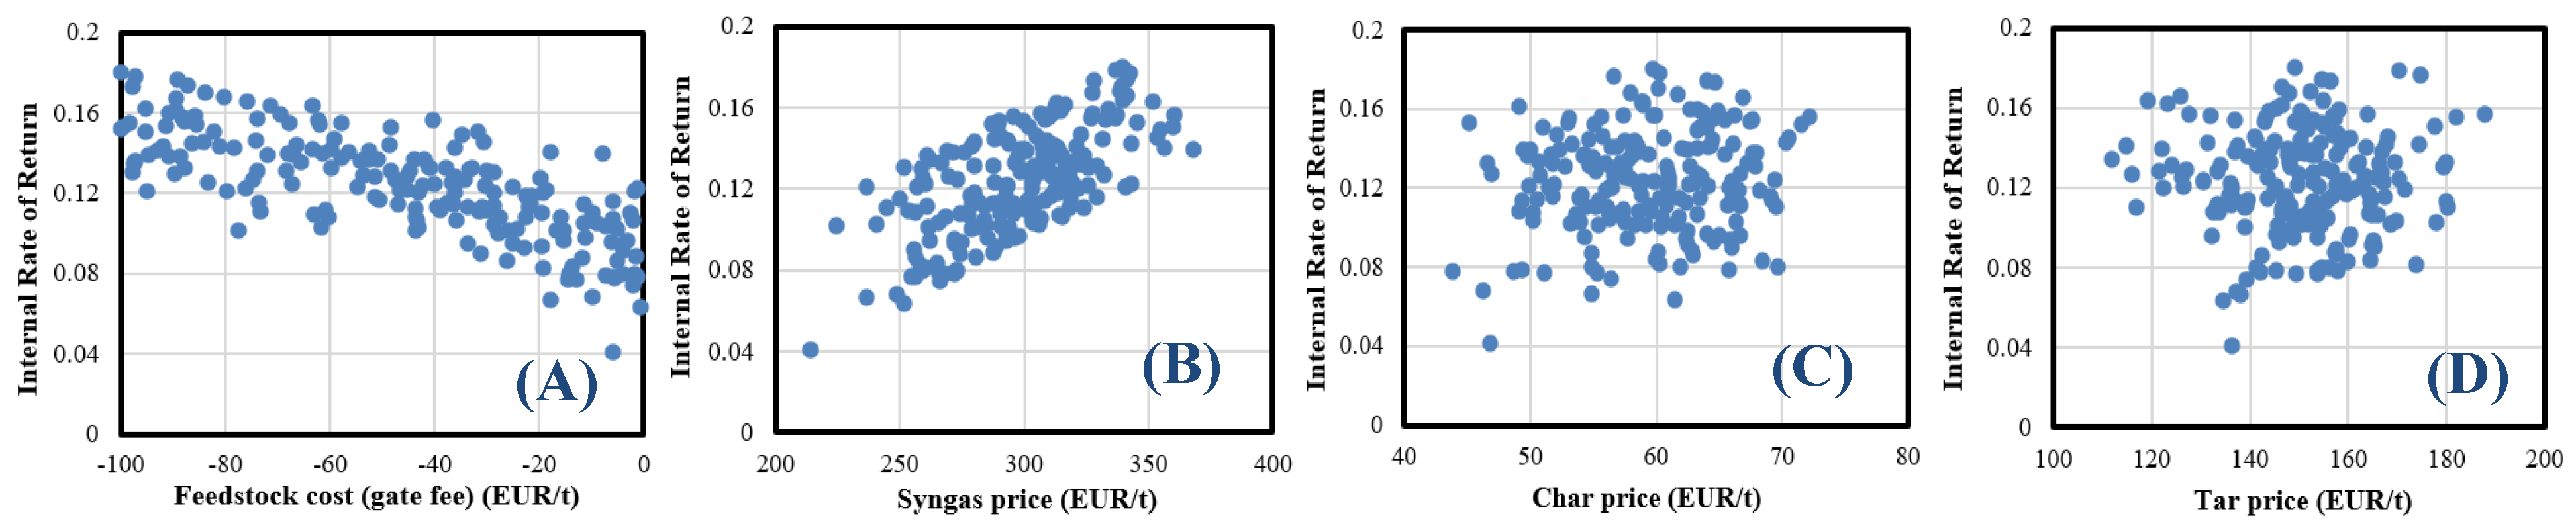
5.3. Effect of Input Variables on IRR Performance

In order to study the impact of specified variables of each scenario on their IRR performance, the sample set of each variable was adjusted and generated using scatter plots since it is classified as the best-suited method to visualise information about causal relationship insights. Figure 3, Figure 4 and Figure 5 show the scatter plots of the incineration, pyrolysis, and gasification scenarios under the effect of gate fee and output product costs (electricity, heat, oil, gas, char, syngas, and tar). As shown in all scenarios, the value of the IRR increased linearly with the increase in gate fee price. Additionally, the IRR showed a positive return in the case of the incineration and gasification scenarios, even without the gate fee, which is contrary to pyrolysis, which had positive return when the price exceeded 31 EUR/tonne. Meanwhile, heat and syngas prices were distributed uniformly when compared to other outputs that manifested random distortion. Based on these results, the treatment of WMs using gasification technology is highly recommended in the EU, promising high profits.

6. Future Work and Recommendations

Pollution control costs can be significant of TEA, but they are necessary to protect human health and environment. By reducing the negative impacts of industrial activities, pollution control measures can also help businesses to improve their reputation, reduce regulatory risk, and increase operational efficiency in the long run, in the case of the suggested scenarios [13]. However, at first it is necessary to study the life cycle assessment of the proposed technology. Our group is constructing this research now.

7. Conclusions

In the present research, the techno-economic analysis (TEA) of the thermochemical treatment of surgical mask waste (WM) produced in the EU during COVID-19 pandemic was performed. The expenses and revenue involved in the treatment of WMs using incineration, pyrolysis, and gasification techniques at commercial plants were evaluated in terms of discounted payback, simple payback, net present value (NPV), production cost, and internal rate of return (IRR). Gate fee, electricity, heat, oil, and gas were estimated as the main variables. Additionally, the sensitivity analysis was conducted, followed by the generation of cumulative a probability distribution of the IRR indicator for the treatment of WMs using the specified scenarios. The results showed that syngas has the highest production cost compared to other products. Additionally, the gasification process revealed a higher techno-economic performance in the treatment of WMs with revenue generation estimated at 8 Year (SPB), 4.59 MEUR (NPV), 14 Year (DPB), and 12.51% (IRR). Therefore, this techno-economic evaluation can help to conduct a sensitivity analysis for each scenario, hence contributing to decision making when a suitable cost-effective solution needs to be chosen in order to be adopted in the future on the industrial scale.

Author Contributions

S.Y.: Conceptualization, Data curation, Formal analysis, Funding acquisition, Investigation, Methodology, Project administration, Resources, Software, Supervision, Writing—original draft, Writing—review & editing. V.L.: Conceptualization, Data curation, Formal analysis, Funding acquisition, Investigation, Methodology, Project administration, Resources, Software, Supervision, Writing—original draft, Writing—review & editing. N.S.: Conceptualization, Data curation, Formal analysis, Project administration, Resources. All authors have read and agreed to the published version of the manuscript.

Funding

This project has received funding from European Regional Development Fund (project No 13.1.1-LMT-K-718-05-0017) under grant agreement with the Research Council of Lithuania (LMTLT). Funded as European Union’s measure in response to Cov-19 pandemic.

Conflicts of Interest

The authors declare no conflict of interest.

References

  1. Ganesapillai, M.; Mondal, B.; Sarkar, I.; Sinha, A.; Ray, S.S.; Kwon, Y.N.; Nakamura, K.; Govardhan, K. The face behind the COVID-19 mask—A comprehensive review. Environ. Technol. Innov. 2022, 28, 102837. [Google Scholar] [CrossRef] [PubMed]
  2. Lee, S.B.; Lee, J.; Tsang, Y.F.; Kim, Y.M.; Jae, J.; Jung, S.C.; Park, Y.K. Production of value-added aromatics from wasted COVID-19 mask via catalytic pyrolysis. Environ. Pollut. 2021, 283, 117060. [Google Scholar] [CrossRef] [PubMed]
  3. Eimontas, J.; Stasiulaitiene, I.; Zakarauskas, K.; Striūgas, N. An eco-friendly strategy for recovery of H2-CH4-rich syngas, benzene-rich tar and carbon nanoparticles from surgical mask waste using an updraft gasifier system. Energy Sources Part A Recovery Util. Environ. Eff. 2023, 45, 5068–5080. [Google Scholar] [CrossRef]
  4. Tcharkhtchi, A.; Abbasnezhad, N.; Zarbini Seydani, M.; Zirak, N.; Farzaneh, S.; Shirinbayan, M. An overview of filtration efficiency through the masks: Mechanisms of the aerosols penetration. Bioact. Mater. 2020, 6, 106–122. [Google Scholar] [CrossRef]
  5. Ray, S.S.; Lee, H.K.; Huyen, D.T.T.; Chen, S.S.; Kwon, Y.N. Microplastics waste in environment: A perspective on recycling issues from PPE kits and face masks during the COVID-19 pandemic. Environ. Technol. Innov. 2022, 26, 102290. [Google Scholar] [CrossRef]
  6. Wang, Z.; An, C.; Chen, X.; Lee, K.; Zhang, B.; Feng, Q. Disposable masks release microplastics to the aqueous environment with exacerbation by natural weathering. J. Hazard. Mater. 2021, 417, 126036. [Google Scholar] [CrossRef]
  7. Sun, S.; Yuan, Y.; Chen, R.; Xu, X.; Zhang, D. Kinetic, thermodynamic and chemical reaction analyses of typical surgical face mask waste pyrolysis. Therm. Sci. Eng. Prog. 2021, 26, 101135. [Google Scholar] [CrossRef]
  8. Ardila-Suárez, C.; Pablo Villegas, J.; Lins de Barros Neto, E.; Ghislain, T.; Lavoie, J.M. Waste surgical masks to fuels via thermochemical co-processing with waste motor oil and biomass. Bioresour. Technol. 2022, 348, 126798. [Google Scholar] [CrossRef]
  9. Purnomo, C.W.; Kurniawan, W.; Aziz, M. Technological review on thermochemical conversion of COVID-19-related medical wastes. Resour. Conserv. Recycl. 2021, 167, 105429. [Google Scholar] [CrossRef]
  10. Fabiani, C.; Cavagnoli, S.; Chiatti, C.; Pisello, A.L. Management of disposable surgical masks for tackling pandemic-generated pollution: Thermo-acoustic investigations and life cycle assessment of novel recycled building panels. Resour. Conserv. Recycl. 2022, 186, 106509. [Google Scholar] [CrossRef]
  11. Pourebrahimi, S. Upcycling face mask wastes generated during COVID-19 into value-added engineering materials: A review. Sci. Total Environ. 2022, 851, 158396. [Google Scholar] [CrossRef]
  12. Zhao, Z.; Wu, S.; Liu, Q.; Xie, J.; Yang, C.; Wang, F.; Wan, P. Recycling waste disposable medical masks in improving the performance of asphalt and asphalt mixtures. Constr. Build. Mater. 2022, 337, 127621. [Google Scholar] [CrossRef]
  13. Serafin, J.; Sreńscek-Nazzal, J.; Kamińska, A.; Paszkiewicz, O.; Michalkiewicz, B. Management of surgical mask waste to activated carbons for CO2 capture. J. CO2 Util. 2022, 59, 101970. [Google Scholar] [CrossRef]
  14. Miah, M.J.; Pei, J.; Kim, H.; Sharma, R.; Jang, J.G.; Ahn, J. Property assessment of an eco-friendly mortar reinforced with recycled mask fiber derived from COVID-19 single-use face masks. J. Build. Eng. 2023, 66, 105885. [Google Scholar] [CrossRef]
  15. Eimontas, J.; Stasiulaitiene, I.; Zakarauskas, K.; Striūgas, N. Pyrolysis of all layers of surgical mask waste as a mixture and its life-cycle assessment. Sustain. Prod. Consum. 2022, 32, 519–531. [Google Scholar] [CrossRef]
  16. Nam, J.Y.; Lee, T.R.; Tokmurzin, D.; Park, S.J.; Ra, H.W.; Yoon, S.J.; Mun, T.Y.; Yoon, S.M.; Moon, J.H.; Lee, J.G.; et al. Hydrogen-rich gas production from disposable COVID-19 mask by steam gasification. Fuel Lond 2023, 331, 125720. [Google Scholar] [CrossRef]
  17. Eimontas, J.; Striūgas, N.; Abdelnaby, M.A. Pyrolysis kinetic behaviour and TG-FTIR-GC-MS analysis of Coronavirus Face Masks. J. Anal. Appl. Pyrolysis 2021, 156, 105118. [Google Scholar] [CrossRef]
  18. Duc Bui, V.; Phuong Vu, H.; Phuong Nguyen, H.; Quang Duong, X.; Tuyen Nguyen, D.; Tuan Pham, M.; Quy Phong Nguyen, P. Techno-economic assessment and logistics management of biomass in the conversion progress to bioenergy. Sustain. Energy Technol. Assess. 2023, 55, 102991. [Google Scholar] [CrossRef]
  19. Yousef, S.; Eimontas, J.; Striūgas, N.; Abdelnaby, M.A. A new strategy for butanol extraction from COVID-19 mask using catalytic pyrolysis process over ZSM-5 zeolite catalyst and its kinetic behavior. Thermochim. Acta 2022, 711, 179198. [Google Scholar] [CrossRef]
  20. Kiminaitė, I.; Eimontas, J.; Striūgas, N.; Abdelnaby, M.A. Recovery of phenol and acetic acid from glass fibre reinforced thermoplastic resin using catalytic pyrolysis process on ZSM-5 zeolite catalyst and its kinetic behaviour. Thermochim. Acta 2022, 715, 179293. [Google Scholar] [CrossRef]
  21. Li, C.; Yuan, X.; Sun, Z.; Suvarna, M.; Hu, X.; Wang, X.; Ok, Y.S. Pyrolysis of waste surgical masks into liquid fuel and its life-cycle assessment. Bioresour. Technol. 2022, 346, 126582. [Google Scholar] [CrossRef] [PubMed]
  22. Chalermsinsuwan, B.; Li, Y.H.; Manatura, K. Optimization of gasification process parameters for COVID-19 medical masks using response surface methodology. Alex. Eng. J. 2023, 62, 335–347. [Google Scholar] [CrossRef]
  23. Li, J.; Wang, H.; Chen, H.; Wu, H.; Xu, G.; Dong, Y.; Zhao, Q.; Liu, T. Comparative thermodynamic and techno-economic analysis of various medical waste-to-hydrogen/methanol pathways based on plasma gasification. Appl. Therm. Eng. 2023, 221, 119762. [Google Scholar] [CrossRef]
  24. Yukesh Kannah, R.; Kavitha, S.; Preethi Parthiba Karthikeyan, O.; Kumar, G.; Dai-Viet, N.V.; Rajesh Banu, J. Techno-economic assessment of various hydrogen production methods—A review. Bioresour. Technol. 2021, 319, 124175. [Google Scholar] [CrossRef]
  25. Farzad, S.; Mandegari, M.; Görgens, J.F. A novel approach for valorization of waste tires into chemical and fuel (limonene and diesel) through pyrolysis: Process development and techno economic analysis. Fuel Process. Technol. 2021, 224, 107006. [Google Scholar] [CrossRef]
  26. Asim, M.; Kumar, R.; Kanwal, A.; Shahzad, A.; Ahmad, A.; Farooq, M. Techno-economic assessment of energy and environmental impact of waste-to-energy electricity generation. Energy Rep. 2023, 9, 1087–1097. [Google Scholar] [CrossRef]
  27. Lekavičius, V.; Galinis, A.; Miškinis, V. Long-term economic impacts of energy development scenarios: The role of domestic electricity generation. Appl. Energy 2019, 253, 113527. [Google Scholar] [CrossRef]
  28. Zhuo, C.; Xueqin, L.; Zhiwei, W.; Yantao, Y.; Tanglei, S.; Taoli, H.; Peng, L.; Yanling, L.; Youqing, W.; Tingzhou, L.; et al. Techno-economic and whole life cycle assessment of ester fuels production from agricultural waste via hydrothermal liquefaction. Ind. Crops Prod. 2023, 192, 116096. [Google Scholar] [CrossRef]
  29. Mahmood, R.; Parshetti, G.K.; Balasubramanian, R. Energy, exergy and techno-economic analyses of hydrothermal oxidation of food waste to produce hydro-char and bio-oil. Energy 2016, 102, 187–198. [Google Scholar] [CrossRef]
  30. Farahmandpour, R.; Karimi, K.; Denayer, J.F.M.; Shafiei, M. Innovative biorefineries for cleaner waste textile management towards circular economy: Techno-economic analysis. J. Clean. Prod. 2022, 378, 134500. [Google Scholar] [CrossRef]
  31. Li, J.; Ye, X.; Burra, K.G.; Lu, W.; Wang, Z.; Liu, X.; Gupta, A.K. Synergistic effects during co-pyrolysis and co-gasification of polypropylene and polystyrene. Appl. Energy 2023, 336, 120750. [Google Scholar] [CrossRef]
  32. Voss, R.; Lee, R.P.; Seidl, L.; Keller, F.; Fröhling, M. Global warming potential and economic performance of gasification-based chemical recycling and incineration pathways for residual municipal solid waste treatment in Germany. Waste Manag. 2021, 134, 206–219. [Google Scholar] [CrossRef]
  33. Fadhilah, N.A.; Islam, M.N.; Rosli, R. Techno-economic analysis of sawdust and rice husk co-pyrolysis for bio-oil production. Bioresour. Technol. Rep. 2023, 21, 101233. [Google Scholar] [CrossRef]
  34. Bridgwater, A.V.; Toft, A.J.; Brammer, J.G. A techno-economic comparison of power production by biomass fast pyrolysis with gasification and combustion. Renew. Sustain. Energy Rev. 2002, 6, 181–246. [Google Scholar] [CrossRef]
  35. Available online: https://www.spglobal.com/marketintelligence/en/campaigns/european-energy-sector?utm_source=bing&utm_medium=cpc&utm_campaign=Energy_EU_Power_Search_Google&utm_term=energy%20data&utm_content=&_bt=&_bk=energy%20data&_bm=p&_bn=o&_bg=1162184934407703&msclkid=46ff8cf4764e1b49f622ef131c611e2b (accessed on 1 January 2023).
  36. Available online: https://ens.dk/en/our-services/projections-and-models/technology-data/technology-data-renewable-fuels (accessed on 1 January 2023).
  37. Available online: https://www.fortunebusinessinsights.com/europe-protective-face-mask-market-105075 (accessed on 1 January 2023).
  38. Eimontas, J.; Striūgas, N.; Abdelnaby, M.A. Pyrolysis and gasification kinetic behavior of mango seed shells using TG-FTIR-GC–MS system under N2 and CO2 atmospheres. Renew. Energy 2021, 173, 733–749. [Google Scholar] [CrossRef]
  39. Sharma, P.; Sheth, P.N.; Mohapatra, B.N. Co-processing of petcoke and producer gas obtained from RDF gasification in a white cement plant: A techno-economic analysis. Energy 2023, 265, 126248. [Google Scholar] [CrossRef]
  40. Wu, W.; Xu, H.; Shi, B.; Kuo, P.C. Techno-economic analysis of plastic wastes-based polygeneration processes. Chem. Eng. Process. Process Intensif. 2023, 184, 109297. [Google Scholar] [CrossRef]
  41. Zang, G.; Zhang, J.; Ratner, A.; Shi, Y. Techno-economic analysis of a cooling, heating, and electricity trigeneration system based on downdraft fixed bed wood and tire gasification: Case study of a campus office building. Sustain. Energy Technol. Assess. 2023, 55, 102939. [Google Scholar] [CrossRef]
  42. Danish Energy Agency. Technology Data—Energy Plants for Electricity and District Heating Generation; Danish Energy Agency: København, Denmark, 2023; Available online: https://ens.dk/en/our-services/projections-and-models/technology-data (accessed on 1 January 2023).
  43. Wu, N.; Lan, K.; Yao, Y. An integrated techno-economic and environmental assessment for carbon capture in hydrogen production by biomass gasification. Resour. Conserv. Recycl. 2023, 188, 106693. [Google Scholar] [CrossRef]
  44. Chen, H.; Lu, D.; An, J.; Qiao, S.; Dong, Y.; Jiang, X.; Xu, G.; Liu, T. Thermo-Economic analysis of a novel biomass Gasification-Based power system integrated with a supercritical CO2 cycle and a Coal-Fired power plant. Energy Convers. Manag. 2022, 266, 115860. [Google Scholar] [CrossRef]
  45. Mairizal, A.Q.; Sembada, A.Y.; Tse, K.M.; Haque, N.; Rhamdhani, M.A. Techno-economic analysis of waste PCB recycling in Australia. Resour. Conserv. Recycl. 2023, 190, 106784. [Google Scholar] [CrossRef]
  46. Barbera, E.; Bertucco, A.; Nigam, K.D.P.; Kumar, S. Techno-economic analysis of a micro-scale biogas plant integrated with microalgae cultivation for the treatment of organic municipal waste. Chem. Eng. J. 2022, 450, 138323. [Google Scholar] [CrossRef]
  47. Kuppens, T.; van Darl, M.; Vanreppelen, K.; Thewys, T.; Yperman, J.; Carleer, R.; Schreurs, S.; van Passel, S. Techno-economic assessment of fast pyrolysis for the valorization of short rotation coppice cultivated for phytoextraction. J. Clean. Prod. 2015, 88, 336–344. [Google Scholar] [CrossRef]
  48. Jungmeier, G. The Biorefinery Fact Sheet. Int. J. Life Cycle Assess. 2017. [Google Scholar]
  49. Mathad, V.C.; Lahane, S. Assessment of hydrogen generation potential from biomass and its application for power generation in Andaman and Nicobar Islands: A review. Carbon Sci. Technol. 2016, 8, 146–152. [Google Scholar]
  50. Naimi, L.J.; Sokhansanj, S. Data-based equation to predict power and energy input for grinding wheat straw, corn stover, switchgrass, miscanthus, and canola straw. Fuel Process. Technol. 2018, 173, 81–88. [Google Scholar] [CrossRef]
  51. Gul, E.; Riva, L.; Nielsen, H.K.; Yang, H.; Zhou, H.; Yang, Q.; Skreiberg, Ø.; Wang, L.; Barbanera, M.; Zampilli, M.; et al. Substitution of coke with pelletized biocarbon in the European and Chinese steel industries: An LCA analysis. Appl. Energy 2021, 304, 117644. [Google Scholar] [CrossRef]
  52. Badger, P.; Badger, S.; Puettmann, M.; Steele, P.; Cooper, J. Techno-economic analysis: Preliminary assessment of pyrolysis oil production costs and material energy balance associated with a transportable fast pyrolysis system. BioResources 2011, 6, 6048. [Google Scholar] [CrossRef]
  53. Kodera, Y.; Yamamoto, T.; Ishikawa, E. Energy- and economic-balance estimation of pyrolysis plant for fuel-gas production from plastic waste based on bench-scale plant operations. Fuel Commun. 2021, 7, 100016. [Google Scholar] [CrossRef]
  54. Eimontas, J.; Striūgas, N.; Tatariants, M.; Abdelnaby, M.A.; Tuckute, S.; Kliucininkas, L. A sustainable bioenergy conversion strategy for textile waste with self-catalysts using mini-pyrolysis plant. Energy Convers. Manag. 2019, 196, 688–704. [Google Scholar] [CrossRef]
  55. Pei, P.; Korom, S.F.; Ling, K.; Nasah, J. Cost comparison of syngas production from natural gas conversion and underground coal gasification. Mitig. Adapt. Strateg. Glob. Chang. 2016, 21, 629–643. [Google Scholar] [CrossRef]
  56. Al Yahya, S.; Iqbal, T.; Omar, M.M.; Ahmad, M. Techno-economic analysis of fast pyrolysis of date palm waste for adoption in Saudi Arabia. Energies 2021, 14, 6048. [Google Scholar] [CrossRef]
  57. Tonkonogovas, A.; Lukošiūtė, S.-I.; Mohamed, A. Gas permeation and selectivity characteristics of sponge-like and finger-like structures of polysulfone membranes. Fuel 2023, 347, 128476. [Google Scholar] [CrossRef]
Figure 1. The layout of the suggested scenarios and their boundaries.
Energies 16 03948 g001
Figure 2. Cumulative probability distribution of IRR for treatment of WMs using different treatment scenarios.
Energies 16 03948 g002
Figure 3. Scatter plots of incineration scenario under the effect of (A) gate fee, (B) electricity, and (C) heat price.
Energies 16 03948 g003
Figure 4. Scatter plots of pyrolysis scenario under the effect of (A) gate fee, (B) oil, (C) gas, and (D) char price.
Energies 16 03948 g004
Figure 5. Scatter plots of gasification scenario under the effect of (A) gate fee, (B) syngas, (C) char, and (D) tar price.
Energies 16 03948 g005
Table 1. Assumption for pyrolysis and gasification scenarios.
ParametersIncineration [42]Pyrolysis
[42]
Gasification
[42]
Investment cost (MEUR/tonne)22.1511.1814.44
Fixed cost (MEUR/tonne)0.640.420.22
Variable cost (EUR/tonne)62.0818.0027.78
Table 2. Data collection for the standard treatment scenario.
ParameterValue [42]
Electrical efficiency22%
Heat efficiency80% (8.89 MWh)
Availability93.574%
Gate fee45.4 EUR/tonne
Electricity price49.67 EUR/MWh
Heat price24.4 EUR/MWh
Table 3. Yields of pyrolysis and gasification systems of WMs.
Pyrolysis ScenarioGasification Scenario
ProductYield (wt.%)Product Cost (USD/kg)ProductYield (wt.%)Product Cost
Oil42.260.30 [52]Syngas89.73.29 GJ−1 [55]
Gaseous54.130.2 [53]Char1.31.2 $/kg [54]
Char3.611.2 $/kg [54]Tar90.30 $/kg [52]
Table 4. Revenue generation from each product obtained from the suggested scenarios.
ScenarioItemProduction CostProducts Commercial PricesPerformance (%)
IncinerationElectricity71.67 EUR/MWh50 EUR/MWh43
Heat30.48 EUR/MWh24 EUR/MWh27
PyrolysisOil356.36 EUR/t150 EUR/t138
Gaseous221.11 EUR/t60 EUR/t269
Char237.72 EUR/t60 EUR/t296
GasificationSyngas257.45 EUR/t300 EUR/t−14
Char−2875.98 EUR/t150 EUR/t
Tar−1697.73 EUR/t60 EUR/t
Table 5. Cost analysis of scenarios used in treatment of face masks.
ScenarioSPB (Year)NPV (MEUR)DPB (Year)IRR (%)
Incineration12−30.46---7.56
Pyrolysis21−42.22---1.73
Gasification84.591412.51
Disclaimer/Publisher’s Note: The statements, opinions and data contained in all publications are solely those of the individual author(s) and contributor(s) and not of MDPI and/or the editor(s). MDPI and/or the editor(s) disclaim responsibility for any injury to people or property resulting from any ideas, methods, instructions or products referred to in the content.

