Currently, the classification of CO
2 flooding is mainly based on the relationship between original reservoir pressure and minimum miscible pressure, which is divided into miscible flooding, immiscible flooding, and near-miscible flooding. However, in the oil field development process, the reservoir pressure field undergoes dynamic changes due to the conduction between the injection and production wells, changing the miscible degree. Therefore, according to the miscible degree, CO
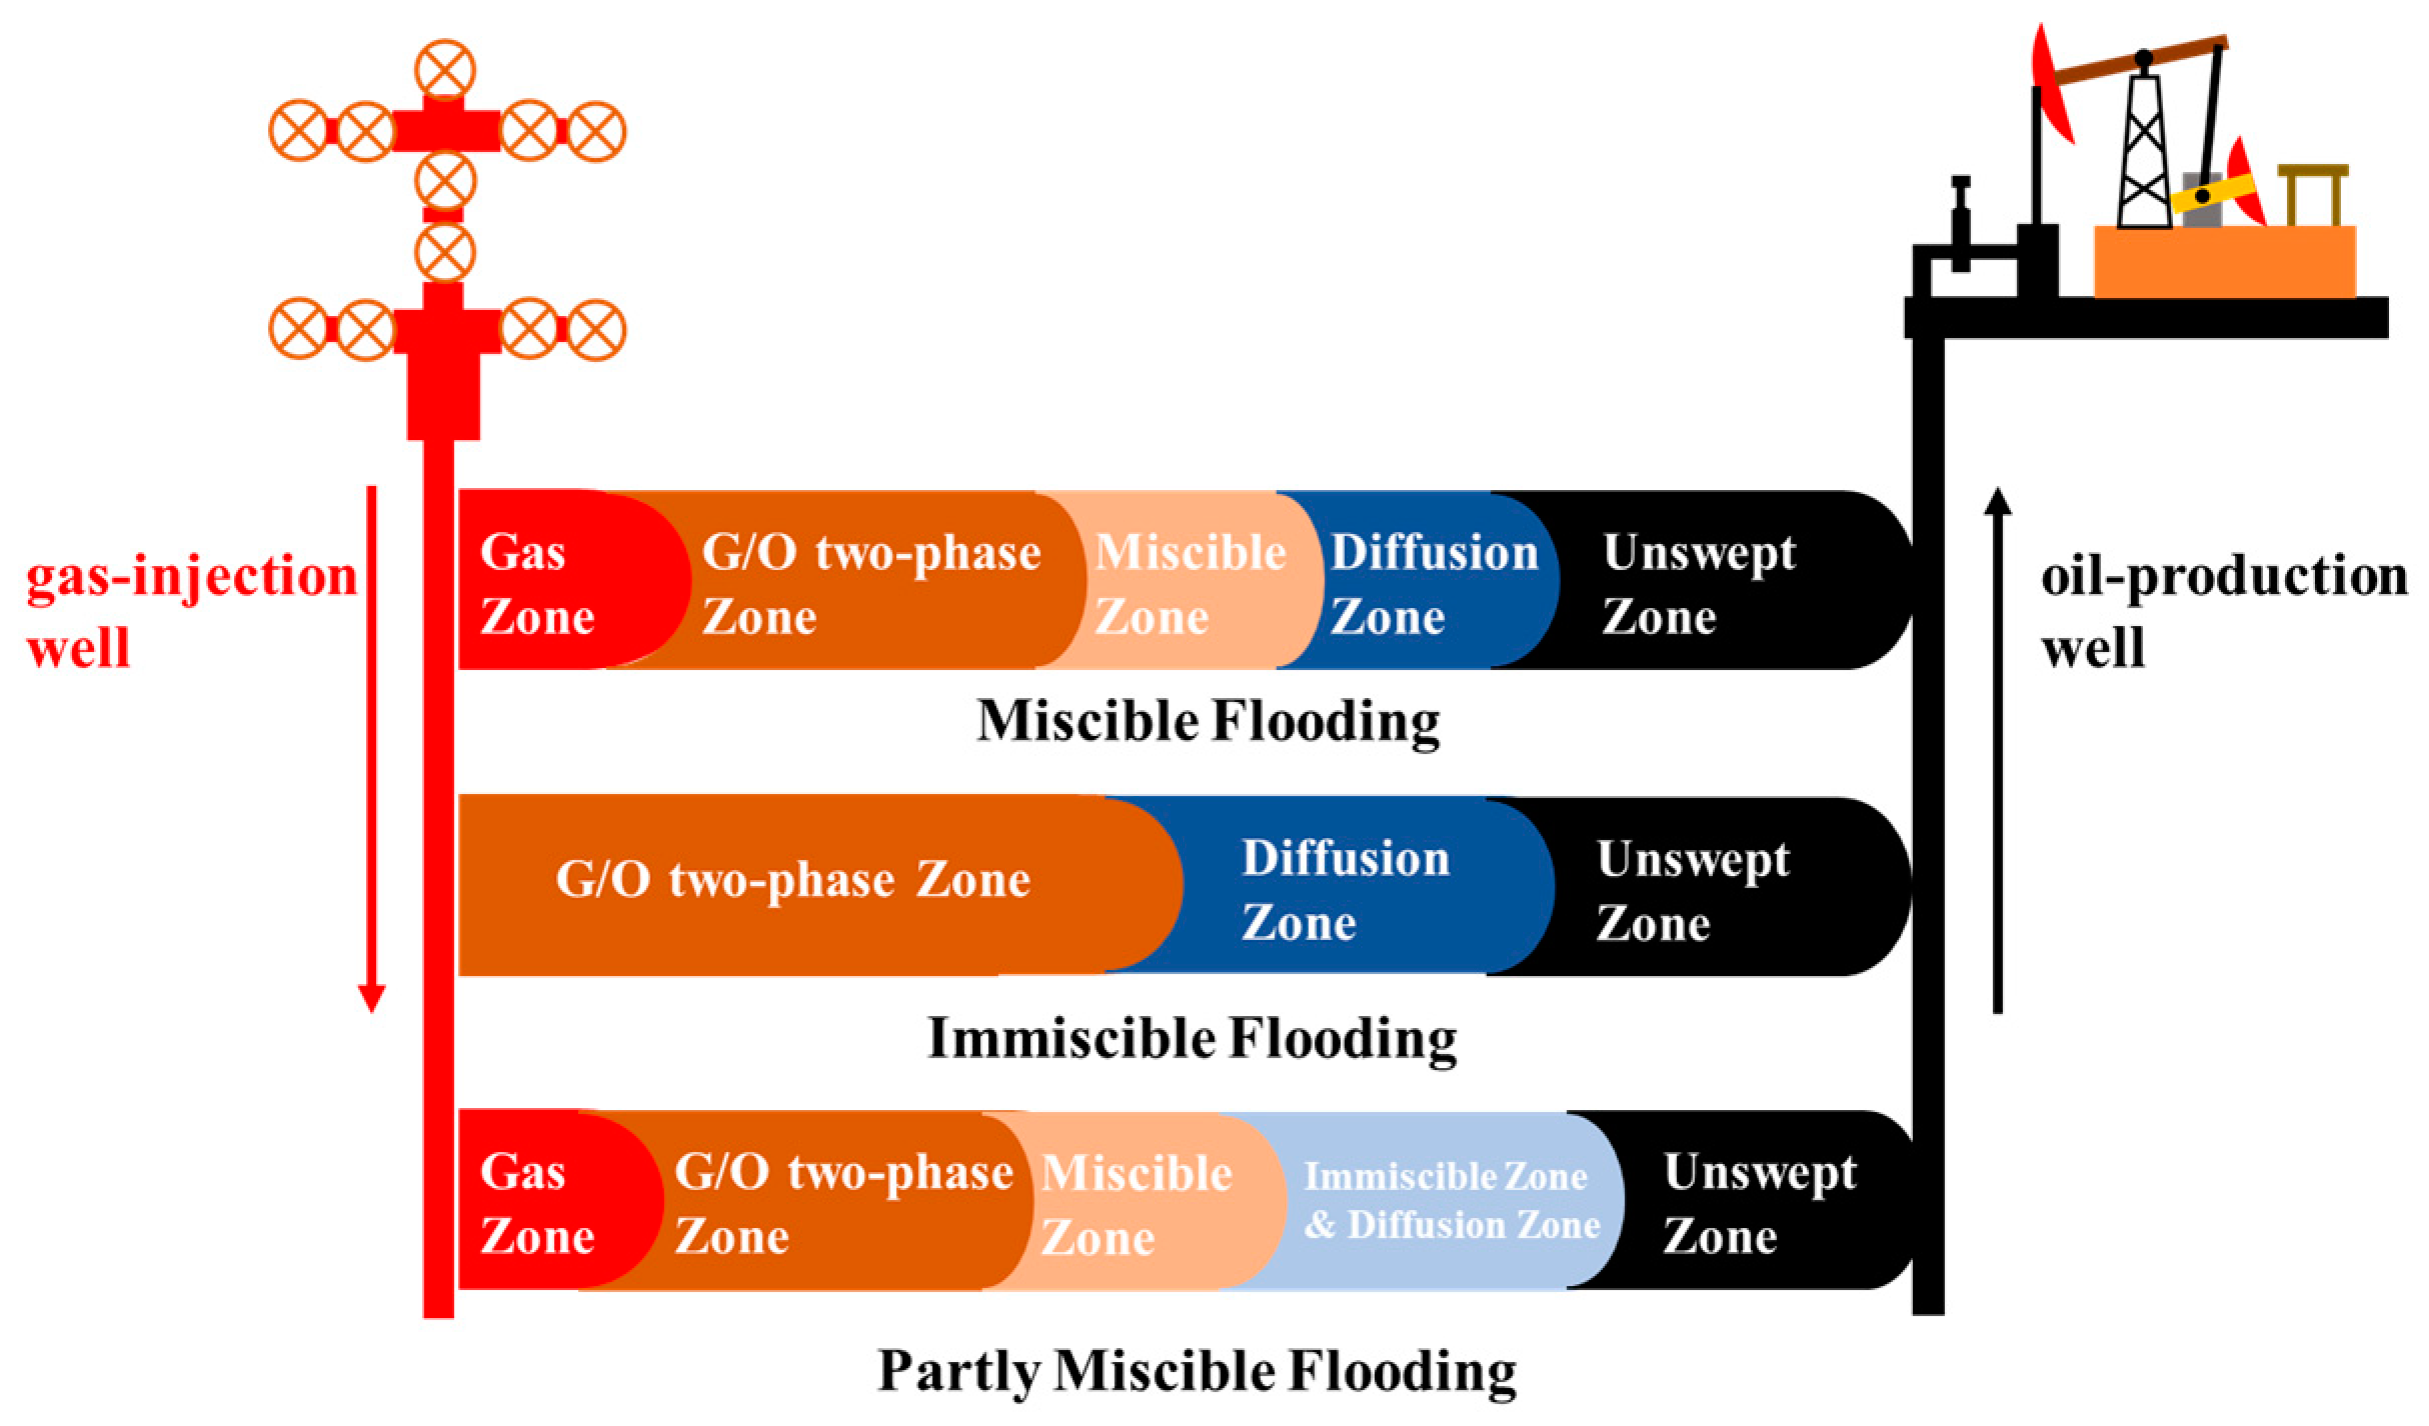
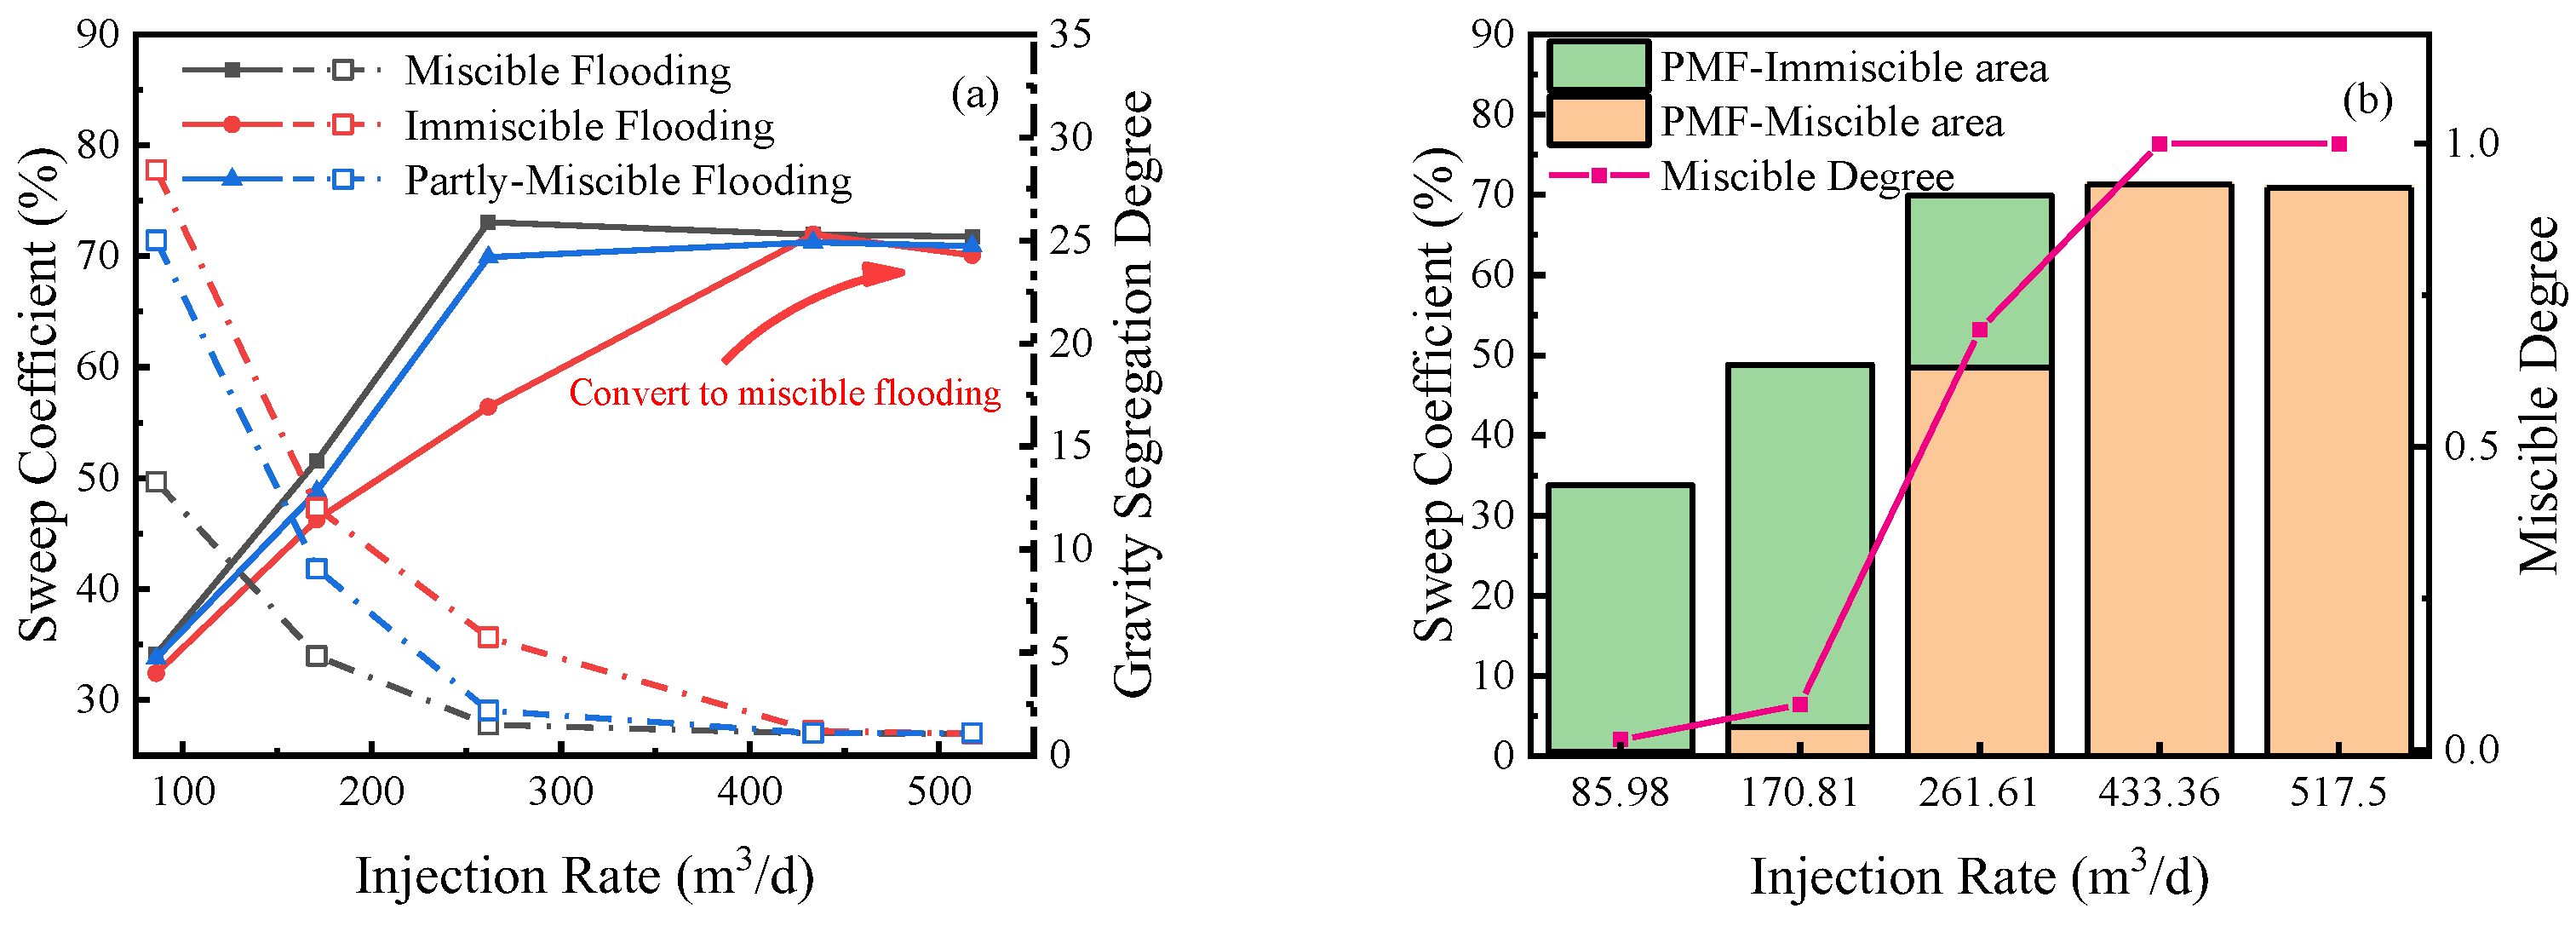
2 flooding was divided into three displacement patterns: (1) In miscible flooding (MF), the pressure between the injection and production wells was higher than the minimum miscible pressure, and the miscible degree was 1.0. (2) In partly miscible flooding (PMF), the original formation pressure of the reservoir was lower than the minimum miscible pressure, but the pressure near the injection well was higher than the minimum miscible pressure due to the reservoir energy enhancement of gas injection, thus forming a miscible flooding zone. The oil production of production wells decreased the reservoir pressure, and the immiscible flooding zone was formed within a certain range near the production well. The miscible degree of partly miscible flooding was between 0 and 1.0. (3) In immiscible flooding (IMF), the pressure between injection and production wells after gas injection was lower than the minimum miscible pressure, and the displacement process maintained immiscible flooding. The miscible degree of immiscible flooding was 0. By establishing a 1-D numerical simulation model, the distribution of CO
2 composition in the oil phase, oil saturation, and oil–gas interfacial tension between the injection and production wells under different displacement patterns of CO
2 flooding was studied, and the miscible/immiscible front position and front movement rules were determined. The results are shown in
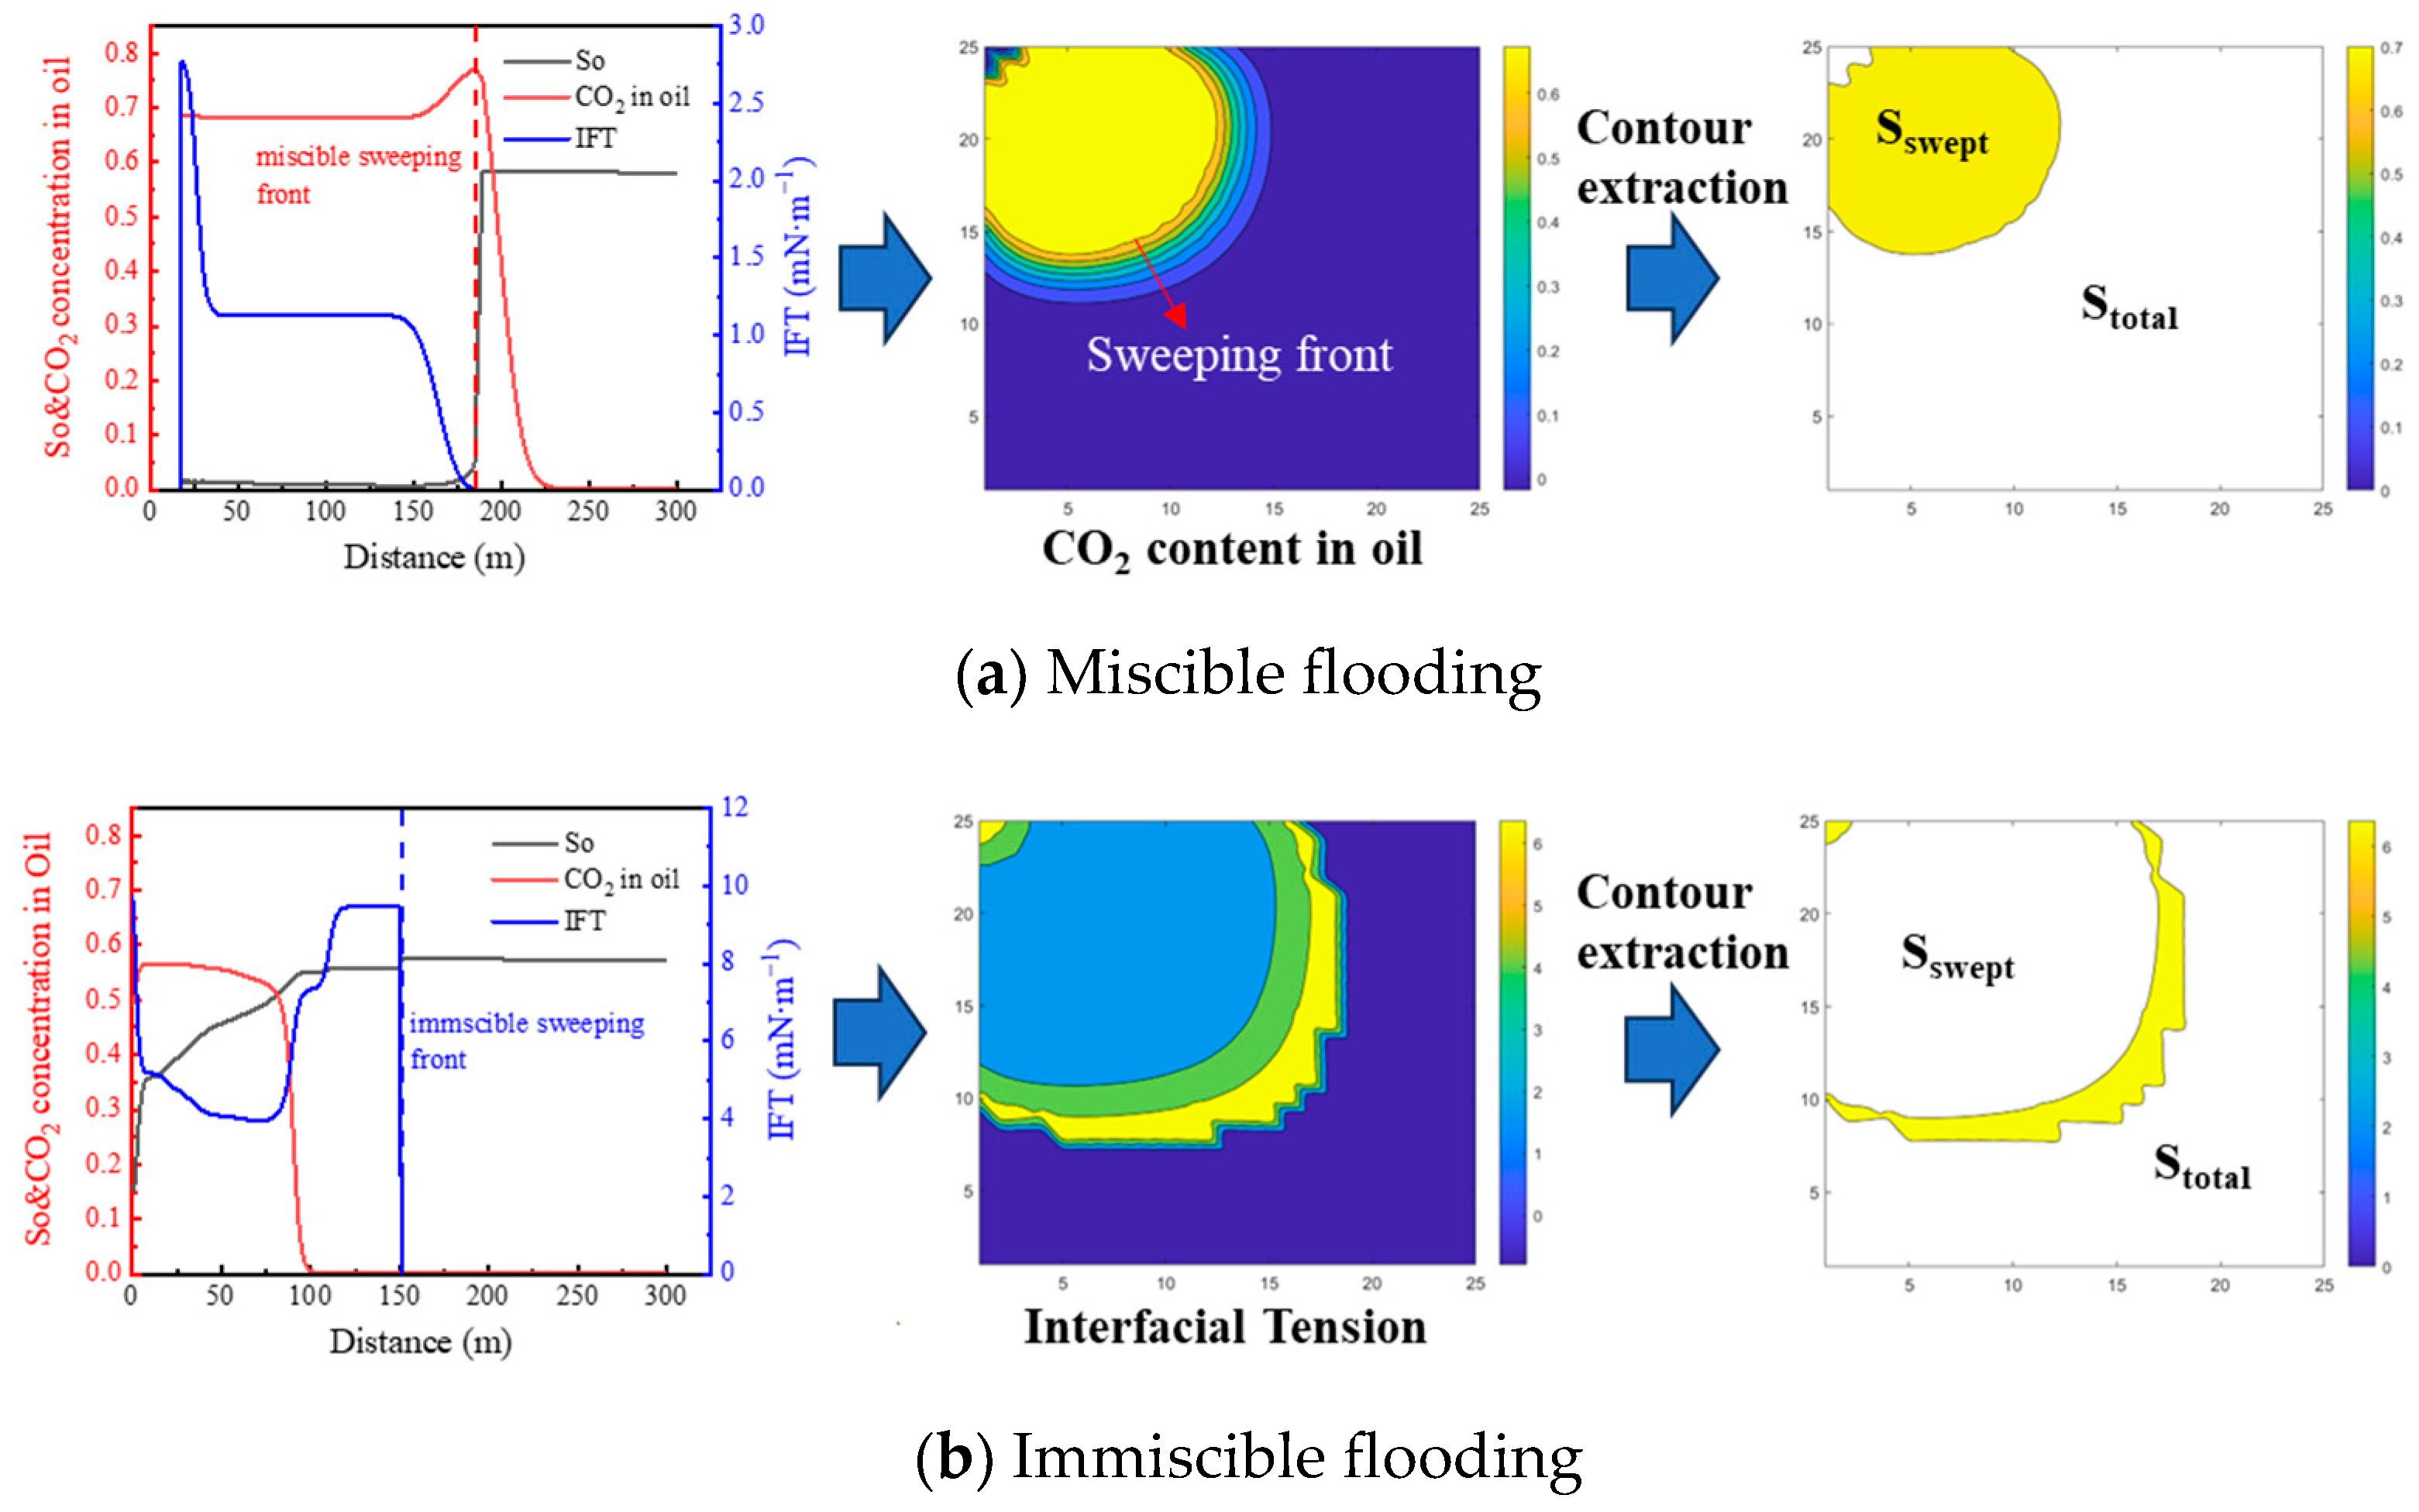
Figure 8.
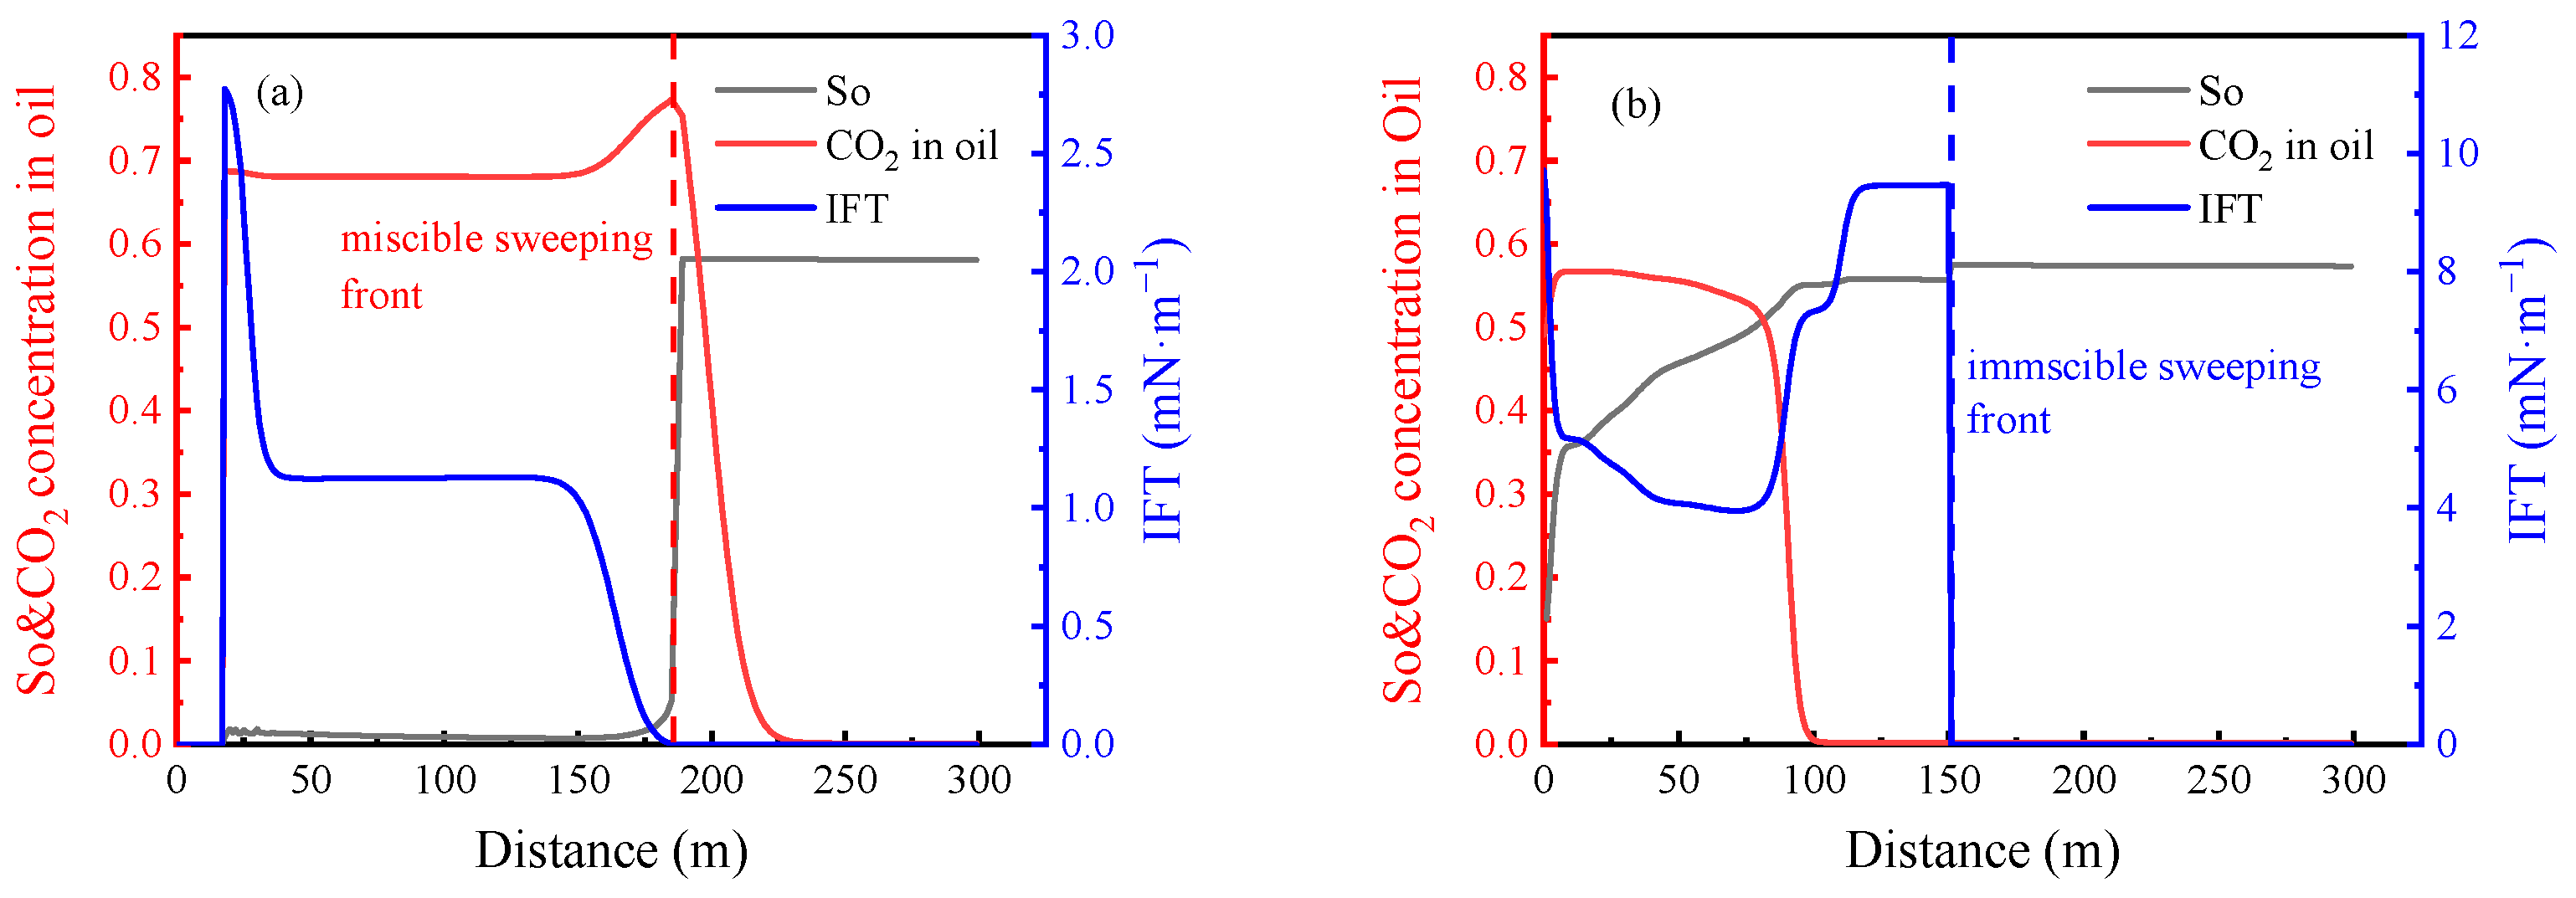
Figure 8a also shows the distribution of fluid properties between the injection and production wells in relation to miscible flooding. The oil saturation of miscible flooding maintained a meager value with increasing distance. Then, it increased rapidly to the initial oil saturation S
oi, showing the characteristics of a piston-like displacement. The interfacial tension increased rapidly with distance and then gradually decreased to the platform value. When the distance reached a certain value, it gradually decreased to 0. The CO
2 content in the oil phase increased rapidly and reached the platform value. The CO
2 content then increased gradually to the maximum value after increasing a certain distance and finally decreased to the original CO
2 content in the oil phase. According to the distribution of the above three parameters, the inter-well phase zone of miscible flooding was divided into a pure gas zone, a two-phase zone, a miscible zone, a diffusion zone, and an unswept zone. The gas zone was near the gas injection well area, where the oil saturation and interfacial tension were zero due to continuous CO
2 injection and miscibility. In the two-phase zone, the light components gradually evaporated into the gas phase, forming a rich gas that migrated to the production wells, significantly increasing the content of heavy components in crude oil at the miscible rare edge, thus forming an oil–gas two-phase zone. The crude oil in this zone was mainly residual oil with a high heavy component content. Due to the subsequent injection and dissolution of CO
2, the CO
2 content in this zone was significantly higher than the initial level. In the miscible zone, the rich gas in the miscible front contacted the crude oil through the condensate miscible effect, so the light component and CO
2 content in the oil phase increased significantly. The difference in the component content between oil and gas decreased, and the interfacial tension, therefore, gradually decreased and finally reached zero interfacial tension. The oil saturation suddenly changed to the initial oil saturation in this zone. In the diffusion zone, CO
2 entered the crude oil mainly through diffusion. As the distance increased, the diffusion effect gradually weakened, and the CO
2 content decreased to the initial level. The unswept zone only contained the pure oil phase. The interfacial tension was zero, the oil saturation was equal to the initial oil saturation, and the CO
2 content in the oil phase was equal to the initial value. The above analysis shows that the front of the miscible zone should be located at the maximum CO
2 content in the oil phase.
Figure 8b shows the distribution of fluid properties between the injection and production wells in the case of immiscible flooding. With the increased distance, the oil saturation of immiscible flooding increased slowly to the initial oil saturation, forming a wide range of two-phase zones. The interfacial tension decreased rapidly with increasing distance, then increased sharply after a certain distance, and finally decreased to zero. The content of CO
2 in the oil phase decreased slightly at first and then decreased significantly to the initial level after a certain distance. Similarly, the injection–production inter-well phase zone of immiscible flooding was divided into two-phase, diffusion, and unswept zones. In the two-phase zone, due to the dissolution of CO
2 in the oil phase, the interfacial tension was reduced to 4 mN/m, and the CO
2 content in the oil phase was increased to about 0.55, which was lower than the CO
2 content in the case of miscible flooding. In the diffusion zone, the interfacial tension increased gradually due to the formation of a CO
2 concentration diffusion gradient. The interfacial tension reached the maximum at the junction of the diffusion zone and the unswept zone, defined as the immiscible front of immiscible flooding.
Figure 8c shows the distribution of the fluid properties between injection and production wells in partly miscible flooding. The oil saturation of partly miscible flooding first maintained a meager value (residual oil saturation) with increasing distance. It then gradually increased to the initial oil saturation S
oi, but the increase amplitude was less than that of miscible flooding. The interfacial tension had two extreme values with the increase in distance. The CO
2 content in the oil phase gradually increased from the platform value of about 0.63 to the maximum value of 0.75. It then gradually decreased to the original CO
2 content in the oil phase. Unlike miscible and immiscible flooding, partly miscible flooding had both miscible and immiscible zones. In the miscible zone, due to condensate miscibility, the CO
2 content in the oil phase reached the maximum value, and the interfacial tension was reduced to zero, reaching the miscible state. In the immiscible zone, as the distance increased, the pressure between the injection and production wells decreased to less than the minimum miscible pressure, and the CO
2 in the oil phase re-evaporated into the gas phase, resulting in the gradual decrease in the CO
2 content in the oil phase and the rapid increase in interfacial tension. The displacement process changed from miscible flooding to immiscible flooding. The inter-well fluid zone divisions of the three displacement patterns are summarized in
Figure 9. In addition, the gas injection volume was fixed at 0.3 HCPV, and the front movement positions of miscible flooding, partly miscible flooding, and immiscible flooding were compared, as shown in
Figure 7d. The front movement of immiscible flooding was the fastest to reach the production well. The front of the immiscible zone in partly miscible flooding was located at 170 m, and the front of the miscible zone was located at 134 m, which indicated that the front movement velocity of the immiscible zone in partly miscible flooding was faster than that of the miscible zone. Therefore, immiscible flooding was more likely to cause gas channeling problems than miscible and partly miscible flooding.


