Review

Metrics and Strategies Used in Power Grid Resilience

by
Cesar A. Vega Penagos
,
Jan L. Diaz
,
Omar F. Rodriguez-Martinez
,
Fabio Andrade
and
Adriana C. Luna
*,†
Electrical and Computer Engineering Department, University of Puerto Rico at Mayaguez, Mayaguez, PR 00680, USA
*
Author to whom correspondence should be addressed.
These authors contributed equally to this work.
Energies 2024, 17(1), 168; https://doi.org/10.3390/en17010168
Submission received: 18 November 2023 / Revised: 23 December 2023 / Accepted: 26 December 2023 / Published: 28 December 2023
(This article belongs to the Section F: Electrical Engineering)

Abstract

:
This article provides a comprehensive review of power grid resilience, including current metrics and definitions, as well as the procedures used to ensure and improve the resilience of a system. We also describe the different strategies used by users to ensure their own resilience. Additionally, this article highlights areas for future research and opportunities for the integration of emerging technologies such as computer vision. The main objective of this study was to explore the metrics and strategies used in power grids and for the users to improve and ensure resilience in case of events.

1. Introduction

The power grid is critical infrastructure that provides essential services to society. However, it is vulnerable to interruptions caused by various natural events, technical failures, and cyber attacks. Therefore, power grids must be resilient and able to mitigate and recover quickly from disruptions. Microgrids are a strategy to improve the resilience of power grids by enabling the generation and distribution of power locally in the event of grid interruption.
Given the aforementioned challenges, resilience is a highly relevant issue for electric power grids. Therefore, it is necessary to develop appropriate techniques and metrics based on the current proposals in the literature. Researchers have recently published articles reviewing various aspects of resilience studies ionn power grids. Table 1 demonstrates some of the typical main features found among these studies, showing that the topic of resilience still requires further research and evolution.
Most of the methods used in studies to define the states of the power grid are based on physical models and the analysis of its infrastructure. However, this approach is unsuitable for handling the increasing uncertainty in the new variables that add complexity to the system. Similarly, the departments responsible for maintaining the electrical grid in operation and under proper conditions, as well as the users, have developed a series of procedures before, during, and after events with the aim of addressing the event without being significantly affected. In this article, we review recent metrics and strategies used by the power grid to represent the phases of recovery from disasters.
In a broader context, the evolution toward smart grids encompasses advancements in detection, computing, and communications [14]. This transformation involves various aspects, such as the integration of renewable sources, electric vehicles, load forecasting techniques, dynamic pricing, demand response, and the development of microgrids, including the consideration of cyber threats to infrastructure [15,16]. All these elements contribute to optimizing the operation and scheduling of the power grid. These technologies, coupled with actively participating agents [17], aim to enhance the overall performance of electricity generation, distribution, and consumption. As operators prepare and evolve alongside technology, this document briefly touches upon the topic of cyber resilience, acknowledging its extensive and complex nature and suggesting that it may warrant more in-depth exploration in a different context.
This review was conducted using a real and active energy operator as a reference, specifically LUMA in Puerto Rico [18,19]. This adaptation is particularly relevant due to the island’s susceptibility to various recurrent natural phenomena in the Caribbean, such as Hurricane Maria in 2017 [20]. The ability to reference the strategies and measures applied by both the network operators and the end users of LUMA provides valuable insights for enhancing resilience. It is crucial to emphasize that this work also serves as a foundation for advancing toward the integration of new technologies associated with smart grids and understanding how users would adapt to these constantly evolving changes.
This review document follows the sequence outlined below: Section 2 explores various definitions and concepts related to resilience, extreme events, and metrics proposed in the literature. Section 3 discusses common strategies for resilience in the power grid, focusing on their state-of-the-art procedures established by the U.S. Department of Energy (DOE), the Electric Authority in Puerto Rico (LUMA), and the users. Section 4 introduces the document’s discussion, in Section 5 the future research Direction. Finally, in Section 6, the conclusions of the work are presented.

2. Concept of Grid Resiliency

Resilience is a multifaceted concept that has been examined in various disciplines, including social sciences, natural sciences, psychology, organizational management, engineering, and others. In general, resilience refers to the ability of a system to recover quickly from a disturbance. The concept of grid or power system resilience emerged in parallel with the examination of critical infrastructure resilience. Below are several definitions of grid resilience from recognized institutions:
DOE: 
“The ability of a power system and its components to withstand and adapt to disruptions and rapidly recover from them” (www.energy.gov/eere/solar/solar-and-resilience-basics (accessed on 2 May 2023)).
FERC: 
“The ability to withstand and reduce the magnitude and/or duration of disruptive events, which includes the capability to anticipate, absorb, adapt to, and/or rapidly recover from such an event” (The Federal Energy Regulatory Commission (FERC)).
In simple terms, grid resilience refers to the ability of a network to withstand disturbances and quickly recover with minimal downtime or disruption.

2.1. Resilience Framework

For evaluating the resilience of a power system, it is essential to identify the extreme events that the system may face, as resilience varies according to each of them. Subsequently, resilience metrics must be established, and appropriate assessment methodologies must be selected.
It is necessary to model the spatiotemporal influence of an event on the resilience of the electrical infrastructure and to calculate the consequences of failures. Finally, system resilience can be assessed in a single failure scenario to obtain a specific measured value or in multiple failure scenarios using expected values, probability distributions, or other forms of analysis. Figure 1 presents an idea of the steps to follow.

2.2. Reliability and Resilience
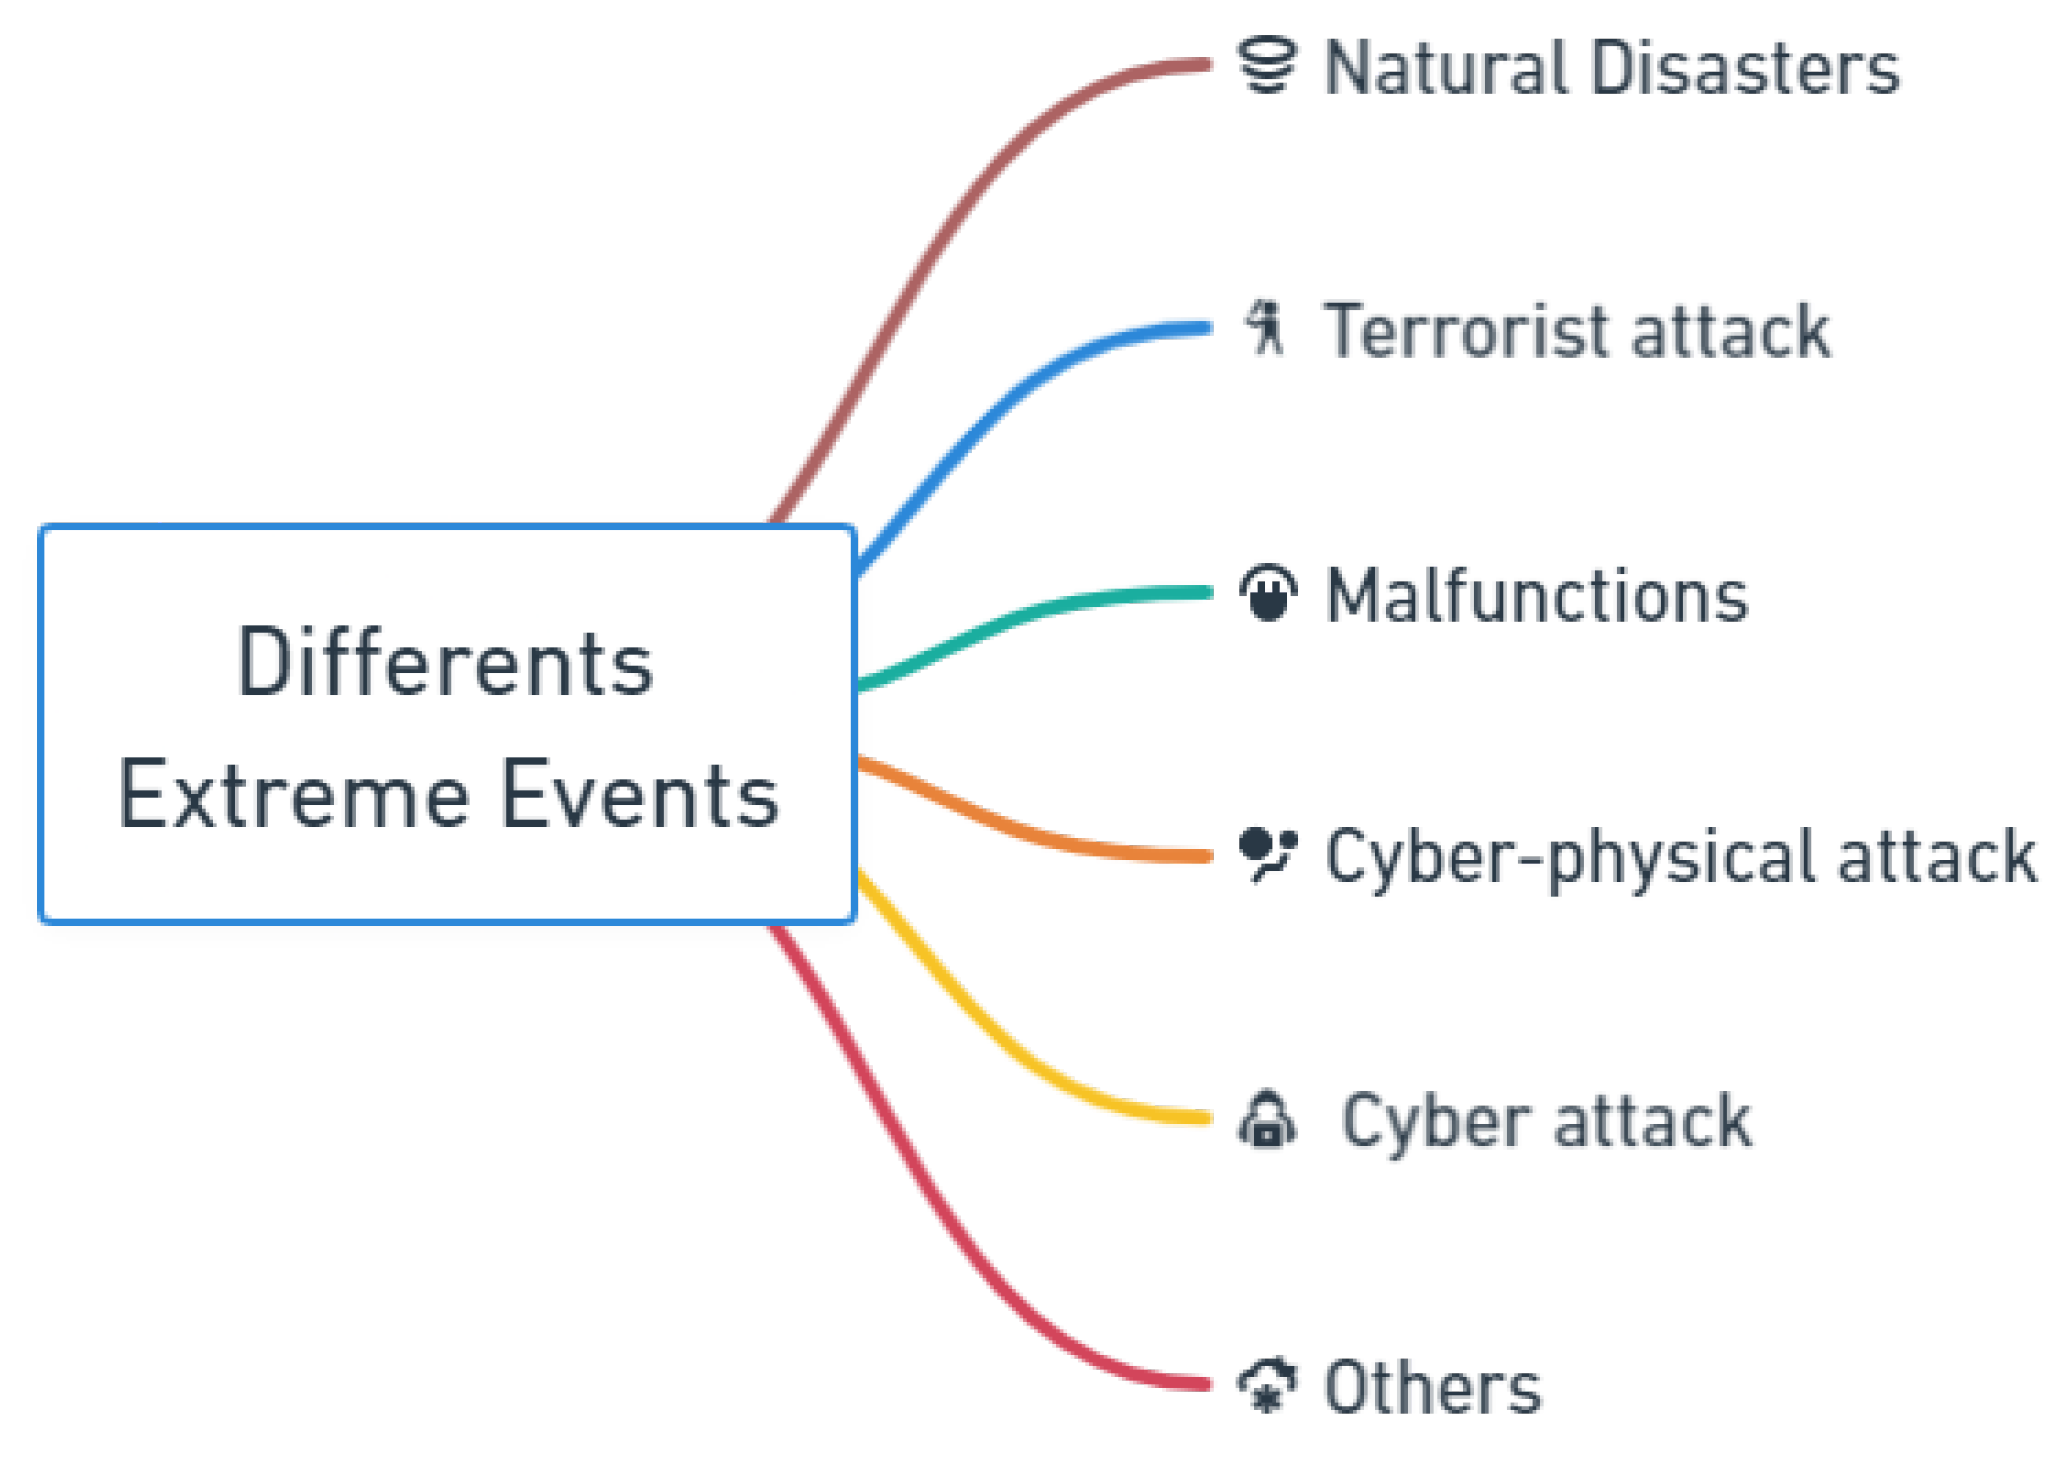
Reliability and resilience are two concepts that are often used interchangeably in the context of electrical systems. However, there are some key differences between them. Reliability refers to the ability of an electrical system to withstand and recover from typical random fault outages. In this case, load restoration methods can be used to supply power to affected areas. On the other hand, resilience refers to the ability of a power system to recover from extreme events, such as natural catastrophes, which can cause multiple cascading outages and damage to transmission and distribution networks. The restoration process is much more complex in these situations, and conventional techniques may be less effective [6].
Therefore, it is essential to have specific assessment methods and resilience enhancement techniques to deal with these types of events. Table 2 provides a summary of some of the significant differences between these two definitions.

2.3. Threat Events

Any factor with the potential to cause damage, destruction, or interruption to an electrical system is considered a threat. These threats can manifest as natural, technological, or human-induced events and generally outside of the control of electrical system planners (and operators www.oe.netl.doe.gov/OE417_annual_summary.aspx (accessed on 9 June 2023)). When we talk about extreme events or threats to a power grid, we often think of those caused by nature.
However, in addition to these extreme events, there are other types of threats to the network, such as cyber or technological attacks, which have increased with the advancement and growth of technology [12]. Last but not least, there are threats of human origin.
Figure 2 shows some of the most common threats, but we can characterize them into different groups as follows [21]:
  • Natural hazards are caused by events like severe weather conditions, floods, earthquakes, hurricanes, landslides, frosts, and electrical storms. Additionally, they may result from interactions with wildlife, such as squirrels, snakes, or birds, which can lead to short circuits in distribution lines.
  • Technological hazards are caused by failures of systems and structures, for example, defects in materials or malfunctions.
  • Human-caused hazards can arise from accidents, such as inadvertently cutting a transmission line, or from intentional actions by an adversary, including cyberattacks or acts of terrorism.

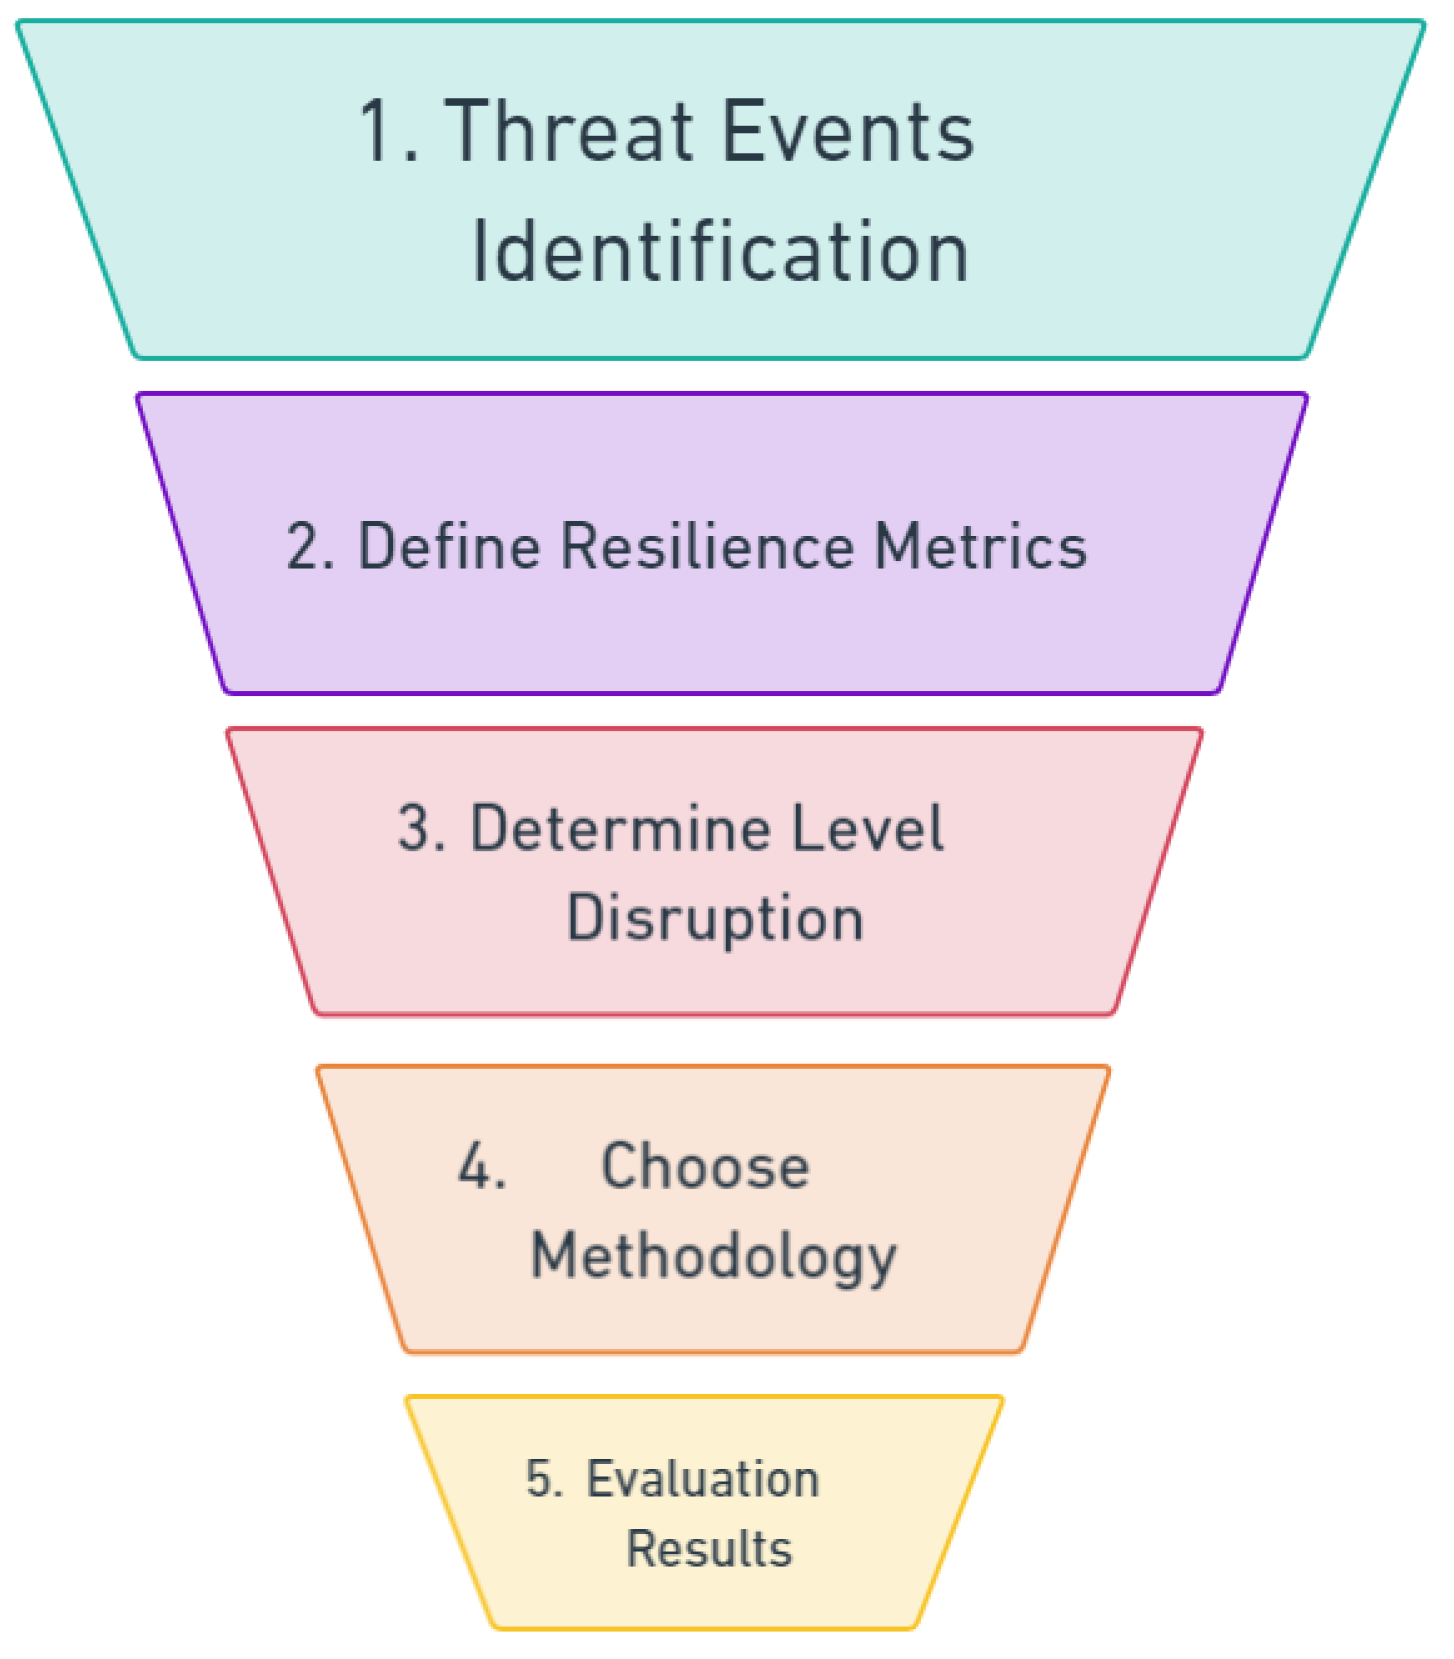
2.4. Reliability and Resilience Metrics

No standardized metrics are available to evaluate a grid’s resilience, so it is still a matter of discussion. In this part of the article, we present some metrics proposed in the literature according to attributes, characteristics, code-based, and others.
The resilience triangle, first introduced by [22], has served as a foundational element in the evaluation of resilience. This idea has progressed into the resilience trapezoid, being adapted to include factors related to degraded states in scenarios where immediate restoration measures are not promptly implemented after disruptions.

2.4.1. Reliability Metrics

The three most important reliability indices by the IEEE, as shown in IEEE Standard 1366 [23], are the System Average Interruption Frequency Index ( S A I F I ), representing the average number of power outages for one customer in a year; System Average Interruption Duration Index (SAIDI), representing the total number of minutes or hours of interruption for a client in one year; and Customer Average Interruption Duration Index (CAIDI, representing the average time required to restore service. These three indices were calculated using the following equations:
S A I F I = C I C S
S A I D I = C M I C S
C A I D I = C M I C I = S A I D I S A I F I
where C I is the customers interrupted and is equal to the total number of customers affected by the event; C M I means customer minutes interrupted and is equal to C I times the duration of the event in minutes; and, finally, C S means customers served and is equal to the total number of customers connected to the affected area.
The U.S. Energy Information Administration (EIA) displays the reliability indices described above from 1990 to the present on its website (www.eia.gov/electricity/data/eia861/ (accessed on 10 June 2023)). The data include 960 utilities corresponding to the states and 4 utilities for the territories, of which approximately 75% of the utilities apply Equations (1)–(3) from the IEEE Standard, while the remaining 25% use other standards. Figure 3 shows the mean reliability indices for all events for the U.S. territories divided into states and territories, including Puerto Rico.

2.4.2. The Resilience Triangle

Figure 4 is a graphical representation of the resilience triangle [22], which has been utilized in various studies to assess resilience following an extreme event. However, the triangle is only capable of conducting a resilience assessment in a single phase, particularly in evaluating the recovery performance of an infrastructure after the event.
In this context, F A ( t ) represents the level of the actual performance of the system, and F T ( t ) represents the target performance level. Here, t e denotes the time of the disaster or threat, while t r signifies the commencement of the restoration process, and t p r denotes the moment at which the recovery is successfully completed, fully restoring operational functionality. This time frame is regarded as the study period for assessing resilience.
The hypotenuse of the triangle can have different shapes; it is not necessarily linear. The shape depends on the recovery strategy or functions used, as demonstrated in [24], where linear, exponential, and trigonometric functions are employed and evaluated.
Continuing with the literature review, in [25], the authors propose a mathematical formulation in (4) to measure the impact (I) between normal and abnormal conditions during an event, calculating the difference in functionality of the grid. In other words, (4) represents the area of resilience.
I = t e t p r [ R o F A ( t ) ] d t
where F A ( t ) is the grid functionality actual at time t; R o is the total grid functionality in normal conditions; and t e and t p r are the time of the start of the event and restoration time, respectively.
It is essential to highlight that the triangle in Figure 4 can be used in this case to evaluate the resilience of infrastructure. For example, Ref. [26] used various performance indicators (5) for infrastructure under both normal operating conditions and during extreme events. They relied on the concept of resilience to establish a resilience index as follows:
R e s i l i e n c e = t e t p r Q ( t ) d t 100 [ t e t p r ]
In this expression, Q ( t ) represents the quality of the infrastructure (y-axis) in the triangle in Figure 4. In other words, the variable R o would be modified based on this quality. In addition, reference is made to the variables t e and t p r , mentioned above.

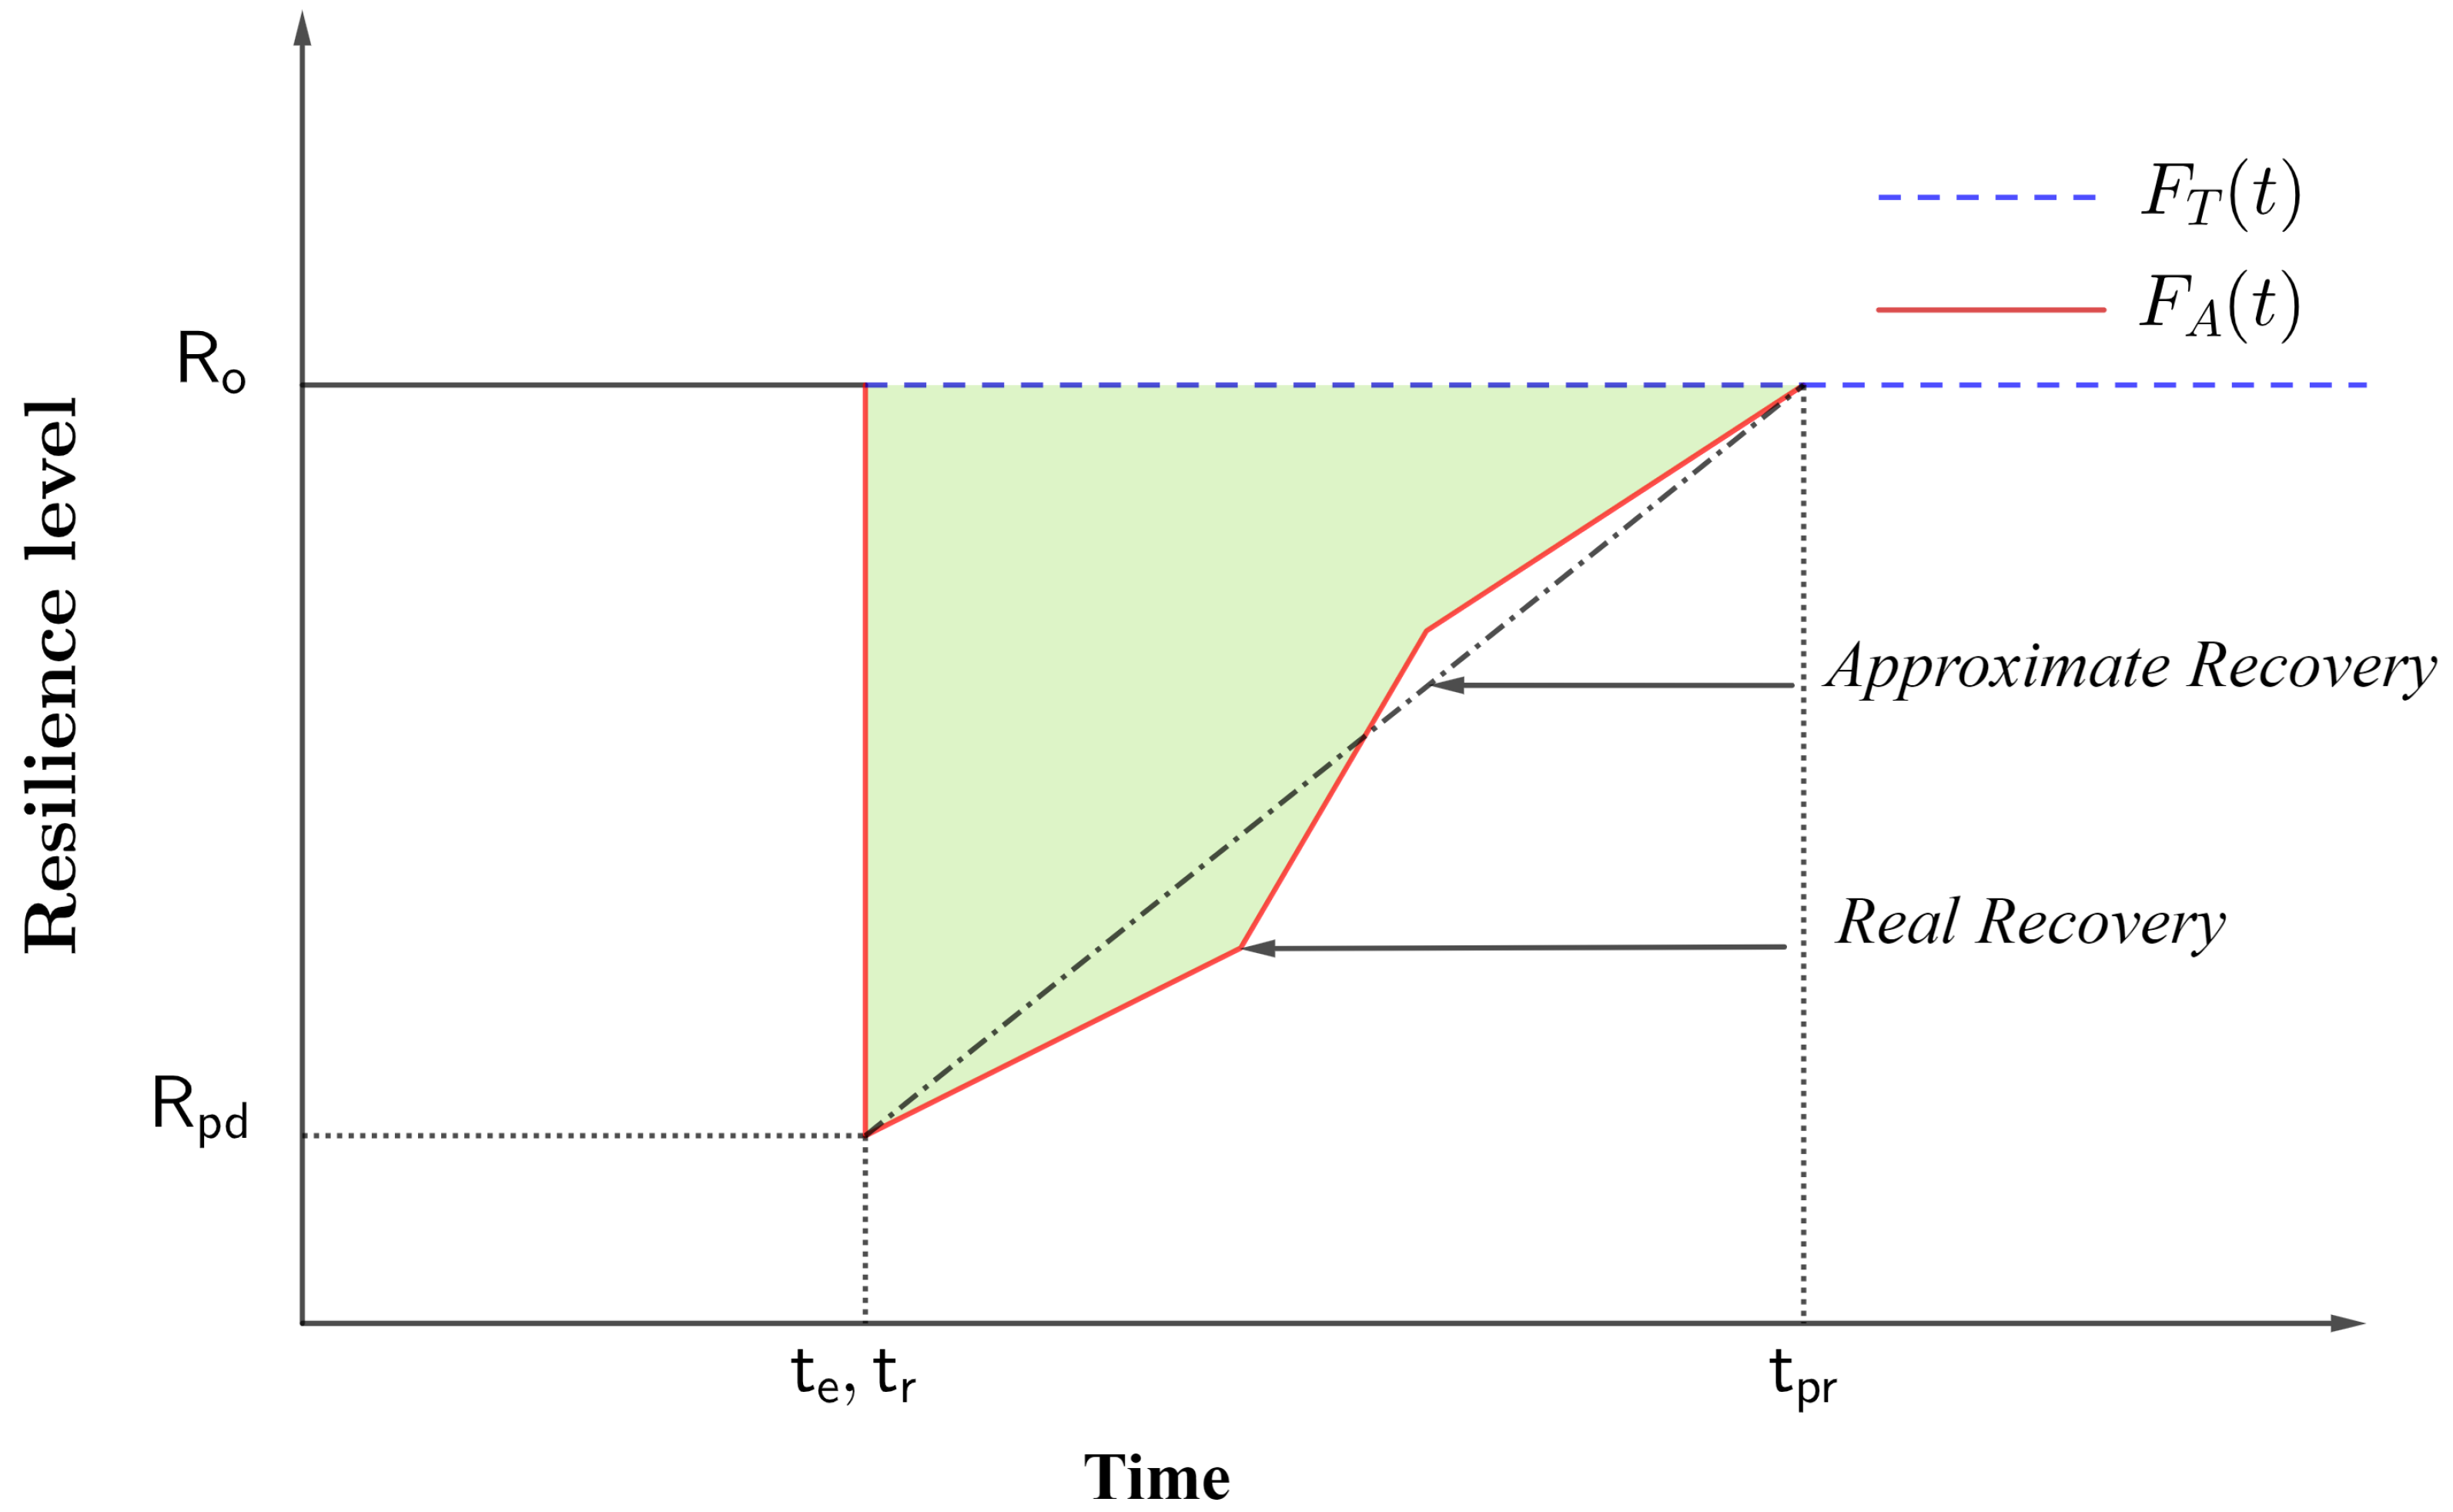
2.4.3. Resilience Trapezoid

In [10,27], the authors introduced a collection of metrics designed to gauge the resilience level of a power system, emphasizing its temporal aspects following a disaster event. This concept can be graphically depicted using the resilience trapezoid, as exemplified in Figure 5.
These metrics are abbreviated as F.L.E.P, signifying how fast (F) and how low (L) the resilience falls in disturbance phase I, by t [ t e , t p e ] ; how extensive (E) the post-disturbance degraded state is in phase II (postdisturbance degradation) by t [ t p e , t r ] ; and how promptly (P) the grid recovers in phase III (restore) by t [ t r , t p r ] . Here, F A ( t ) represents the actual performance level of the system, and F T ( t ) represents the target performance level.
Furthermore, the postrestoration phase of network operation is described for the interval t [ t p r , t i r ] . Notably, this phase alone does not encompass the complete functionality, emphasizing the significance of the restoration stage in the infrastructure to ultimately achieve the desired recovery goal, denoted as F T ( t ) for t [ t p r , t i r ] .
To calculate the resilience index ( R I ) for a system facing an extreme disaster, authors [10] analyzed the multiphase resilience trapezoid shown in Figure 5. They used time-dependent resilience metrics and indicators to quantify the operational and infrastructure resilience of a system, as represented in the following Equations (6)–(10):
R I F = R p d R o t p e t e
R I L = R o R p d
R I E = t r t p e
R I P = R p r R p d t p r t r
A r e a o p = t e t p r F A ( t ) d t
where R I F denotes how quickly the fast is damaged, R I L indicates how low the system is degraded, R I E represents how extensive (hours) the system is degraded, and R I P specifies how promptly the system recovers. Then, a disaster A r e a o p is also presented, which represents the area of the trapezoid affected from the beginning of the event t e until postrestoration t p r , respectively.
Specifically, while the system may have regained its pre-event operational state, demonstrating a certain degree of operational resilience, the infrastructure may require more time for complete recovery, highlighting the concept of infrastructure resilience.
In [28], another resilience recovery index R I R was defined as follows:
R I R = F A ( t p r ) F A ( t p e ) F A ( t e ) F A ( t p e )
According to Figure 5 and Equation (11), if the recovered level is close to the target level, R I R is high.
Metrics based on the resilience characteristics were used in [27], where, to evaluate the impact of these strategies on resilience, it was essential to isolate them from other factors that influence the indices. The time period of interest, referred to as t r , is the time when the restoration phase begins, encompassing both the restoration state and the postrestoration state.
Utility power is assumed to be restored to serve critical loads at t i r t r = τ , where τ represents the total outage duration, which is illustrated using Figure 5 and expressed in Equation (12):
R r e c o v e r y = t r t r + τ F A ( t ) d t
Another metric proposed in [27], but focused on the duration and type of event, is presented in Equation (13):
R e s i l i e n c e = t e + Δ T f F + Δ T r R t e + Δ T f + Δ T r
where F and R are the failure recovery profiles; t e is the time of the incident; Δ T f = t e t r is the duration of the failure; Δ T r = t p r t r is the recovery duration.
These quantitative metrics, described in Equations (6)–(10), can be adapted depending on what needs to be assessed. In other words, they can be tailored to cases where, for example, the number of affected customers, the number of down lines, affected sectors, affected substations, etc., are to be evaluated [29]. Figure 5 illustrates that the trapezoid is highly adaptive and flexible in each of its aforementioned stages. Moreover, it can be applied not only in the electrical sector but in other fields.

2.4.4. Resilience Triangle versus Resilience Trapezoid

In this section, we provide a characterization of the utilization of the resilience triangle compared to the previously mentioned resilience trapezoid. One key feature of the triangle is its limitation to a single phase, specifically employed to assess the restoration status of an operating system after a disaster. On the other hand, the trapezoid offers an advantage as it is applicable to any threat, regardless of its nature, and allows for evaluation at different phases of the event. For instance, in the case of a short-duration event like an earthquake lasting seconds to minutes, resulting in a significant decline in resilience, the trapezoid can capture its evolution.
In contrast, the resilience triangle fails to capture the progression of longer-lasting events, such as a hurricane, which may span hours to days. Table 3, proposed in [6], summarizes other significant differences between these two metrics.

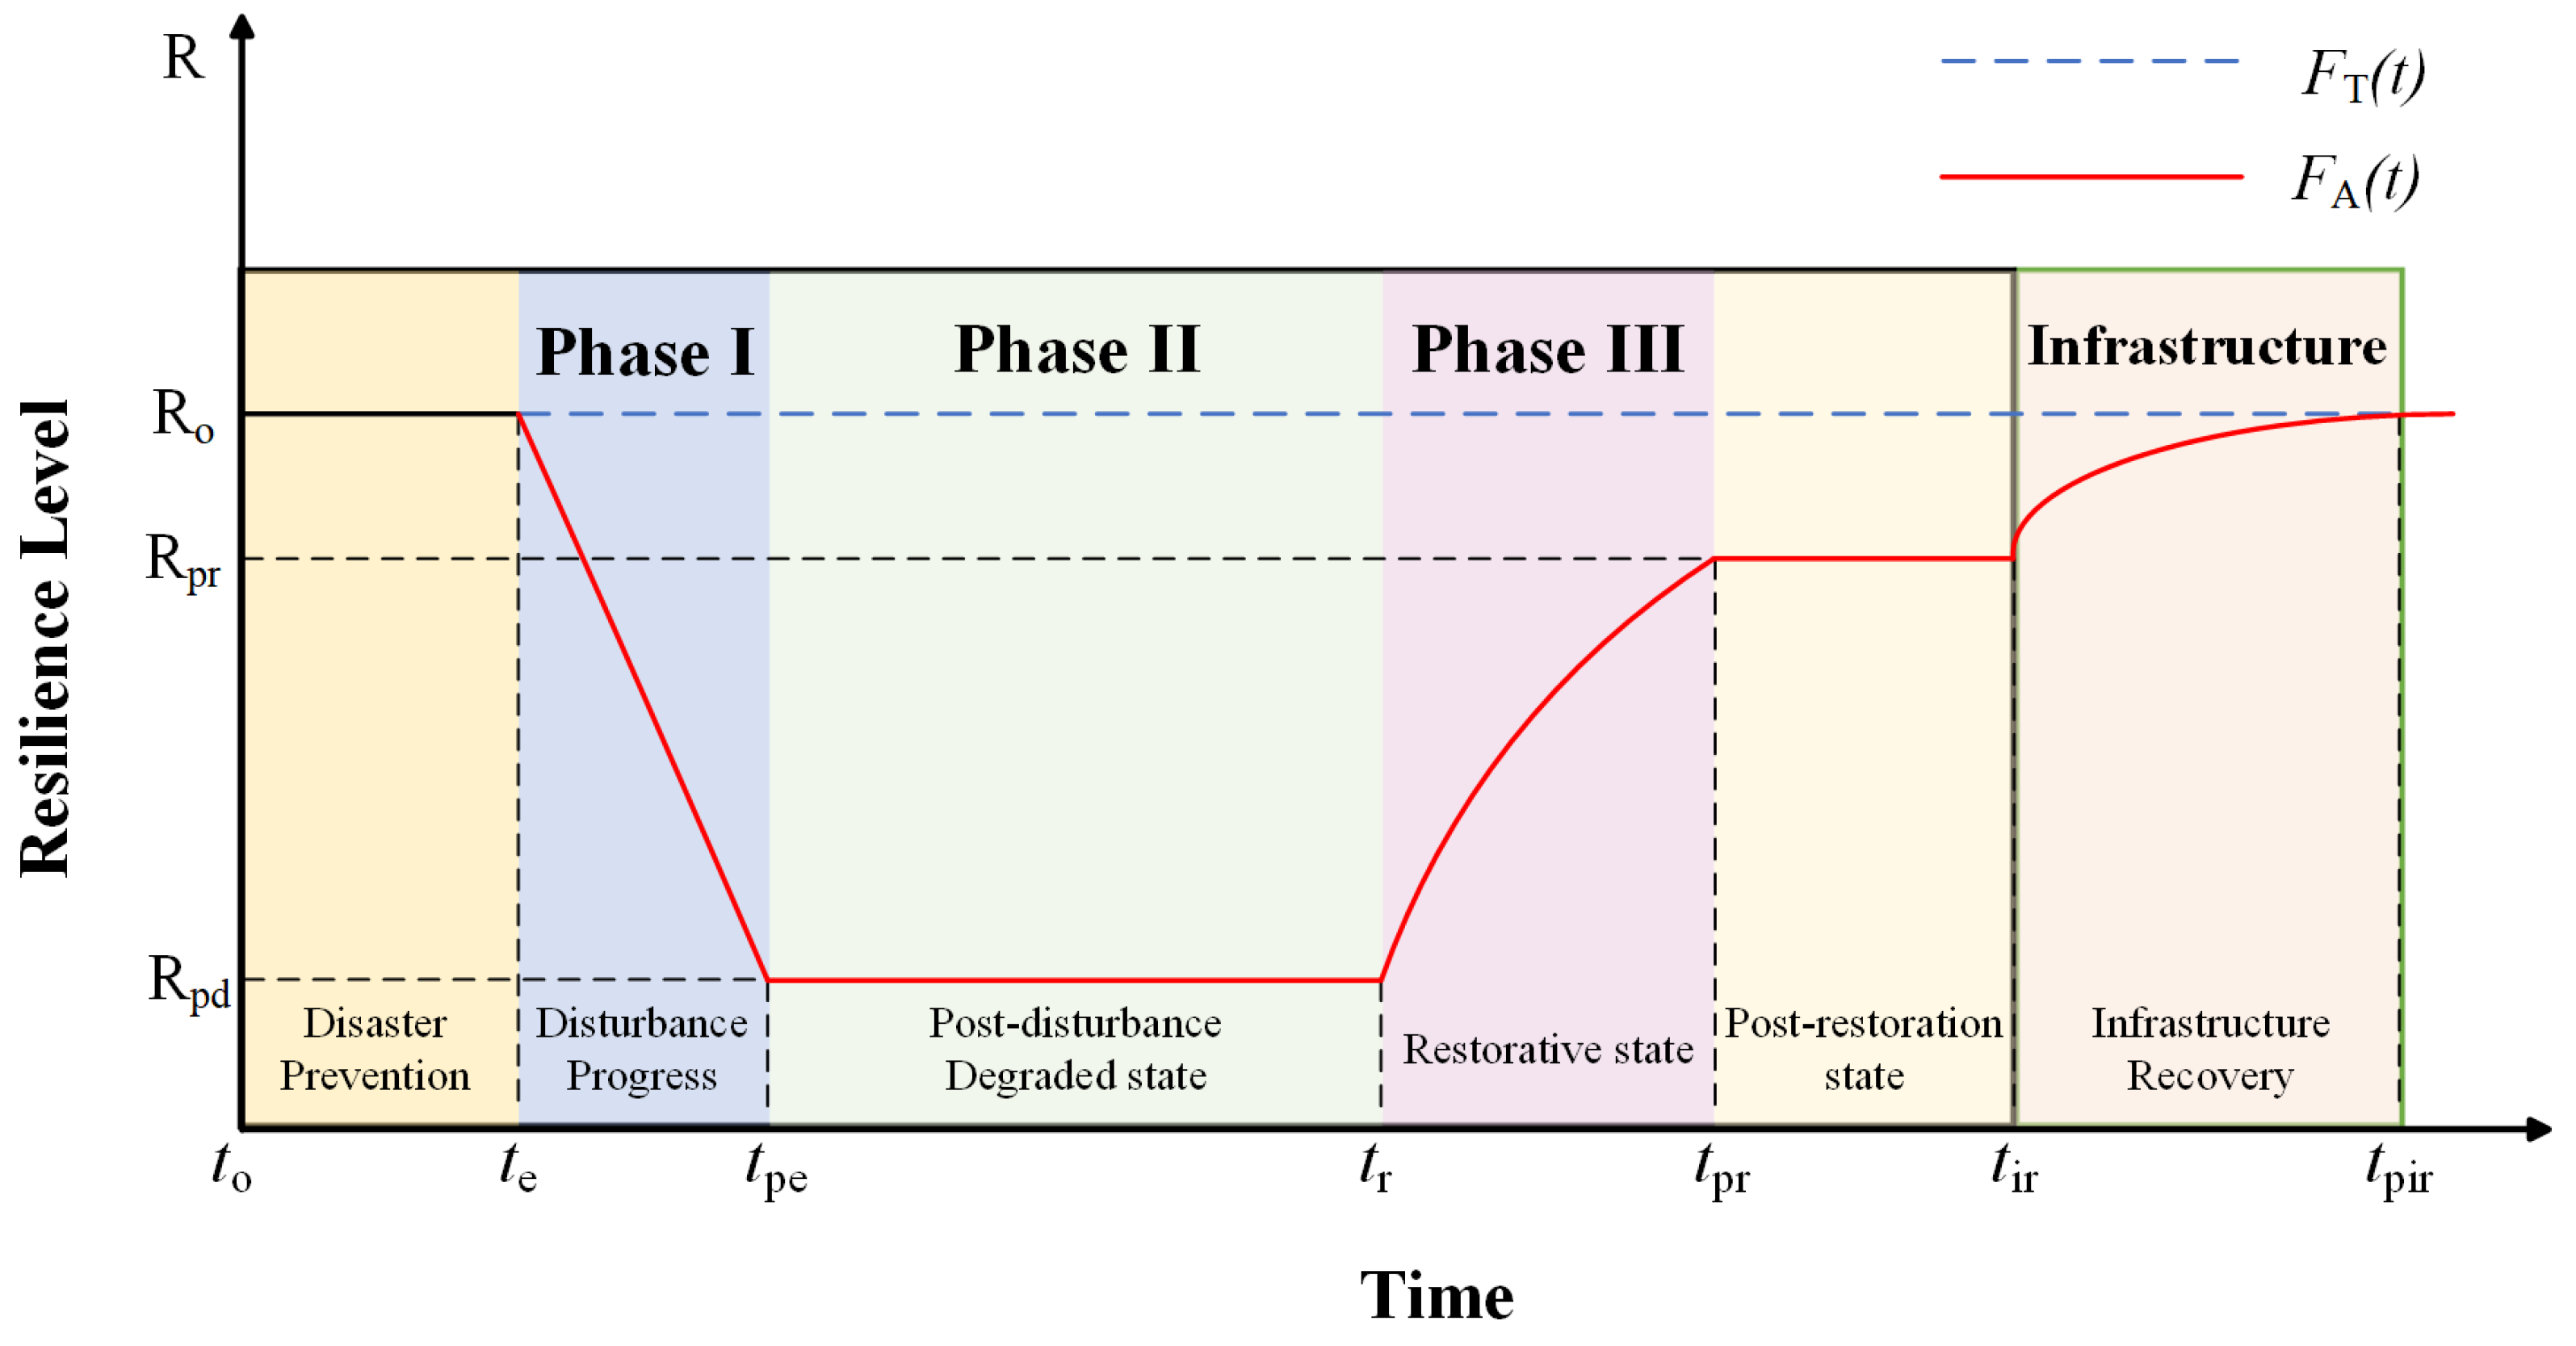
3. Resilience Strategies in Power Grids

Resilience and reliability stand out as two of the most crucial parameters for electrical grids. Consequently, various companies and public entities have endeavored to enhance these aspects by formulating comprehensive plans, including emergency response plans (ERPs). An ERP is a company document that delineates the procedures and steps to be followed under specific events that impact the integrity or state of the electrical grid. It also outlines the requisite documents and parameters that must be submitted or reported during and after an event.
There exists a distinction between energy security and resilience, where the former assesses common or more probable risks and the latter evaluates larger and less likely risks [30], such as those induced by natural disasters, human-caused disasters, and technological-caused disasters, as illustrated in Figure 2. The risks evaluated by both energy security and resilience are handled in a similar manner; however, when dealing with a substantial event, the procedures, resources, and time involved become greater.
These procedures and the way in which they are evaluated and classified vary by country and location.

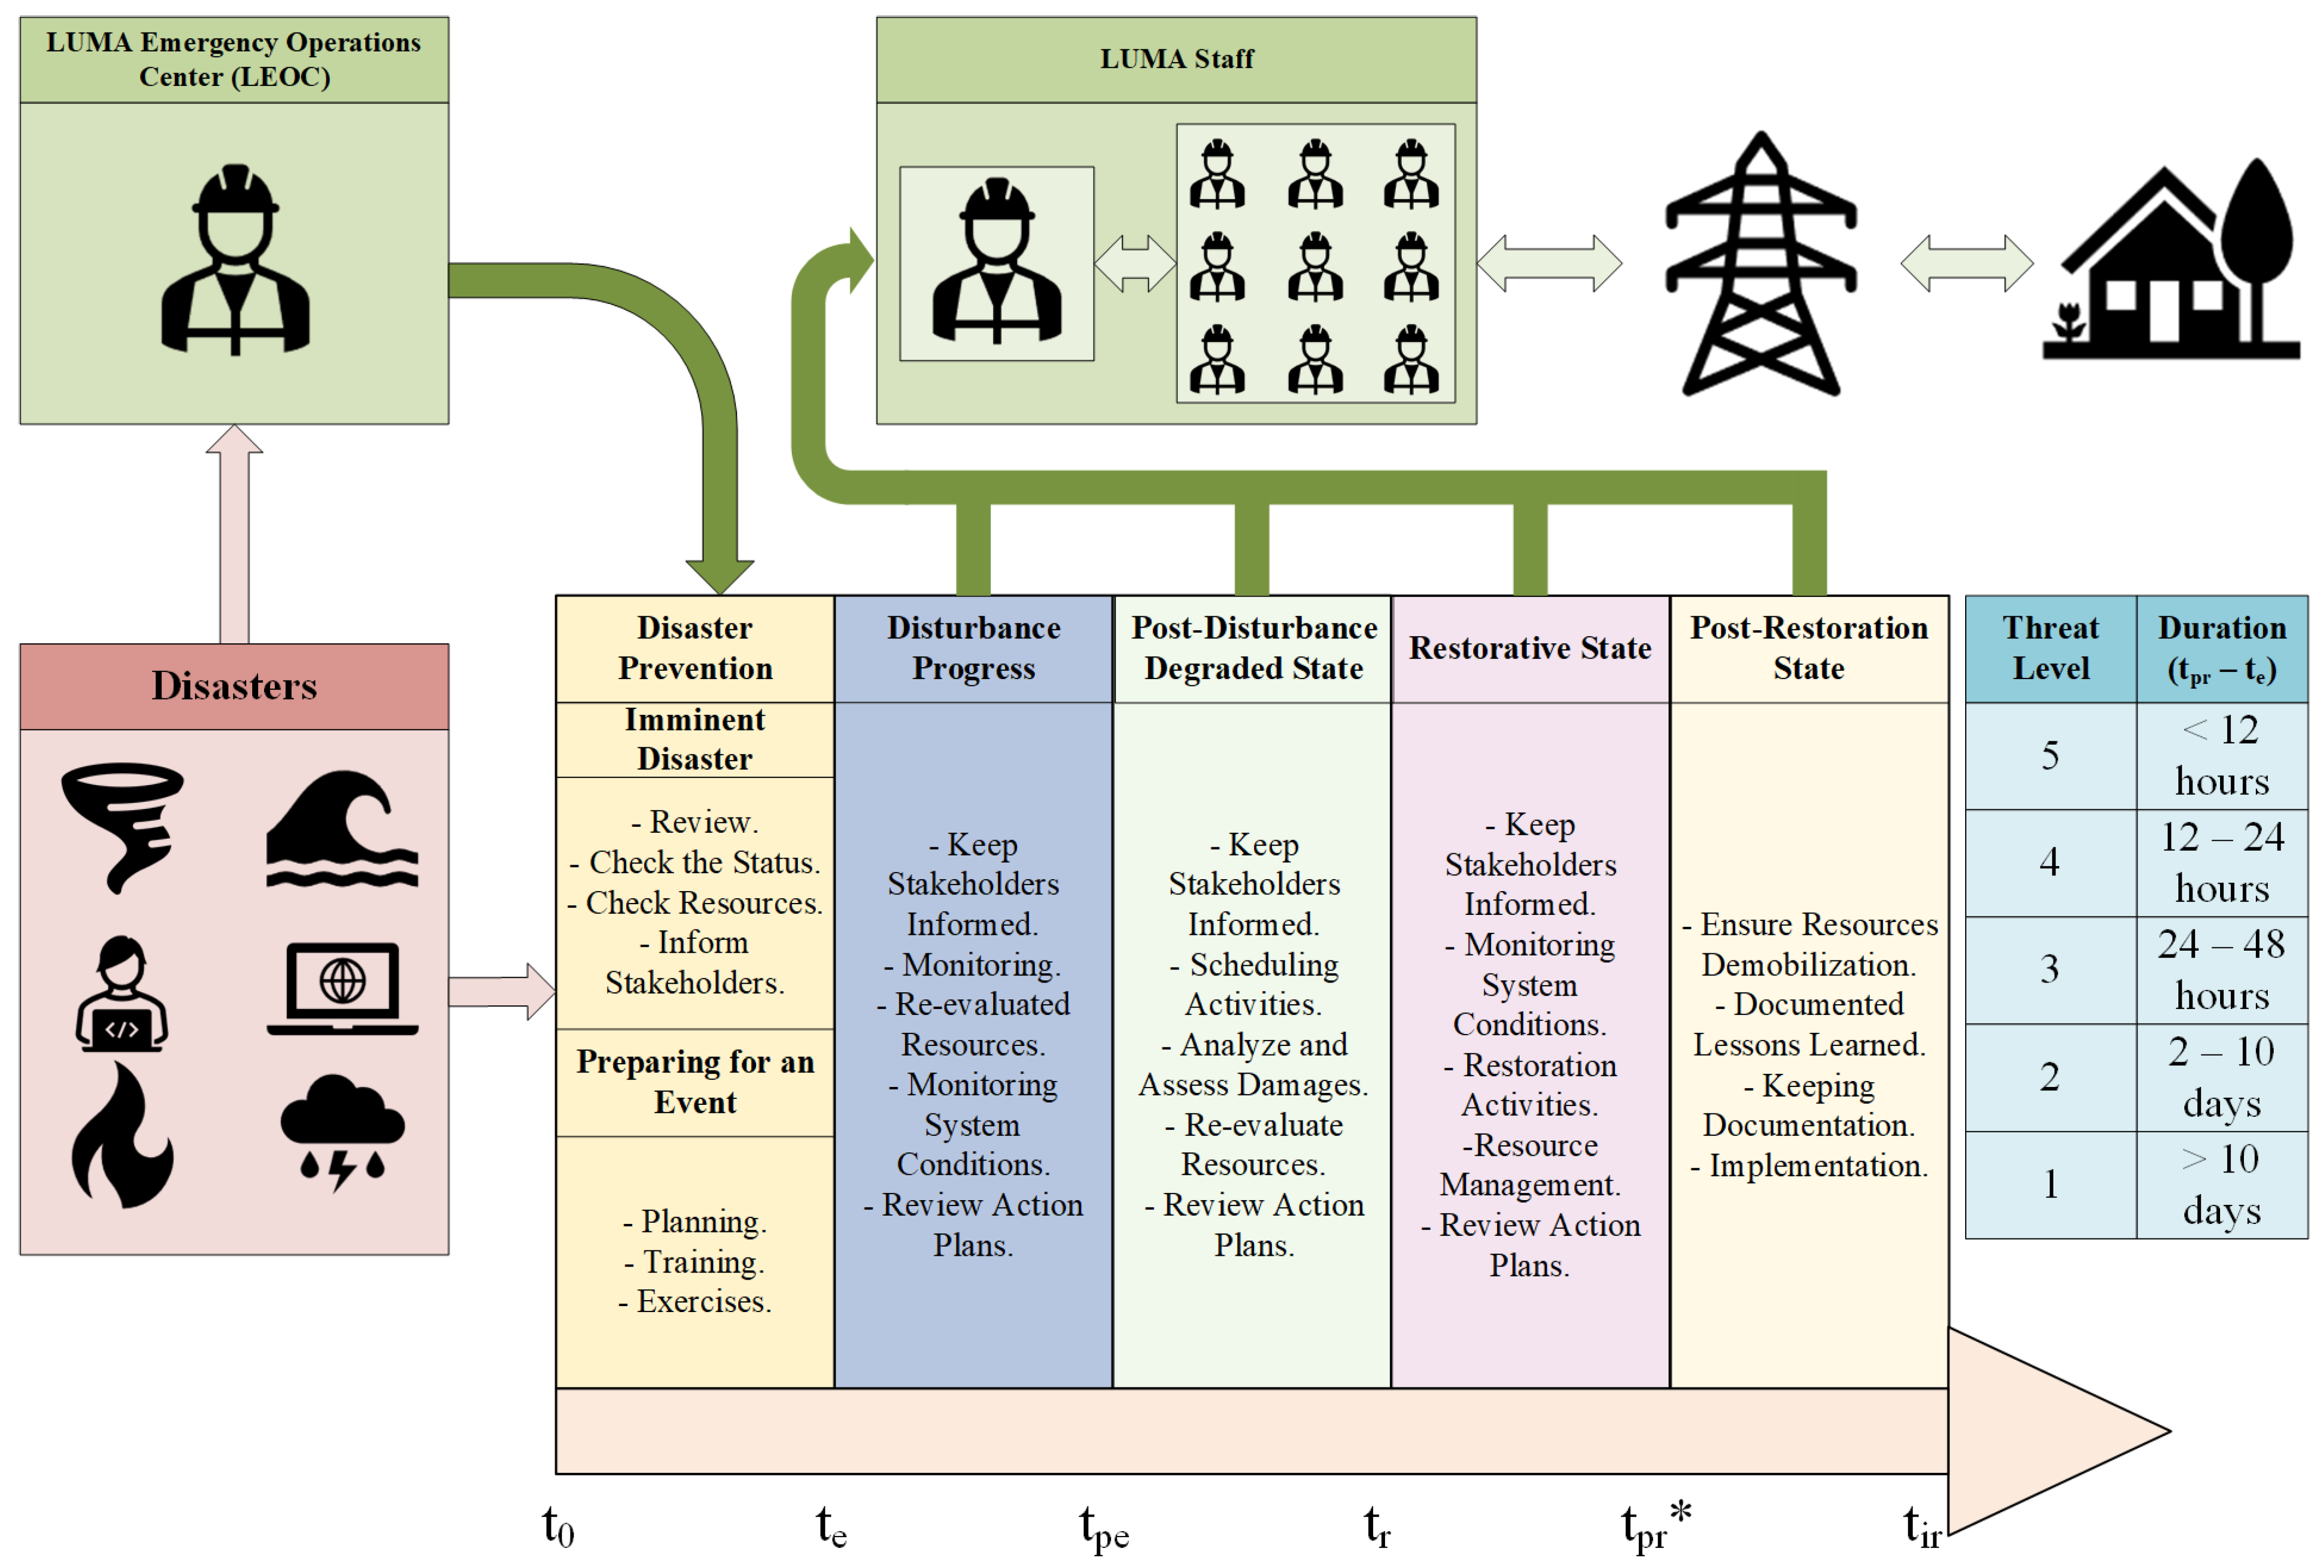
3.1. Resilience as Seen by Grid-Side Operators— Top-to-Bottom Approach

In the U.S., where the U.S. Department of Energy (DOE) has a document called “Energy Emergency Response Playbook for States and Territories” [31], the DOE provides a starting point for all states and helps them develop their own ERP. For the disaster prevention phase (Figure 5), this document establishes threat levels depending on the severity of the incident, but only considers the three most critical levels, where the smaller the number, the bigger the incident. These levels are shown in Table 4. The next phases, such as phases I, II, and III, also are established in the document [31], describing the procedures. After phase III, the DOE does not take any action, because these actions are the responsibility of each state’s energy authority.
Another example of the difference in the way that entities evaluate incidents for the disaster prevention phase (Figure 5) is shown in Puerto Rico, where even though the DOE is the highest authority in the electricity sector, Puerto Rico is autonomous and establishes its owns threat levels based on its experience and incident probability. The threat levels are shown in Table 5. For the different phases, LUMA establishes the procedures and activities, which are shown in Figure 6.

3.1.1. Disaster Prevention

For this phase, LUMA has two different ways to act. The first one is when there are no threats; therefore, they perform periodic drills and training. The second is when is an imminent disaster and LUMA has to start performing a series of steps that help them to be more prepared to face the disaster.

3.1.2. Disturbance Progress

This phase starts when the disaster is in progress, in this phase, LUMA can only monitor the event and damage in order to ensure the system health and report it to the stakeholders. Also, they can elaborate restoration plans with the information obtained during the monitoring in order to obtain and ensure the resources needed for the restoration.

3.1.3. Postdisturbance Degraded State

This phase start when the disaster ended, as in the previous phase, in this phase, LUMA has to keep the stakeholders informed about the damage and the restoration plans that will be implemented. These plans must be analyzed, re-evaluated, and approved in order to ensure or change the designated resources; they also have to schedule the needed restoration activities.

3.1.4. Restorative State

This phase starts when the restoration activities begin. As in the previous two cases, Luma has to keep the stakeholders informed, but this time about the restoration progress. Also, the grid operator has to monitor the system in order to connect or disconnect branches or equipment, as necessary. In this phase, LUMA establishes a priority order for the restoration activities; this priority order is shown in Figure 7.
An important aspect of this phase is that when restoration efforts reach 90 % of the total damage caused by the event, LUMA considers this phase as completed.

3.1.5. Postrestoration State

This phase begins when the restoration efforts are completed. In this phase, LUMA evaluates the event and the restoration activities in order to document lessons learned, look for deficiencies, and improve its action plans.

3.1.6. Resilience Cyber Attacks

The number of Internet of Things (IoT) devices connected worldwide to the network will increase by 12 % on average annually, from nearly 27 billion in 2017 to 125 billion in 2030 (https://cdn.ihs.com/www/pdf/IoT_ebook.pdf (accessed on 10 June 2023)). This increase in automation in electrical systems or smart grids (SGs) is susceptible to cyber attacks.
Cyber attacks can cause physical damage and grid power outages, resulting in significant utility costs. To mitigate these risks, developing a cyber resilience strategy that involves measures such as implementing security systems, identifying vulnerabilities, and cybersecurity training is essential. Cyber resilience involves the ability to prevent, withstand, recover from, and adapt to a cyber attack.
A basic definition, “Cyber resilience: Identifying and defending against various types of cyber attacks and maintaining secure performance during the occurrence of such an event”. In [33], an analogy between the physical threat model and the cyber threat model is proposed, establishing a comparison among certain attributes:
  • Threat probability ≡ mean of reproducibility + exploitability;
  • Vulnerability probability ≡ detectability;
  • Vulnerability impact ≡ mean damage + affected users.

3.2. Common Strategies Used by Users to Improve Resilience— Bottom-Up Approach

In this subsection, some of the most common strategies employed by users or communities to prepare or adapt before, during, and after extreme events are discussed. Figure 8 is divided into different levels: Level I, home energy storage systems (ESSs); Level II adds the use of generation through natural resources such as solar photovoltaic (PV) or wind, excluding ESSs; Level III represents the integration of Levels I and II. Finally, Level IV is considered the most comprehensive, functioning as a decentralized microgrid (MG) that incorporates the aforementioned lower levels [34].
A review of literature related to the topic is presented below, which includes some examples of the use of some of these common strategies.
  • Distributed Energy Resources (DERs): They pertain to diverse small-scale energy generation and storage technologies that can be deployed in proximity to the point of consumption, such as residences, businesses, and communities. These technologies encompass renewable energy sources, fuel cells, and energy storage systems, including batteries, as illustrated in Figure 8, positioned at levels I to IV. The adoption of distributed energy resources (DERs.) serves as a means to enhance the reliability and resilience of the electrical grid.
  • Microgrid: This is a small-scale electrical grid that operates independently or in conjunction with an electrical grid. It usually consists of DERs such as PV, wind turbines, ESSs, and backup generators that are interconnected to supply power to a localized area at Level IV. Different architectures for building microgrids, including centralized, decentralized, and distributed forms, also provide construction flexibility depending on user needs. Microgrids offer several advantages over traditional power grids, including greater energy efficiency, greater reliability and resiliency, and integration of renewable energy sources and other DERs into the grid [34].
For example, in [35,36], the authors used the Distributed Energy Resources Customer Adoption Model to supply energy to critical buildings like hospitals with a flat load profile. The authors show that with a DER microgrid, the reliability for a 7-day outage improves from 45 % using diesel generators to a 100 % using DERs.
The energy storage system (ESS) is an excellent option to improve a grid’s resilience; for example, in [37], the authors used ESSs to minimize the investment and load shedding costs under disasters based on Equation (14):
m i n C i n v + N a v e E S [ C l o s s ( S ) ]
where C i n v is the total investment, N a v e is the annual frequency of extreme disasters, and C l o s s ( S ) is the system load shedding cost under disasters. The results indicate that load shedding decreases when the ESS is configured with hardening lines, but it implies that greater investment is needed.

4. Discussion

In this document, multiple forms for assessing grid resilience were described, including the main representations that are employed. In addition, it was shown how the U.S. Department of Energy (DOE) and the Puerto Rico Department of Energy classify disasters, focusing mainly on the activities carried out by the latter to improve its resilience to disasters. Finally, we evaluated how users prepare for these disasters by classifying them based on levels according to their autonomy and complexity. Finally, we have to point out that there is much improvement is needed to maintain and increase grid reliability and resilience, for which we evaluated a series of challenges that were encountered throughout this study, which are detailed below:
  • Load Growth: The continuous growth in load is a major problem due to the large number of new users connecting to the electric grid, which can cause grid infrastructure and equipment to exceed their design values and fail without the need for an extreme event.
  • Climatic Variability: The challenges posed by climatic variability, marked by their heightened frequency and intensity, are considerable. In the United States, there has been a 67 % rise in power outages caused by weather events since the year 2000 (https://www.energy.gov/energysaver/articles/renewable-energy-and-energy-storage-can-help-you-power-through-natural (accessed on 13 October 2023)). Additionally, a substantial 83 % of all documented power outages in the U.S. are linked to weather-related incidents (https://fairtradefinder.com/the-benefits-of-portable-power-stations-for-natural-disasters/ (accessed on 13 October 2023)).
  • Integration of Renewable Resources: While renewable energies are highly beneficial for increasing the reliability and resilience of users during power outages, when connected to the grid, they can cause damage due to the large amounts of injected energy, which can lead to failures.
  • Supply Chain: Because more of the users use diesel or gas generation as a backup for the electrical grid, the supply chain is a problem, because generators can run out of fuel (https://www.datacenterknowledge.com/archives/2012/10/31/diesel-the-lifeblood-of-the-recovery-effort#close-modal (accessed on 15 October 2023)) because the fuel reserve was not sufficient or because trucks did not arrive at the generator site in time.
  • Intelligence Control. Nowadays, grid operators and utilities are seeking to introduce more and more intelligent equipment to the grid, which can be controlled remotely in order to improve reliability by minimizing reconnection time after faults, but this is also a weak point and a target for cyber attacks like that conducted on the Ukraine power grid on 2022 (https://www.bbc.com/news/technology-61085480 (accessed on 22 October 2023)).

5. Future Research Directions

The future will witness the interconnection of multiple microgrids and the refinement of energy management strategies to foster collaboration and optimize resource distribution during critical events [38]. Further exploration into dynamic boundary microgrids is crucial to augment adaptability and responsiveness in extreme conditions. The integration of AC/DC microgrids is paramount for achieving heightened stability and resilience against disruptions in a grid [39]. The development of coordinated control methods covering energy sources, the electrical grid, loads, and storage systems is imperative for comprehensive and effective management [40,41]. Additionally, acknowledging the escalating influence of artificial intelligence algorithms, such as machine learning, in the prevention of events and the improvement in emergency response within the evolving landscape of smart grids is essential [42]. These strategic research domains, coupled with the integration of artificial intelligence and smart grid technologies, collectively contribute to fortified electrical infrastructure, poised to meet the challenges of the modern era.

6. Conclusions

In conclusion, this article provided detailed metrics and evaluation methods for the different energy infrastructure resilience planning methods. We also described the differences between disaster evaluation methods and progress seen from two different points of view: from the grid-side operator and the from the user side. For the former, the resilience trapezoid was used to approximate and evaluate the different stages that occur during an emergency and what steps or strategies LUMA employs in this specific case in order to increase grid resilience, in order improve the way the energy operator (LUMA) faces the recurrent natural phenomena occurring in the Caribbean.
Moreover, it is important to acknowledge that there may be limitations in the practical application of these techniques in real-world scenarios, so further research is needed to address these challenges. Overall, this study highlights the importance of continuing to explore new approaches and techniques to ensure the resilience of power grids in the face of disruptive events.

Author Contributions

Conceptualization, C.A.V.P.; methodology C.A.V.P., F.A. and A.C.L.; formal analysis, O.F.R.-M., C.A.V.P., J.L.D., F.A. and A.C.L.; investigation, J.L.D., F.A. and A.C.L.; resources, O.F.R.-M., F.A. and A.C.L.; writing-original draft preparation, O.F.R.-M. All authors have read and agreed to the published version of the manuscript.

Funding

This study is based upon work supported by National Science Foundation NSF grant # 2316401 under the program EPSCoR RII Track-2 FEC.

Acknowledgments

This work was supported by the NSF EPSCoR RII Track-2 FEC: “Collaborative Research: RII Track-2 FEC: STORM: Data-Driven Approaches for Secure Electric Grids in Communities Disproportionately Impacted by Climate Change” under grant # 2316401.

Conflicts of Interest

The authors declare no conflicts of interest.

Abbreviations

The following abbreviations are used in this manuscript:
CAIDICustomer Average Interruption Duration Index
CICustomers interrupted
CMICustomer minutes interrupted
DERsDistributed energy resources
DOEU.S. Department of Energy
EIAEnergy Information Administration
ERPEmergency response plan
ESSEnergy storage system
FERCFederal Energy Regulatory Commission
IEEEInstitute of Electrical and Electronics Engineers
IoTInternet of Things
MGMicrogrid
PVPhotovoltaic
SAIDISystem Average Interruption Duration Index
SAIFISystem Average Interruption Frequency Index
SGSmart grid
T&DTransmission and distribution

References

  1. Shirzadi, S.; Nair, N.K.C. Power system resilience through microgrids: A comprehensive review. In Proceedings of the 2018 IEEE PES Asia-Pacific Power and Energy Engineering Conference (APPEEC), Kota Kinabalu, Malaysia, 7–10 October 2018; IEEE: Piscataway, NJ, USA, 2018; pp. 674–679. [Google Scholar]
  2. Gholami, A.; Shekari, T.; Amirioun, M.H.; Aminifar, F.; Amini, M.H.; Sargolzaei, A. Toward a consensus on the definition and taxonomy of power system resilience. IEEE Access 2018, 6, 32035–32053. [Google Scholar] [CrossRef]
  3. Izadi, M.; Hosseinian, S.H.; Dehghan, S.; Fakharian, A.; Amjady, N. A critical review on definitions, indices, and uncertainty characterization in resiliency-oriented operation of power systems. Int. Trans. Electr. Energy Syst. 2021, 31, e12680. [Google Scholar] [CrossRef]
  4. Mahzarnia, M.; Moghaddam, M.P.; Baboli, P.T.; Siano, P. A review of the measures to enhance power systems resilience. IEEE Syst. J. 2020, 14, 4059–4070. [Google Scholar] [CrossRef]
  5. Mar, A.; Pereira, P.; F. Martins, J. A survey on power grid faults and their origins: A contribution to improving power grid resilience. Energies 2019, 12, 4667. [Google Scholar] [CrossRef]
  6. Panteli, M.; Trakas, D.N.; Mancarella, P.; Hatziargyriou, N.D. Power systems resilience assessment: Hardening and smart operational enhancement strategies. Proc. IEEE 2017, 105, 1202–1213. [Google Scholar] [CrossRef]
  7. Mujjuni, F.; Betts, T.R.; Blanchard, R.E. Evaluation of Power Systems Resilience to Extreme Weather Events: A Review of Methods and Assumptions. IEEE Access 2023, 11, 87279–87296. [Google Scholar] [CrossRef]
  8. Hossain, E.; Roy, S.; Mohammad, N.; Nawar, N.; Dipta, D.R. Metrics and enhancement strategies for grid resilience and reliability during natural disasters. Appl. Energy 2021, 290, 116709. [Google Scholar] [CrossRef]
  9. Haggi, H.; Roofegari nejad, R.; Song, M.; Sun, W. A review of smart grid restoration to enhance cyber-physical system resilience. In Proceedings of the 2019 IEEE Innovative Smart Grid Technologies-Asia (ISGT Asia), Chengdu, China, 21–24 May 2019; pp. 4008–4013. [Google Scholar]
  10. Panteli, M.; Mancarella, P.; Trakas, D.N.; Kyriakides, E.; Hatziargyriou, N.D. Metrics and quantification of operational and infrastructure resilience in power systems. IEEE Trans. Power Syst. 2017, 32, 4732–4742. [Google Scholar] [CrossRef]
  11. Clark, A.; Zonouz, S. Cyber-physical resilience: Definition and assessment metric. IEEE Trans. Smart Grid 2017, 10, 1671–1684. [Google Scholar] [CrossRef]
  12. Rajkumar, V.S.; Tealane, M.; Ştefanov, A.; Presekal, A.; Palensky, P. Cyber Attacks on Power System Automation and Protection and Impact Analysis. In Proceedings of the 2020 IEEE PES Innovative Smart Grid Technologies Europe (ISGT-Europe), Hague, The Netherlands, 26–28 October 2020; pp. 247–254. [Google Scholar] [CrossRef]
  13. Wang, W.; Lu, Z. Cyber security in the smart grid: Survey and challenges. Comput. Netw. 2013, 57, 1344–1371. [Google Scholar] [CrossRef]
  14. Baumeister, T. Literature review on smart grid cyber security. Collab. Softw. Dev. Lab. Univ. Hawaii 2010, 650, 1–30. [Google Scholar]
  15. Salvi, A.; Spagnoletti, P.; Noori, N.S. Cyber-resilience of Critical Cyber Infrastructures: Integrating digital twins in the electric power ecosystem. Comput. Secur. 2022, 112, 102507. [Google Scholar] [CrossRef]
  16. Naseer, A.; Naseer, H.; Ahmad, A.; Maynard, S.B.; Siddiqui, A.M. Real-time analytics, incident response process agility and enterprise cybersecurity performance: A contingent resource-based analysis. Int. J. Inf. Manag. 2021, 59, 102334. [Google Scholar] [CrossRef]
  17. Ahmad, A.; Maynard, S.B.; Desouza, K.C.; Kotsias, J.; Whitty, M.T.; Baskerville, R.L. How can organizations develop situation awareness for incident response: A case study of management practice. Comput. Secur. 2021, 101, 102122. [Google Scholar] [CrossRef]
  18. U.S. Department of Energy. Puerto Rico Energy Recovery and Resilience Newsletter; U.S. Department of Energy: Washington, DC, USA, 2023.
  19. Sotomayor, F. Puerto Rico’s Electric Power System: An Analysis of Contemporary Failures and the Opportunity to Rebuild a More Resilient Grid, including the Development of a Utility-Scale Solar Farm on the Island Municipality of Culebra. Master’s Thesis, Master Clark University, Worcester, MA, USA, 2020. [Google Scholar]
  20. Kwasinski, A.; Andrade, F.; Castro-Sitiriche, M.J.; O’Neill-Carrillo, E. Hurricane Maria effects on Puerto Rico electric power infrastructure. IEEE Power Energy Technol. Syst. J. 2019, 6, 85–94. [Google Scholar] [CrossRef]
  21. Cox, S.L. Understanding Power System Threats and Impacts; U.S. Department of Energy: Washington, DC, USA, 2019. [CrossRef]
  22. Tierney, K.; Bruneau, M. Conceptualizing and measuring resilience: A key to disaster loss reduction. TR News 2007, 14–17. [Google Scholar]
  23. IEEE 1366-2012-IEEE; Guide for Electric Power Distribution Reliability Indices. IEEE Standards Association: New York, NY, USA, 1998.
  24. Cimellaro, G.P.; Reinhorn, A.M.; Bruneau, M. Framework for analytical quantification of disaster resilience. Eng. Struct. 2010, 32, 3639–3649. [Google Scholar] [CrossRef]
  25. Jufri, F.H.; Widiputra, V.; Jung, J. State-of-the-art review on power grid resilience to extreme weather events: Definitions, frameworks, quantitative assessment methodologies, and enhancement strategies. Appl. Energy 2019, 239, 1049–1065. [Google Scholar] [CrossRef]
  26. Attoh-Okine, N.O.; Cooper, A.T.; Mensah, S.A. Formulation of Resilience Index of Urban Infrastructure Using Belief Functions. IEEE Syst. J. 2009, 3, 147–153. [Google Scholar] [CrossRef]
  27. Bhusal, N.; Abdelmalak, M.; Kamruzzaman, M.; Benidris, M. Power System Resilience: Current Practices, Challenges, and Future Directions. IEEE Access 2020, 8, 18064–18086. [Google Scholar] [CrossRef]
  28. Henry, D.; Ramirez-Marquez, J.E. Generic metrics and quantitative approaches for system resilience as a function of time. Reliab. Eng. Syst. Saf. 2012, 99, 114–122. [Google Scholar] [CrossRef]
  29. Raoufi, H.; Vahidinasab, V.; Mehran, K. Power systems resilience metrics: A comprehensive review of challenges and outlook. Sustainability 2020, 12, 9698. [Google Scholar] [CrossRef]
  30. Eggleston, J.; Zuur, C.; Mancarella, P. From security to resilience: Technical and regulatory options to manage extreme events in low-carbon grids. IEEE Power Energy Mag. 2021, 19, 67–75. [Google Scholar] [CrossRef]
  31. U.S. Department of Energy. Energy Emergency Response PLaybook for States and Territories; U.S. Department of Energy: Washington, DC, USA, 2022.
  32. U.S. Department of Energy. LUMA Emergency Response Plan. Puerto Rico Energy Bureau. 2021. Available online: https://energia.pr.gov/wp-content/uploads/sites/7/2021/06/20210531-MI20190006-Luma-Emergency-Response-Plan-1.pdf (accessed on 2 May 2023).
  33. Mishra, S.; Anderson, K.; Miller, B.; Boyer, K.; Warren, A. Microgrid resilience: A holistic approach for assessing threats, identifying vulnerabilities, and designing corresponding mitigation strategies. Appl. Energy 2020, 264, 114726. [Google Scholar] [CrossRef]
  34. Hartono, B.; Budiyanto, Y.; Setiabudy, R. Review of microgrid technology. In Proceedings of the 2013 International Conference on QiR, Yogyakarta, Indonesia, 25–28 June 2013; IEEE: Piscataway, NJ, USA, 2013; pp. 127–132. [Google Scholar]
  35. Agarwal, S.; Black, D.R. Optimal sizing of microgrid DERs for specialized critical load resilience. In Proceedings of the 2022 IEEE Green Energy and Smart System Systems (IGESSC), Long Beach, CA, USA, 7–8 November 2022; pp. 1–5. [Google Scholar] [CrossRef]
  36. Li, B. Multi-energy Supply Microgrids To Enhance the Resilience of the Electric/Gas/Heat Utility Grid Systems Under Natural Disasters. In Proceedings of the 2020 IEEE 4th Conference on Energy Internet and Energy System Integration (EI2), Wuhan, China, 30 October–1 November 2020; pp. 2495–2500. [Google Scholar] [CrossRef]
  37. Li, Y.; Hu, Q.; Chen, Y.; Wang, J.; Fang, B.; Yang, R. Energy Storage Optimization Planning for Resilience Enhancement under Extreme Events. In Proceedings of the 2022 Asia Power and Electrical Technology Conference (APET), Shanghai, China, 11–13 November 2022; pp. 449–454. [Google Scholar] [CrossRef]
  38. Zhou, B.; Zou, J.; Chung, C.Y.; Wang, H.; Liu, N.; Voropai, N.; Xu, D. Multi-microgrid Energy Management Systems: Architecture, Communication, and Scheduling Strategies. J. Mod. Power Syst. Clean Energy 2021, 9, 463–476. [Google Scholar] [CrossRef]
  39. Zhen, S.; Ma, Y.; Wang, F.; Tolbert, L.M. Operation of a Flexible Dynamic Boundary Microgrid with Multiple Islands. In Proceedings of the 2019 IEEE Applied Power Electronics Conference and Exposition (APEC), Anaheim, CA, USA, 17–21 March 2019; pp. 548–554. [Google Scholar] [CrossRef]
  40. Azeem, O.; Ali, M.; Abbas, G.; Uzair, M.; Qahmash, A.; Algarni, A.; Hussain, M.R. A comprehensive review on integration challenges, optimization techniques and control strategies of hybrid AC/DC Microgrid. Appl. Sci. 2021, 11, 6242. [Google Scholar] [CrossRef]
  41. Ni, Q.; Zhang, C.; Meng, Z.; Huang, Y.; Jiang, Y.; Sun, W.; Zhang, Z.; Yang, L.; Lin, Z. Power System Economic Planning Considering “Source-Grid-Load-Storage” Coordination Operation. In Proceedings of the 2020 International Conference on Smart Grids and Energy Systems (SGES), Perth, Australia, 23–26 November 2020; IEEE: Piscataway, NJ, USA, 2020; pp. 1000–1004. [Google Scholar]
  42. Hosseini, M.M.; Parvania, M. Artificial intelligence for resilience enhancement of power distribution systems. Electr. J. 2021, 34, 106880. [Google Scholar] [CrossRef]
Figure 1. Resiliency evaluation framework.
Energies 17 00168 g001
Figure 2. Examples of threat events.
Energies 17 00168 g002
Figure 3. (a) SAIDI, (b) SAIFI and (c) CAIDI indices for U.S. reliability in the year 2022.
Energies 17 00168 g003
Figure 4. Resilience triangle.
Energies 17 00168 g004
Figure 5. Resilience trapezoid.
Energies 17 00168 g005
Figure 6. Top-to-bottom view of LUMA disaster strategies. * LUMA considers that the time t p r is reached when 90% of the damage has been repaired.
Energies 17 00168 g006
Figure 7. Priority order for restoration activities.
Energies 17 00168 g007
Figure 8. Decentralized-level generation.
Energies 17 00168 g008
Table 1. Review of power system resiliency characteristics.
Characteristics of the ReviewReference
Resiliency definitions[1,2,3,4,5]
Resiliency enhancement[1,2,6,7,8]
Resilience metrics or indices[1,3,9,10]
Resilience Cyber-physical[9,11,12,13]
Extreme events[2,5,7,8,9]
Table 2. Comparison of reliability and resilience.
CharacteristicReliabilityResilience
CauseEquipment, maintenance, overloads, human errorsHurricanes, earthquakes, floods, wildfires
FrequencyFrequent, high probabilityLess frequent, unpredictable, and low probability
DurationShort to medium durationCan be prolonged
ScopeLocal or regionalLocal, regional, national, or global
PredictabilityPredictable with warningsLess predictable
Recovery TimeQuicker recoveryLonger recovery
Economic ImpactCommon economic lossesSignificant economic losses
Impact on Critical InfrastructureAffects critical elementsDisrupts multiple infrastructures
Table 3. Resilience triangle vs. tesilience trapezoid by [6].
CharacteristicTriangleTrapezoid
AssessmentSingle-phase resilienceDynamic, multiphase resilience
Corrective actionsLack of corrective actions during the progress of an eventConsiders corrective actions
Degraded statusLack of postdisturbance degraded stateConsiders postdisturbance degraded state and its duration
ThreatThreat-specificApplicable to any threat
Table 4. DOE threat levels [31].
Threat LevelNameRestoration ActivitiesOutage Time
Level/Tier 1Major EventLonger repairing damaged to T&D systems, substations and other system componentsA week or longer
Level/Tier 2Significant EventRepairing damaged utility wires and structures across T & D structuresMore than 48 h, but less than one week
Level/Tier 3Enhanced WatchRepairing fallen or damaged distribution lines and polesLess than 48 h
Table 5. LUMA threat levels [32].
Threat LevelNameImpactCharacteristics
Level 1Catastrophic emergencyT&D systems: Significant damageOutage Time: More than 10 days
Affected Customers: More than 700,000 (>50% *)
Probability: 1 to 4 times in 10 years
Level 2Emergency conditionsT&D system: Significant damage
Regions: Significant damaged to multiple regions
Island: Moderate damage
Outage Time: 2 to 10 days
Affected customers: 350,000 to 700,000 (25–50% *)
Probability: 2 to 4 times in 5 years
Level 3High-alert event (moderate regional event)T & D system: Significant damage
Regions: Significant damage to multiple regions
Island: Moderate damage
Outage Time: 24 to 48 h
Affected customers: 70,000 to 350,000 (10–25% *)
Probability: 2 to 4 times in 5 years
Level 4Nonemergency vent—heightened alertDistrict: Severe damage in one or more
Island: Moderate damage.
Outage time: 12 to 24 h
Affected customers: 14,000 to 70,000 (1–5% *)
Probability: 5 to 10 times per year
Level 5Nonemergency event—normal day-to-day operationsNo impactOutage time: Less than 12 h
Affected customers: Less than 14,000 (<1% *)
* The percentage from all LUMA customers.
Disclaimer/Publisher’s Note: The statements, opinions and data contained in all publications are solely those of the individual author(s) and contributor(s) and not of MDPI and/or the editor(s). MDPI and/or the editor(s) disclaim responsibility for any injury to people or property resulting from any ideas, methods, instructions or products referred to in the content.

