Article

Numerical Study on Heat Generation Characteristics of Charge and Discharge Cycle of the Lithium-Ion Battery

1
School of Energy and Environmental Engineering, University of Science and Technology Beijing, Beijing 100083, China
2
School of Energy and Environment, City University of Hongkong, Hongkong 999077, China
*
Author to whom correspondence should be addressed.
Energies 2024, 17(1), 178; https://doi.org/10.3390/en17010178
Submission received: 26 October 2023 / Revised: 22 December 2023 / Accepted: 25 December 2023 / Published: 28 December 2023

Abstract

:
Lithium-ion batteries are the backbone of novel energy vehicles and ultimately contribute to a more sustainable and environmentally friendly transportation system. Taking a 5 Ah ternary lithium-ion battery as an example, a two-dimensional axisymmetric electrochemical–thermal coupling model is developed via COMSOL Multiphysics 6.0 in this study and then is validated with the experimental data. The proportion of different types of heat generation in a 26,650 ternary lithium-ion battery during the charge/discharge cycle is investigated numerically. Moreover, the impact of essential factors such as charge/discharge multiplier and ambient temperature on the reaction heat, ohmic heat, and polarization heat are analyzed separately. The numerical results indicate that the total heat generated by the constant discharge process is the highest in the charging and discharging cycle of a single battery. The maximum heat production per unit volume is 67,446.99 W/m3 at 2 C multiplier discharge. Furthermore, the polarization heat presents the highest percentage in the charge/discharge cycle, reaching up to 58.18% at 0 C and 1 C multiplier discharge. In a high-rate discharge, the proportion of the reaction heat decreases from 34.31% to 12.39% as the discharge rate increases from 0.5 C to 2 C. As the discharge rate rises and the ambient temperature falls, the maximum temperature increase of the single-cell battery also rises, with a more pronounced impact compared to increasing the discharge rate.

1. Introduction

Energy is crucial for promoting social development because it is related to the national economy, security, human survival, and growth [1]. With the depletion of non-renewable energy sources and the advancement of novel energy technology applications, electric vehicles have garnered increasing attention as a burgeoning mode of new energy transportation. In China, for instance, as industrial production gradually recovers from COVID-19, electric vehicle sales have grown significantly. In 2020, the annual sales reached 1.346 million units, of which pure electric passenger vehicles accounted for 73.2% [2], while in 2022, sales increased to 5.365 million. Lithium-ion batteries have become essential in novel energy vehicles because of their advantages, such as high energy density, higher cycle times, and lower self-discharge rate. They are also anticipated to enter the market soon [3]. Research based on improving positive electrode materials has shown that developing new materials can further increase battery power and capacity, greatly enhancing safety and operational parameters [4]. Zybert, M et al. improved the rate charging performance and capacity of lithium-ion batteries by doping rare earth elements [5]. Because of the internal resistance and electrochemical reaction, a large amount of heat is easily generated during the working process of lithium ions, resulting in a temperature increase in the battery’s working environment. Lithium-ion batteries are also prone to safety issues such as short circuits, combustion, and explosion in high-temperature environments [6,7]. Consequently, it is imperative to conduct a comprehensive analysis of the heat generation mechanisms inherent to lithium-ion batteries.
Research on the heat generation of lithium-ion batteries primarily relies on a combination of experimental and numerical studies. First, the simulation model with the physical parameters and electrochemical parameters of the battery is established to preliminarily identify the voltage and temperature rise characteristics of the battery. The collected data from the experimental test are used to verify the accuracy of the simulation results. The numerical simulation method is crucial for analyzing the heat generation mechanism of the battery due to its short cycle and high efficiency.
So far, the research on battery heat generation is based on the heat generation rate model proposed by Bernardi et al. [8]. The model is built on the energy balance equation of the battery system and considers the effects of electrochemical reaction, phase change, mixing effect, and Joule heat on the battery temperature. It assumes that the temperature changes uniformly with time [9]. Subsequently, Newman et al. [10] proposed an electrochemical model to accurately describe the physical and chemical phenomena, such as the diffusion and migration of lithium ions in the battery and the electrochemical reaction on the surface of active particles. Based on the research of Newman et al., Doyle [11] suggested an electrochemical–thermal coupling mode which is more thorough than the electro-thermal coupling model for heat generation analysis. Srinivasa [12] developed a two-dimensional electrochemical–thermal coupling model to analyze the thermal behavior of lithium-ion batteries. Studies have demonstrated that reversible heat is vital at all discharge rates. In 2014, based on this model, Xu et al. [13] investigated the effects of essential factors such as potential distribution and chemical reaction speed on the thermal characteristics of the battery’s constant current discharge process in detail.
Furthermore, Zhao [14] designed a one-dimensional electrochemical–thermal coupling model of the battery by focusing on the proportion of the reversible heat of the battery in the total heat production under different electrode thicknesses and material particle sizes along with separate charge and discharge rates. The results illustrated that the smaller the electrode thickness and the material particle size, the greater the effect of the reversible heat. The impact of reversible heat at a high discharge rate on the total heat production is less than that of reversible heat at a low discharge rate. In 2015, Lai et al. [15] designed an electrochemical–thermal coupling model for soft-package LiFePO4 batteries to analyze the heat production of the battery. Their findings demonstrated that the heat production at the positive and negative current collectors and the diaphragm are the lowest, and the temperature will exceed 50 °C at a higher discharge rate. In 2017, Du et al. [16] built a pseudo-two-dimensional electrochemical–thermal coupling model to investigate the effects of the discharge rate on the evolution of irreversible heat generation of batteries. The results demonstrated that the influences of battery polarization would lead to more irreversible heat generation with a higher discharge rate. Furthermore, the effect of particle diameter on the heat generation of the battery was also studied. The results demonstrated that the negative particle diameter significantly impacted the polarization heat generation of the battery. In 2019, Chiew et al. [17] and Han et al. [18] systematically analyzed the influence of discharge rate, ambient temperature, convective heat transfer coefficient, and other parameters on the temperature behavior in 26,650 lithium iron phosphate batteries. They conducted a comparative analysis of the experiment and simulation. The increase in the convective heat transfer coefficient can strengthen heat dissipation. In 2020, Xu [19] analyzed the thermal behavior of 21,700 ternary single cells during charging and discharging at 1 C, 1.5 C, and 2 C through experiments and simulations. The outcomes revealed that the temperature rise in the early charging stage under low-rate conditions is more significant than that in the discharge process. The polarization heat occupies a large proportion of the total heat production. In 2021, Li et al. [20] established a three-dimensional electrochemical–thermal coupling model to investigate the effects of the discharge rate and ambient temperature on the electrochemical and thermal characteristics of the battery. Research has discovered that the discharge rate plays a crucial role in the electrochemical and thermal behavior of the battery. The negative electrode dominates the total calorific value at low discharge rates.
In summary, a large number of experiments and simulations have been made on the mechanism of battery heat production, and a more detailed analysis of factors such as charge/discharge multiplicity, ambient temperature, and heat transfer coefficient has been carried out. However, the previous research mainly focused on the impact of charge–discharge rates on the heat generation of individual battery cells. Fewer studies analyze the heat generation during the cycling process of lithium-ion batteries. Therefore, this paper focuses on studying the characteristics of heat generation mechanisms during charge–discharge cycling at different rates, as well as the influence of different environmental temperatures on heat generation during the charge–discharge cycling process.

2. Electrochemical–Thermal Coupling Model Development

2.1. Physical Model and Mesh Division

Figure 1 shows the lithium-ion battery charging and discharging process. Lithium-ion battery charging and discharging is a reversible process. The main principle is that Li + penetrates the diaphragm in the positive and negative materials between the shuttle. In the round-trip process, in order to maintain the potential balance, there will be electrons flowing from the external circuit, supplemented to the lithium-poor side. This reaction is not equivalent to an ideal reaction, and there is energy loss during lithium-ion battery charging and discharging.
As depicted in Figure 2a, a 26,650 cylindrical ternary lithium-ion battery produced by a manufacturer from China was tested in the experiment. Table 1 enlists the key parameters. The battery is currently available on the market. Notably, this battery is readily available in the market and finds widespread utility in diverse applications, including daily lighting, electronic devices, inverters, and electric vehicles, because of its robust performance, particularly its enhanced stability during high-current discharges.
Figure 2b shows the two-dimensional axisymmetric model and meshing of the single cell. The model of the battery was built on the COMSOL Multiphysics 6.0, and the mesh type is a free triangular mesh comprising 2133 units. According to the unit mass histogram, the minimum grid unit mass is 0.4256, and the average grid unit mass is 0.8176. The cells contained in the battery model changed to 3024, but the average mesh mass was 0.853. The increase in mesh mass was small; therefore, the meshing had no effect on the model.

2.2. Control Equations and Boundary Conditions

Building upon the quasi-two-dimensional model (P2D) [10] proposed by Newman., the one-dimensional model developed in this paper aims to investigate the battery’s electrochemical reaction. The concentration of ions inside the active particles is a function of the r direction, and there is no material transfer between the particles in the negative-diaphragm-positive direction [21]. Subsequently, the two-dimensional axisymmetric model, comprising a heat transfer module that describes the heat generation of a single battery and the heat exchange between the battery and the surrounding environment, is developed. The physical fields involved in the model include a lithium-ion battery module and a solid heat transfer module, which primarily follow the laws of conservation of energy and Newton’s law of cooling, respectively. Equations (1)–(6) presents the governing equations and boundary conditions utilized in the model.
The energy equation for the 26,650 cylindrical NCM ternary lithium-ion battery [22]:
ρ c p T t = · k T T + Q
where ρ is the average density (kg/m3); c p is the specific heat capacity (J/kg K); T is the instantaneous average temperature (K); kT is the thermal conductivity in all directions of the interior in (W/m·K); and Q is the total heat production of the battery (W/m3).
Where Q mainly includes three parts: heat of reaction, polarization heat, and ohmic heat [19].
Q = Q r e v + Q r e a + Q o h m
Heat of reaction equation:
Q r e a = J i L i T E e q , i T
where E e q , i is the equilibrium potential of the positive and negative electrode materials, J i L i is the current density of the particle surface.
Polarization heat equation:
Q r e v = J i L i η i
Ohmic heating equation:
Q o h m = σ e f f , i s , i x 2 + k e f f , i l , i x 2 + 2 k e f f , i R T F 1 t + 0 ( l n c i ) x l , i x
Boundary condition:
k T T x X = L = h T T + ε σ k i r T 4 T 4
The heat transfer boundary consists of two parts: the radiation heat transfer boundary and the convection heat transfer boundary. Where h represents the convective heat transfer coefficient on the outer surface of the battery, this article selected 5 W/(m2·K), T   is the ambient temperature (K), ε is the emissivity of the thermoplastic layer of the battery, and σ k i r is the Boltzmann constant.

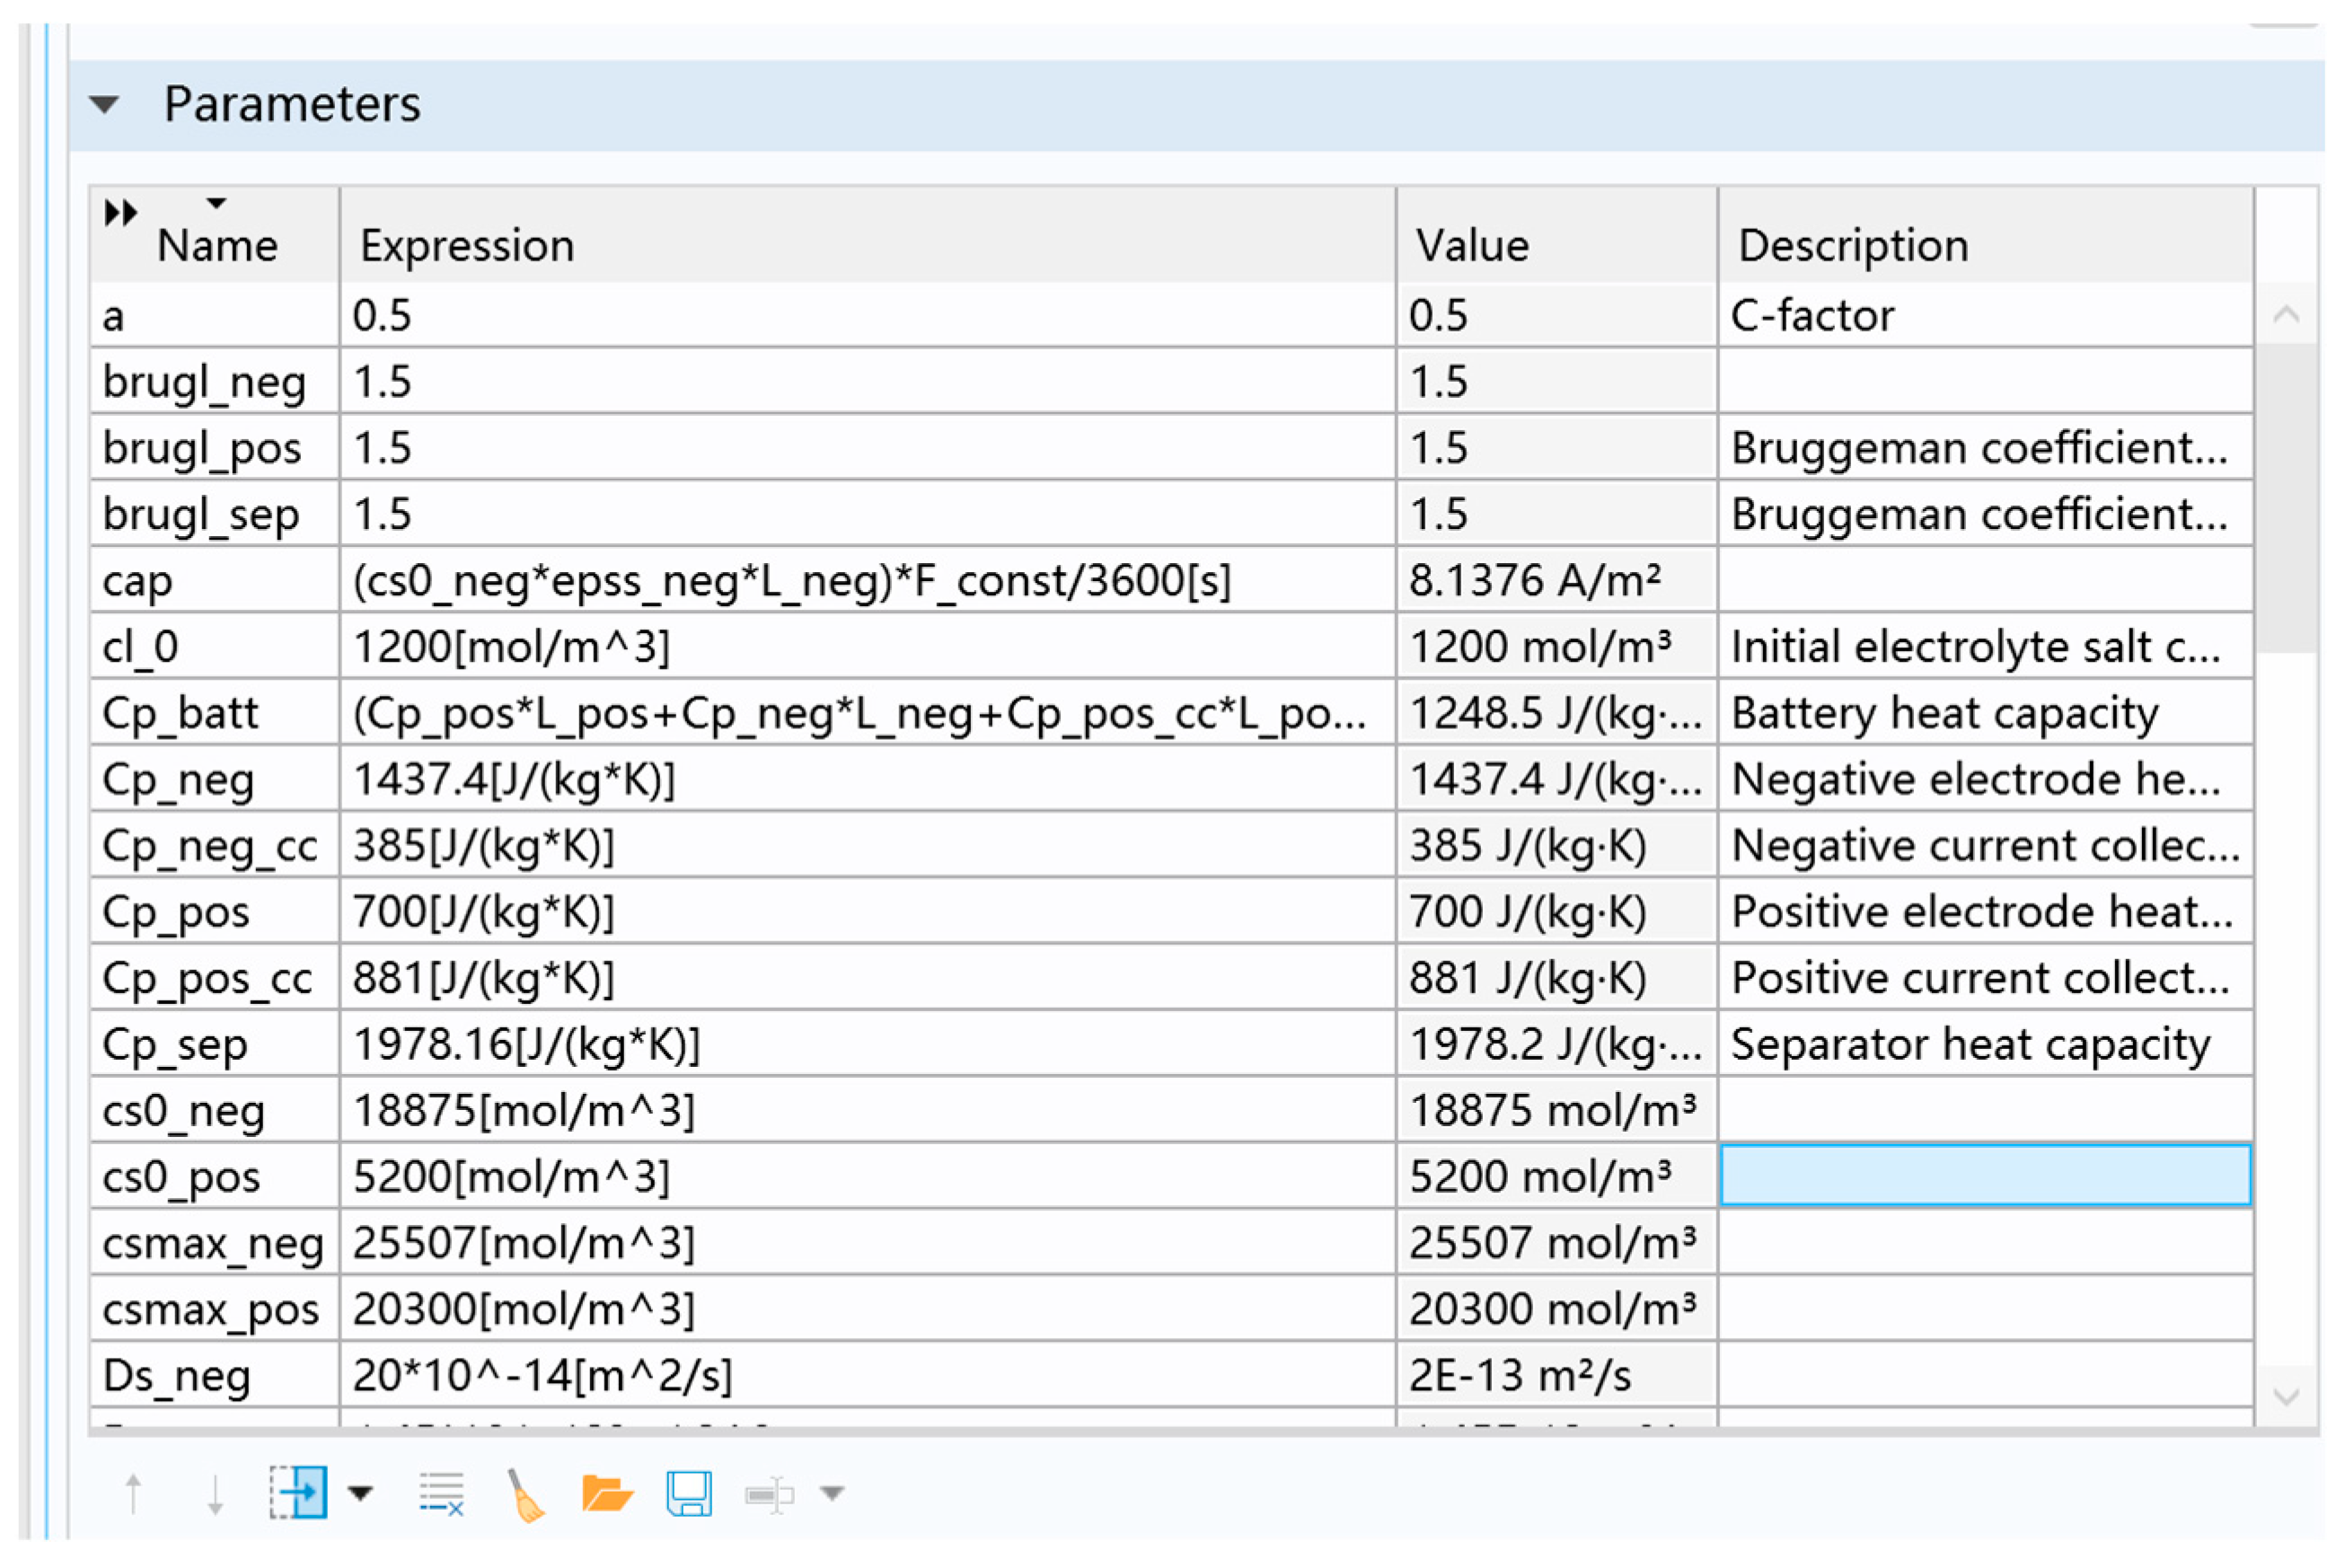
2.3. Model Parameters

In this paper, the anode material is LixC6, and the cathode material is a ternary material with Ni: Co: Mn = 1:1:1. Moreover, the electrolyte is a LiPF6 solution with solvent EC:DMC = 1:2. Table 2 and Equations (7)–(11) present some basic electrochemical parameters and temperature-related electrochemical parameters of the battery selected in this paper. Some of them are taken from the COMSOL built-in database, and the other part is from the related literature of similar battery experimental tests. Table 3 enlists the physical parameters of the battery, such as positive and negative electrodes, positive and negative current collectors, and separators. The material’s thickness is determined by disassembling the battery, and the size parameters are measured by the spiral micrometer. Additional parameters are sourced from existing literature. The settings in the software are shown in Figure 3.
Temperature-dependent electrochemical parameters [26,27,28] are determined by Equations (7)–(11), respectively.
Liquid phase conductivity:
K 2 = 1 × 1 0 4 c 10.5 + 0.074 T 6.69 × 1 0 5 T 2 + 6.68 × 1 0 4 c 1.78 × 1 0 5 c T + 2.8 × 1 0 8 c T 2 + 4.49 × 1 0 7 c 2 8.86 × 1 0 10 c 2 T 2
where c is the concentration of electrolyte, mol/m3.
Liquid diffusion coefficient:
D 2 = 1 × 1 0 4 × 1 0 4.43 54.0 T 299 0.005 c 2.2 × 1 0 4 c
Correlation of electrolyte activity:
v = 0.601 0.24 1 0 3 c + 0.982 1 0.0052 T 294 1 0 9 c 3
Positive diffusion coefficient:
D s , p = 1.45 × 1 0 13 exp 25   000 R 1 T r e f 1 T
Negative diffusion coefficient:
D s , n = 2 × 1 0 13 λ exp 35   000 R 1 T r e f 1 T
where T r e f is the initial ambient temperature, K.

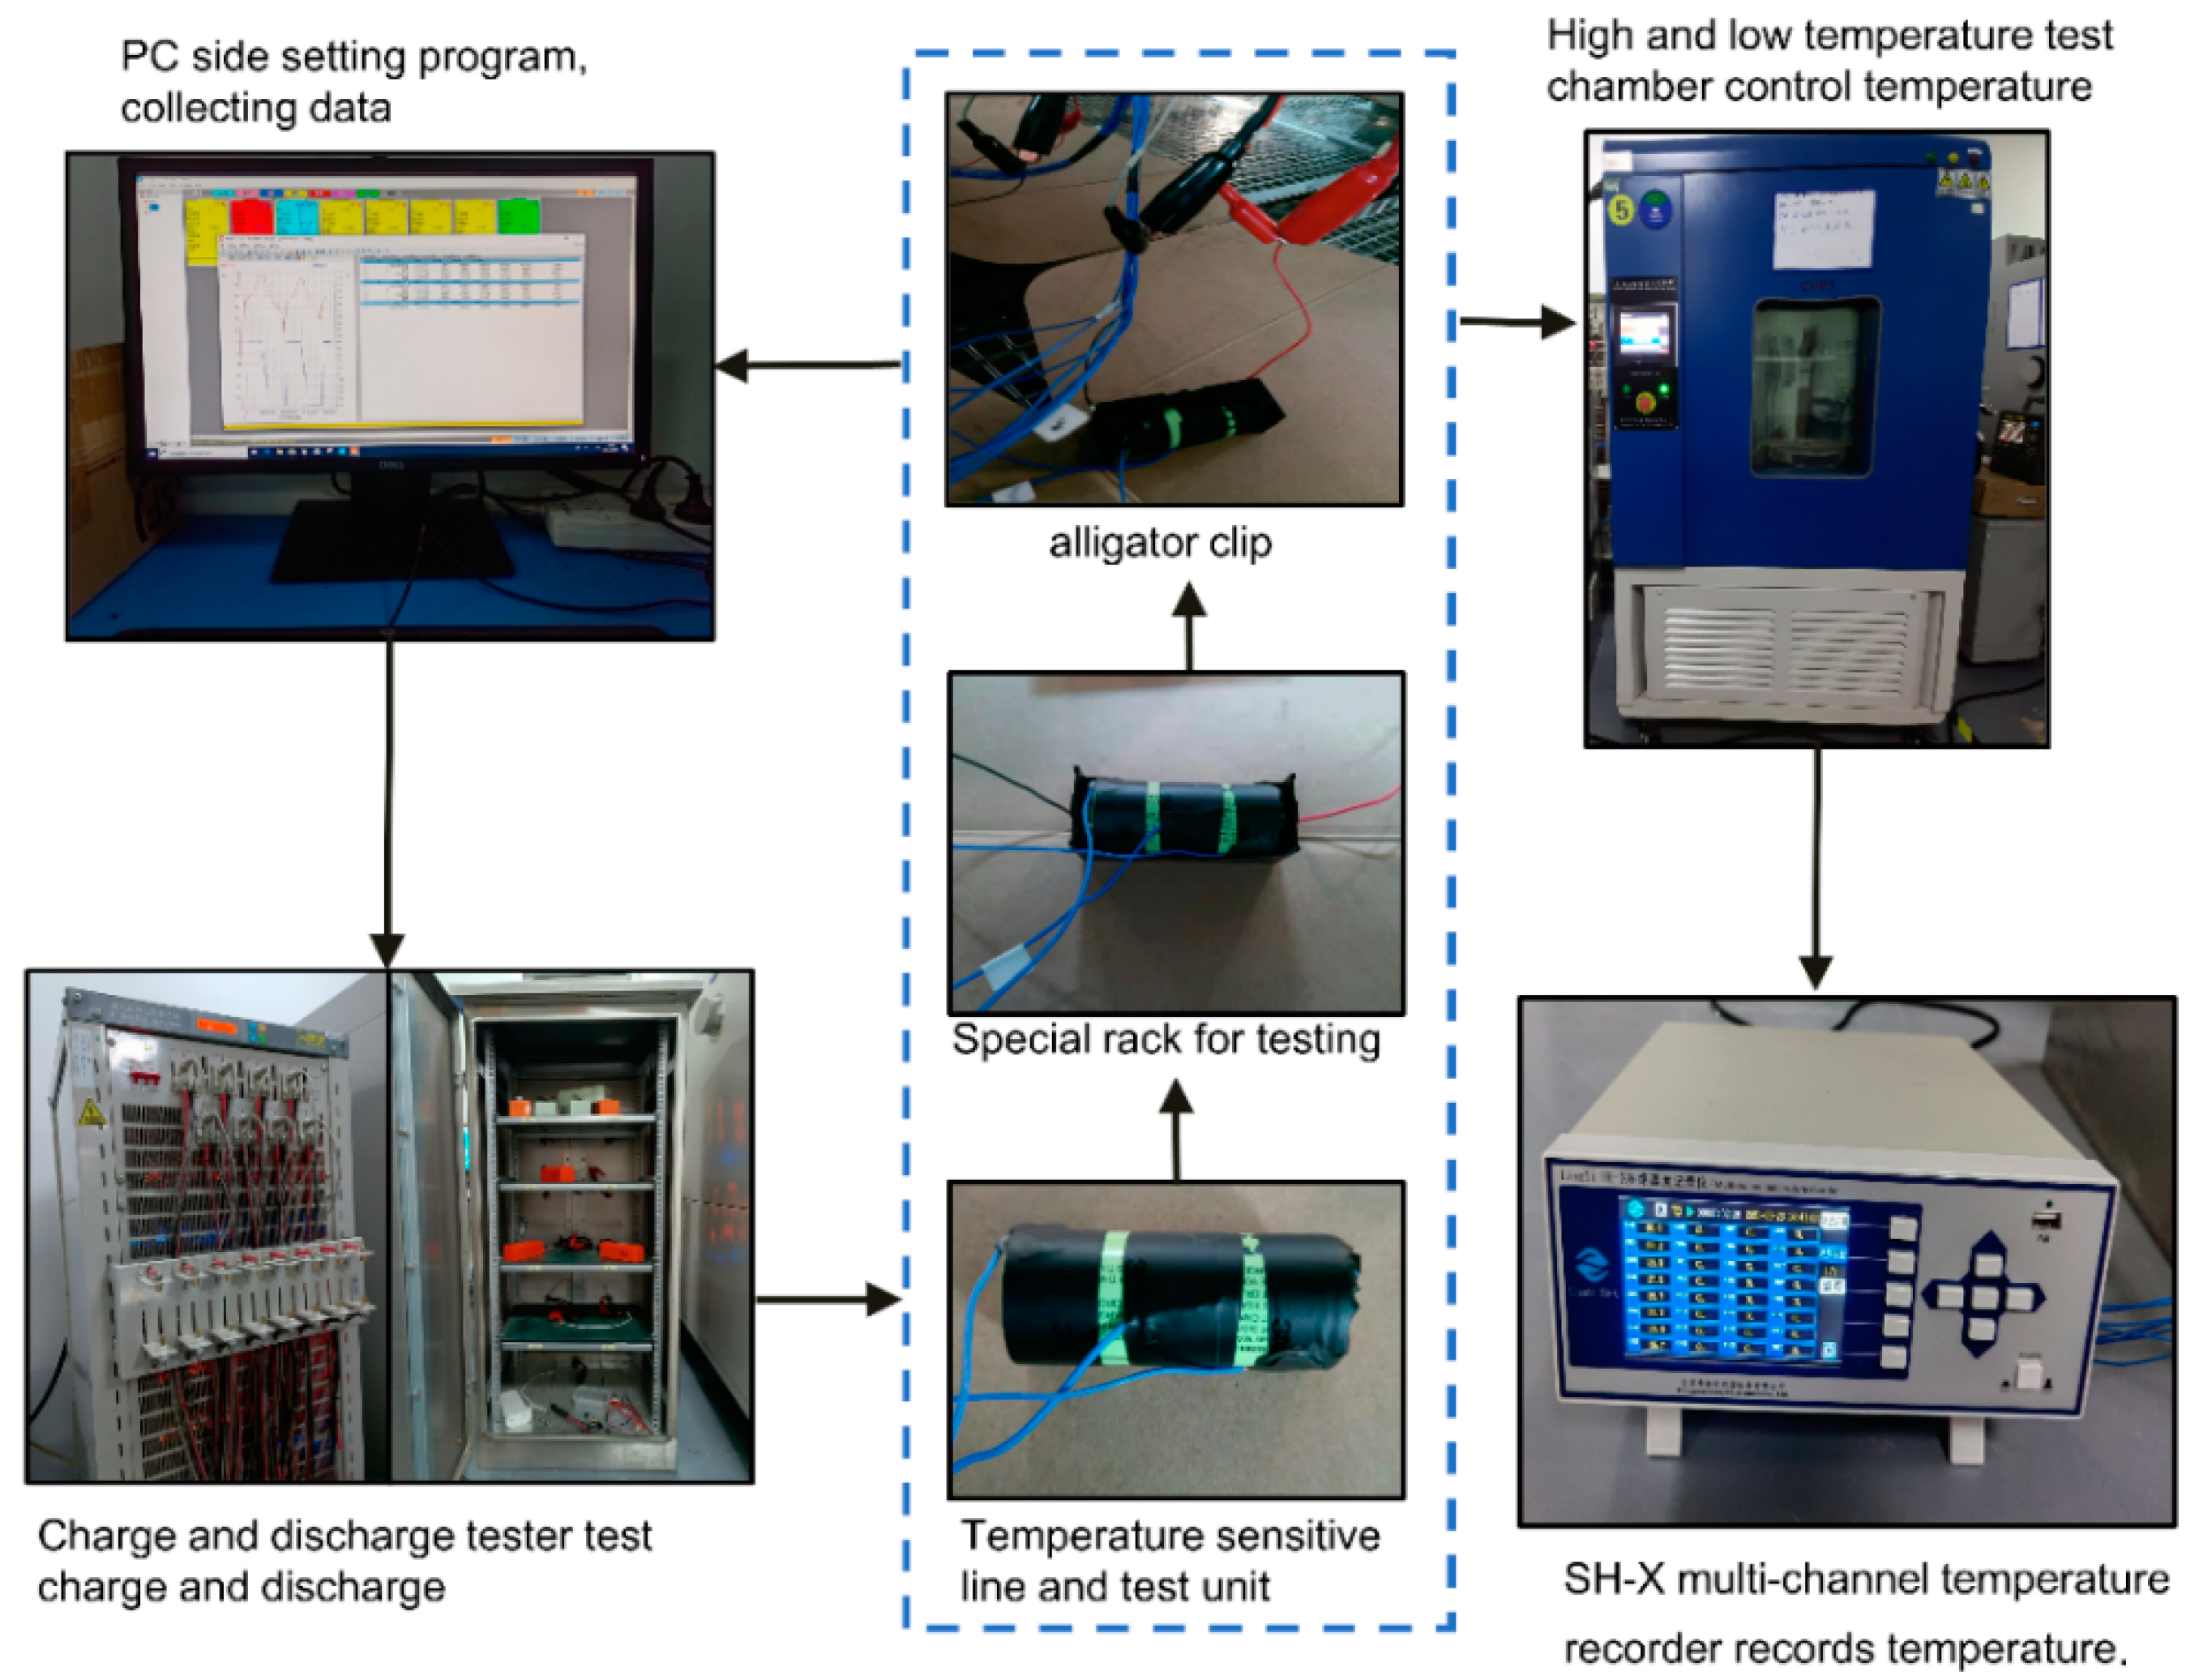
2.4. Experimental Setup

Temperature rise and voltage are crucial factors for monitoring the state of the power battery. They are also important parameters to verify the model’s accuracy. Figure 4 shows the single battery charge and discharge test platform. The main equipment is shown in Table 4. It mainly includes the Xinwei charging and discharging machine (CT4008-40V30A-NA, the measurement accuracy is as high as ±0.05% and the number of main channels of the unit is 8), high and low temperature alternating damp heat experimental box (MGDW-408-40, the measurement temperature range is −40~150 °C, the temperature deviation is within ±2.0 °C, and the display accuracy is 0.01 C), SH-X multi-channel thermometer (the working temperature is in the range of −20~70 °C, and the experimental data were recorded every 5 s), single cell, test special frame, K-type thermocouple and a desktop computer. In this section, 0.2 C, 0.5 C, 1 C, and 2 C discharge rate tests were performed at 0 °C, 25 °C, and 45 °C, respectively. The voltage and temperature rise curves under the corresponding working conditions were obtained.
The detailed workflow of the experiment is as follows (taking the ambient temperature of 25 °C as an example):
Before the start of the experiment, in order to ensure the formation of a relatively stable SEI film on the electrode surface, the single cell was first activated by cyclic activation at a charge–discharge rate of 0.2 C for three cycles.
The high and low temperature alternating humid heat test chamber is set to 25 °C, and the battery with the thermocouple is placed in the environmental box to stand for 1 h.
Set the constant current charging ratio to 0.2 C, the cut-off current to 0.05 C, charge to 4.2 V, and then discharge to a cut-off voltage of 2.75 V by 0.2 C, 0.5 C, 1 C, and 2 C, and let it stand for 30 min after each step.
After discharging, cool the battery to the ambient chamber temperature.
Adjust the high and low-temperature environment chamber settings to 0 °C and 45 °C, repeat the above step (3) respectively, complete the discharge test at the other two sets of ambient temperature, record the corresponding experimental data, and draw the voltage, current, capacity and temperature rise curves.

2.5. Model Validation

Figure 5 shows the comparison chart of the experiment and simulation under different working conditions. The comparison reveals that the two conditions are consistent. Due to the fluctuations of environmental factors in the actual measurement process and the difference in the production quality of different batches of batteries, there is a certain error between the simulation and experimental measurement results, with an overall consistent trend. Furthermore, due to the effects of temperature and discharge rate, the initial voltage of the experimental voltage curve drops significantly. In contrast, the initial voltage of the simulation process is affected by the initial setting, and the polarization phenomenon is not apparent. However, the error regarding the degree of agreement between the experiment and the simulation can be ignored. The results can still prove the reliability of the single-cell model.

3. Results and Discussion

To pursue fast and efficient charge and discharge, high-rate charge and discharge performances have become crucial for evaluating battery performance. However, high-rate charge and discharge also bring new challenges to battery thermal management. In addition, ambient temperature exerts a specific impact on battery charge and discharge performance. This section uses the electrochemical–thermal coupling model as the reaction mechanism. A two-dimensional axisymmetric model is successfully built using the COMSOL Multiphysics coupling software. The model takes a single 26,650 ternary lithium-ion battery as the research objective and investigates the charge–discharge rate and ambient temperature. The effects of charge–discharge performance and heat generation behavior of the battery provide the foundation for establishing a thermal management model of the battery pack.

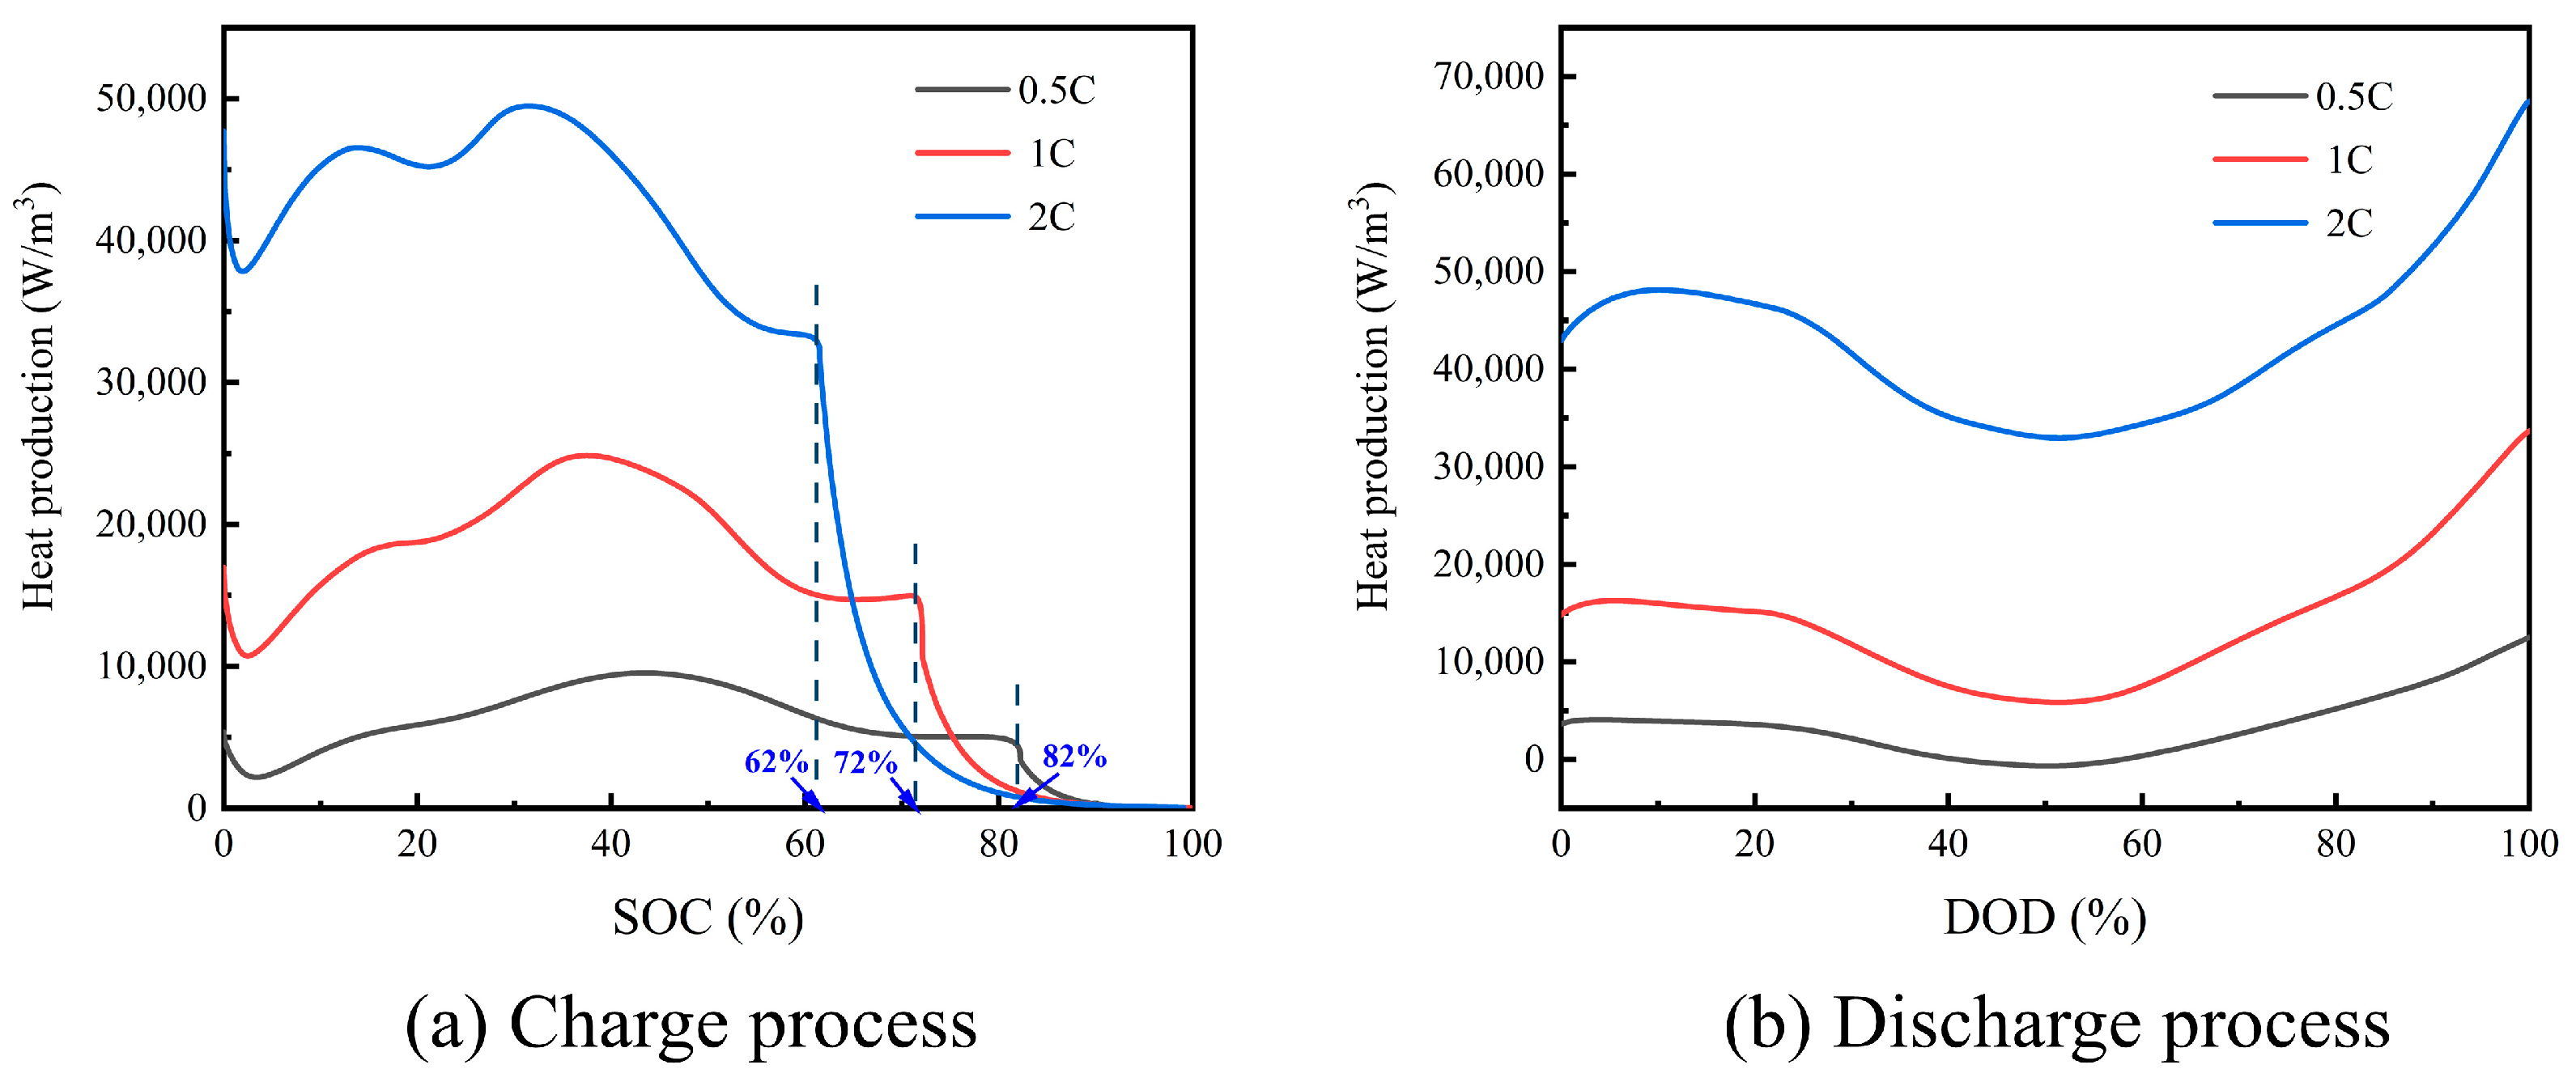
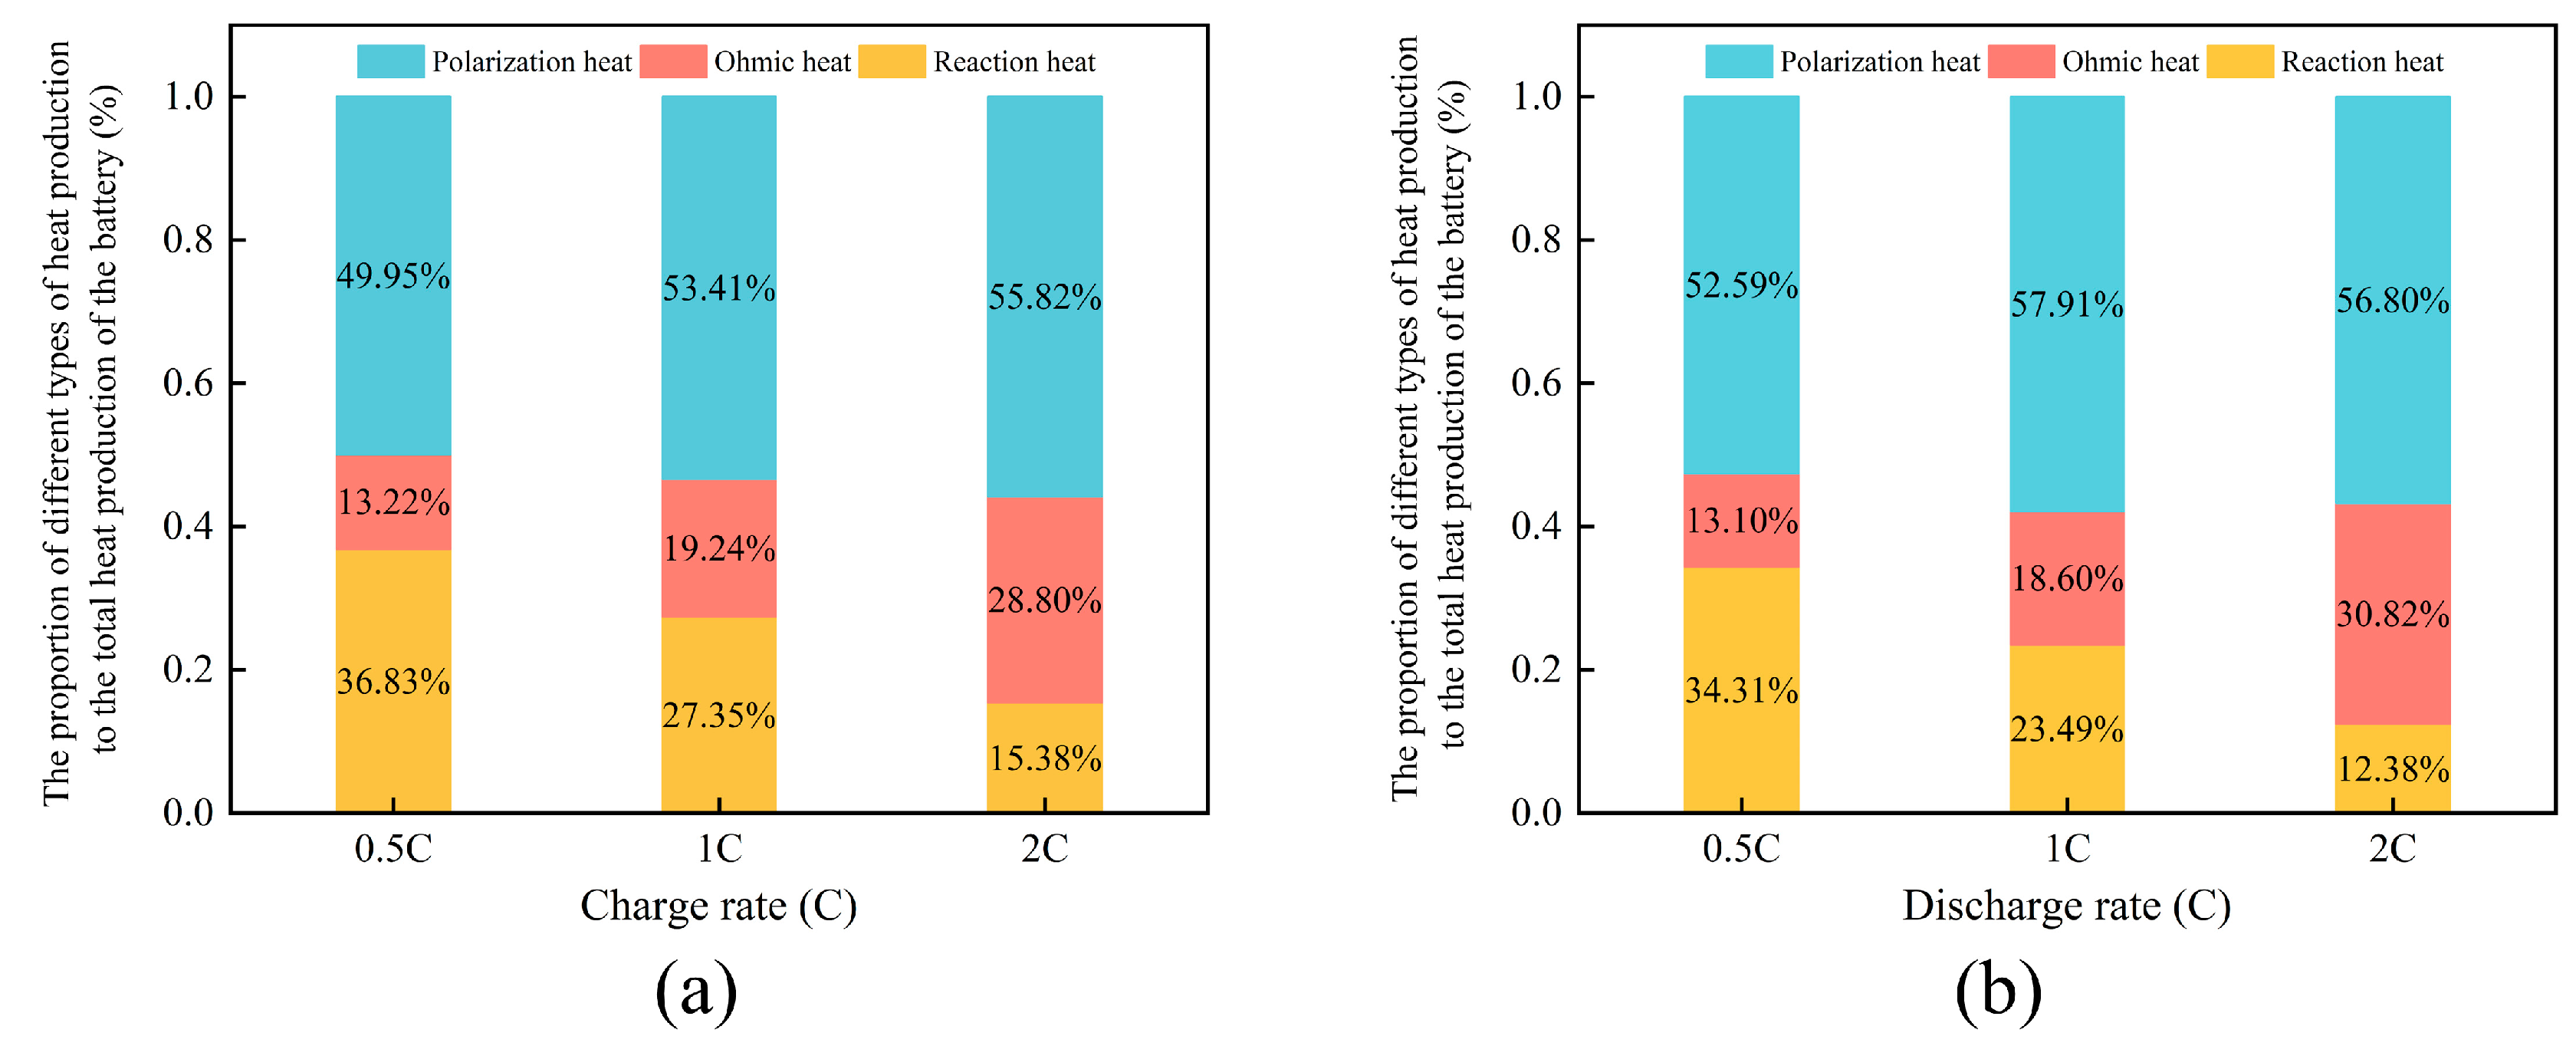
3.1. Heat Generation Mechanism of a Single Cell at Different Rates

Lithium-ion batteries, as pivotal energy storage and conversion devices in electric vehicles, possess inherent limitations that necessitate careful consideration. Factors such as overcharging, discharging, localized overheating, and external impacts like collisions can potentially impact their performance and, in severe cases, lead to safety concerns like thermal runaway. Consequently, a comprehensive analysis of the heat generation mechanisms within lithium-ion batteries assumes paramount importance in bolstering the thermal safety of electric vehicles.
The lithium-ion battery’s charging process includes constant current and voltage stages. The constant current process refers to charging the battery to the rated voltage at a constant current state, switching to a constant voltage charge, and continuing to charge the battery to a full state (generally charged to a current of 0.01 C). The lithium-ion battery discharge process is similar to the constant current process of the charging process, referring to the battery at a constant current state to cut-off voltage, to the NCM ternary lithium-ion battery, as an example, generally 2.75 V. The total electrochemical heat generation Q of the lithium-ion battery during the normal charge and discharge process primarily includes three parts: the reaction heat between positive and negative electrode materials, the polarization heat generated by potential deviation from the equilibrium position, and the ohmic heat generated by charge and discharge current flowing through internal resistance. Figure 6a–c illustrates the heat generation curves of the three types of single cells at 0.5 C, 1 C, and 2 C charge and discharge rates. The battery is allowed to stand for 30 min after charging to simulate the actual battery charging and discharging process. Next, the discharging process is started to finish a complete charging and discharging cycle. The three heat generation curves depict that the battery produces a lot of heat during the charge and discharge cycle. Notably, the heat generation trends across the three cell types at various magnifications exhibit consistent patterns, with higher charge–discharge multiples corresponding to increased heat production.
In the initial stage of lithium-ion battery charging, the charging current density is positive because the positive equilibrium potential temperature derivative is negative according to the reaction heat generation equation. The reaction heat is negative, and the initial charging is endothermic. Similarly, in the early stage of discharge of the lithium-ion battery, combined with the changing trend of the negative equilibrium potential, the initial discharge stage is also an endothermic reaction. With the continuous deepening of the charging and discharging process of lithium-ion batteries, the endothermic reaction gradually transforms into an exothermic reaction. At the beginning of charging and discharging, due to the low internal chemical reaction rate, the migration and diffusion process of lithium ions in the battery is hindered, leading to a rapid increase in the ohmic heat. The ohmic heat is stable with the progress of charging and discharging. In contrast, in the initial stage of charging and discharging, the polarization heat is high due to the significant deviation between the working and equilibrium potential. The overpotential continues to shrink with the progress of the internal electrochemical reaction. Moreover, the polarization heat during the charging process decreases and increases slightly. When the charging process is switched from the constant current charging stage to the constant voltage charging stage, the polarization heat decreases and then approaches zero due to the sharp reduction in the charging current. In the early and middle stages of the discharge process, the polarization heat has a minimum valley value. When the discharge progresses to its end, the chemical reaction gradually completes. Moreover, the polarization’s internal resistance increases again, causing the polarization heat production to continue to rise.
The total heat production of the discharge process of the lithium-ion battery is greater than the total heat production of the charging process. The heat production depends on the superposition effect of the reaction heat, polarization heat, and ohmic heat inside the battery. According to the change curve of the three different types of heat production inside the battery during the charge and discharge cycle in Figure 6a–c, the higher the rate, the greater the total heat production. The changing trend is similar to the polarization heat. The change in the reaction heat in the charging and discharging process is the opposite: from ‘first rise and then fall’ to ‘first fall and then rise’. There is no evident turning point in the ohmic heat during the charge and discharge process. When charged and discharged at 0.5 C and 1 C, the charging process is not much different from the discharge process. In addition, similar to the reaction heat, the polarization heat of the lithium-ion battery during charging and discharging is approximately ‘symmetrical’, and the minimum polarization heat generation occurs during charging and discharging.
To more intuitively explain the change in the battery’s total heat production in the later discharge stage, Figure 7 depicts the comparison of the heat production of the charging and discharging process of the single battery at different rates. The figure shows that the heat production of the battery in the constant current charging stage is greater than that in the constant voltage charging stage. The total heat production of the battery in the constant current discharge stage is also significantly greater than the maximum heat production in the constant current charging stage. At about 40% SOC of the constant current charging, the heat production of the battery reaches the maximum value with the increase in discharge depth, and the maximum value moves to the left with the rise in the discharge rate. In contrast, the constant current discharge process increases the minimum heat production rate with the rate shift to the right. When the discharge rate is 2 C, the heat production is up to 67,446.99 W/m3, which is a potentially colossal safety hazard in NCM lithium-ion batteries. In addition, heat production began to decline sharply because of the decrease in the charging current in the later stage of charging. With the increased rate, the decline point gradually moved forward at 0.5 C and 82% SOC. At 1 C, the decline point appears at 72% SOC. At 2 C, the decline point appears at 62% SOC, with an average advance per rate of 10%. Meanwhile, the discharge process at 0.5 C, 1 C, and 2 C also exhibits decreasing heat production, resulting from the reduction in polarization heat and the conversion of reaction heat from endothermic reaction to exothermic reaction. The change in heat production will directly affect the temperature increase in the battery. Therefore, in the temperature rise curve of Figure 6, the temperature rise has a short ‘platform’ followed by a rapid rise in the middle and late discharge stages.
Figure 8a,b shows the proportion of reaction heat, polarization heat, and ohmic heat to the total heat production of the battery at different rates of charge and discharge, respectively. The drawing results reveal that the polarization heat at the charging rates of 1 C and 2 C. Moreover, three discharge rates occupy half or more of the total heat production. The ohmic heat is relatively stable. With the increase in the discharge rate, the ohmic heat increases slightly. At the same time, the reaction heat corresponds to the continuous decrease. When the discharge rate is 2 C, the proportion is as low as 12.38%, and the heat production decreases obviously. Figure 4 shows the main reason why the total heat production during the discharge process of a lithium-ion battery is greater than the total heat production during the charging process. The explanation is that, in the later stage of discharge, the internal reaction heat, polarization heat, and ohmic heat of the battery all exhibit higher values. In the later stage of charging, due to the conversion of constant current charging to constant voltage charging, the current drops sharply and decreases the internal polarization heat production of the battery. Although the reaction heat is higher, the total heat production is still lower than in the later discharge stage. Consequently, continuous discharge in lithium-ion batteries carries a higher risk of triggering thermal runaway, underscoring the critical need for effective thermal management during discharge operations.

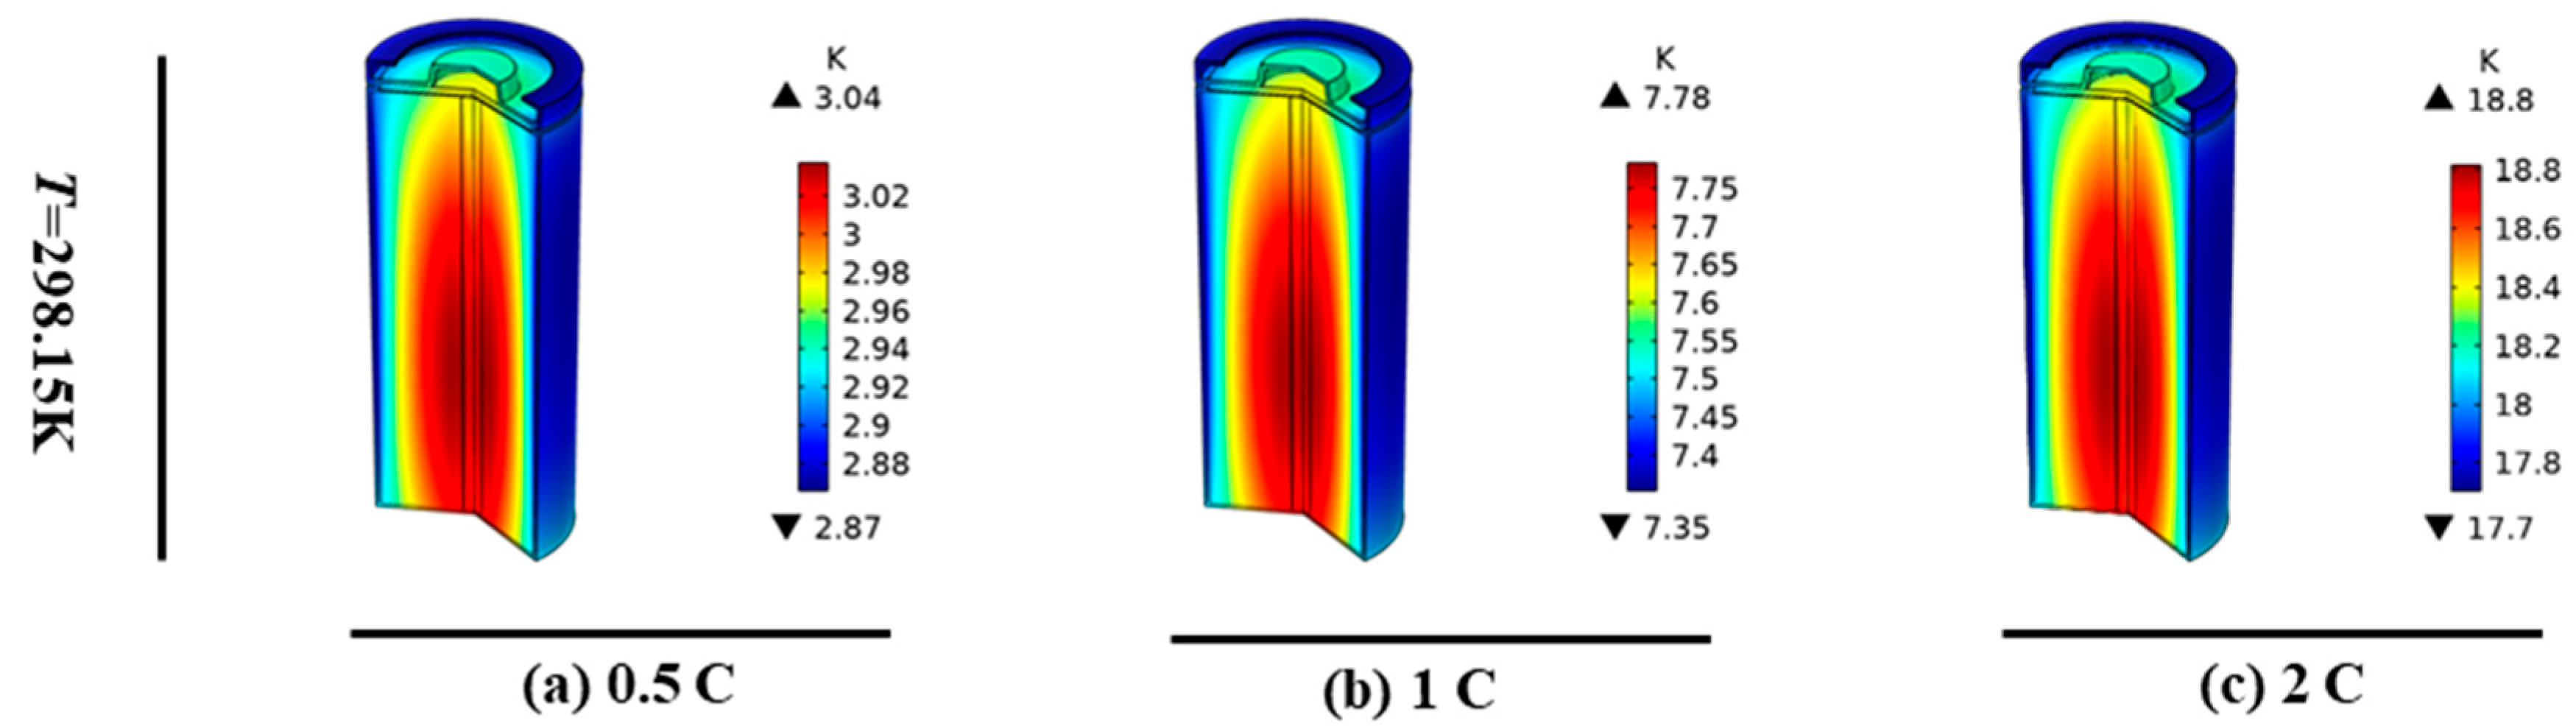
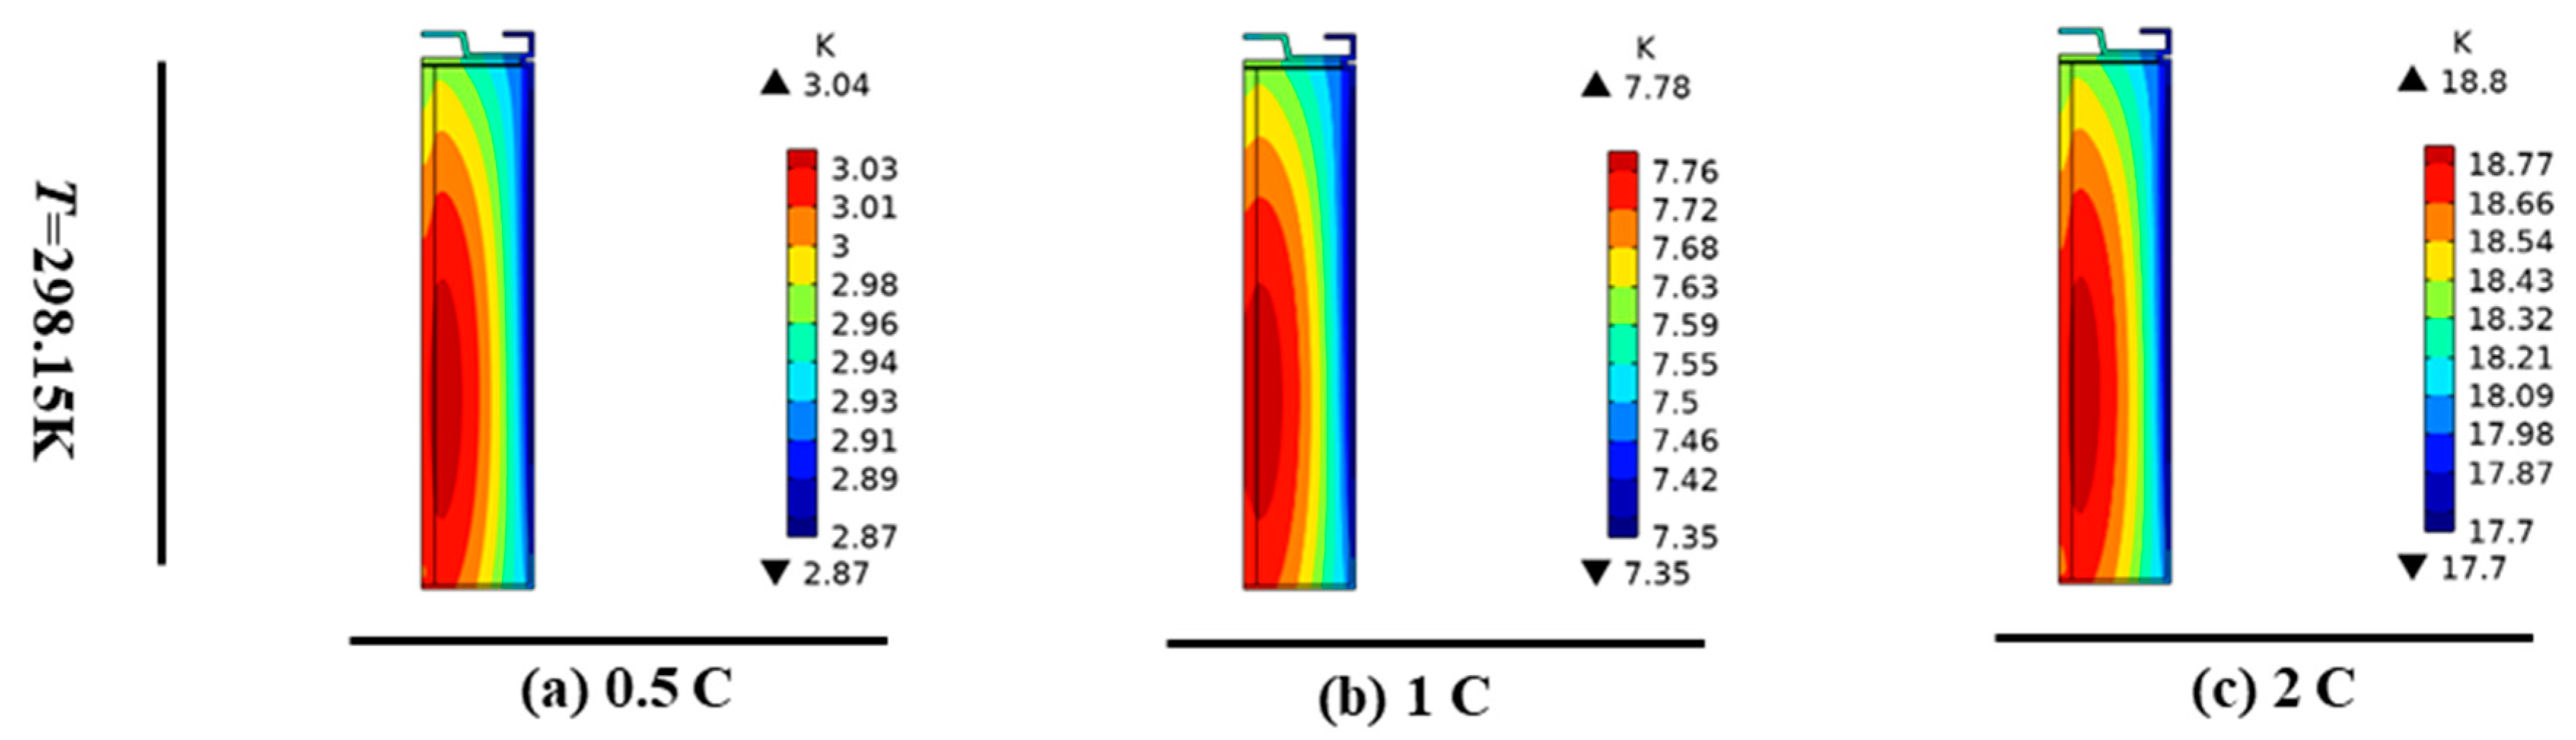
3.2. Single-Cell Discharge Temperature Distribution at Different Rates

In the analysis of the heat produced during the charge and discharge cycle of the single battery, the heat production of the battery in the later stage of discharge is much higher than that in the charging process. According to the electrochemical–thermal coupling model constructed in Section 3, the temperature distribution at three discharge rates is simulated in this section. Moreover, the three-dimensional figure of Figure 9a–c is obtained following two-dimensional rotation. The simulated temperature contour illustrates that the maximum temperature of the battery increases with the increase in the discharge rate, and the axial temperature gradient is smaller than the radial temperature gradient. When the discharge rate increases from 0.5 C to 1 C, the maximum temperature rise of the battery increases by 60.9%. When the discharge rate increases to 2 C, the maximum temperature rise increases by 58.61% compared with 1 C. The increase is reduced, but the overall trend is still increasing. Meanwhile, the internal temperature difference is also growing at 2 C discharge. The battery internal temperature difference compared with 1 C increased by 0.67 °C. If the discharge rate is further improved, the non-uniformity inside the battery will be further expanded.
Figure 10 presents a two-dimensional cross-sectional view of the single cell at three rates. In general, the battery temperature gradually decreases from the inside to the outside at each rate, and the highest point appears inside the battery and is below the middle. This observation can be explained by two key factors. First, the internal electrochemical reaction usually occurs in the active material region: for instance, the closer to the mandrel, the higher the temperature. Second, the internal heat dissipation is poor due to its tightly sealed structure. Additionally, the area directly above the battery’s positive electrode features a stainless-steel connector without insulation, resulting in a large heat exchange area and rapid heat loss. Therefore, the heat accumulation area in the temperature contour is primarily concentrated inside the battery and migrates downward. After removing the battery connection area, the axial temperature difference is about 0.1 C, and the radial temperature difference is slightly more significant. With the increase in the discharge rate, the 2 C discharge is further decreased to 1.1 C.

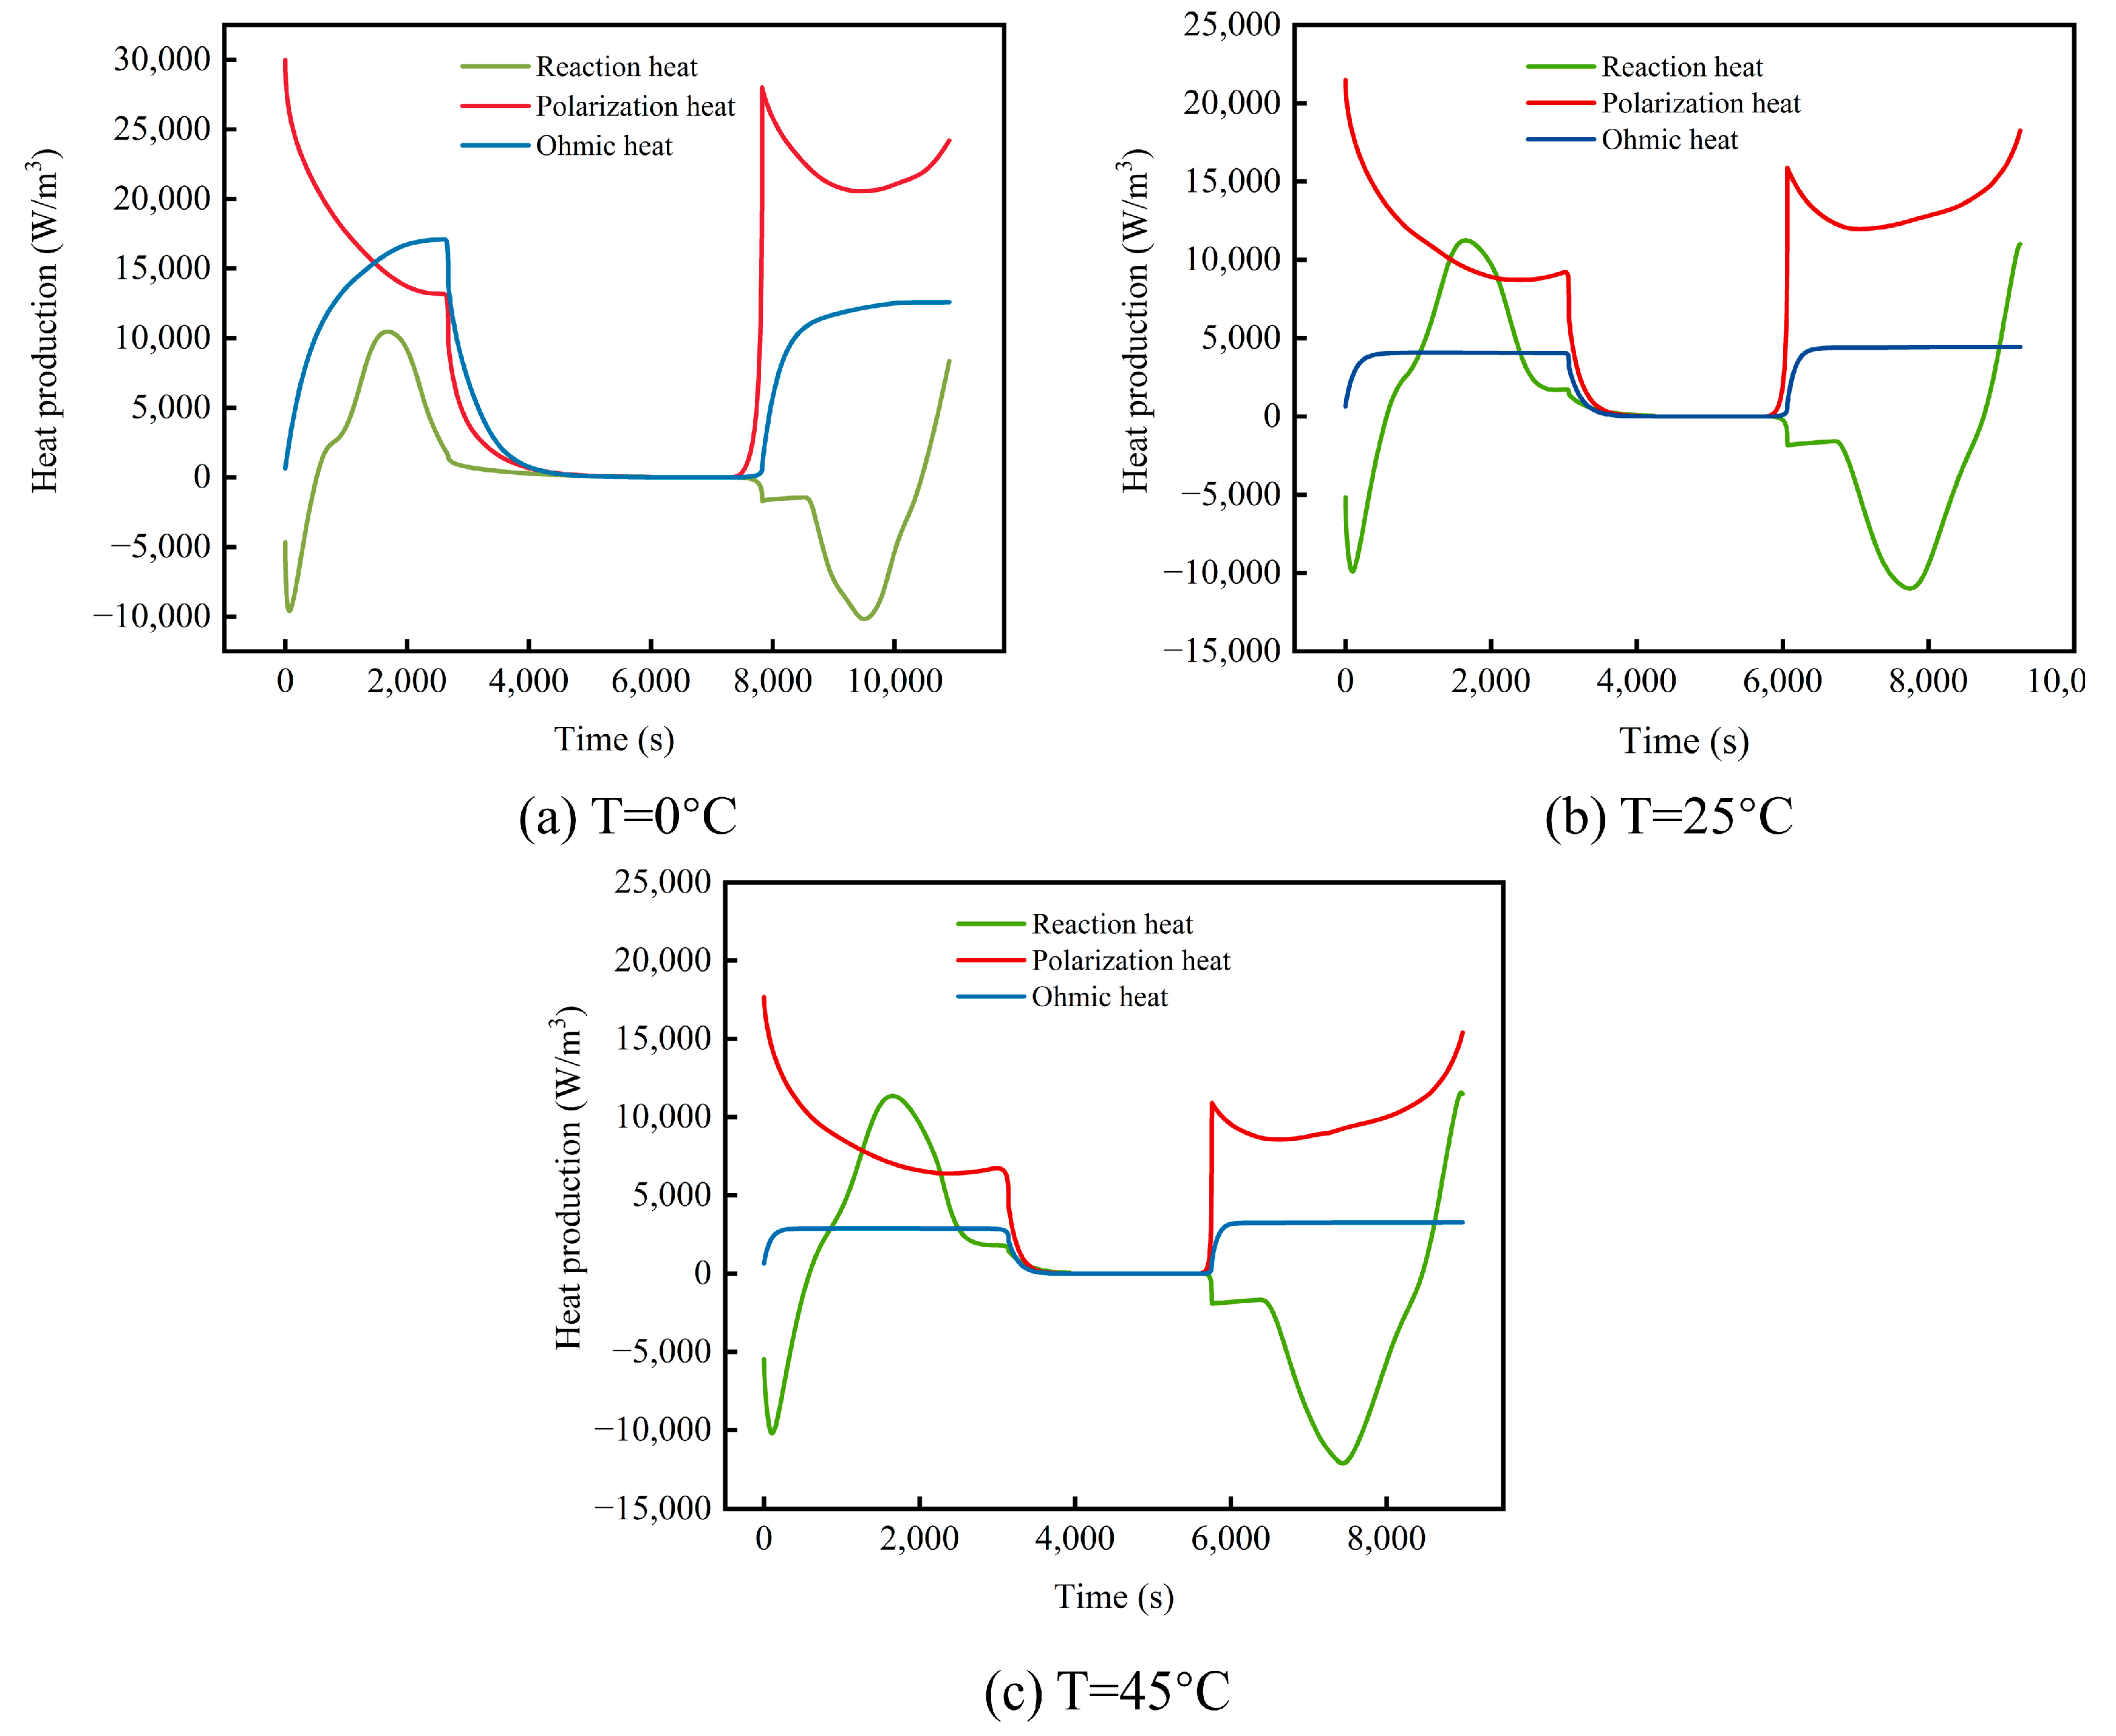
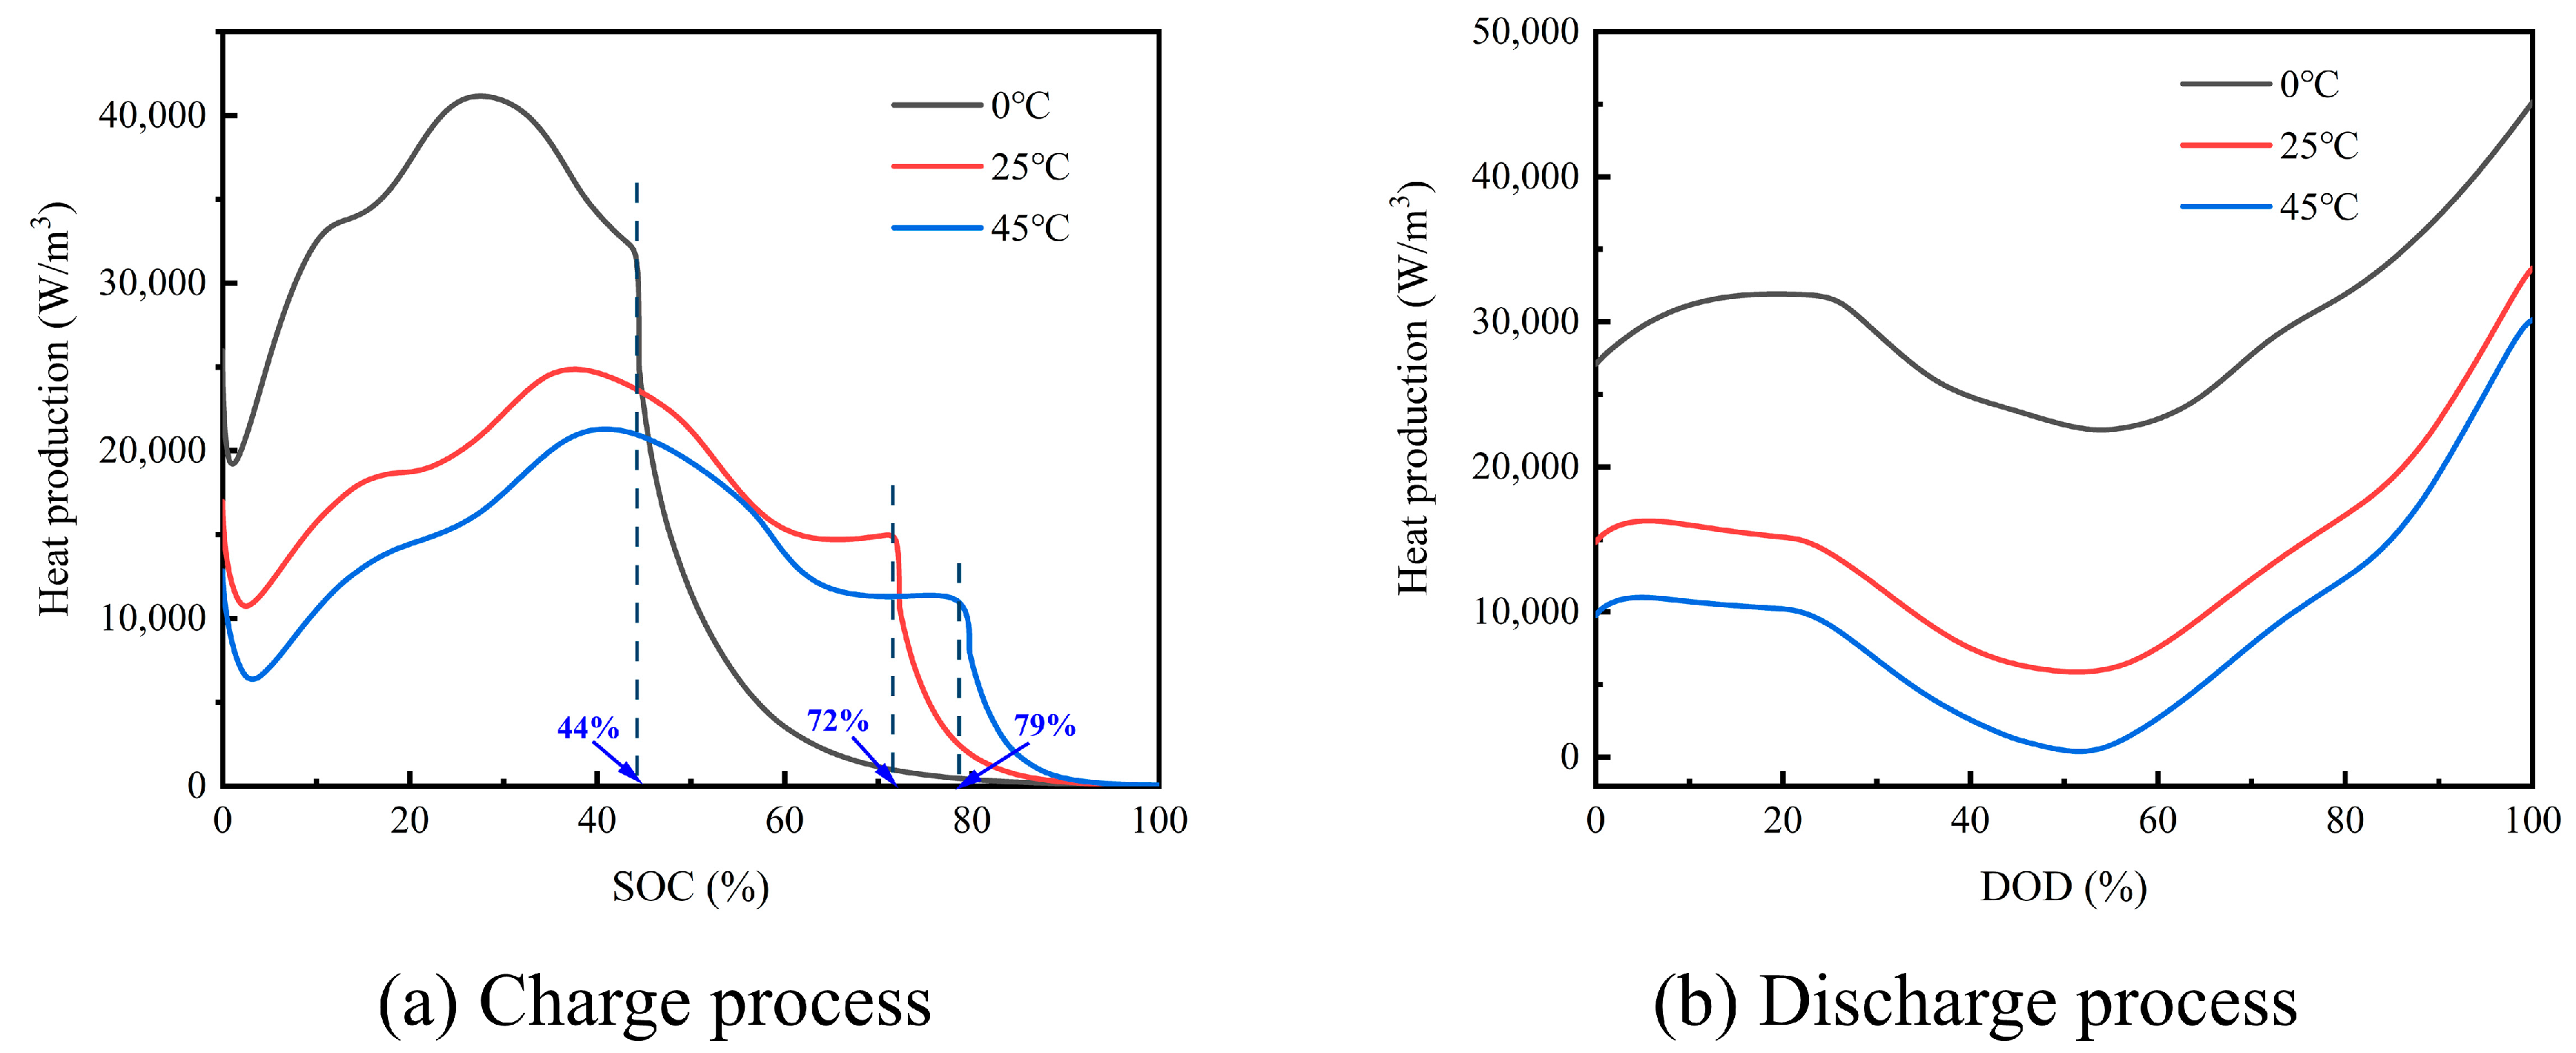
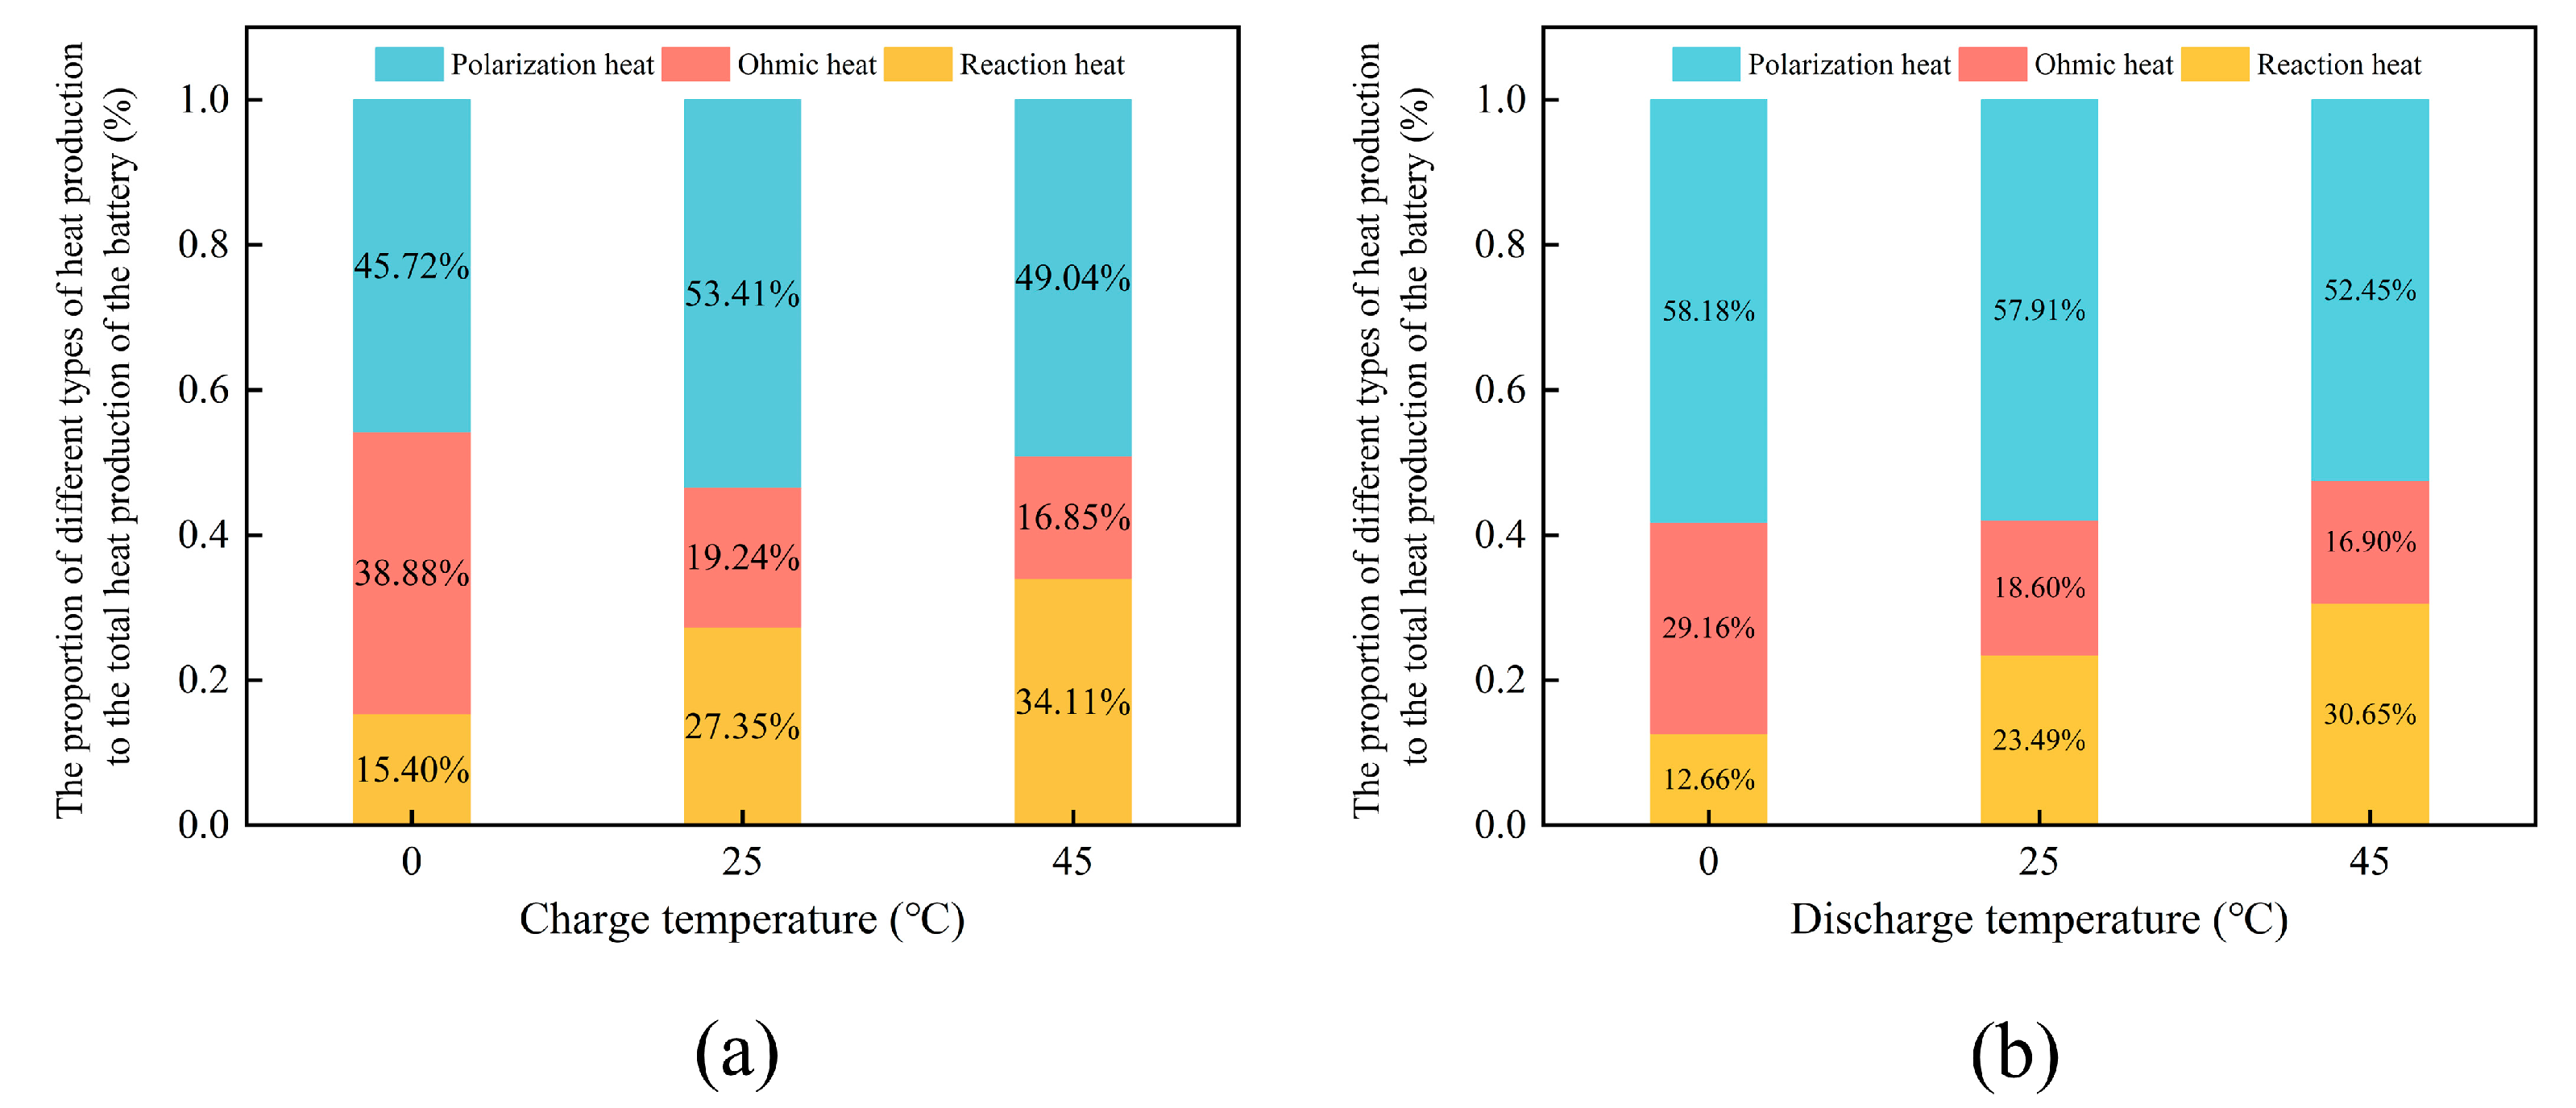
3.3. Heat Generation Mechanism of a Single Cell at Different Ambient Temperatures

The effects of 0.5 C, 1 C, and 2 C discharge rates on the heat generation of single cells were analyzed in the previous section. To further explore the factors affecting the heat generation of the battery and the temperature increase of the battery, this section is based on the two-dimensional axisymmetric model built above. The effects of three ambient temperatures of 273.15 K, 298.15 K, and 318.15 K on the heat generation of single cells at the 1 C discharge rate were analyzed.
Figure 11a–c presents the heat production curves of single cells at different ambient temperatures. The results demonstrate that the overall trend of each type of heat production is quite consistent with the heat production curves of single cells at different rates. However, the heat production value changes significantly at a low temperature of 273.15 K. The reason is that the internal active particles move slowly during low-temperature start-up, and the contact internal resistance between each part increases, causing a rapid increase in the ohmic heat. As the heat production of the battery continues to increase, the internal temperature gradually increases, and the heat produced during the constant current charging process tends to be stable. Due to the dual effects of the increase in the polarization’s internal resistance and the initial overpotential, the initial polarization heat and ohmic heat increase significantly at low temperatures, far above the reaction heat. The later stage is consistent with the ohmic heat trend, with both decreasing sharply with the decrease in the constant voltage charging current. The early-stage performance of polarization and ohmic heat also explains why electric vehicles charge slowly and inefficiently in winter.
From the three ambient temperatures, the overall trend of the reaction heat remained relatively consistent. Due to the effect of the initial equilibrium potential of the positive and negative electrodes, the charge and discharge were all endothermic reactions at the beginning of the charge and discharge. As the reaction continued to deepen, the endothermic reaction changed into an exothermic reaction. In terms of heat production, it is observed that the higher the temperature, the more intense the reaction heat and the higher the heat production. There is a gradual decline process at the end of discharge, but the decline process becomes notably faster as the discharge environment temperature decreases.
Figure 12a,b shows the total heat production curves during charging and discharging at various ambient temperatures, combining the contributions of reaction heat, polarization heat, and ohmic heat. The diagram reveals that the trend of total heat production of the discharge remains unchanged compared with the increase in magnification. The lowest heat production value remains at about 50% of the discharge. In addition, heat production is the lowest when there is a discharge at an ambient temperature of 45 °C. The reason is that the internal resistance of high-temperature polarization is small, and the electrochemical reaction is enough. This finding further explains why the temperature rise gradient becomes smaller and smaller with the increase in the ambient temperature. In contrast, during the charging process, when discharged at 0 °C, the heat production of constant current charging is abruptly changed, and the peak value of heat production is advanced to below 30% state of charge (SOC). It is converted to constant voltage charging only when charged to 44% SOC, reflecting the lithium-ion’s low activity at low temperatures. It is challenging to embed lithium during charging because the internal friction is large, and the negative electrode lithium is easy to cause deposition. In the long run, it will considerably reduce the cycle life of lithium-ion batteries. Therefore, it is advisable to implement insulation measures during low-temperature charging. Based on keeping away from flammable substances, the appropriate charging temperature (not less than 0 °C as far as possible) should be selected. The power should be checked in time to avoid overcharging or overdischarging the battery caused by low temperature, eventually leading to safety accidents.
Figure 13a,b depicts the contribution of various heat generation mechanisms to the overall heat generation of the battery during the charging and discharging processes at different ambient temperatures. This figure shows that the reaction heat gradually decreases with the decrease in the ambient temperature. At 273.15 K, the reaction heat during charging accounts for 15.40% of the total heat generation, and the reaction heat during discharge only accounts for 12.66% of the total heat generation. The low temperature exerts a more prominent effect on the reaction heat during the discharge.
Compared with the low-temperature charging and discharging process, the proportion of polarization heat in the discharge process is more significant than that in the charging process. Meanwhile, this difference is more than 12%. The primary reason for this phenomenon is that the constant voltage charging current is small at the end of charging, and the polarization heat decreases rapidly. At the end of the constant current discharge, the negative equilibrium potential deviates from the equilibrium potential. The polarization resistance increases, thereby increasing the polarization heat significantly. Meanwhile, ohmic heat occupies a very high proportion of 38.88% during low-temperature charging. Whether charging and discharging at different rates or ambient temperatures, the heat generation of a single cell is mainly polarized heat, with an average of about 50%. Future analyses of the causes of battery thermal runaway must consider the effect of low-temperature polarization.

3.4. Discharge Temperature Distribution of Single Cell at Different Ambient Temperatures

Figure 14a–c shows the three-dimensional temperature distribution of the single cell at different ambient temperatures. It is evident that low temperatures significantly impact the temperature rise of the single cell, especially at a consistent 1 C discharge rate. When the ambient temperature decreases from 298.15 K to 273.15 K, the maximum temperature rise of the single cell increases by 3.92 °C. Conversely, when the ambient temperature rises to 318.15 K, the maximum temperature rise of the single cell is 5.86 °C lower than that of 273.15 K. Compared with the increase in the battery temperature caused by increasing the charge and discharge rate, the temperature rise of the battery at 273.15 K is more pronounced. In addition, the increase in the ambient temperature promotes more intense chemical reactions inside the battery; therefore, the temperature uniformity of the battery is better. When discharged at an ambient temperature of 318.15 K, the radial temperature difference of the battery is only 0.35 °C, nearly half of the 273.15 K discharge. Future research endeavors should aim to address the challenges associated with rapid temperature increase due to low temperatures, significant radial temperature differences, and their potential impact on battery longevity.
Figure 15a–c depicts the two-dimensional temperature distribution of a single cell at different ambient temperatures. The results show the internal temperature distribution closely mirrors the discharge temperature distribution across different rates at the three specified ambient temperatures. The temperature of the core shaft and the active material area of the battery is the highest, and the temperature rises from the inside to the outside and then decreases continuously. Because the outside of the battery is the primary heat transfer area, including convection heat transfer and radiation heat transfer, the temperature difference gradient inside and outside the battery is large. As the ambient temperature decreases, the outer surface of the battery dissipates heat faster. The heat generated in the center is more concentrated, and the internal high-temperature region is more concentrated.
In summary, by analyzing the thermal characteristics and temperature distribution of 26,650 ternary lithium-ion batteries at different rates and different ambient temperatures, strengthening the internal heat dissipation of the battery is crucial for any operation in a high- or low-temperature environment. The active cooling strategy is used to regulate the battery temperature between 20 °C and 40 °C to avoid thermal runaway accidents caused by uncontrollable temperature rise and untimely heat dissipation. In addition, in the low-temperature start-up process, appropriate insulation measures can be applied to avoid the low temperature induced by the rapid increase in the battery temperature.

4. Conclusions

In this paper, a single-cell charge and discharge model was built based on the electrochemical–thermal coupling model. The effects of charge and discharge rate and ambient temperature on single cells’ heat generation and temperature distribution were analyzed. Several key findings and insights were revealed through the analysis:
During the charge–discharge cycles of 0.5 C, 1 C, and 2 C, the total heat production during constant current charging is greater than that during constant voltage charging, and the total heat production during constant current discharge is also significantly greater than the maximum value of the total heat production during constant current charging. At a 2 C discharge rate, the maximum heat production per unit volume can reach 67,446.99 W/m3.
Regardless of the charging or discharging process, the polarization heat occupies the highest proportion of the total heat production, showing an approximately ‘symmetrical’ shape on both sides. The ohmic heat performance is relatively stable and increases slightly with the increase in the discharge rate. Meanwhile, the reaction heat corresponds to the continuous reduction, the 2 C rate discharge, the proportion is as low as 12.39%, and the heat production decreased significantly.
With the increase in the discharge rate and the decrease in the ambient temperature, the maximum temperature rise of the single battery will increase. However, the effect of reducing the ambient temperature is more evident than the effect of reducing the ambient temperature. When the ambient temperature is 0 °C, the maximum temperature rise of the single cell is 11.7 °C. When the ambient temperature increases from 0 °C to 25 °C, the maximum temperature rise of the single cell is reduced by 3.92 °C.
These findings collectively underscore the intricate interplay of factors influencing heat generation and temperature distribution in single lithium-ion cells during charge and discharge cycles. Understanding these dynamics is pivotal for advancing the thermal management of lithium-ion batteries, particularly in applications where these cells are widely employed, such as electric vehicles.
On the basis of this study, further research will be conducted in the future:
  • Further investigation into the transitional phases of individual battery cells from controllable temperature rise to thermal runaway temperature rise. By exploring the dynamic changes in battery thermal behavior under extreme conditions, a more comprehensive understanding of the stability of batteries in various working environments can be obtained.
  • Our next studies tend to consider extending the individual battery cell heat generation model to the battery pack level to address thermal management issues in grouped batteries. The thermal behavior of battery packs involves the mutual influence of multiple individual battery cells, which is crucial to practical applications such as electric vehicles and energy storage systems. Future research can optimize thermal management strategies to enhance the performance, lifespan, and safety of battery packs.

Author Contributions

Data curation, Y.L.; Formal analysis, Y.L., Y.G. and W.L.; Investigation, J.F. and C.P.; Methodology, Y.T. and Y.L.; Supervision, J.F. and C.P.; Validation, W.L.; Visualization, Y.G. and C.P.; Writing—original draft, Y.T. and Y.L.; Writing—review and editing, Y.T., Y.G., W.L. and C.P. All authors have read and agreed to the published version of the manuscript.

Funding

This paper is supported by the Central Fundamental Research Funds—R&D and Application Demonstration of Battery Sharing Service System for Electric Transportation based on ICT Technology (FRF-MP-20-34).

Data Availability Statement

Data are available from the authors upon request.

Conflicts of Interest

The authors declare no conflicts of interest.

Nomenclature

c The concentration of the electrolyte, mol/m3
c p Specific heat capacity, J/(kg·K)
r Active particle radius, μ m
D s , n Lithium-ion diffusion coefficient of the negative electrode
D 2 Diffusion coefficient
F Faraday’s constant, (C/mol)
K 2 electrical conductivity, S/m
Q Total battery heat production, W/m3
Q r e a ˙ heat of reaction, W/m3
T Temperature, °C
SOCState of Charge
η i Overpotential
σ k i r Boltzmann’s constant
h Heat transfer coefficient, W/(m2·K)
v Electrolyte activity correlation
C Charge–discharge rate
D s , p Lithium-ion diffusion coefficient of the positive electrode
E e q , i Equilibrium potential
J i L i Current density, A/m3
k T Thermal conductivity, W/(m·K)
Q o h m Ohmic heating, W/m3
Q r e v Polarization heat, W/m3
DODDepth of discharge
ε Radiance, J/K
ρ Density; kg/m3
h Heat transfer coefficient, W/(m2·K)
v Electrolyte activity correlation
C Charge–discharge rate
D s , p Lithium-ion diffusion coefficient of the positive electrode
E e q , i Equilibrium potential

References

  1. Song, D.; Meng, W.; Dong, M.; Yang, J.; Wang, J.; Chen, X.; Huang, L. A critical survey of integrated energy system: Summaries, methodologies and analysis. Energy Convers. Manag. 2022, 266, 115863. [Google Scholar] [CrossRef]
  2. Auto Review. Monthly Data Tracking of New Energy Vehicles. Available online: https://autoreview.com.cn/m/show_article-12776.html (accessed on 11 November 2023).
  3. Rao, Z.; Wang, S. A review of power battery thermal energy management. Renew. Sustain. Energy Rev. 2011, 15, 4554–4571. [Google Scholar] [CrossRef]
  4. Zybert, M.; Ronduda, H.; Raróg-Pilecka, W.; Wieczorek, W. Application of rare earth elements as modifiers for Ni-rich cathode materials for Li-ion batteries: A mini review. Front. Energy Res. 2023, 11, 1248641. [Google Scholar] [CrossRef]
  5. Zybert, M.; Ronduda, H.; Dąbrowska, K.; Ostrowski, A.; Sobczak, K.; Moszyński, D.; Hamankiewicz, B.; Rogulski, Z.; Rarog-Pilecka, W.; Wieczorek, W. Suppressing Ni/Li disordering in LiNi0.6Mn0.2Co0.2O2 cathode material for Li-ion batteries by rare earth element doping. Energy Rep. 2022, 8, 3995–4005. [Google Scholar] [CrossRef]
  6. Zhang, X.; Li, Z.; Luo, L.; Fan, Y.; Du, Z. A review on thermal management of lithium-ion batteries for electric vehicles. Energy 2022, 238, 121652. [Google Scholar] [CrossRef]
  7. Zhang, Z.; Yu, W.; Li, H.; Wan, W.; Zhang, W.; Zhuo, W.; Liu, Q. Heat transfer characteristics and low-temperature performance of a lithium-ion battery with an inner cooling/heating structure. Appl. Therm. Eng. 2023, 219, 119352. [Google Scholar] [CrossRef]
  8. Bernardi, D.; Pawlikowski, E.; Newman, J. A general energy balance for battery systems. J. Electrochem. Soc. 1985, 132, 5. [Google Scholar] [CrossRef]
  9. Xie, Y.; Shi, S.; Tang, J.; Wu, H.; Yu, J. Experimental and analytical study on heat generation characteristics of a lithium-ion power battery. Int. J. Heat Mass Transf. 2018, 122, 884–894. [Google Scholar] [CrossRef]
  10. Doyle, M.; Fuller, T.F.; Newman, J. Modeling of galvanostatic charge and discharge of the lithium/polymer/insertion cell. J. Electrochem. Soc. 1993, 140, 1526. [Google Scholar] [CrossRef]
  11. Doyle, M.; Newman, J. The use of mathematical modeling in the design of lithium/polymer battery systems. Electrochim. Acta 1995, 40, 2191–2196. [Google Scholar] [CrossRef]
  12. Srinivasan, V.; Wang, C.-Y. Analysis of electrochemical and thermal behavior of Li-ion cells. J. Electrochem. Soc. 2002, 150, A98. [Google Scholar] [CrossRef]
  13. Xu, M.; Zhang, Z.; Wang, X.; Jia, L.; Yang, L. Two-dimensional electrochemical–thermal coupled modeling of cylindrical LiFePO4 batteries. J. Power Sources 2014, 256, 233–243. [Google Scholar] [CrossRef]
  14. Zhao, R.; Gu, J.; Liu, J. An investigation on the significance of reversible heat to the thermal behavior of lithium ion battery through simulations. J. Power Sources 2014, 266, 422–432. [Google Scholar] [CrossRef]
  15. Lai, Y.; Du, S.; Ai, L.; Ai, L.; Cheng, Y.; Tang, Y.; Jia, M. Insight into heat generation of lithium ion batteries based on the electrochemical-thermal model at high discharge rates. Int. J. Hydrog. Energy 2015, 40, 13039–13049. [Google Scholar] [CrossRef]
  16. Du, S.; Lai, Y.; Ai, L.; Ai, L.; Cheng, Y.; Tang, Y.; Jia, M. An investigation of irreversible heat generation in lithium ion batteries based on a thermo-electrochemical coupling method. Appl. Therm. Eng. 2017, 121, 501–510. [Google Scholar] [CrossRef]
  17. Chiew, J.; Chin, C.; Toh, W.; Gao, Z.; Jia, J.; Zhang, C. A pseudo three-dimensional electrochemical-thermal model of a cylindrical LiFePO4/graphite battery. Appl. Therm. Eng. 2019, 147, 450–463. [Google Scholar] [CrossRef]
  18. Han, X.; Huang, Y.; Lai, H. Electrochemical-thermal coupled investigation of lithium iron phosphate cell performances under air-cooled conditions. Appl. Therm. Eng. 2019, 147, 908–916. [Google Scholar] [CrossRef]
  19. Xu, W. Simulation Research on Thermal Behavior and Liquid Cooling Strategy for Lithium-Ion Battery during Charge–Discharge Cycle. Master’s Thesis, University of Science and Technology of China, Hefei, China, 2020. [Google Scholar]
  20. Li, H.; Saini, A.; Liu, C.; Yang, J.; Wang, Y.; Yang, T.; Pan, C.; Chen, L.; Jiang, H. Electrochemical and thermal characteristics of prismatic lithium-ion battery based on a three-dimensional electrochemical-thermal coupled model. J. Energy Storage 2021, 42, 102976. [Google Scholar] [CrossRef]
  21. Rao, L.; Newman, J. Heat-generation rate and general energy balance for insertion battery systems. J. Electrochem. Soc. 1997, 144, 2697. [Google Scholar] [CrossRef]
  22. Li, G.; Li, S. Physics-based CFD simulation of lithium-ion battery under the FUDS driving cycle. ECS Trans. 2015, 64, 1. [Google Scholar] [CrossRef]
  23. Mei, W.; Chen, H.; Sun, J.; Wang, Q. Numerical study on tab dimension optimization of lithium-ion battery from the thermal safety perspective. Appl. Therm. Eng. 2018, 142, 148–165. [Google Scholar] [CrossRef]
  24. Mei, W.; Chen, H.; Sun, J.; Wang, Q. The effect of electrode design parameters on battery performance and optimization of electrode thickness based on the electrochemical–thermal coupling model. Sustain. Energy Fuels 2019, 3, 148–165. [Google Scholar] [CrossRef]
  25. COMSOL Multiphysics; C.M. Library: Charlotte, NC, USA, 2016.
  26. Dong, T.; Peng, P.; Jiang, F. Numerical modeling and analysis of the thermal behavior of NCM lithium-ion batteries subjected to very high C-rate discharge/charge operations. Int. J. Heat Mass Transf. 2018, 117, 261–272. [Google Scholar] [CrossRef]
  27. Li, J.; Cheng, Y.; Jia, M.; Tang, Y.; Lin, Y.; Zhang, Z.; Liu, Y. An electrochemical–thermal model based on dynamic responses for lithium iron phosphate battery. J. Power Sources 2014, 255, 130–143. [Google Scholar] [CrossRef]
  28. Xu, W.; Hu, P. Numerical study on thermal behavior and a liquid cooling strategy for lithium-ion battery. Int. J. Energy Res. 2020, 44, 7645–7659. [Google Scholar] [CrossRef]
Figure 1. Charge and discharge schematic of lithium-ion battery.
Energies 17 00178 g001
Figure 2. (a) Physical image of the battery; (b) Two-dimensional axisymmetric model and meshing of single cell.
Energies 17 00178 g002
Figure 3. Initial parameters in simulation software.
Energies 17 00178 g003
Figure 4. Experimental test platform.
Energies 17 00178 g004
Figure 5. (a) discharge voltage verification and temperature change at different discharge rates at 0 °C. (b) discharge voltage verification and temperature change at different discharge rates at 25 °C (c) discharge voltage verification and temperature change at different discharge rates at 45 °C.
Energies 17 00178 g005
Figure 6. Heat production curve of single cell ‘charge before discharge’ at different rates.
Energies 17 00178 g006
Figure 7. Comparison of the charge and discharge heat generation of a single battery at different rates.
Energies 17 00178 g007
Figure 8. Heat production ratio of different rates of charge and discharge.
Energies 17 00178 g008
Figure 9. Three-dimensional temperature distribution of single cell at different rates.
Energies 17 00178 g009
Figure 10. Two-dimensional temperature distribution of single cell at different rates.
Energies 17 00178 g010
Figure 11. Heat production curve of single cell ‘charge before discharge’ at different ambient temperatures.
Energies 17 00178 g011
Figure 12. Comparison of charge and discharge heat generation of a single battery at different ambient temperatures.
Energies 17 00178 g012
Figure 13. Different ambient temperature charge and discharge heat production ratios.
Energies 17 00178 g013
Figure 14. Three-dimensional temperature distribution of single cell at different ambient temperatures.
Energies 17 00178 g014
Figure 15. Two-dimensional temperature distribution of single cell at different ambient temperatures.
Energies 17 00178 g015
Table 1. 26,650 NCM ternary battery parameters.
ParameterDomestic Battery
Model26,650 NMC lithium polymer battery
product accumulation size (mm)26 × 65
nominal voltage (V)4.2
practical capacity (Ah)5.2
nominal capacity (Ah)5.0
charge–discharge cut-off voltage (V)4.2/2.75
charge–discharge rate (C)0.5, 1, 2
ambient temperature (°C)0, 25, 45
internal resistance (mΩ)18~22
Table 2. Partial electrochemical parameters of 26,650 ternary lithium-ion battery [23,24,25].
ParameterCathodeDiaphragmAnode
Active   particle   radius ,   r   ( μ m )8.0-1.0
Volume   fraction   of   electrolyte   phase ,   ε l 0.4440.370.35
Solid   volume   fraction   of   electrode ,   ε s 0.384-0.391
Reference reaction rate constant, k c , k a ( m · s 1 ) 5 × 10 13 - 5 × 10 13
Initial   electrolyte   phase   concentration   c l , 0 , ( m o l · m 3 ) 120012001200
Initial   concentration   of   L i +   in   solid   phase   c s , 0 , ( m o l · m 3 ) 18,875-5200
Maximum   L i + concentration   in   the   solid   phase   c s , m a x , ( m o l · m 3 ) 25,507-20,300
Electrode   charge   transfer   coefficient ,   α c , α a 0.5 0.5-0.5 0.5
Solid   phase   conductivity ,   σ s / S · m 1 100-100
Reference   solid   phase   diffusion   coefficient   D s , r e f , ( m 2 · s 1 ) 2 × 10 13 - 1.45 × 10 13
Bruggeman1.51.51.5
Transfer coefficient of lithium-ion0.3630.3630.363
reference temperature, (K)293.15--
Thickness (μm)422530
The surface emissivity of the thermoplastic layer0.65--
Battery spindle radius (mm)1.5--
Surface   convection   thermal   transfer   coefficient   ( W · m 2 · K 1 )5--
Table 3. Physical parameters of ternary 26,650 lithium-ion battery [13,22,23].
ParameterDensity ρ,
kg/m3
Ratio Thermal Cp,
J/(kg·K)
Conductivity kT,
W/(m·K)
Negative electrode material1347.331437.41.04
Negative current collector8933385398
Positive electrode materials15007001
Positive current collector2702903238
Diaphragm1008.981978.160.344
Electrolyte12101578.161.48
Table 4. The main measuring equipment and technical parameters used in the experiment.
Measuring EquipmentManufacturer and Equipment ModelTechnical ParametersUncertainty
Charging and discharging machineXinwei
(CT4008-40V30A-NA)
1. Battery pulse charge and discharge detection
2. Maximum number of cycles detection
Measurement accuracy is
±0.05%
high and low temperature alternating damp heat experimental boxMGDW-408-40The measurement temperature range is −40~150 °CThe temperature deviation is within ±2.0 °C, and the display accuracy is 0.01 C
SH-X multi-channel thermometer The working temperature is in the range of −20~70 °CThe temperature deviation is within ±0.5 °C
Disclaimer/Publisher’s Note: The statements, opinions and data contained in all publications are solely those of the individual author(s) and contributor(s) and not of MDPI and/or the editor(s). MDPI and/or the editor(s) disclaim responsibility for any injury to people or property resulting from any ideas, methods, instructions or products referred to in the content.

