Article

Driving Characteristics Analysis Method Based on Real-World Driving Data

Korea Automotive Technology Institute, Cheonan-si 31214, Republic of Korea
*
Author to whom correspondence should be addressed.
Energies 2024, 17(1), 185; https://doi.org/10.3390/en17010185
Submission received: 10 November 2023 / Revised: 18 December 2023 / Accepted: 25 December 2023 / Published: 28 December 2023

Abstract

:
All vehicles available for sale undergo certification tests mandated by law, and their certified fuel efficiency from these tests is indicated and disclosed. However, to address discrepancies between the certified fuel efficiency and actual driving conditions, more sophisticated certified modes, post-certification systems, and real-world driving tests have been introduced to complement the fuel efficiency certification system. The incorporation of a real-world driving mode, similar to certification modes, in vehicle research and development is of paramount importance from a directional perspective. To achieve this, various methods of configuring real-world driving modes have been proposed and applied in research. However, the validation of the correlation between fuel efficiency in real-world driving modes and certified driving modes is relatively limited. This study aimed to construct real-road driving cycles that are similar to the federal test procedure (FTP-75) and highway fuel economy test (HWFET) certification modes to determine the differences between the driving characteristics of the certification modes and real-road driving. The present study employed the commonly used relative positive acceleration analysis method along with a segmented short-trip technique for analysis. Additionally, variables such as fuel consumption and driving time were utilized to diversify our analytical methods. Test Routes A and B were configured for comparison with the fuel efficiency certification mode. An analysis of the relative positive acceleration (RPA) in both the test routes and certification mode confirmed that Test Route B, reflecting the actual driving patterns, closely follows the RPA distribution of the certification mode. Additionally, the fuel consumption for each short trip on each route was graphically represented, addressing aspects where determining the driving characteristics based solely on the RPA, such as the road grade, was difficult.

1. Introduction

Global interest in the reduction of greenhouse gases and emissions has continued to increase, together with the trend toward improved fuel efficiency and meeting environmental regulations [1]. Car manufacturers worldwide are actively conducting research on various technologies to meet these evolving regulations [2]. In the United States, the Corporate Average Fuel Economy (CAFE) policy has been in place since the 1970s as a key environmental protection measure to regulate fuel consumption and carbon emissions. Europe and South Korea have adopted similar policies to improve fuel efficiency and regulate CO2 emissions, imposing fines for non-compliance.
The certification modes used to measure fuel efficiency differ in each country. In South Korea, gasoline passenger vehicles use the same fuel efficiency certification modes as the United States, namely the federal test procedure (FTP-75) and highway fuel economy test (HWFET). In particular, since 1989, efforts to improve the fuel efficiency of automobiles in South Korea have continued to increase. To reduce the disparity between the displayed fuel efficiency of vehicles and the perceived fuel efficiency by drivers, a correction formula applying the same 5-cycle test method used in the United States has been implemented in the automotive energy consumption efficiency measurement method since 2012 [3]. The 5-cycle correction formula adjusts urban driving energy consumption efficiency and highway driving energy consumption efficiency such that they are similar to the energy consumption efficiency measured in the FTP-75 (city driving), HWFET (highway driving), US06 (aggressive driving with rapid acceleration and deceleration), SC03 (air conditioning operation), and Cold FTP-75 (cold city driving) modes. These five test methods verify and calibrate the energy consumption efficiency to be comparable to the energy consumption efficiency measured in the FTP-75 and HWFET modes. The official fuel efficiency measurement for vehicles utilizes a corresponding correction formula to incorporate all situations in which the vehicle operates, aiming to enhance the accuracy and reliability of fuel efficiency measurements [4].
Certification modes running on chassis dynamometers should reflect the driving characteristics of real roads, such as those used for urban and highway driving, to ensure an accurate representation of each driving scenario [5]. However, certification modes struggle to fully capture the driving characteristics of vehicles on real roads owing to factors such as traffic conditions and individual driving habits [6,7,8,9]. Degraeuwe and Weiss [10] confirmed that the emissions during real-world driving are higher than those obtained in the certification cycle for various vehicles using a portable emission measurement system (PEMS). There are significant differences in the fuel consumption and pollutant emissions in a driving cycle, such as the New European Driving Cycle (NEDC), compared with those of actual driving cycles. Duarte et al. [11] reported a difference of 12–30% in fuel consumption compared with that of certification standards.
Various techniques have been proposed to establish real-world driving modes that closely resemble certification modes. In particular, the relative positive acceleration (RPA) analysis method, which reflects the vehicle’s load conditions, is mostly used to ensure alignment with the driving characteristics of certification modes [12,13,14]. Lee et al. [15] investigated the impact of RPA on carbon dioxide emissions and fuel consumption, and reported a linear increase in both emissions and fuel consumption with an increase in RPA. Gallus et al. [16] used RPA as a parameter to characterize and quantify driving styles in on-road emission measurement tests using a PEMS. Dhital et al. [17] constructed normal and aggressive driving modes to evaluate the effect of driving behavior on actual exhaust gas emissions using RPA to quantitatively distinguish driving behaviors. However, RPA, including key parameters such as speed, acceleration, driving distance, and other important factors related to vehicle driving, may have the disadvantage of not fully reflecting the impact of various vehicle parameters in driving data analysis.
This study aimed to analyze the differences between the driving characteristics of certification modes and real-road driving. The analysis was performed by segmenting the total driving process into multiple trips [18] and considering variables such as fuel consumption and driving time to enhance the commonly used RPA analysis method. It was assumed that the gasoline vehicle used in the test was equipped with a direct injection fuel supply system, demonstrating fuel consumption proportional to the accelerator pedal input in response to load changes. Conditions with higher fuel consumption per unit time were considered to have a greater driving load, and this was reflected in the analysis of the driving results.

2. Experimental Setup

2.1. Test Vehicle

The vehicle used in the test is a large SUV that runs on gasoline, equipped with a 3.8 L, 6-cylinder, direct injection, naturally aspirated engine. The vehicle’s maximum torque and power output are 355 N·m (@ 5200 rpm) and 217 kW (@ 6000 rpm), respectively. The vehicle features a 2WD front-wheel-drive system and has a combined fuel efficiency of approximately 9.3 km/L. The specifications of the test vehicle are presented in Table 1.

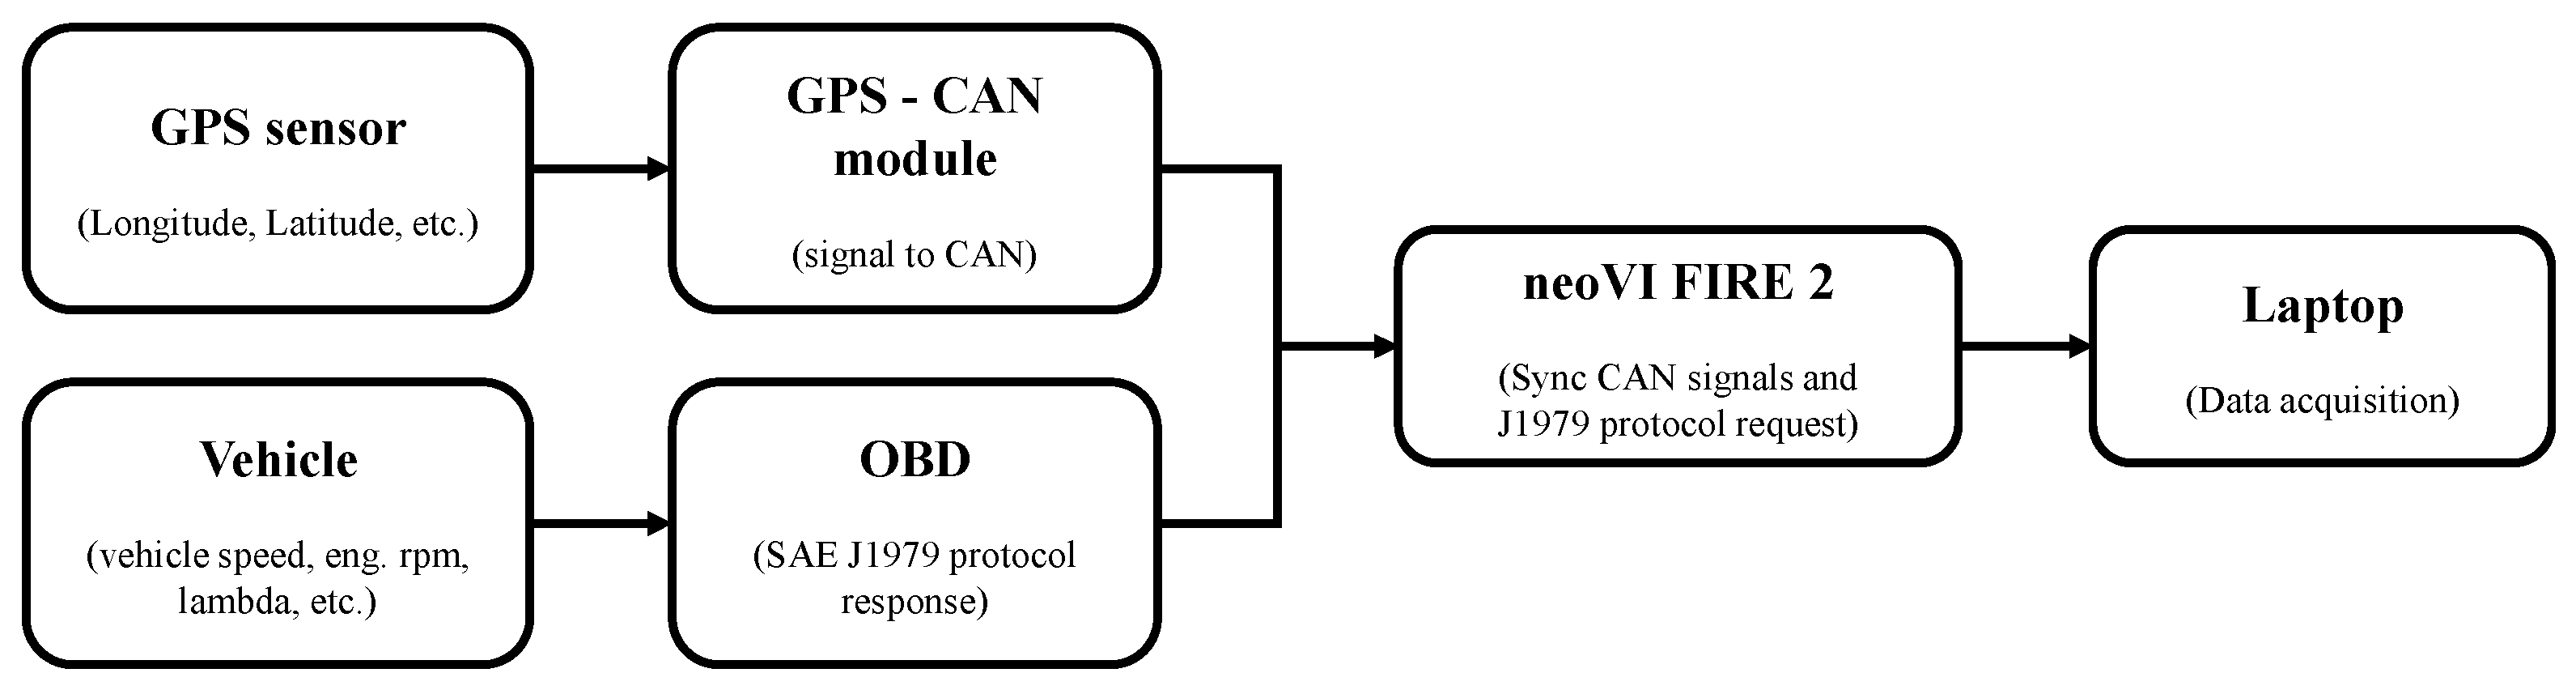
2.2. Data Acquisition System

Figure 1 illustrates a schematic diagram of the data acquisition system used for collecting vehicle driving data. Because the speed data from the vehicle differ from the actual driving speed, an additional GPS device was installed to capture the real speed data. Despite the inaccuracy of the speed data from the vehicle, the advantage lies in its origin from the vehicle itself, allowing for stable acquisition of speed data even in areas with unstable GPS signals. GPS data, such as longitude and latitude measured using the additional GPS device, were used only when the number of satellites was eight or more. The GPS data were converted to CAN signals through a conversion module and merged with the vehicle’s CAN data obtained from the on-board diagnostics (OBD). The combined GPS and OBD data were connected to Intrepid Control Systems’ neoVI FIRE 2 and monitored and stored using the Vehicle Spy program. Power for the neoVI FIRE 2 module and measurement equipment was supplied from the vehicle’s constant power source, and an extra lithium-ion battery pack was included for the data acquisition laptop and emergency situations. The Vehicle Spy 3 Professional software, which is based on the SAE standard J1979 protocol, captures vehicle driving information and engine operating characteristics. The data rate of the measured driving information and GPS data is synchronized at 1 Hz for simultaneous monitoring and storage.

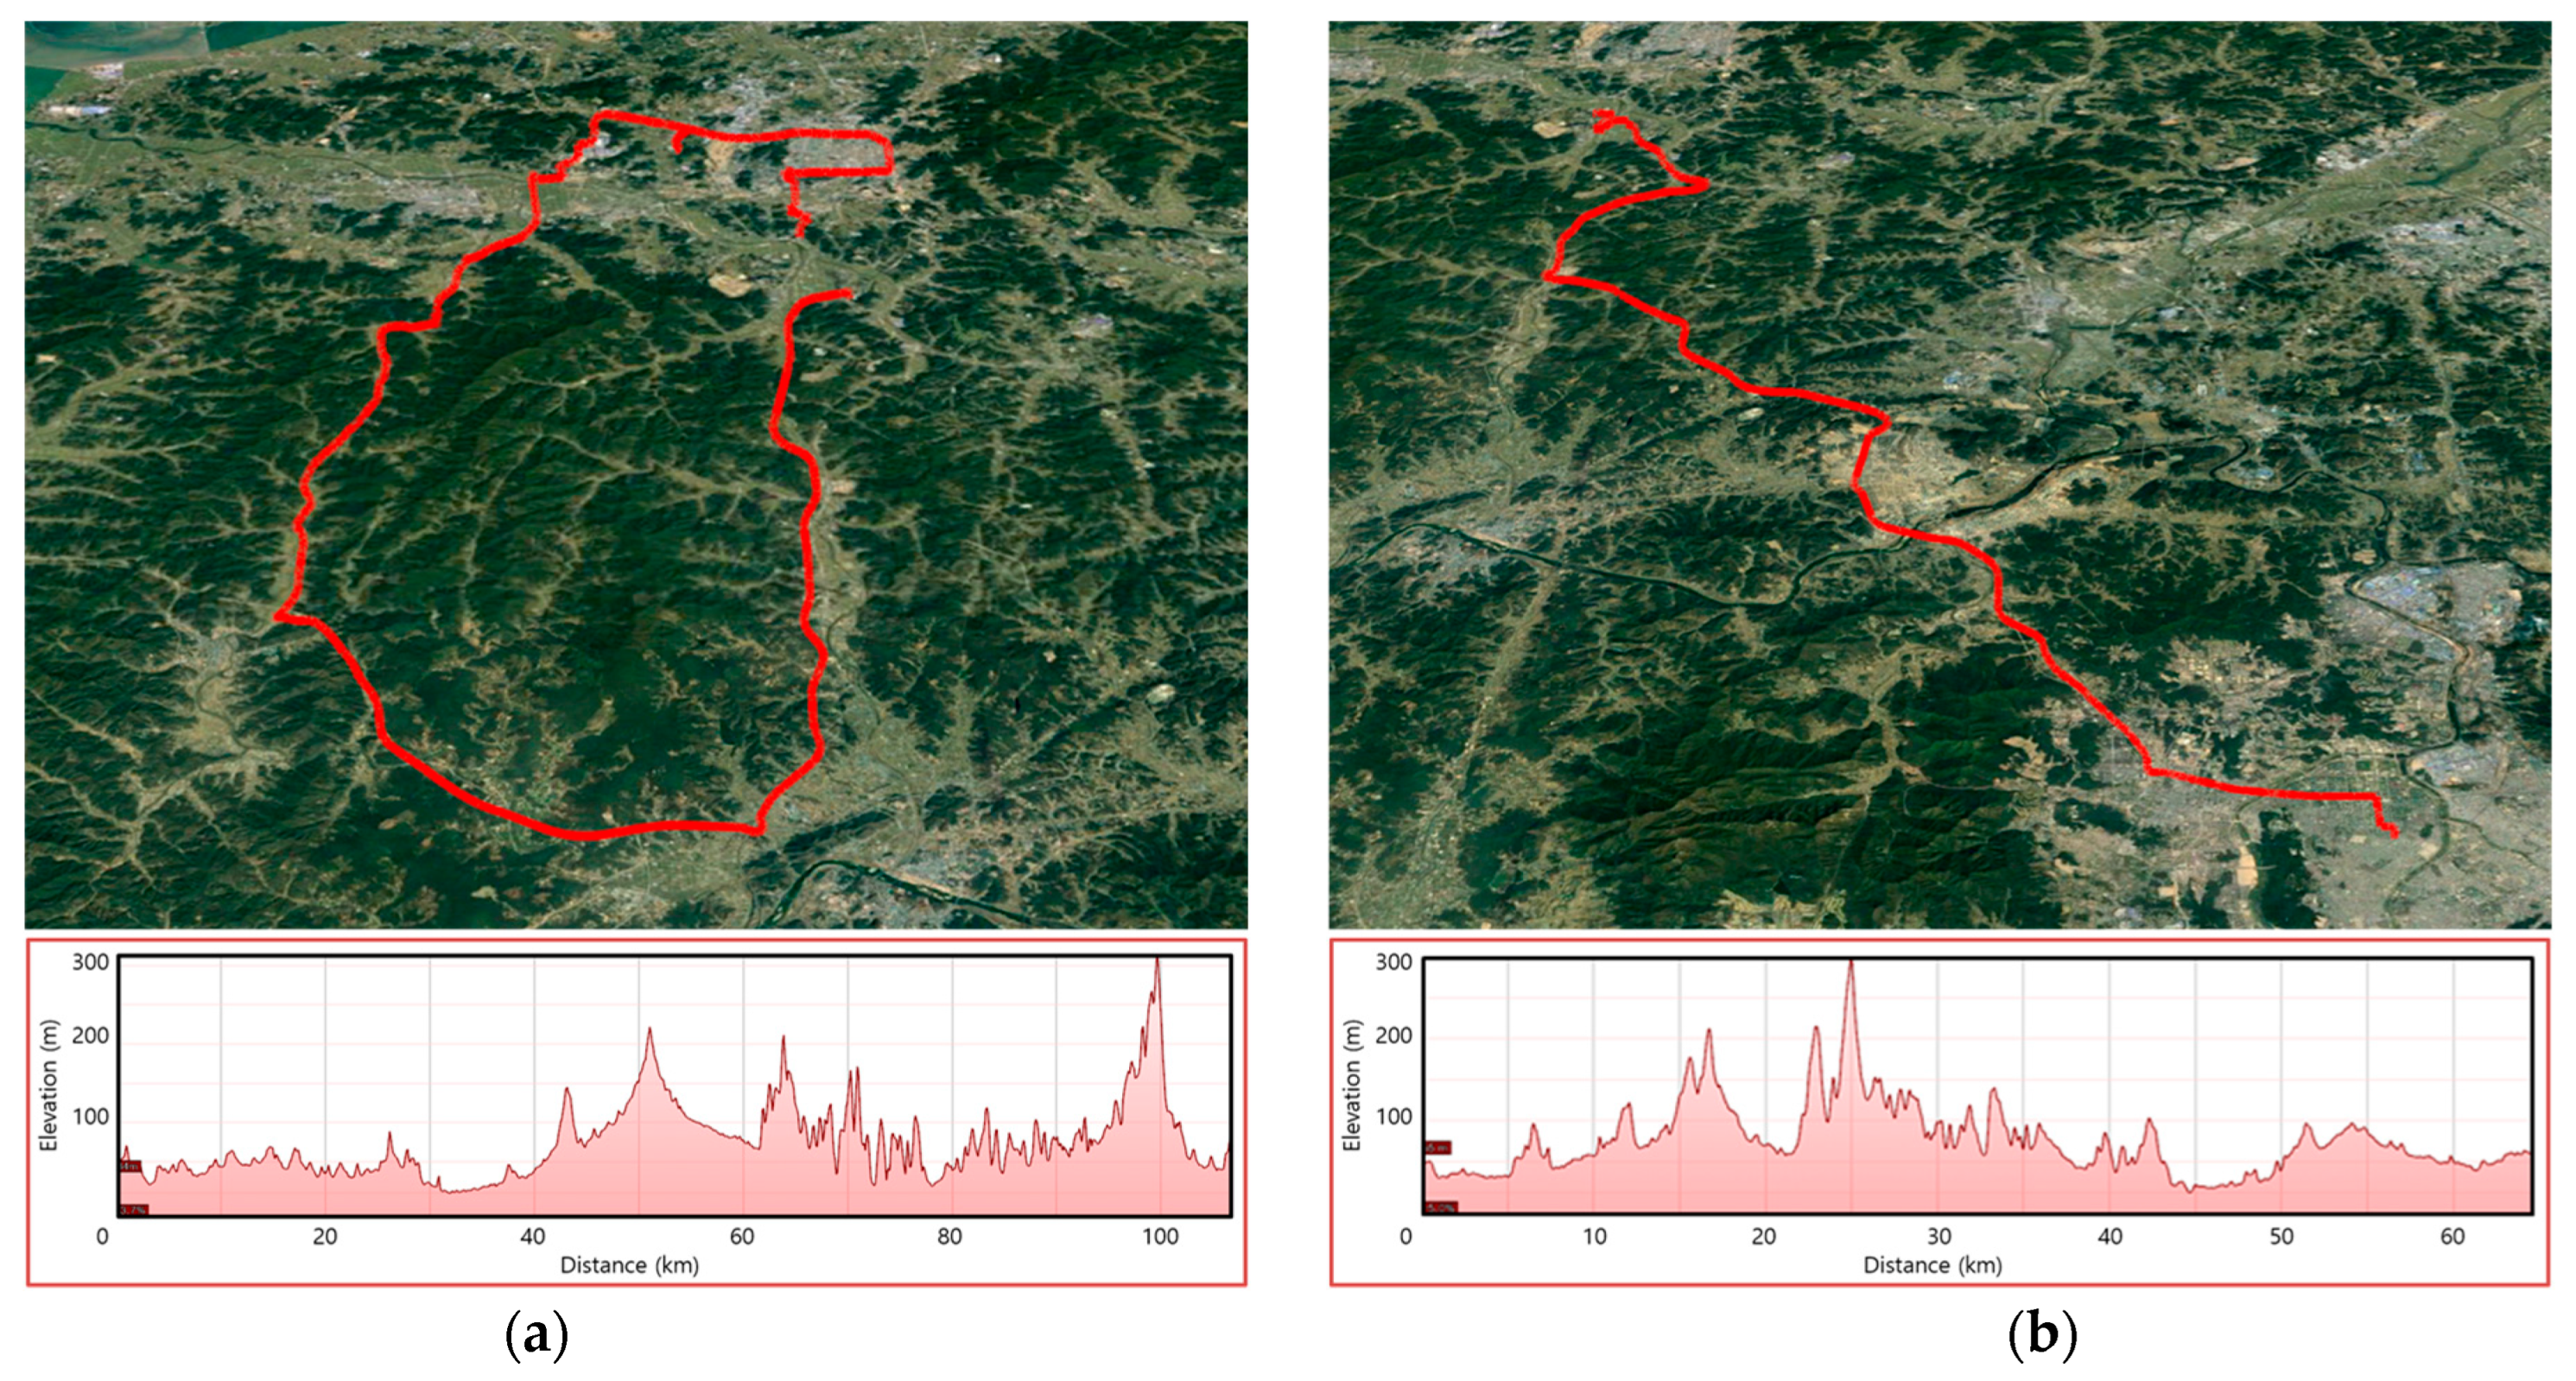
2.3. Real-Road Driving Routes

Real-road driving test routes are divided into urban, rural, and highway sections. Each section is distinguished by the vehicle’s driving speed: urban areas are up to 60 km/h, rural areas are between 60 km/h and 90 km/h, and highways exceed 90 km/h. The entire real-road driving test route is composed of 34%, 33%, and 33% urban, rural, and highway sections, respectively, with a ±10% margin of error. Each section must be driven for a minimum of 16 km, and speeds below 1 km/h are defined as stationary. The real-road driving conditions are summarized in Table 2. The driving information for each section was acquired and used to analyze the driving characteristics. The driving routes that meet these regulations are designed to measure emissions and fuel consumption during actual driving.
This study aimed to examine the differences between real-road regulations and driving characteristics analyzed through the FTP-75 and HWFET modes, which are used for fuel efficiency measurements on a dynamometer and adapted for real-road conditions. Additionally, the analysis was divided into Test Routes A and B to examine the differences in certification modes through real-road driving data analysis. Both test routes commonly integrate urban, rural, and highway driving sections.
Test Route A is one of the driving routes for measuring real-world driving vehicle emissions, which complies with the regulation of real driving emissions (RDE). The route starts from the urban section and ends in the highway section, and sequentially drives through these sections; the proportion of urban, rural, and highway sections are evenly distributed with an error within 5% of the total distance. Meanwhile, Test Route B represents a more realistic driving environment compared with Test Route A. Although Test Route A is evenly distributed between urban, rural, and highway, its driving pattern deviates from the real-world driving pattern. Thus, Test Route B is configured to reflect a more common driving environment. The paths for each driving route are illustrated in Figure 2. The altitude data of the test routes are also illustrated in Figure 2 in the range of 20–300 m for both test routes. The test routes were driven between Cheonan and Daejeon City, South Korea, and were driven in early spring with an ambient temperature in the range of approximately 5–12 °C.
The FTP-75 mode mimics urban driving in the United States and comprises four phases: cold start, stabilization, soaking, and hot start. The HWFET mode is used for high-speed fuel efficiency tests and evaluates fuel efficiency during highway driving. The speed distributions for the FTP-75 and HWFET modes are shown in Figure 3 and Figure 4, respectively. Because the combined fuel efficiency evaluation for domestic vehicles uses the fuel efficiency from both the FTP-75 and HWFET modes, we combined the two modes into a single mode for convenience. The driving characteristics were analyzed for the FTP-75 and HWFET modes, as well as for a subset of FTP-75 known as the UDDS mode, and for a mode combining both FTP-75 and HWFET.

3. Analytical Methods

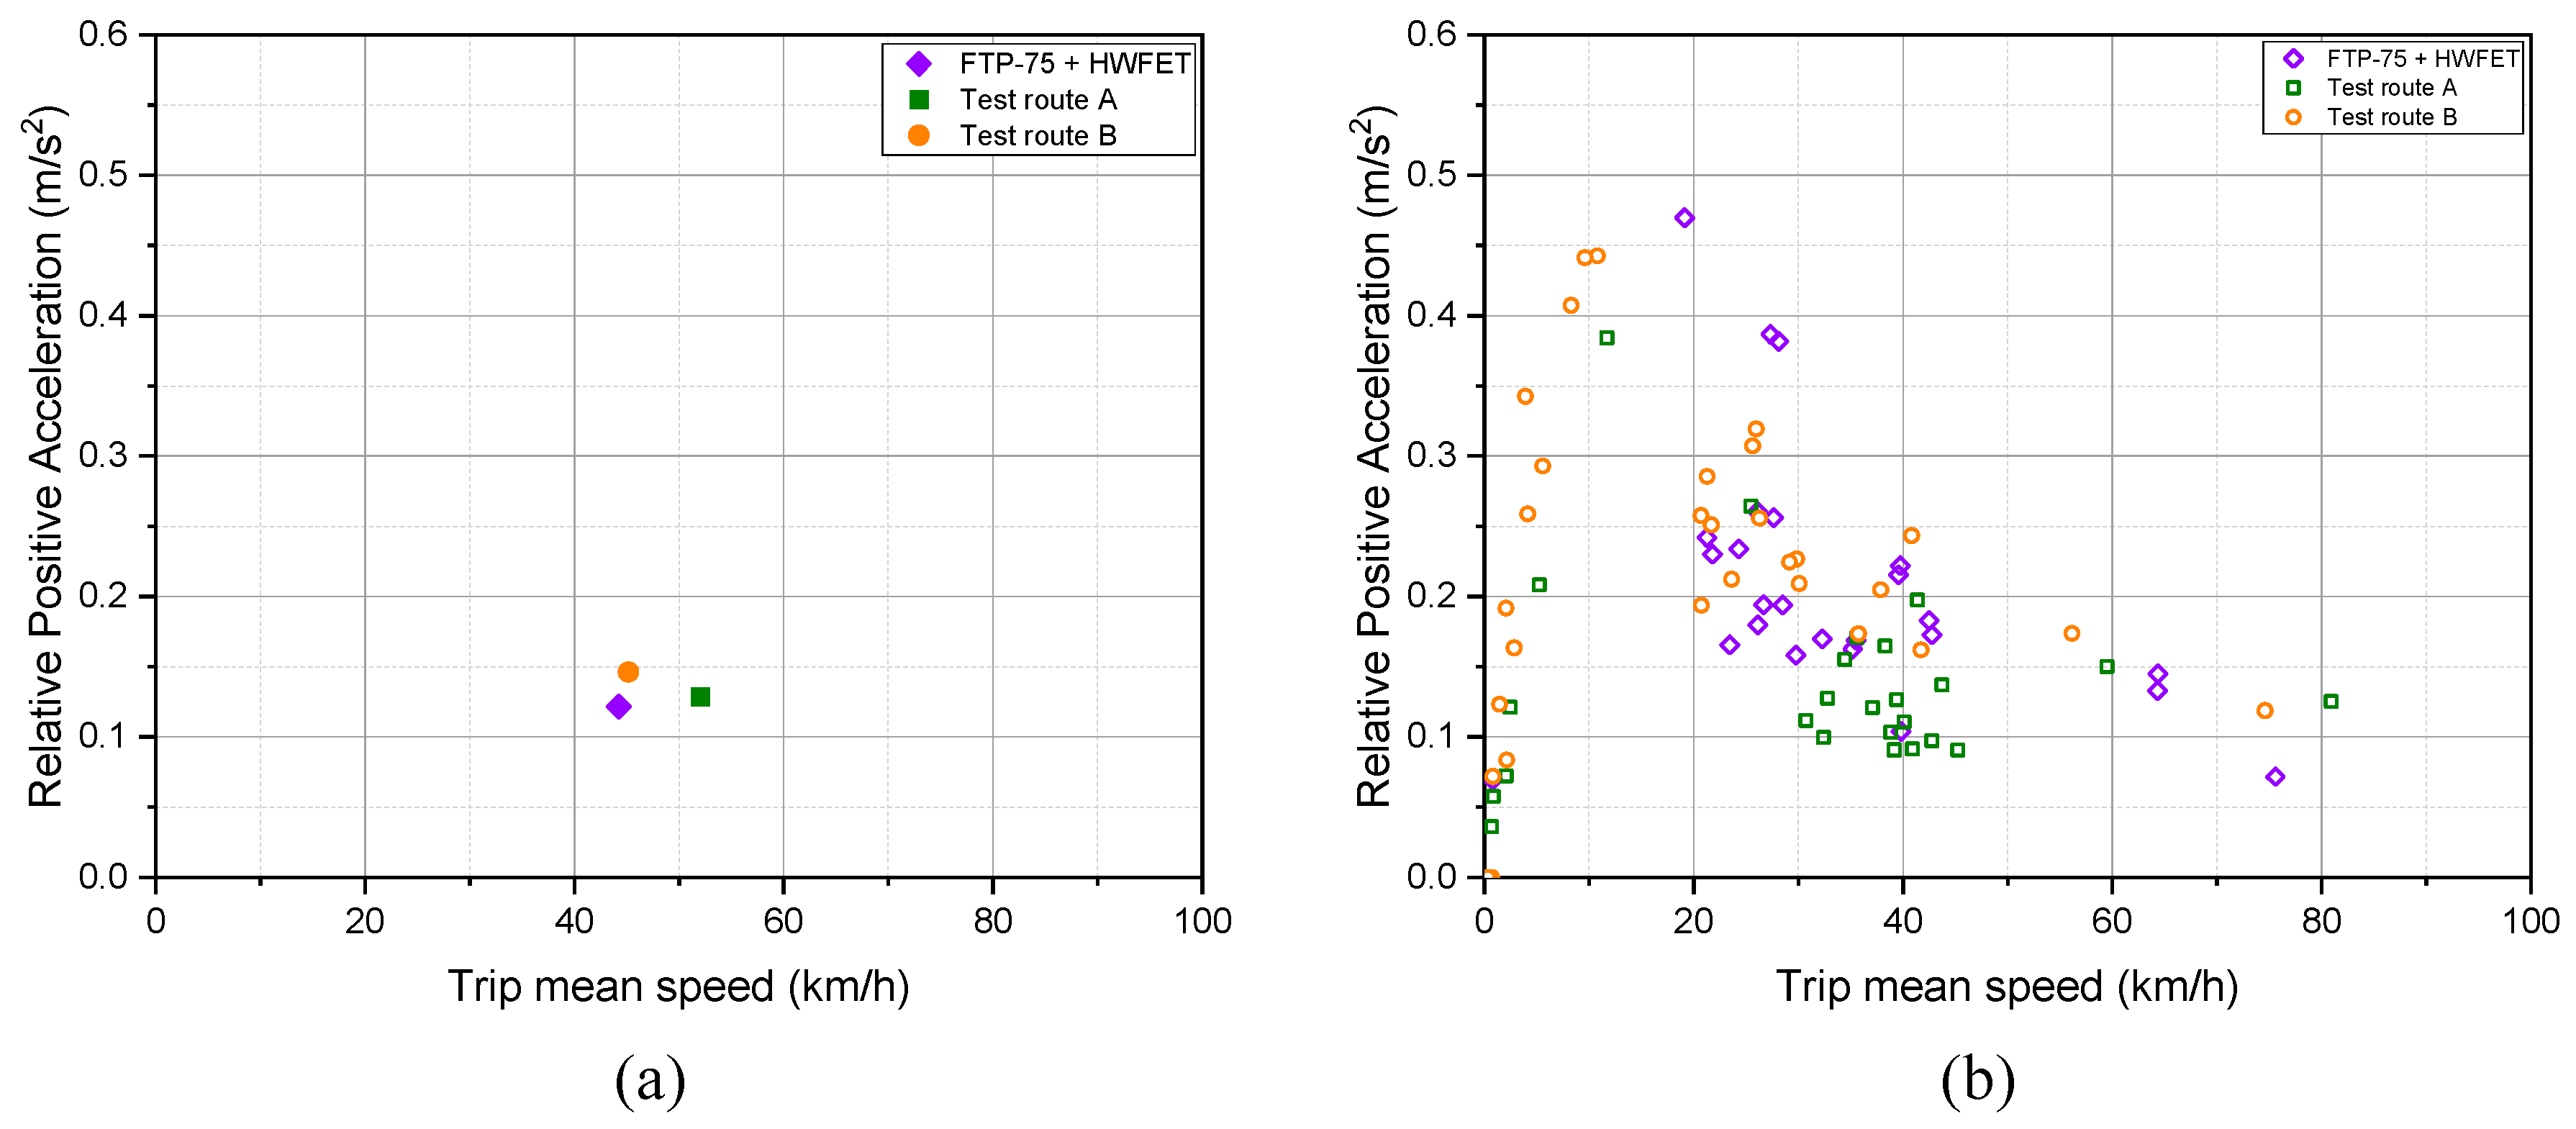
3.1. Relative Positive Acceleration

RPA is a metric commonly used to analyze driving characteristics. It is a useful metric for quantitatively differentiating driving behaviors by representing the overall dynamics of the trip. It is expressed as the sum of the products of speed and acceleration, when acceleration is positive, divided by the total driving distance, as given in Equation (1).
R P A = 1 s i = 1 n a i v i 3.6 t   ( a i > 0 )       0       ( a i 0 ) ,
where vi is the vehicle speed at time step i (km/h), ai is the acceleration at time step i (m/s2), s is the distance traveled in a trip (m), Δt is the time increment (s), and n is the time duration in a trip (s).

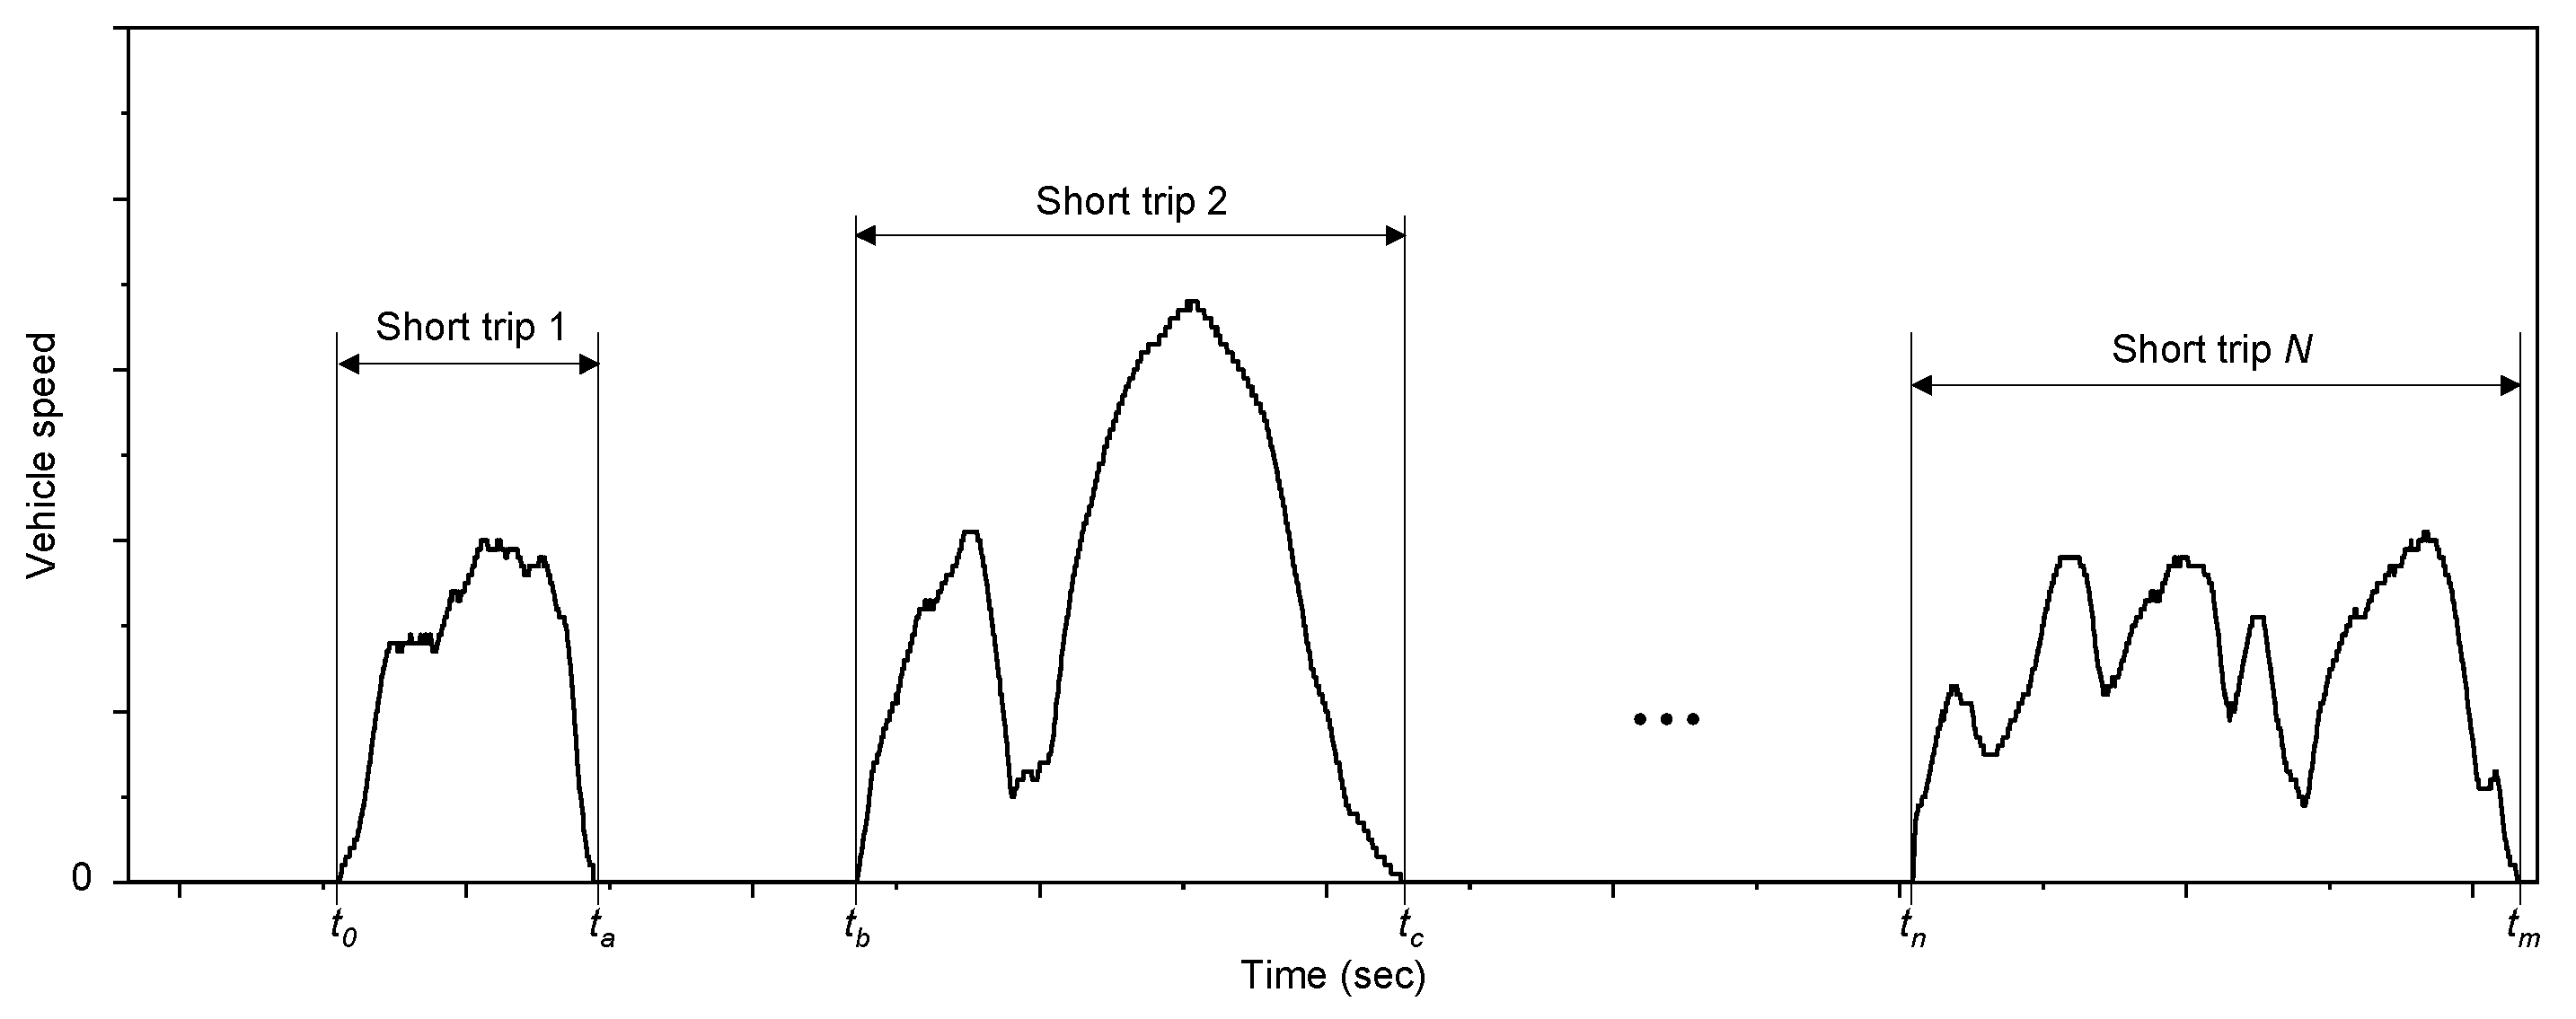
3.2. Short-Trip Analysis

To analyze the characteristics of the driving route, we divided the overall driving data into short trips for detailed analysis. A short trip starts when the vehicle speed initially exceeds 0 km/h (t = t0, v0 > 0) and ends when it returns to 0 km/h (t = tm, vm = 0), as shown in Figure 5.
This subdivision was implemented to better understand the driving characteristics and achieve higher confidence. The use of short trips allows for a more accurate analysis of driving characteristics by excluding the time spent stationary, and the distribution of each trip can be examined to form a more organically structured driving route.
Although short-trip analysis was applied to construct real-road driving modes that can mimic fuel efficiency certification modes, this approach has a drawback. Factors such as differences in fuel consumption, driving duration, and fuel consumption per unit time can coalesce into a single point, making it impossible to distinguish driving characteristics. Therefore, this study used the RPA values from short-trip analysis and incorporated factors that correlate with vehicle load, such as fuel consumption and driving duration. We proposed a method that ensures that real-road driving characteristics reflect fuel efficiency certification modes more realistically. Prior to analyzing real-road driving characteristics, we conducted tests for each certification mode using a chassis dynamometer. The results of the certification mode tests were used in comparing driving characteristics with real-road driving data. The driving characteristics of each route were calculated and analyzed using MatLab (R2023) software.

4. Result and Discussion

The proportions of urban, rural, and highway sections in each driving mode, including FTP-75 and the test routes, are illustrated in Figure 6. The FTP-75 mode, which is intended primarily for urban driving, consists only of urban and rural sections, whereas the HWFET mode is primarily made up of rural and highway sections. The combined FTP-75 + HWFET mode is composed of approximately 39.6% urban, 52.4% rural, and 8% highway sections. Test Route A complies with real-road driving regulations and is designed to have minimal variance between its sections: 37.2% urban, 35.3% rural, and 27.5% highway. Test Route B is structured to reduce the proportion of the highway section to 19.2% and increase that of the rural section to 52.4%, with the urban section having a proportion of 28.4%. The proportions and driving distances for each section of Test Routes A and B are summarized in Table 3.
Moreover, the proportions of urban, rural, and highway sections for each driving route (based on driving time) are illustrated in Figure 7. The figure shows proportions considering only the driving time, excluding stop times in urban sections. In contrast to the even distribution of section proportions based on distance, the distribution based on driving time is dominated by the urban sections. If stop time was included, the time spent on urban driving would likely increase further. Excluding congested traffic conditions such as rush hour traffic, typical urban driving speeds range from 30 km/h to 50 km/h.
Figure 8 illustrates the proportions of acceleration, deceleration, cruising, and stopping sections for each driving route. Acceleration is calculated using Equation (2), with the baseline acceleration set to at = 0.1389 m/s2. If an > at, the section is considered an acceleration section; if an < −at, it is a deceleration section; if −at < an < at, it is a cruising section; and if an < at, it is a stopping section.
a n = v n 1 v n + 1 t
In mode driving, acceleration is lower and the proportion of cruising is higher, whereas in the driving tests, the proportion of cruising sections is lower, and the proportions of acceleration and deceleration are higher. This reflects the difference between the controlled test modes on a chassis dynamometer and real-road driving characteristics, indicating that in the latter case, there are fewer sections where a constant speed can be maintained owing to varying traffic conditions. After repeatedly driving the test routes, slight differences were found in the trip share proportions for each driving test. The results from both the certification modes and real-road driving, including the test routes, were analyzed.
RPA is used to analyze road driving characteristics. The distribution of RPA values for each driving route, both for overall routes and short trips, is illustrated in Figure 9. As shown in Figure 9a, the RPA values for Test Routes A and B were calculated as 0.128 m/s2 and 0.129 m/s2, respectively. These are similar to the RPA value of 0.122 m/s2 for the combined FTP-75 + HWFET mode. However, as presented in Figure 9b, in the short-trip analysis, the driving characteristics of each route differ. Each point in Figure 9b represents the short-trip analyzed data point of the FTP-75 + HWFET mode and both test routes. By using the previously explained short-trip analysis method, the FTP-75 + HWFET mode, Test Route A, and Test Route B were divided into 25, 27, and 30 short trips, respectively. The RPA was calculated for each short trip; the RPA distribution of Test Route A shows a concentration of values smaller than 0.2 m/s2 within the speed range of 30–50 km/h. In the ranges exceeding 60 km/h, the RPA values are higher than those of the FTP-75 + HWFET mode. Test Route A has few driving instances in the 10–30 km/h range and can be considered to have a higher proportion of driving in the low–medium speed range of 30–50 km/h. Although the maximum RPA in the 20–30 km/h range in Test Route B is slightly lower than that in the FTP-75 + HWFET mode, the overall trend is similar. This suggests that the driving characteristics of Test Route B accurately reflect the acceleration characteristics of the FTP-75 + HWFET mode.
Figure 10, Figure 11 and Figure 12 show the fuel consumption, trip duration, and fuel consumption per unit time at individual short-trip points for both the FTP-75 + HWFET mode and test routes. Figure 10 shows that fuel consumption varies at each point, unlike the graph showing only the RPA for short trips. Moreover, fuel consumption does not always proportionally correlate with RPA values, which indicates driving harshness. Even if points have similar RPA values, fuel consumption can vary, suggesting that relying solely on RPA values for determining driving characteristics is insufficient. This is more clearly demonstrated in Figure 11 and Figure 12. Figure 11, which is a graph of short-trip driving times, shows that high-speed driving over 60 km/h can have similar RPA values but varying driving distances and times. This implies that points with identical driving characteristics are difficult to identify when evaluating real-road driving routes. Figure 12 illustrates the amount of fuel consumed per unit time during each short trip, calculated by dividing the fuel consumption by the driving time. Because the fuel consumption differences between the points are not large, fuel consumption tends to inversely correlate with driving time. This is particularly evident in the 20–35 km/h range shown in Figure 11, where it is difficult to discern the differences owing to short driving times. In this range, the differences between the points become more clearly visible.

5. Conclusions

This study aimed to establish an analytical method that complements existing RPA analysis by constructing real-road driving routes that simulate the driving characteristics of the FTP-75 and HWFET modes used for fuel efficiency certification. An analysis of trip share distribution on the driving routes was performed and additional analyses of fuel consumption and driving time were performed after examining whole-trip and short-trip RPAs.
(1)
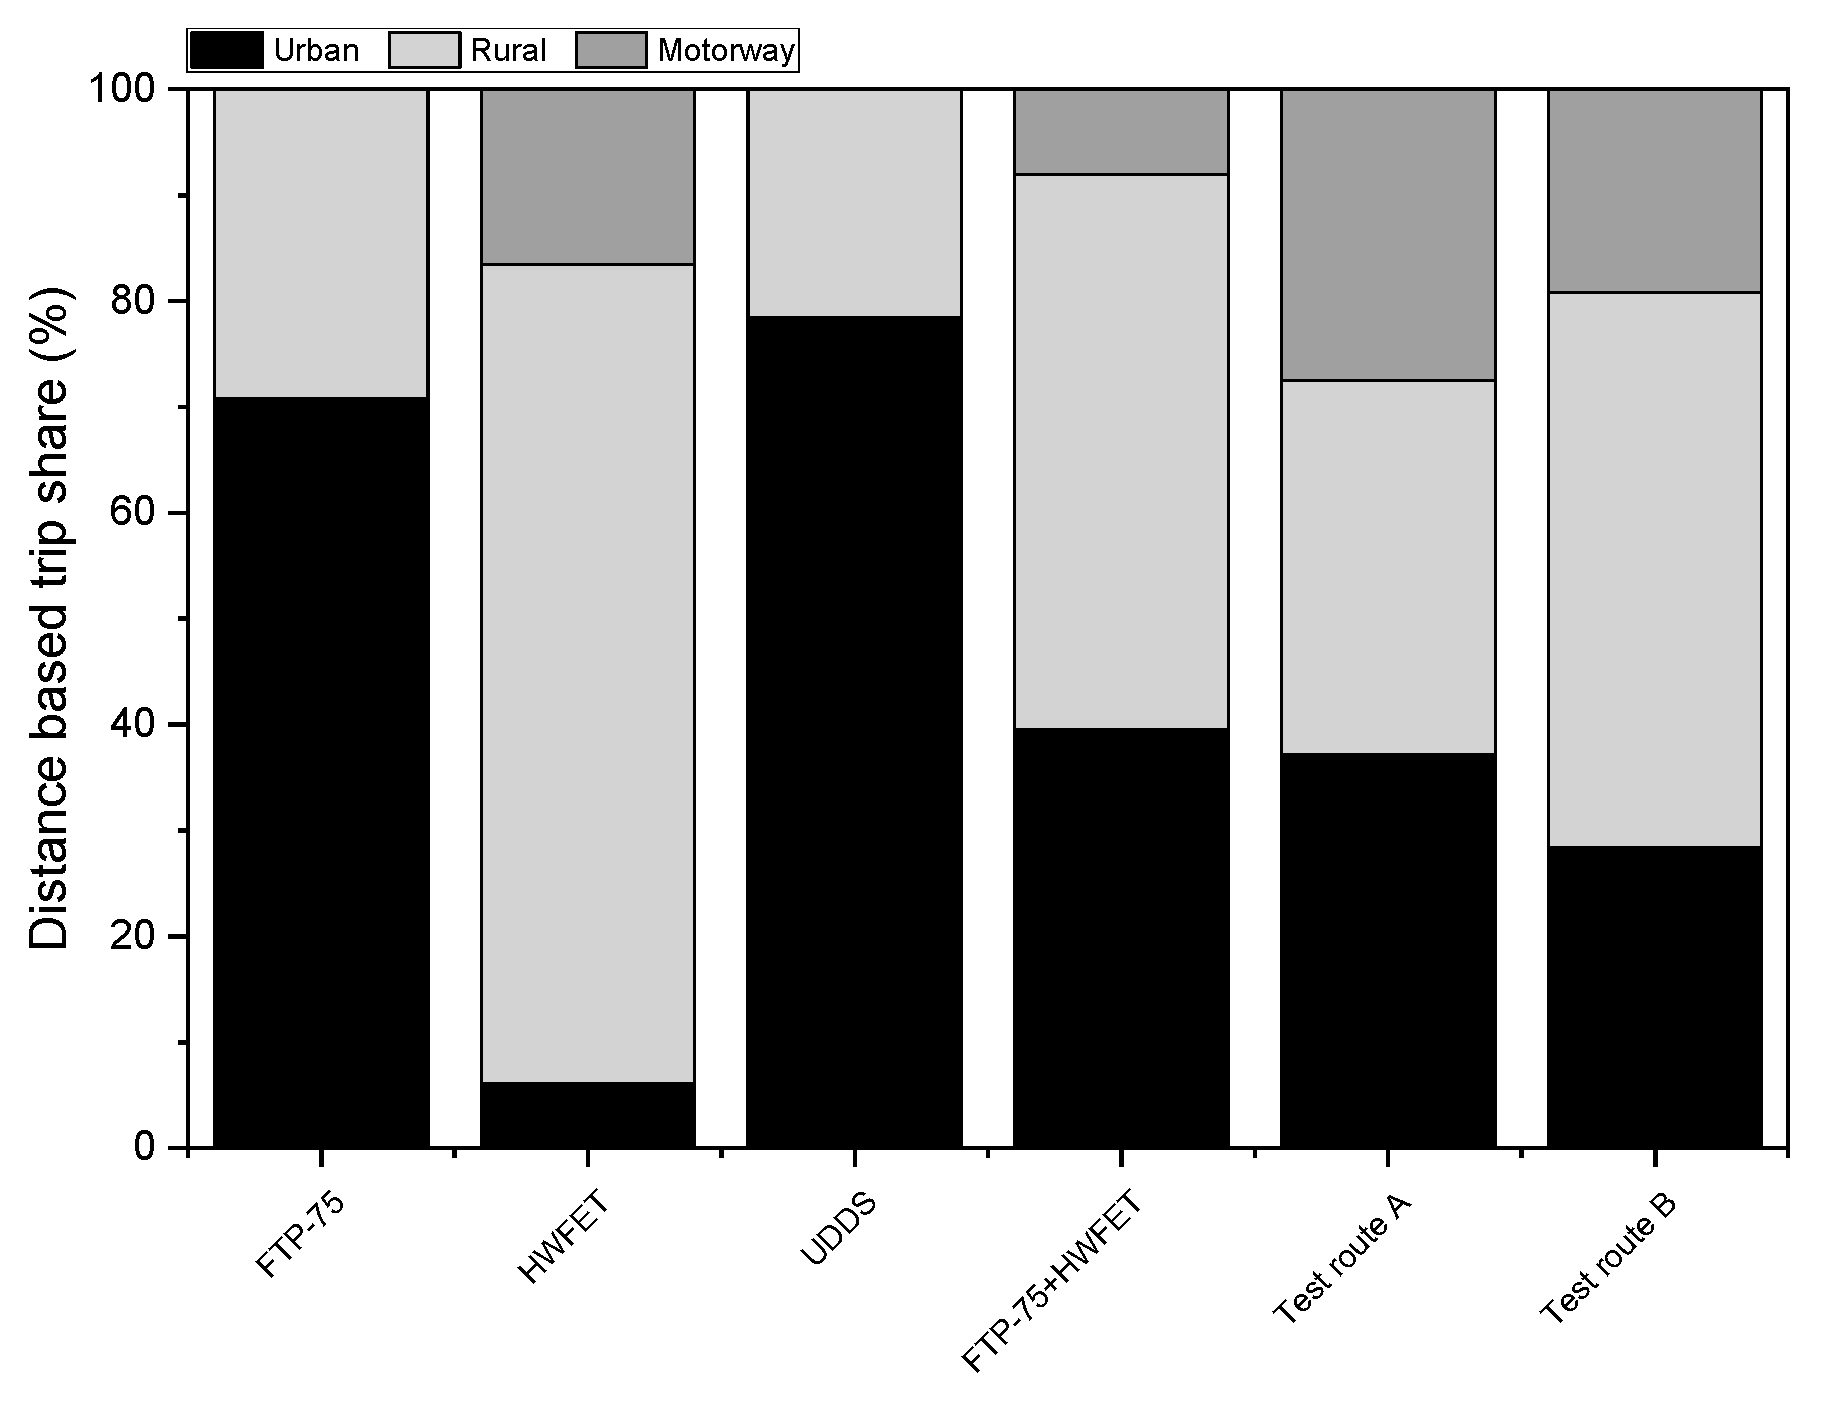
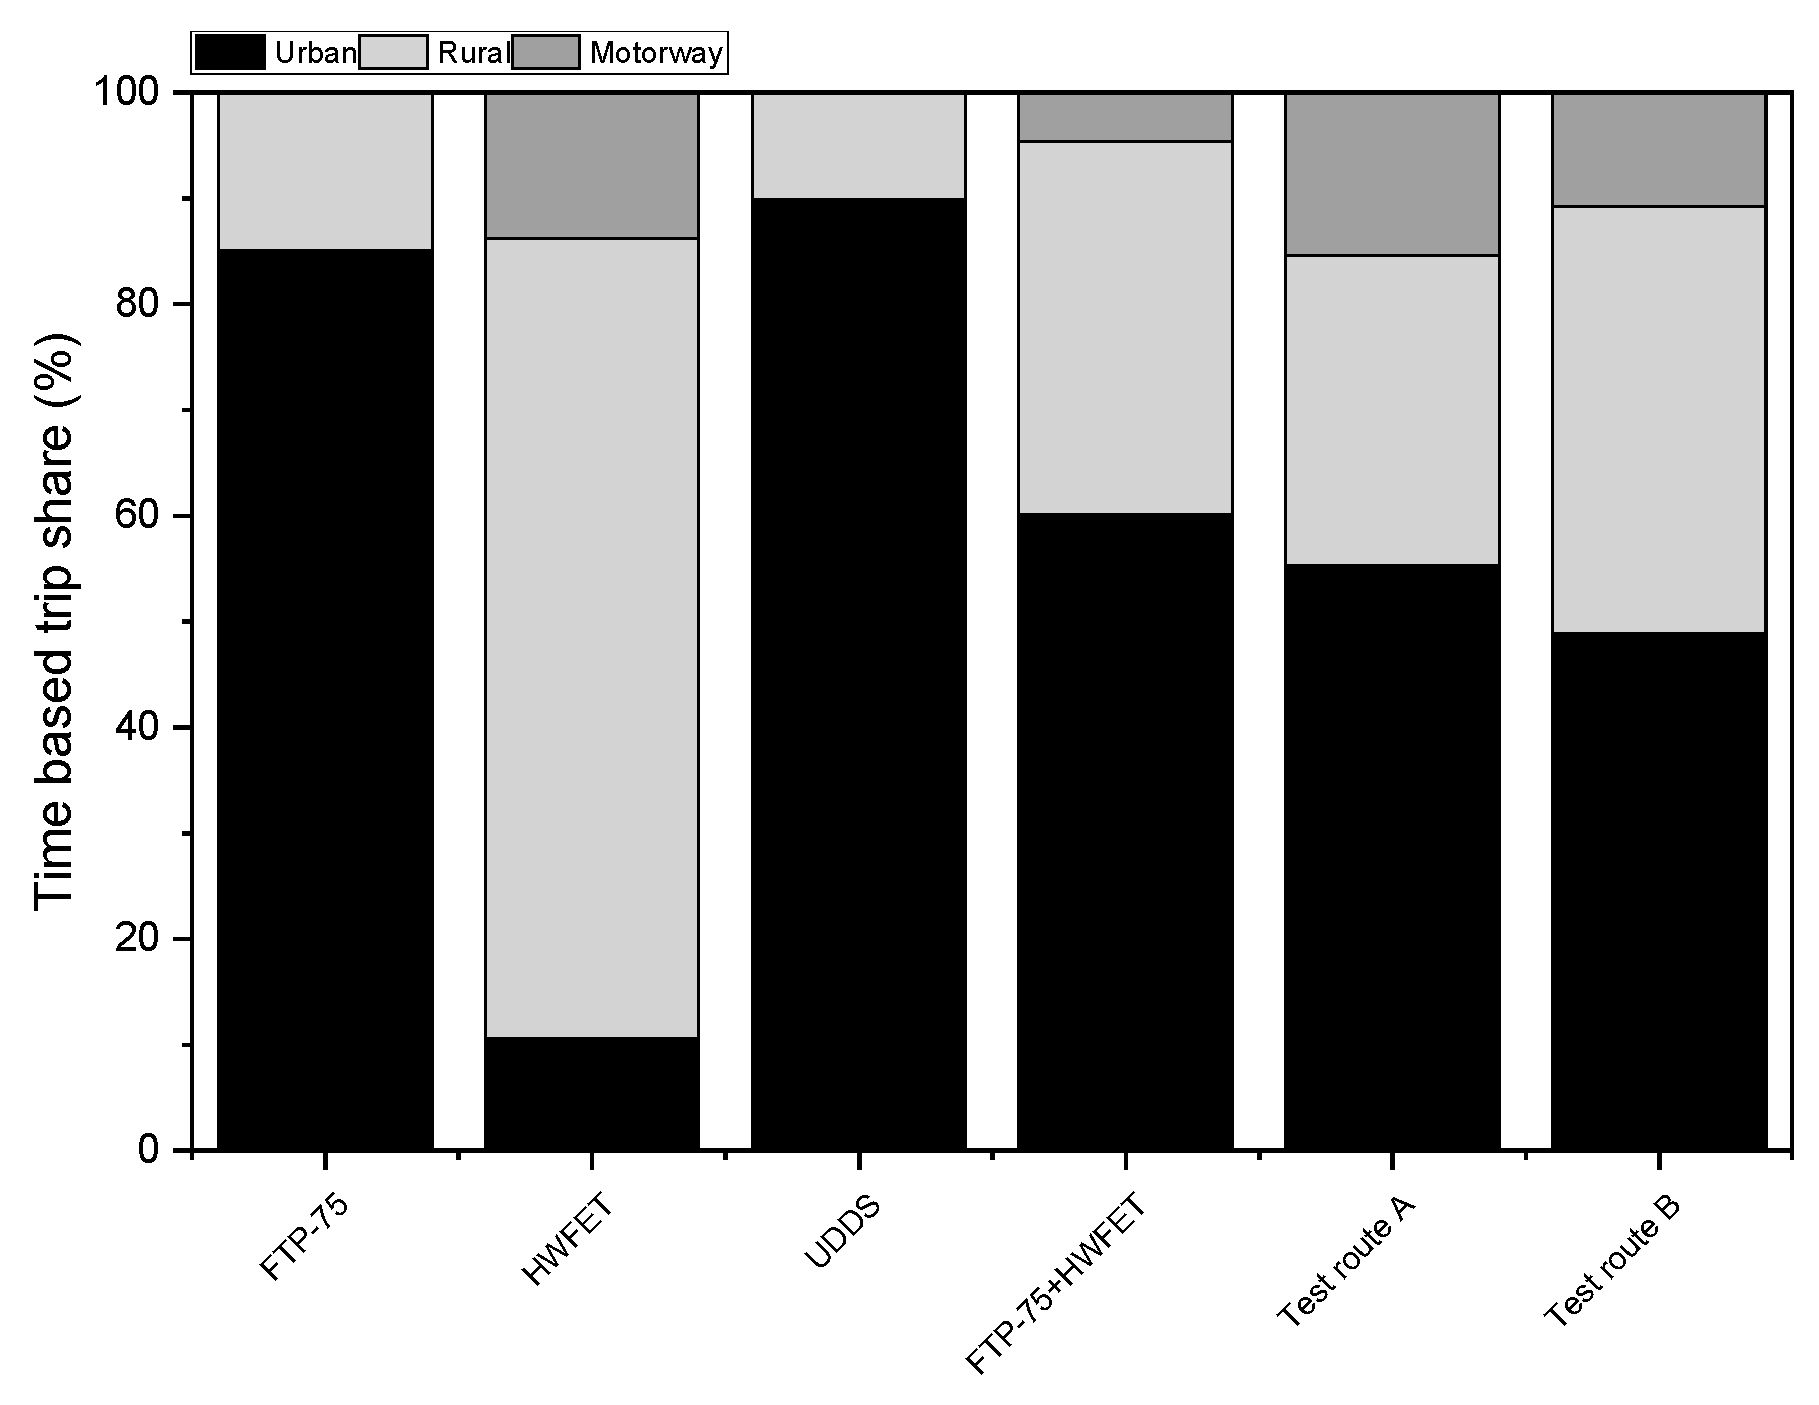
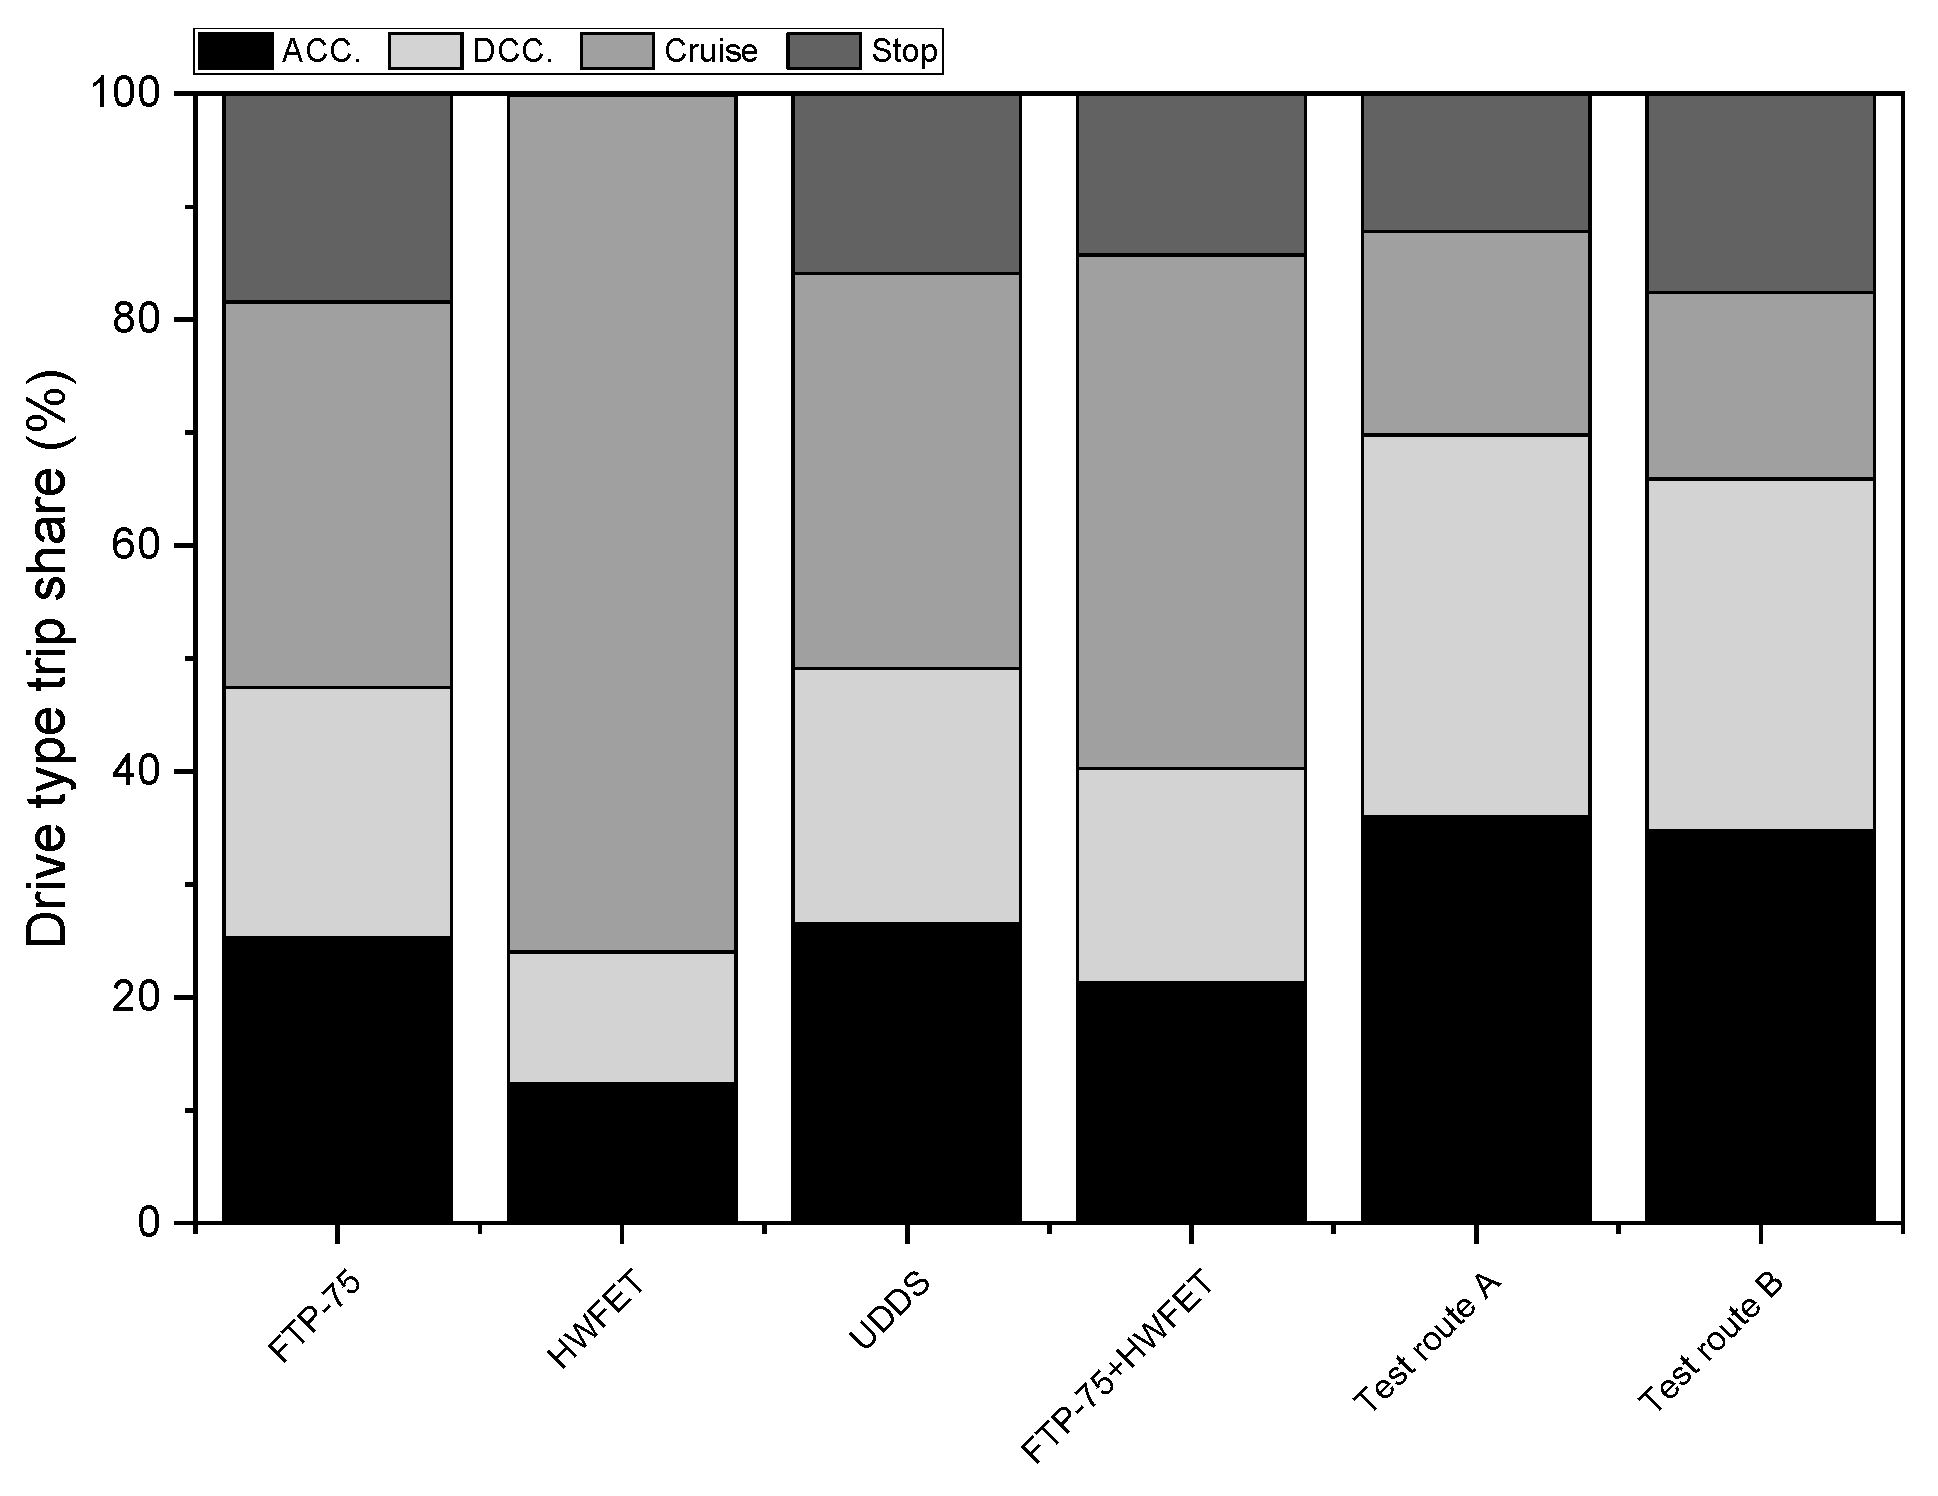
Because of the traffic flow characteristics of real roads, the proportion of low-speed sections in the driving routes was small. Moreover, the measured acceleration characteristics were high, indicating a divergence from the driving characteristics of the FTP-75 + HWFET mode.
(2)
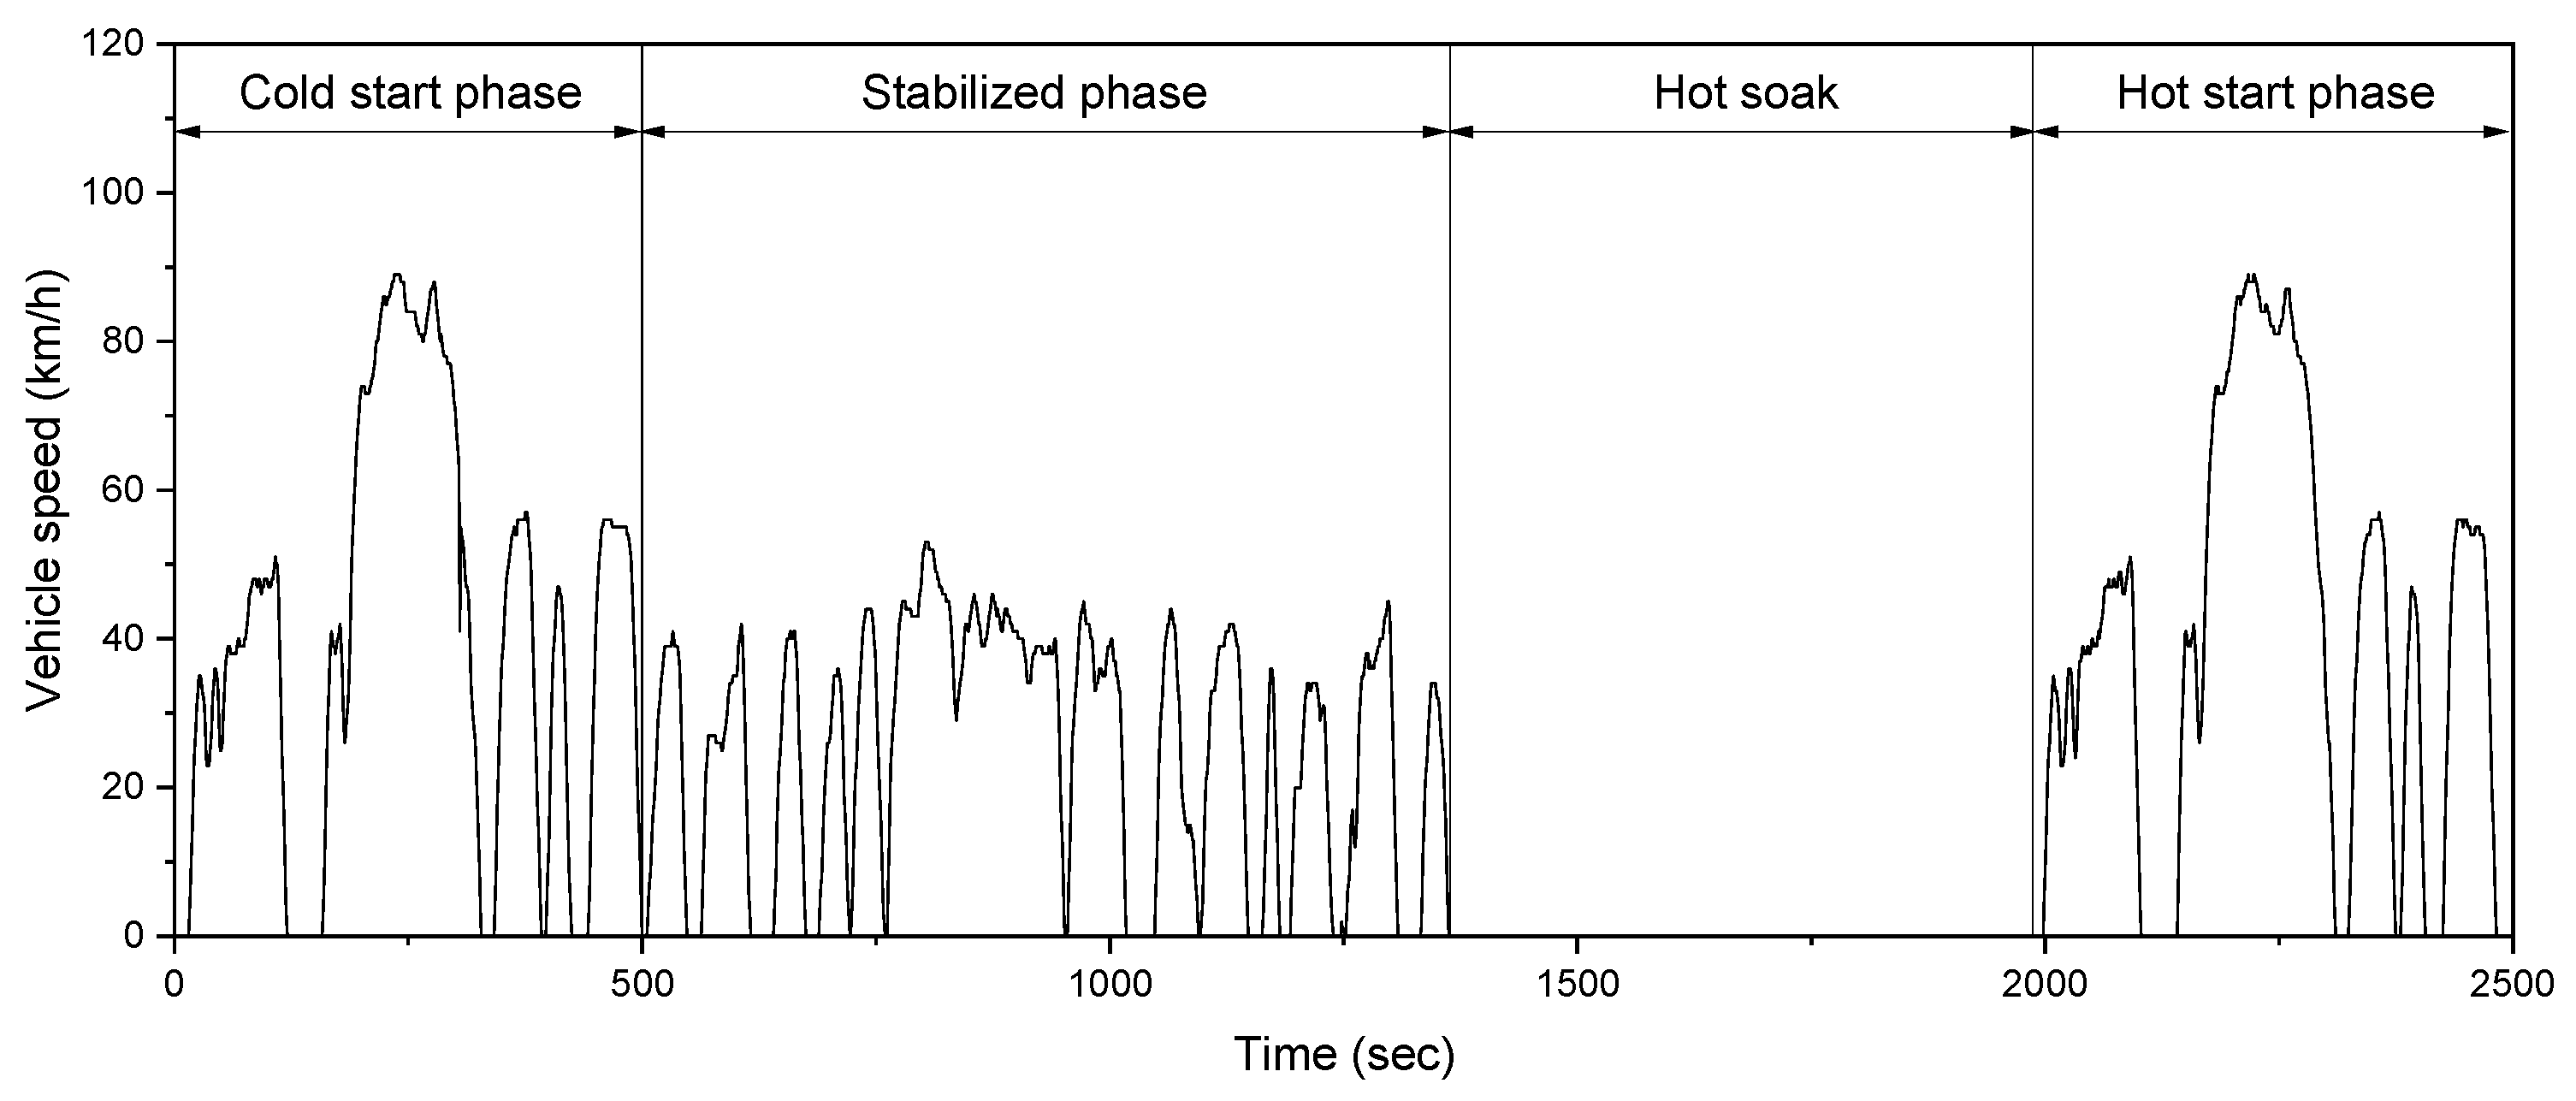
An analysis of the whole-trip and segmented short-trip RPAs of the driving routes confirmed that the RPA distribution for Test Route B closely follows that of the FTP-75 + HWFET mode.
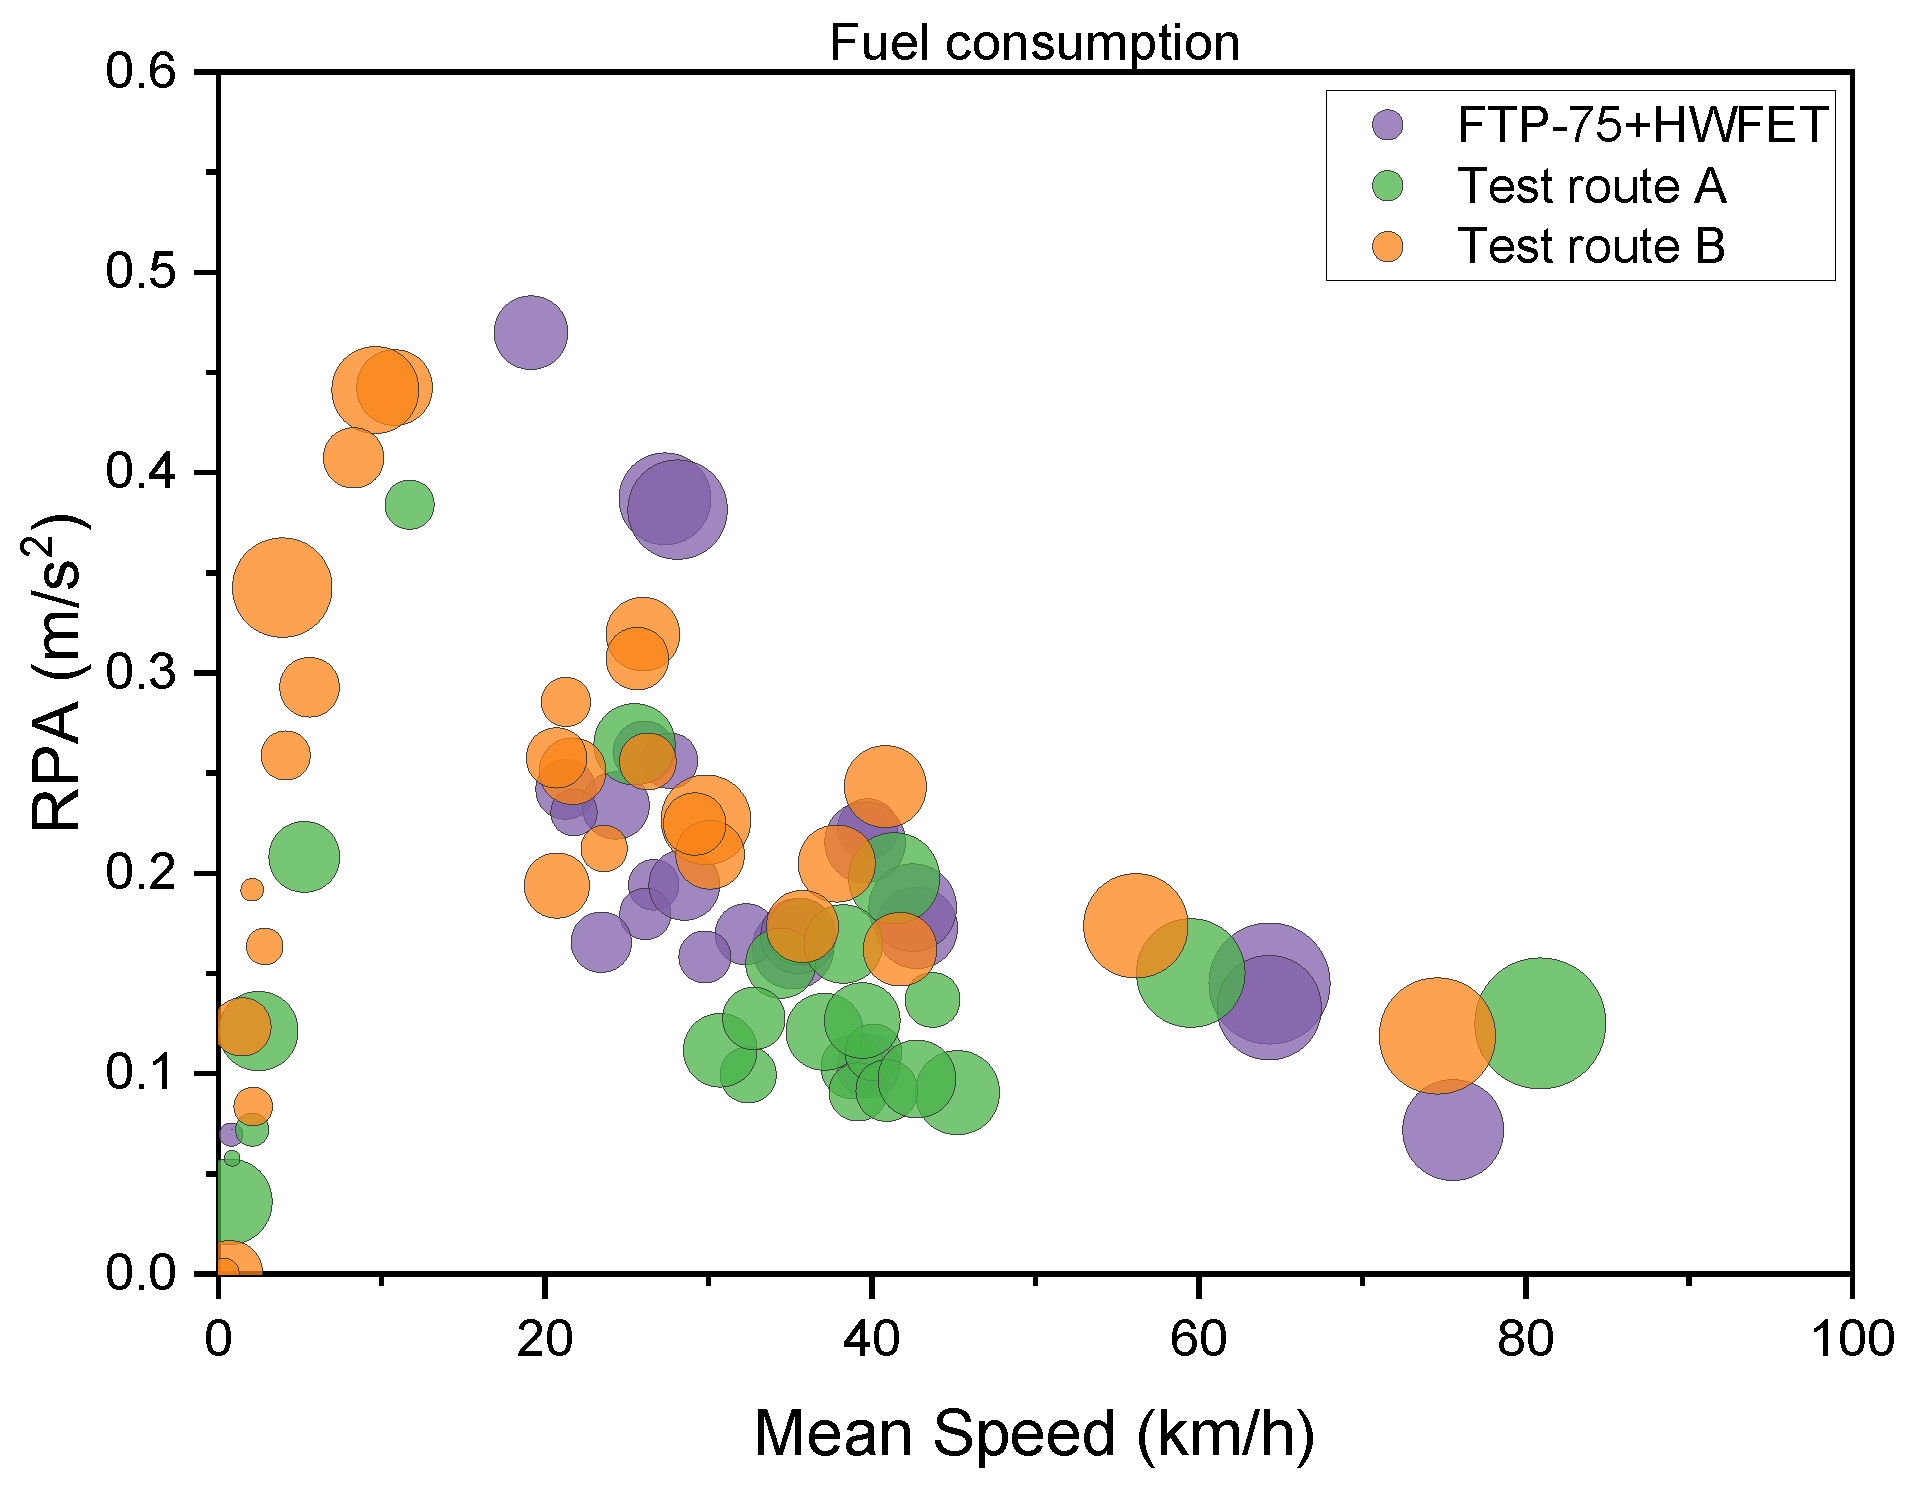
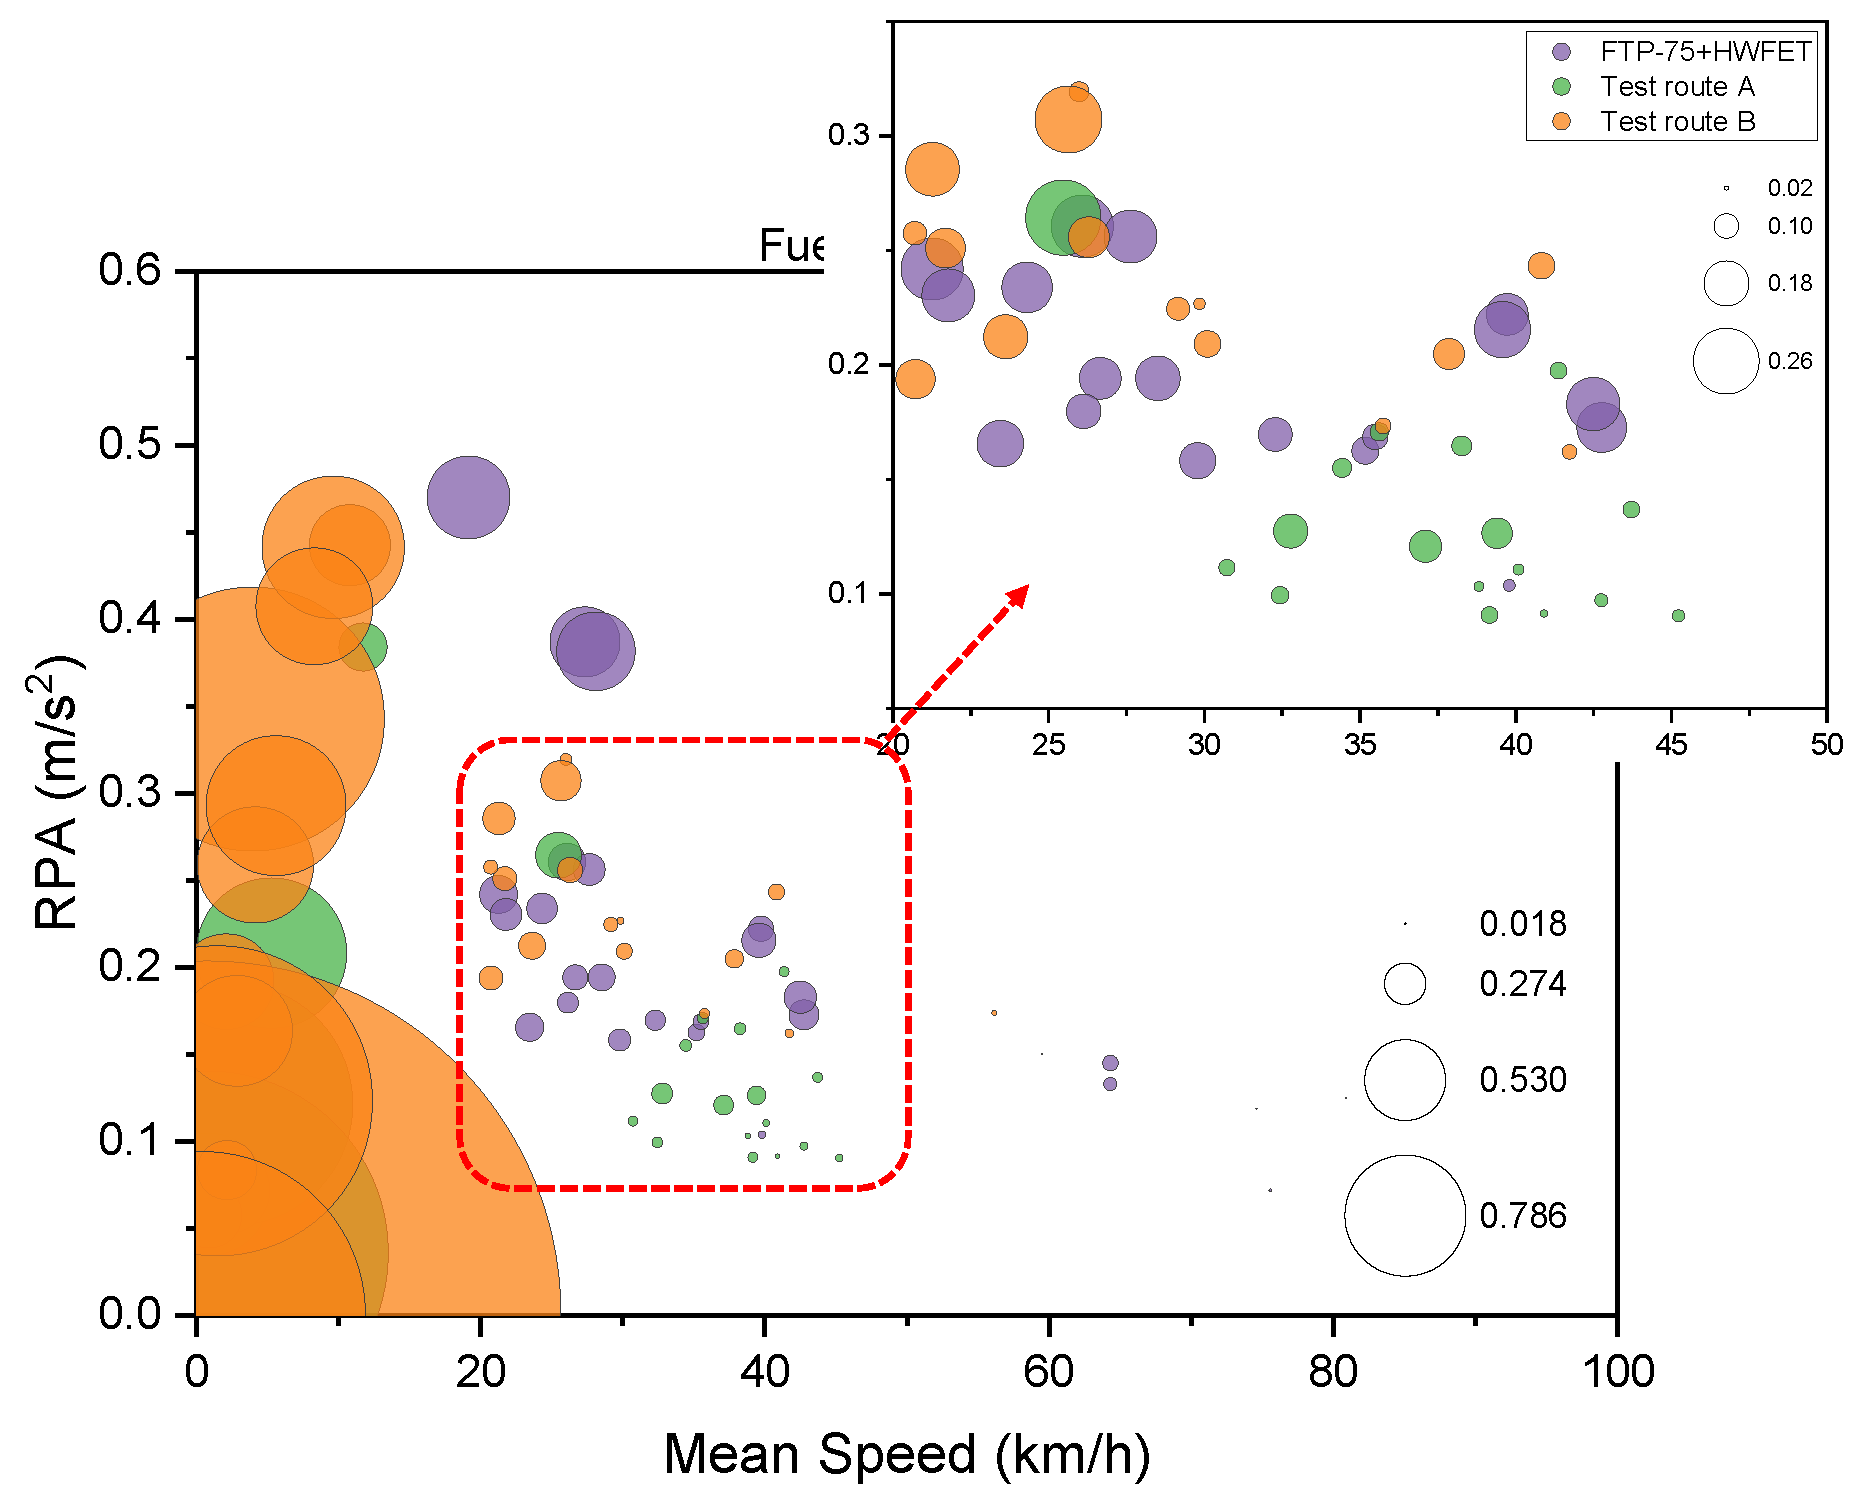
(3)
An analysis of fuel consumption reveals that RPA values and fuel consumption are not directly proportional. Even when RPA values are similar, driving time and fuel consumption can vary. Therefore, additional techniques for evaluating the overall driving characteristics were introduced to complement the existing analysis methods, including RPA analysis to assess harshness, as well as analyses of driving time and fuel consumption.
(4)
In the future, we plan to comparatively validate the effectiveness and fuel efficiency of the constructed and certification modes using this analytical method and vehicle testing. Research is ongoing to further supplement and improve analytical methods that use driving time and fuel consumption rates.
This study confirmed that the driving characteristics of the fuel efficiency certification mode can be sufficiently captured through an analysis of real-world driving data based on the vehicle’s key driving parameters. In the future, a more refined approach is planned for quantitative comparison and analysis of real-world driving fuel efficiency through an analysis of the fuel efficiency certification mode and the real-world driving fuel efficiency constructed using the existing short-trip analysis method.

Author Contributions

Conceptualization, B.L. and J.W.; methodology, J.W.; software, S.L. and B.L.; validation, S.L. and I.E.; formal analysis, S.L.; investigation, I.E.; writing—original draft preparation, S.L.; writing—review and editing, J.W.; visualization, S.L. and I.E.; supervision, J.W.; project administration, J.W.; funding acquisition, J.W. All authors have read and agreed to the published version of the manuscript.

Funding

This work was supported by the Technology Innovation Program (00143565, e-AWD electrically operated module and verification technology development for driving performance of mid-size and full-size SUV) funded by the Ministry of Trade, Industry & Energy (MOTIE) of Korea.

Data Availability Statement

The data presented in this study are available on request from the corresponding author.

Conflicts of Interest

The authors declare no conflicts of interest.

References

  1. Yang, Z.; Bandivadekar, A. Light-Duty Vehicle Greenhouse Gas and Fuel Economy Standards; International Council on Clean Transportation: Washington, DC, USA, 2017; Available online: http://theicct.org/sites/default/files/publications/2017-Global-LDV-Standards-Update_ICCT-Report_23062017_vF.pdf (accessed on 12 November 2023).
  2. Marz, W.; Goetzke, F. CAFE in the city—A spatial analysis of fuel economy standards. J. Environ. Econ. Manag. 2022, 115, 102711. [Google Scholar] [CrossRef]
  3. Rho, K.-W.; Shin, D.-W. A study on status analysis and reform of vehicle fuel economy rating system. Korean Energy Econ. Rev. 2012, 11, 121–151. [Google Scholar]
  4. Lim, J.; Kim, S.; Lee, M.; Kim, K. Study on new type vehicle fuel economy correction formula review according to the applicable. J. Energy Eng. 2016, 25, 198–206. [Google Scholar] [CrossRef]
  5. Borlaug, B.; Holden, J.; Wood, E.; Lee, B.; Fink, J.; Agnew, S.; Lustbader, J. Estimating region-specific fuel economy in the United States from real-world driving cycles. Transp. Res. Part D Transp. Environ. 2020, 86, 102448. [Google Scholar] [CrossRef]
  6. Komnos, D.; Tsiakmakis, S.; Pavlovic, J.; Ntziachristos, L.; Fontaras, G. Analysing the real-world fuel and energy consumption of conventional and electric cars in Europe. Energy Convers. Manag. 2022, 270, 116161. [Google Scholar] [CrossRef]
  7. Shahariar, G.M.H.; Bodisco, T.A.; Zare, A.; Sajjad, M.; Jahirul, M.I.; Chu Van, T.; Bartlett, H.; Ristovski, Z.; Brown, R.J. Impact of driving style and traffic condition on emissions and fuel consumption during real-world transient operation. Fuel 2022, 319, 123874. [Google Scholar] [CrossRef]
  8. Huang, Y.; Ng, E.C.Y.; Zhou, J.L.; Surawski, N.C.; Lu, X.; Du, B.; Forehead, H.; Perez, P.; Chan, E.F.C. Impact of drivers on real-driving fuel consumption and emissions performance. Sci. Total Environ. 2021, 798, 149297. [Google Scholar] [CrossRef] [PubMed]
  9. Montazeri-Gh, M.; Naghizadeh, M. Development of car drive cycle for simulation of emissions and fuel economy. In Proceedings of the 15th European Simulation Symposium, Nottingham, UK, 26–29 October 2003. [Google Scholar]
  10. Degraeuwe, B.; Weiss, M. Does the New European Driving Cycle (NEDC) really fail to capture the NO(X) emissions of diesel cars in Europe? Environ. Pollut. 2017, 222, 234–241. [Google Scholar] [CrossRef] [PubMed]
  11. Duarte, G.O.; Gonçalves, G.A.; Baptista, P.C.; Farias, T.L. Establishing bonds between vehicle certification data and real-world vehicle fuel consumption–a vehicle specific power approach. Energy Convers. Manag. 2015, 92, 251–265. [Google Scholar] [CrossRef]
  12. Edwards, A.J. Aggressive-dynamics metrics for drive-cycle characterization. Transp. Res. Interdiscip. Perspect. 2022, 14, 100592. [Google Scholar] [CrossRef]
  13. Cho, B.; Kees, D.; Shah, N.; d’Urbal, V. A Methodology of Real-World Fuel Consumption Estimation: Part 1. Drive Cycles; SAE Technical Paper 2018-01-0644; SAE International: Warrendale, PA, USA, 2018. [Google Scholar] [CrossRef]
  14. Haan, P.D.; Keller, M. Modelling fuel consumption and pollutant emissions based on real-world driving patterns: The HBEFA approach. Int. J. Environ. Pollut. 2004, 22, 240–258. [Google Scholar] [CrossRef]
  15. Lee, T.-W.; Keel, J.-H.; Park, K.-K.; Park, J.-H.; Park, Y.-H.; Hong, J.-H.; Lee, D.-Y. Greenhouse gas and pollutant emission from light-duty vehicles regarding the relative positive acceleration. Trans. Korean Soc. Automot. Eng. 2010, 18, 31–39. [Google Scholar]
  16. Gallus, J.; Kirchner, U.; Vogt, R.; Benter, T. Impact of driving style and road grade on gaseous exhaust emissions of passenger vehicles measured by a Portable Emission Measurement System (PEMS). Transp. Res. Part D Transp. Environ. 2017, 52, 215–226. [Google Scholar] [CrossRef]
  17. Dhital, N.B.; Wang, S.-X.; Lee, C.-H.; Su, J.; Tsai, M.-Y.; Jhou, Y.-J.; Yang, H.-H. Effects of driving behavior on real-world emissions of particulate matter, gaseous pollutants and particle-bound PAHs for diesel trucks. Environ. Pollut. 2021, 286, 117292. [Google Scholar] [CrossRef] [PubMed]
  18. Ouali, T.; Shah, N.; Kim, B.; Fuente, D.; Gao, B. Driving Style Identification Algorithm with Real-World Data Based on Statistical Approach; SAE Technical Paper 2016-01-1422; SAE International: Warrendale, PA, USA, 2016; ISSN 0148-7191. [Google Scholar] [CrossRef]
Figure 1. Schematic diagram of the experimental setup and data acquisition system.
Energies 17 00185 g001
Figure 2. Test Routes A and B for real-world driving cycles. (a) Test Route A. (b) Test Route B.
Energies 17 00185 g002
Figure 3. Vehicle speed vs. time of FTP-75 cycle.
Energies 17 00185 g003
Figure 4. Vehicle speed vs. time of HWFET cycle.
Energies 17 00185 g004
Figure 5. Definition of a short trip.
Energies 17 00185 g005
Figure 6. Distance-based trip share of driving cycles and test routes.
Energies 17 00185 g006
Figure 7. Time-based trip share of driving cycles and test routes.
Energies 17 00185 g007
Figure 8. Drive type trip share of driving cycles and test routes.
Energies 17 00185 g008
Figure 9. Comparison of the trip mean speed and RPA of driving cycles and test routes. (a) Whole-trip analyze and (b) short-trip analyze.
Energies 17 00185 g009
Figure 10. Bubble chart of fuel consumption for driving cycles and test routes.
Energies 17 00185 g010
Figure 11. Bubble chart of trip duration for driving cycles and test routes.
Energies 17 00185 g011
Figure 12. Bubble chart of fuel consumption over trip duration for driving cycles and test routes.
Energies 17 00185 g012
Table 1. Specifications of the test vehicle.
CategoryValue
Vehicle typeSUV
Engine typeV6 NA
FuelGasoline
Displacement (cc)3778
TransmissionAutomatic
Drivetrain2WD
Max torque (N·m)355 @ 5200 rpm
Max power (kW)217 @ 6000 rpm
Fuel efficiency (km/L)9.3
Table 2. Driving conditions of real-road driving routes.
UrbanRuralHighway
Vehicle speed range (km/h)≤6060–90<90
Minimum driving distance (km)161616
Valid average vehicle speed (km/h)15–40-90–110
Average vehicle speed (@ Cold start) (km/h)15–40--
Maximum vehicle speed (@ Cold start) (km/h)6090-
Table 3. Trip share characteristics of urban, rural, and highway for each test route.
CategoriesUrbanRuralHighwayTotal
Test Route
A
Trip share (%)37.235.327.5100
Trip distance (km)39.537.529.2106.2
Test Route
B
Trip share (%)25.941.832.3100
Trip distance (km)17.027.421.165.5
Disclaimer/Publisher’s Note: The statements, opinions and data contained in all publications are solely those of the individual author(s) and contributor(s) and not of MDPI and/or the editor(s). MDPI and/or the editor(s) disclaim responsibility for any injury to people or property resulting from any ideas, methods, instructions or products referred to in the content.

