


Seasonal Analysis and Capacity Planning of Solar Energy Demand-to-Supply Management: Case Study of a Logistics Distribution Center

Abstract
:1. Introduction
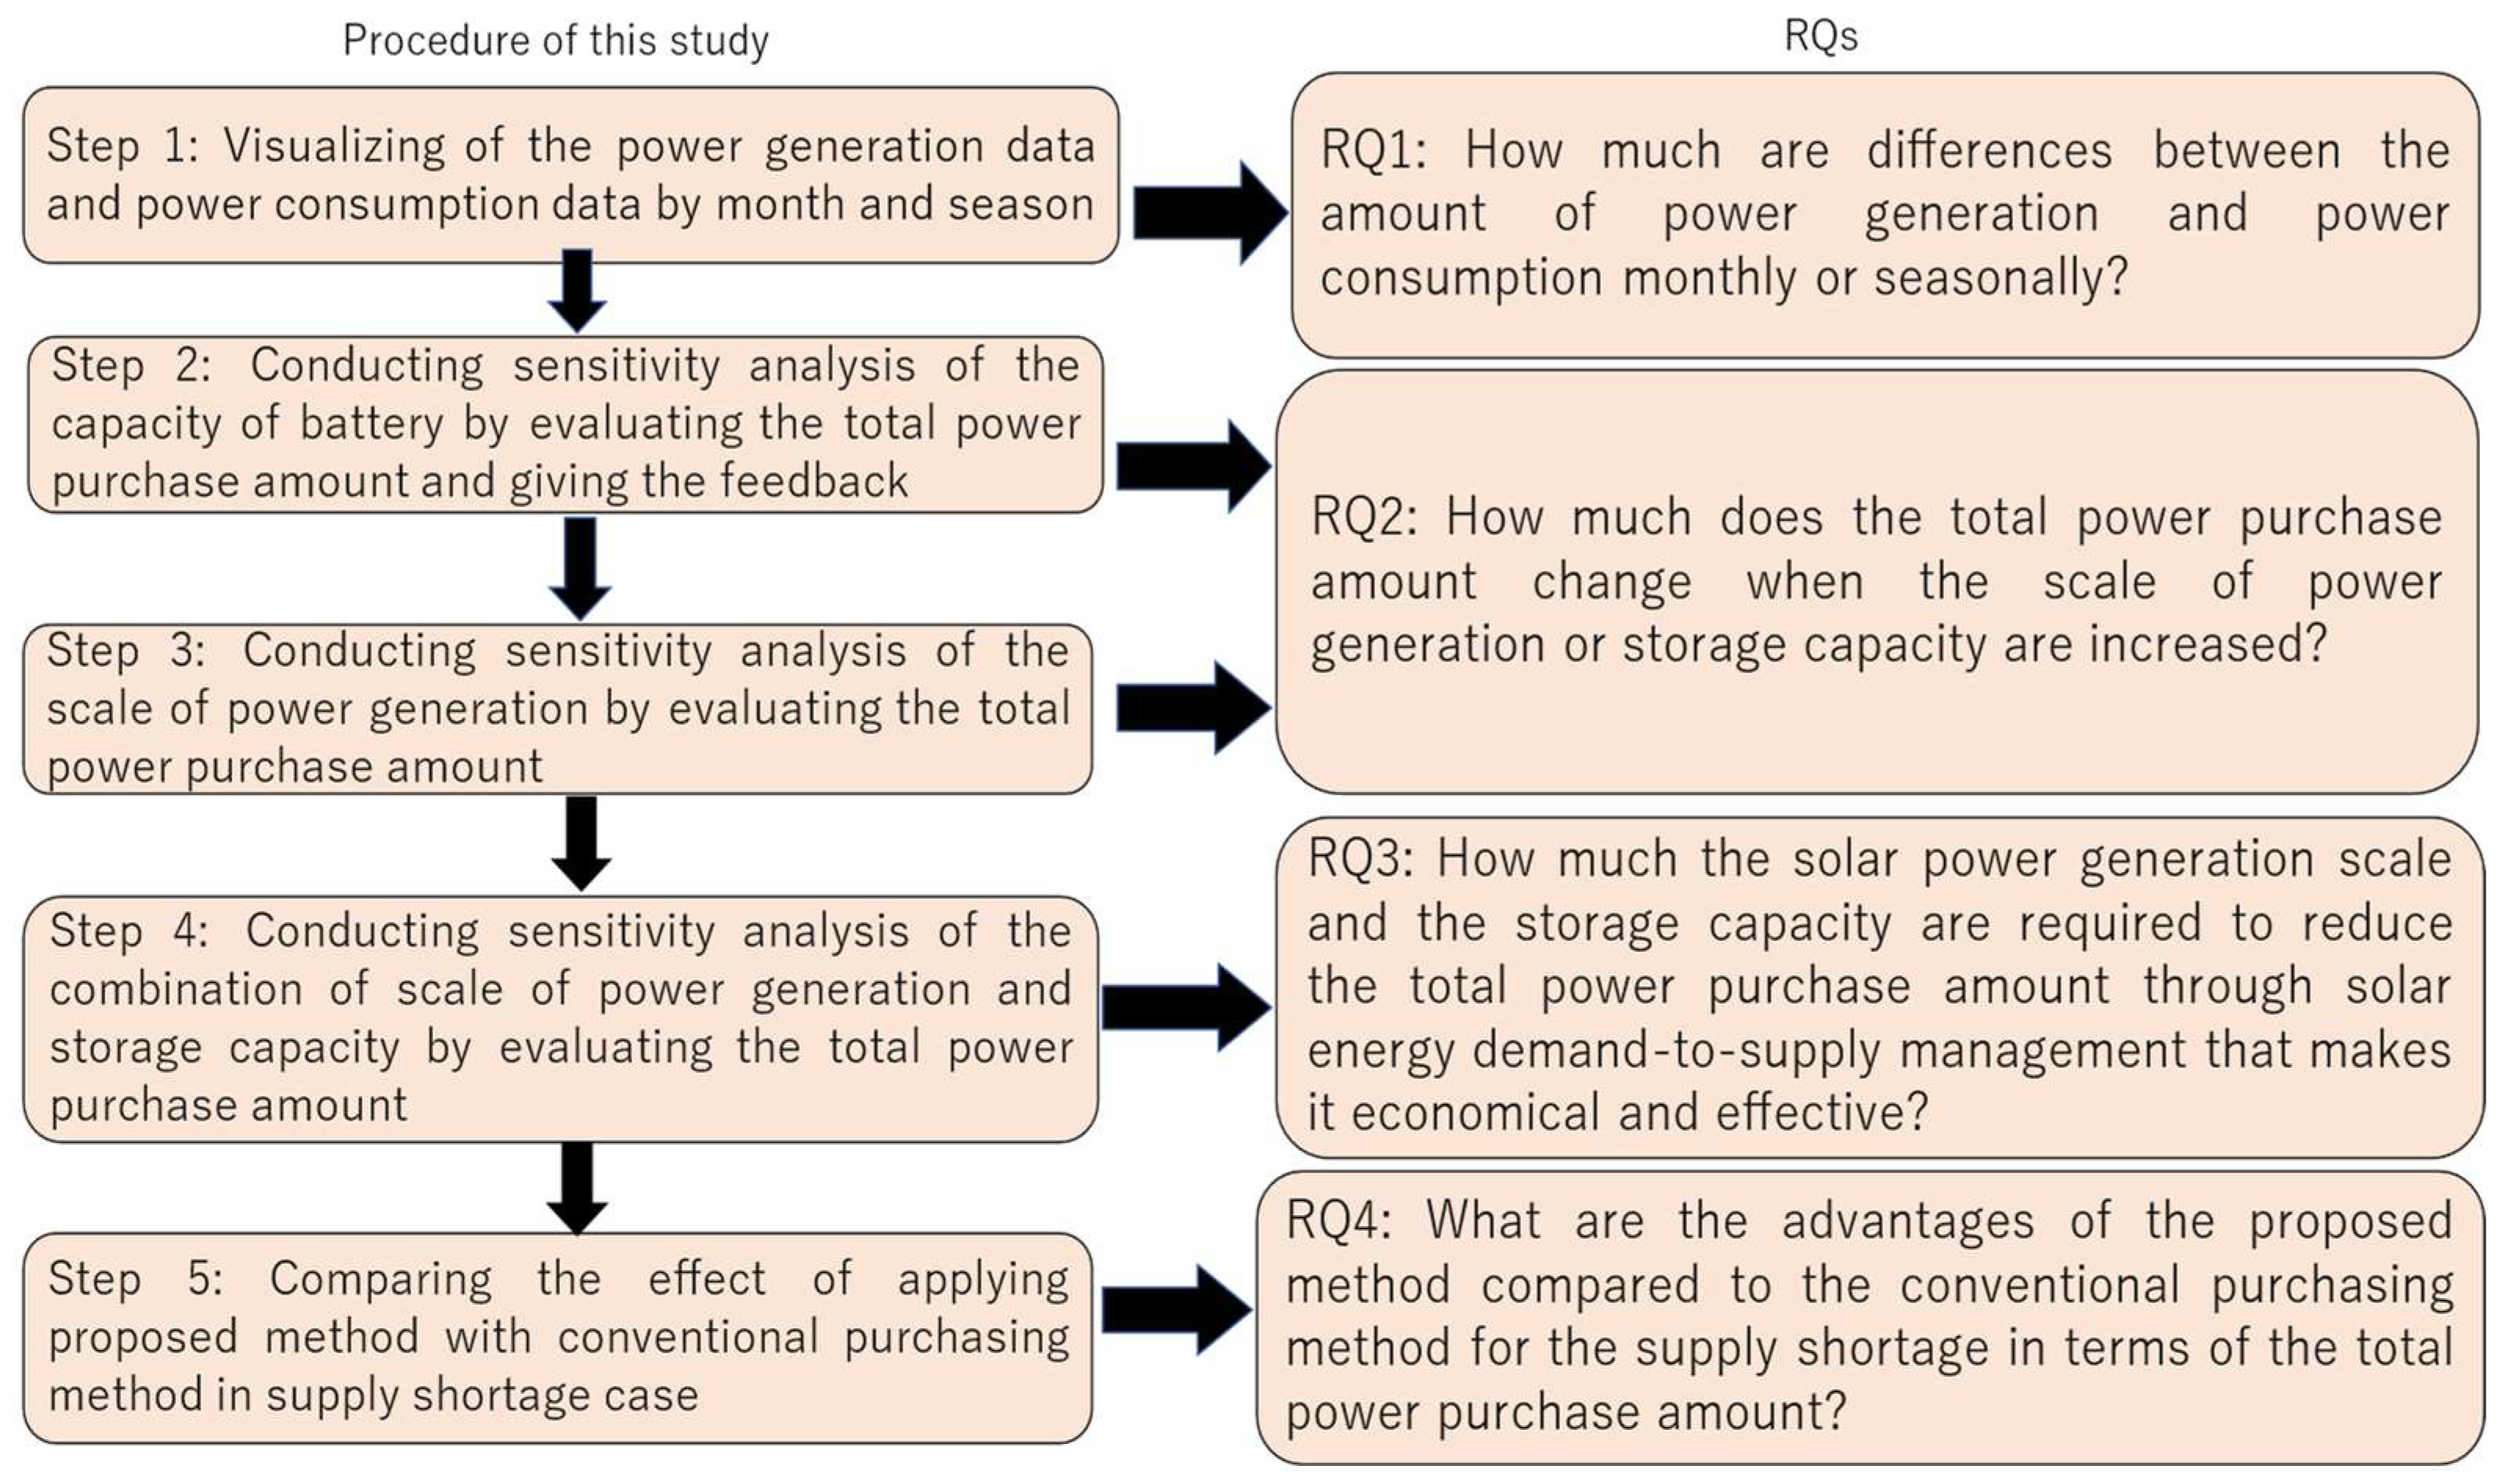
- RQ1. How much are differences between the amount of power generation and power consumption monthly or seasonally?
- RQ2. How much does the total power purchase amount change when the scale of power generation or storage capacity are increased?
- RQ3. How much the solar power generation scale and the storage capacity are required to reduce the total power purchase amount through solar energy demand-to-supply management that makes it economical and effective?
- RQ3. What are the advantages of the proposed method compared to the conventional purchasing method for the supply shortage in terms of the total power purchase amount?

| Type of Renewable Energy | Demand-to-Supply | Overcoming Uncertainties | ||||||||||
|---|---|---|---|---|---|---|---|---|---|---|---|---|
| Solar | Wind | Biogas | Biomass | Supply | Demand | Battery Capacity | Stochastic Model | Forecasting | Real Data | Monthly and/or Seasonal Analysis | Methods | |
| Trappey et al. (2013) [6] | √ | √ | √ | √ | Hierarchical learning model | |||||||
| Pham et al. (2019) [7] | √ | √ | √ | √ | √ | √ | Stochastic planning model | |||||
| Rentizelas et al. (2012) [16] | √ | √ | √ | √ | √ | √ | √ | √ | Forward-sweeping linear programming | |||
| Behzadi et al. (2023) [8] | √ | √ | √ | √ | √ | Transient system simulation tool and programming | ||||||
| Huy et al. (2023) [9] | √ | √ | √ | √ | √ | Multi-objective mixed-integer linear programming | ||||||
| Al-Habaibeh et al. (2023) [11] | √ | √ | √ | √ | Questionnaire survey | |||||||
| Mohebi and Roshandel (2023) [14] | √ | √ | √ | √ | √ | ε constraint method | ||||||
| Gelchu et al. (2023) [10] | √ | √ | √ | √ | √ | √ | √ | Particle swarm optimization | ||||
| Ledmaoui et al. (2023) [17] | √ | √ | √ | √ | √ | √ | Support Vector Regression, Artificial Neural Network, Decision Tree, Random Forest, Generalized Additive Model Extreme Gradient Boosting | |||||
| Romero-Ramos et al. (2023) [15] | √ | √ | √ | √ | √ | √ | √ | Geographic information system and Analytic hierarchy process | ||||
| Ijuin et al. (2022) [20] | √ | √ | √ | √ | √ | √ | √ | On-demand cumulative-control method | ||||
| Kato et al. (2022) [22] | √ | √ | √ | √ | √ | Job shop control policy | ||||||
| Biazetto et al. (2023) [12] | √ | √ | √ | √ | Nonlinear programming algorithm | |||||||
| Zhang et al. (2022) [18] | √ | √ | Containment algorithm, Consensus algorithm, and Event-triggered mechanism | |||||||||
| Yang et al. (2022) [19] | √ | √ | √ | √ | √ | √ | Reinforcement learning | |||||
| Shi et al. (2022) [13] | √ | √ | √ | √ | √ | The golden section Fibonacci tree optimization algorithm | ||||||
| This study | √ | √ | √ | √ | √ | √ | √ | √ | On-demand cumulative-control method | |||
2. Methods
2.1. Analysis Procedure
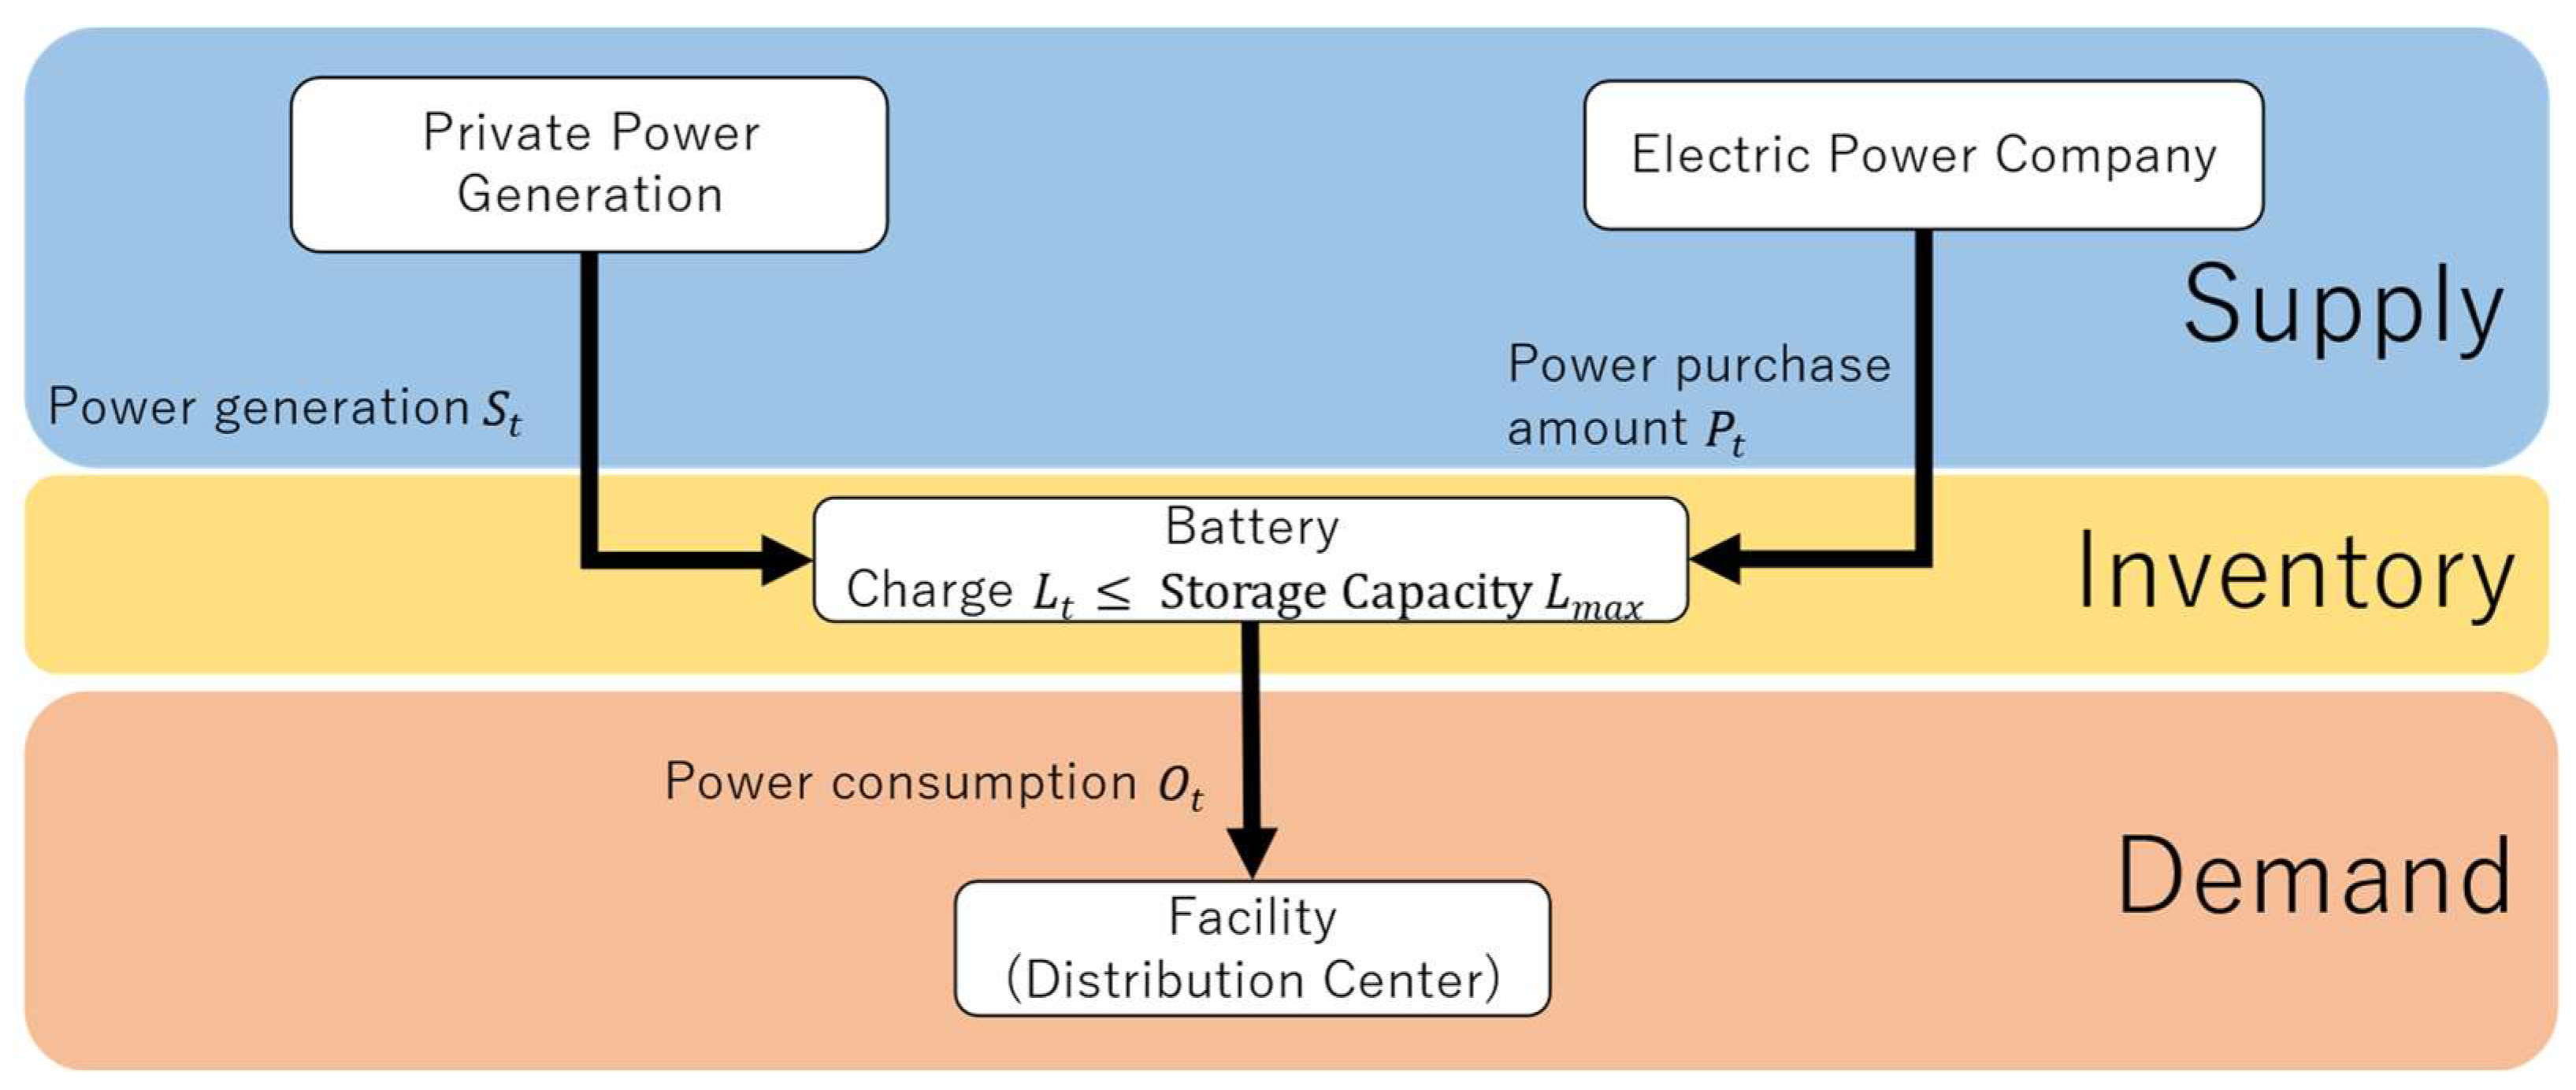
2.2. Solar Energy Demand-to-Supply Management Model
2.3. Power Consumption and Solar Power Generation Data at the Target Facility
| Data Attributes | This Study |
|---|---|
| Target facility | Distribution center in Yokohama, Japan |
| Measurement period | From March 2020 to February 2021 |
| Measurement interval | One hour |
| Power generation data | Estimated based on actual solar radiation data provided by NEDO [24] by applying proposed method |
| Power consumption data | Actual data provided by Ecolomy Co., Ltd. [23]. |
| Panel power generation capacity | 20 kW |
| Usage of power consumption | Air conditioning, Lightning, Refrigeration and Freezing |
3. Data Processing of Solar Energy Demand-to-Supply Management
3.1. Overview of the On-Demand Cumulative Control Method Application
| Variables | This Study |
|---|---|
| Power consumption in period [kWh] | |
| Moving base storage amount in period [kWh] | |
| Remaining storage amount in period [kWh] | |
| Input amount determination parameter in period | |
| Power generation in period [kWh] | |
| Demand rate at period | |
| Power purchase amount in period [kWh] | |
| The amount of power supply in the next period in period [kWh] | |
| Forecasted power consumption [kWh] | |
| Forecasted power generation [kWh] | |
| Initial storage amount [kWh] | |
| Storage capacity [kWh] | |
| Total solar irradiation in period per array plane [kWh/] | |
| Coefficient | |
| Smoothing coefficient | |
| The coefficient total design factor | |
| Panel power generation capacity [kW] | |
| Standard irradiance per array plane [kW/] | |
| Evaluation Value | |
| Total power purchase amount [kWh] |
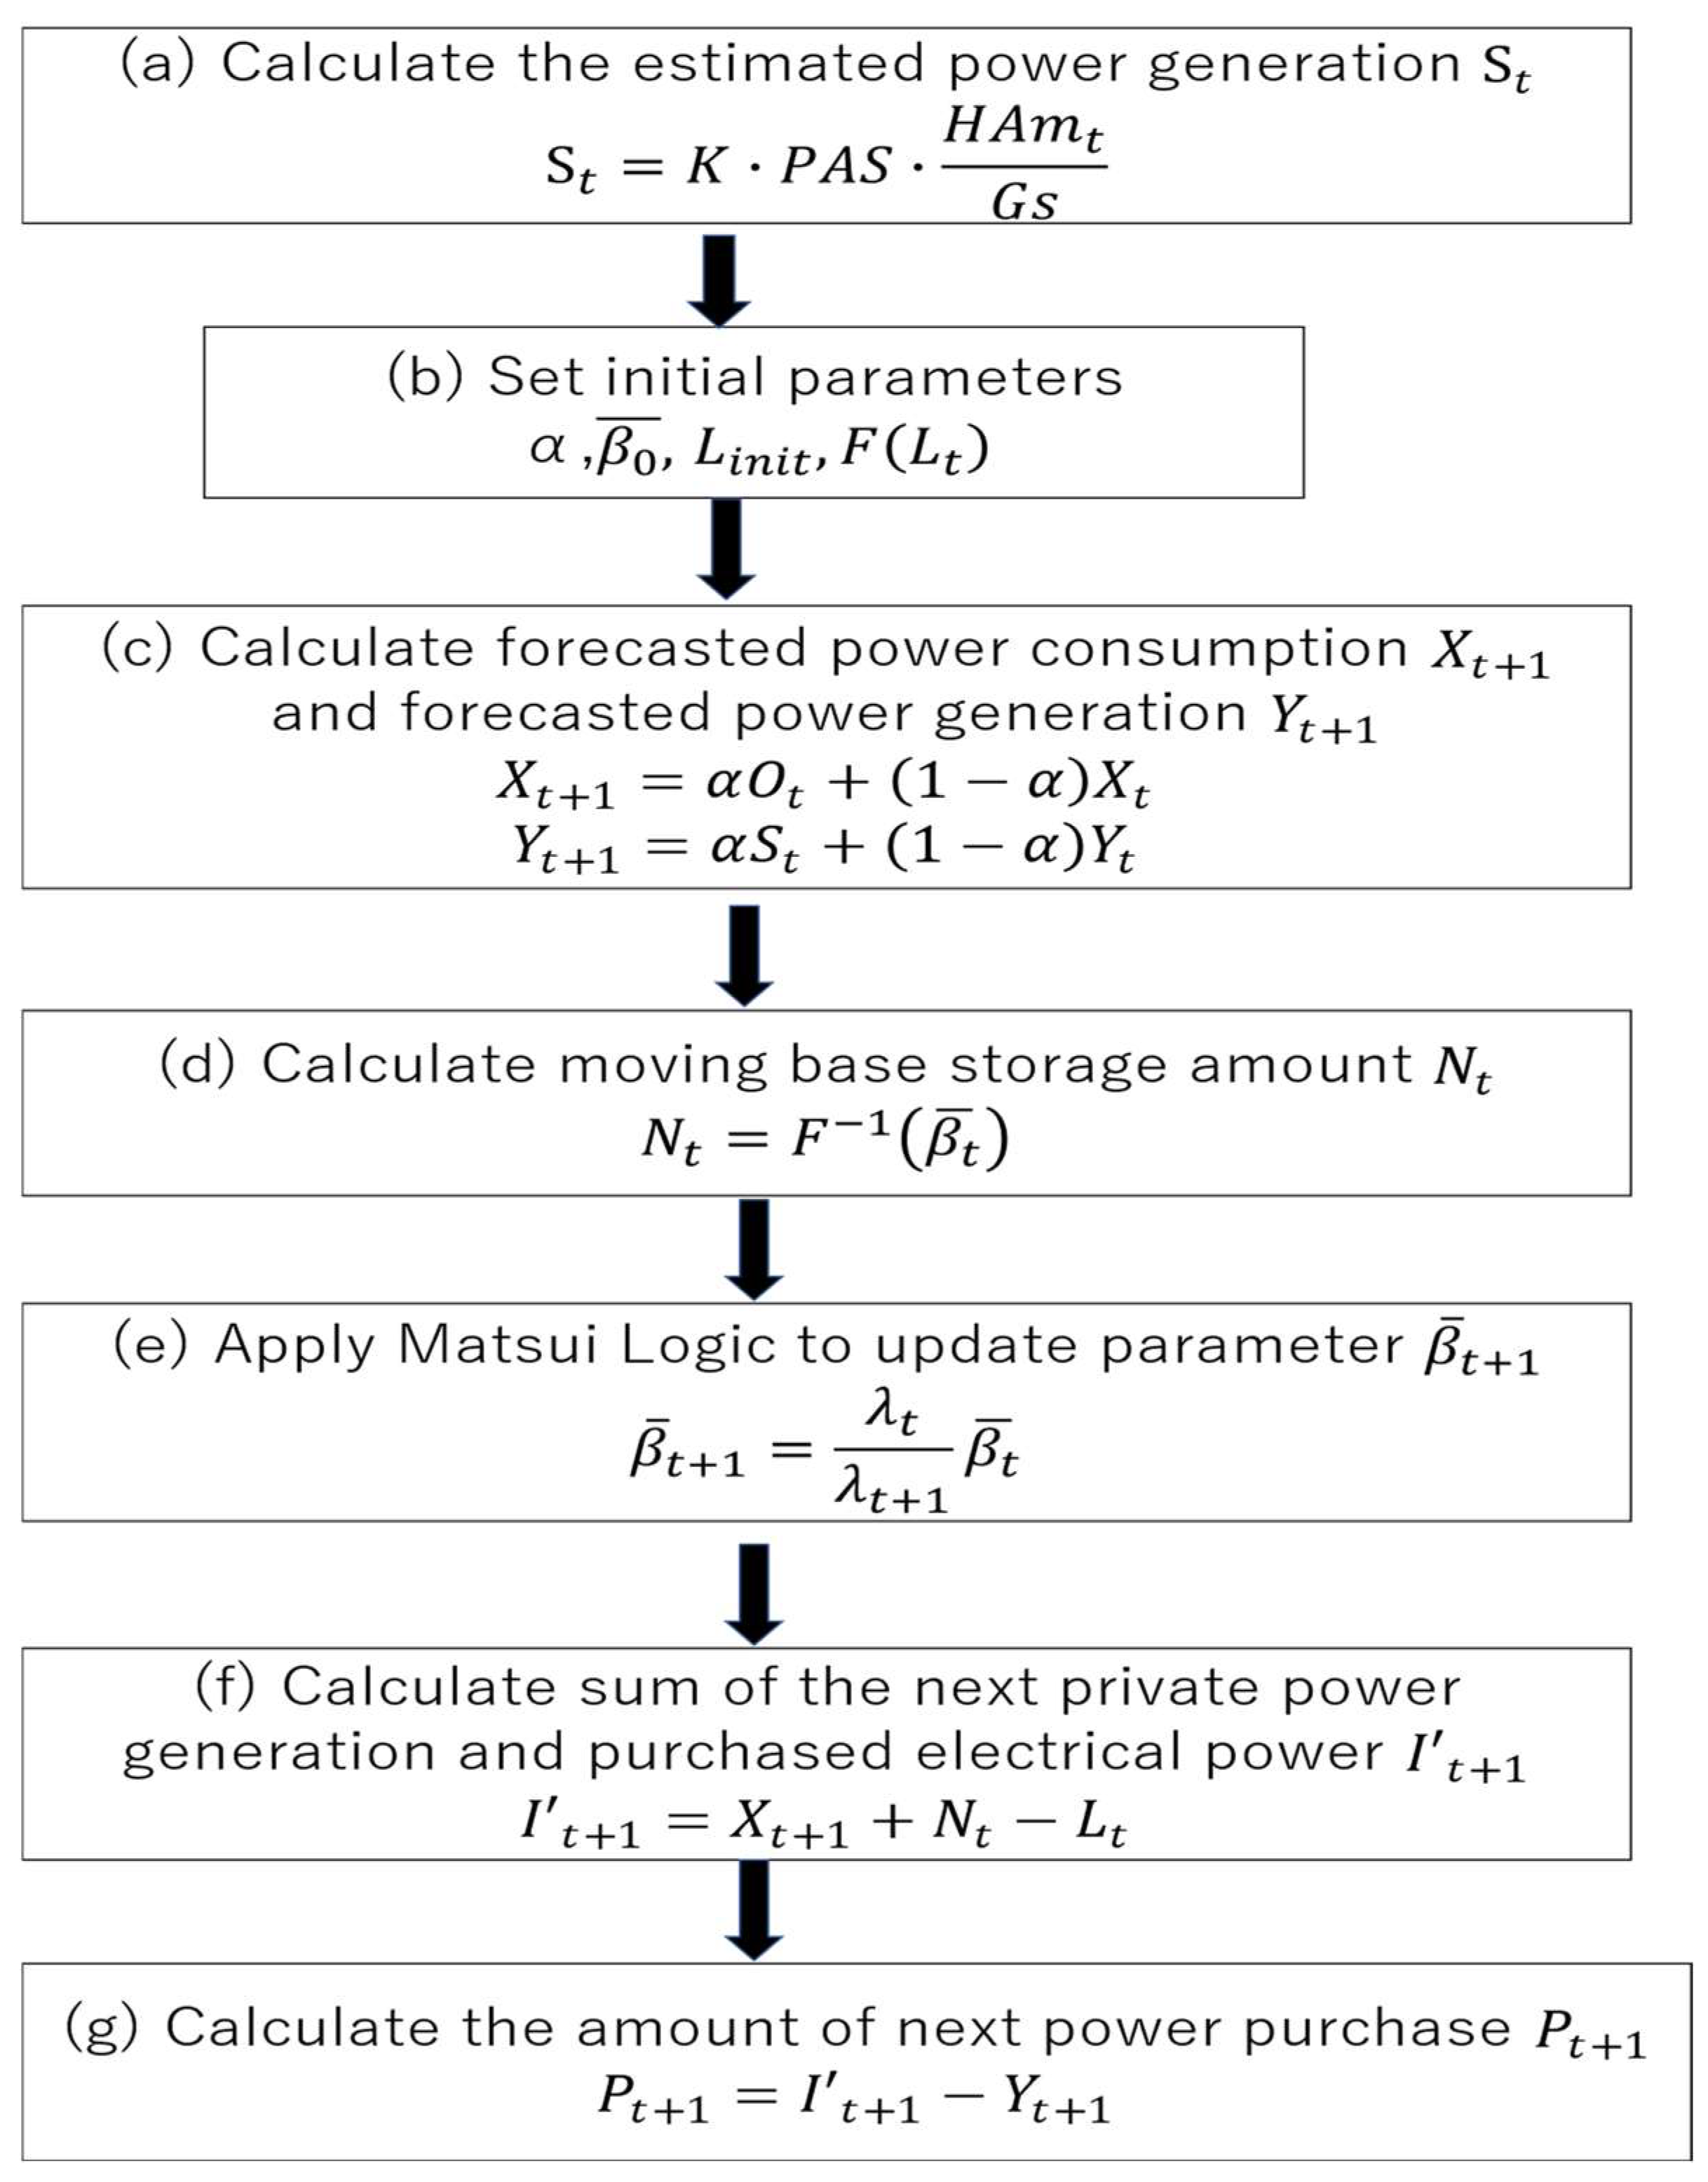
3.2. Procedure of Applying the On-Demand Cumulative Control Method
3.3. Explanation about the Data Sources and Parameters
| Parameters | Data Source or Explanation about Parameters | Value |
|---|---|---|
| Power consumption in period t [kWh] | The power consumption in period , shows actual amount of power consumption in period . It is shown as real data at the target facility provided by Ecolomy Co., Ltd. [23]. It is recorded annually and hourly. | Varies by |
| Initial storage amount [kWh] | The initial storage amount indicates the storage amount in period . The value of is unified as 0 [kWh]. | 0 [kWh] |
| Storage capacity [kWh] | The storage capacity indicates the maximum amount of electricity which can be stored in storage battery. | Varies by scenario |
| Total solar irradiation in period per array plane [kWh/] | The total solar irradiation in period per array plane shows the actual total solar irradiation in period per array plane. The source of is numerical data at the target facility area, which are provided by the New Energy and Industrial Technology Development Organization (NEDO, 2021) [24]. It is recorded annually and hourly. | Varies by |
| Smoothing coefficient | The smoothing coefficient shows the degree of consideration of actual value when the power generation or consumption forecasting is conducted. is used in the proposed method to calculate the forecasted power consumption and power generation . The value of is unified as 0.5. | 0.5 |
| The coefficient total design factor | The coefficient total design factor indicates the correction of solar power output loss. The cause of occurring output loss has several reasons, such as the dirty part of solar panel and decreasing solar radiation. According to the NEDO [24], is defined as 0.73. | 0.73 |
| Panel power generation capacity [kW] | The panel power generation capacity shows the performance of power generation of the panel. This is used in calculation of the power generation amount. In this study, real data of is at the target facility area, which was provided by Ecolomy Co., Ltd. [23]. | 20 [kW] |
| Standard irradiance per array plane [kW/] | The standard irradiance per array plane shows the momentary solar radiation intensity. According to the NEDO [24], is defined as 1 [kW/]. | 1 [kW/] |
| Parameters | Explanation and Calculation Method | Equation of Calculation | |
|---|---|---|---|
| Power generation in period t [kWh] | The power generation in period indicates estimated power generation data in period . is calculated by the coefficient total design factor , the panel power generation capacity , the total solar irradiance in period per array plane and standard irradiance per array plane as shown in Equation (8) | (8) | |
| Forecasted power consumption in period t [kWh] | The forecasted power consumption in period , shows the power consumption data estimated with using power demand forecasting. is calculated by the smoothing coefficient power consumption in period , as shown in Equation (9) | (9) | |
| Forecasted solar power generation in period t [kWh] | The forecasted solar power generation in period , shows the solar power generation data estimated by using solar power generation forecasting. In the proposed method, is calculated by the smoothing coefficient and the power consumption in period , as shown in Equation (10) | (10) | |
| Remaining storage amount in period t [kWh] | The remaining storage amount in period , shows the amount of electricity in the storage battery at the end of period . is calculated by the power consumption in period , , the estimated amount of power generation in period , , the power purchase amount in period , , and the storage capacity, as shown in Equation (11). When the sum of power generation in period , , the power purchase amount in period , , and is higher than the actual power consumption in period , is estimated as the smaller value between the difference among them and . Otherwise, the value of is recorded 0. | (11) | |
| Demand rate at period t | The demand rate at period , is regarded as the actual power consumption data in period , . On the other hand, is regarded as forecasted power consumption data in period , demand. The reason is defined as , cannot be found in period . They are calculated as Equations (12) and (13). | (12) | |
| (13) | |||
| Input amount determination parameter in period t | The input amount determination parameter in period , indicates the parameter which updated by the ratio of power consumption in the current period and the next period. is used to estimate the moving base storage amount. is calculated as shown in Equation (14) and is defined 0.5 as initial value in this study. | (14) | |
| Moving base storage amount in period t [kWh] | The moving base storage amount in period means the storage amount which should be charged for effective demand-to-supply management in period . On the other hand, it shows the appropriate amount of electricity in the storage battery to conduct effective demand-to-supply management. is calculated by the input amount determination parameter over period , and cumulative probability distribution of the remaining storage amount , as shown in Equation (15). | (15) | |
| The amount of power supply in the next period in period t [kWh] | The amount of power supply in the next period in period , indicates sum of the next private power generation and purchased electrical power in period . is calculated by the forecasted power consumption in period ,, the moving base storage amount in period , and the remaining storage amount in period , as shown in Equation (16) | (16) | |
| Power purchase amount in period t [kWh] | The power purchase amount in period , indicates the amount of power supply that cannot be covered by the private power generation in period . is shown the difference between the amount of power supply in the next period in period , and the forecasted power generation in period , . It is shown in Equation (17). | (17) | |
| Total power purchase amount [kWh] | The total power purchase amount indicates the total power purchase amount during the measurement period. is calculated in Equation (18). | (18) | |
4. Seasonal Analysis of Power Generation and Consumption
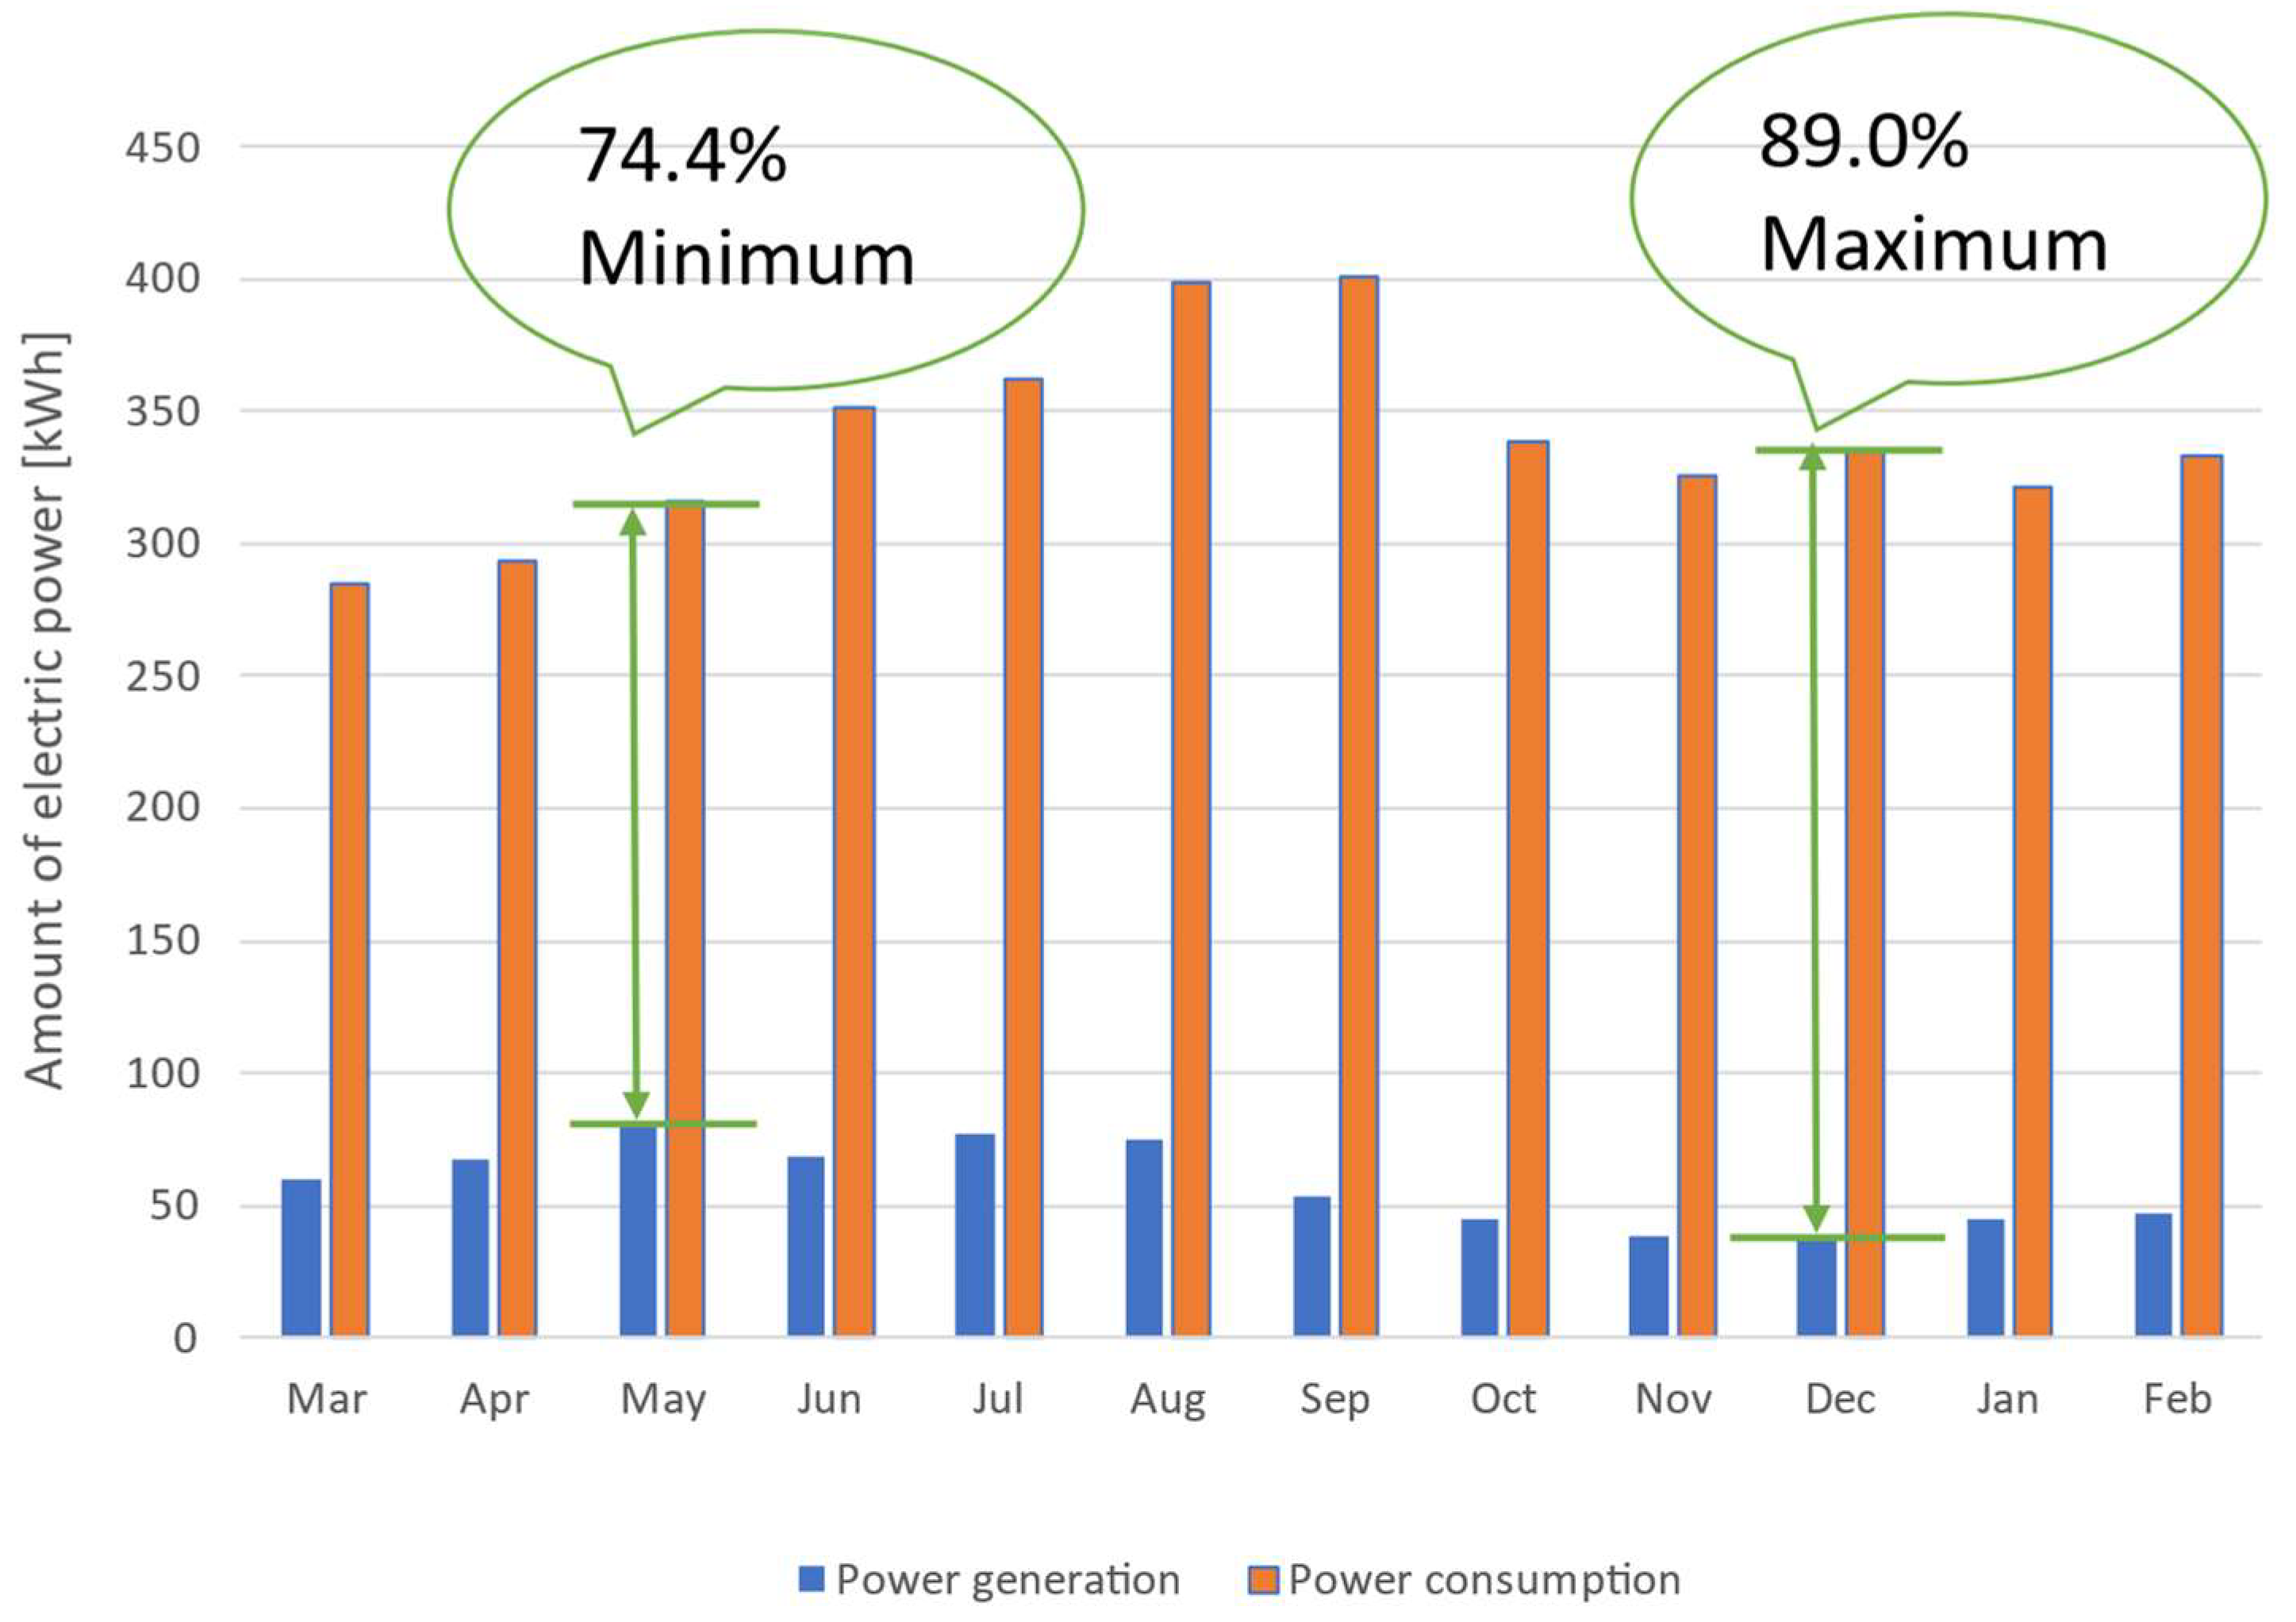
4.1. Results of Monthly Comparison for Power Generation and Consumption (RQ1)
4.2. Results of the Seasonal Comparison for Solar Power Generation and Consumption (RQ1)
4.3. Results of Daily Power Generation and Consumption at the Target Facility
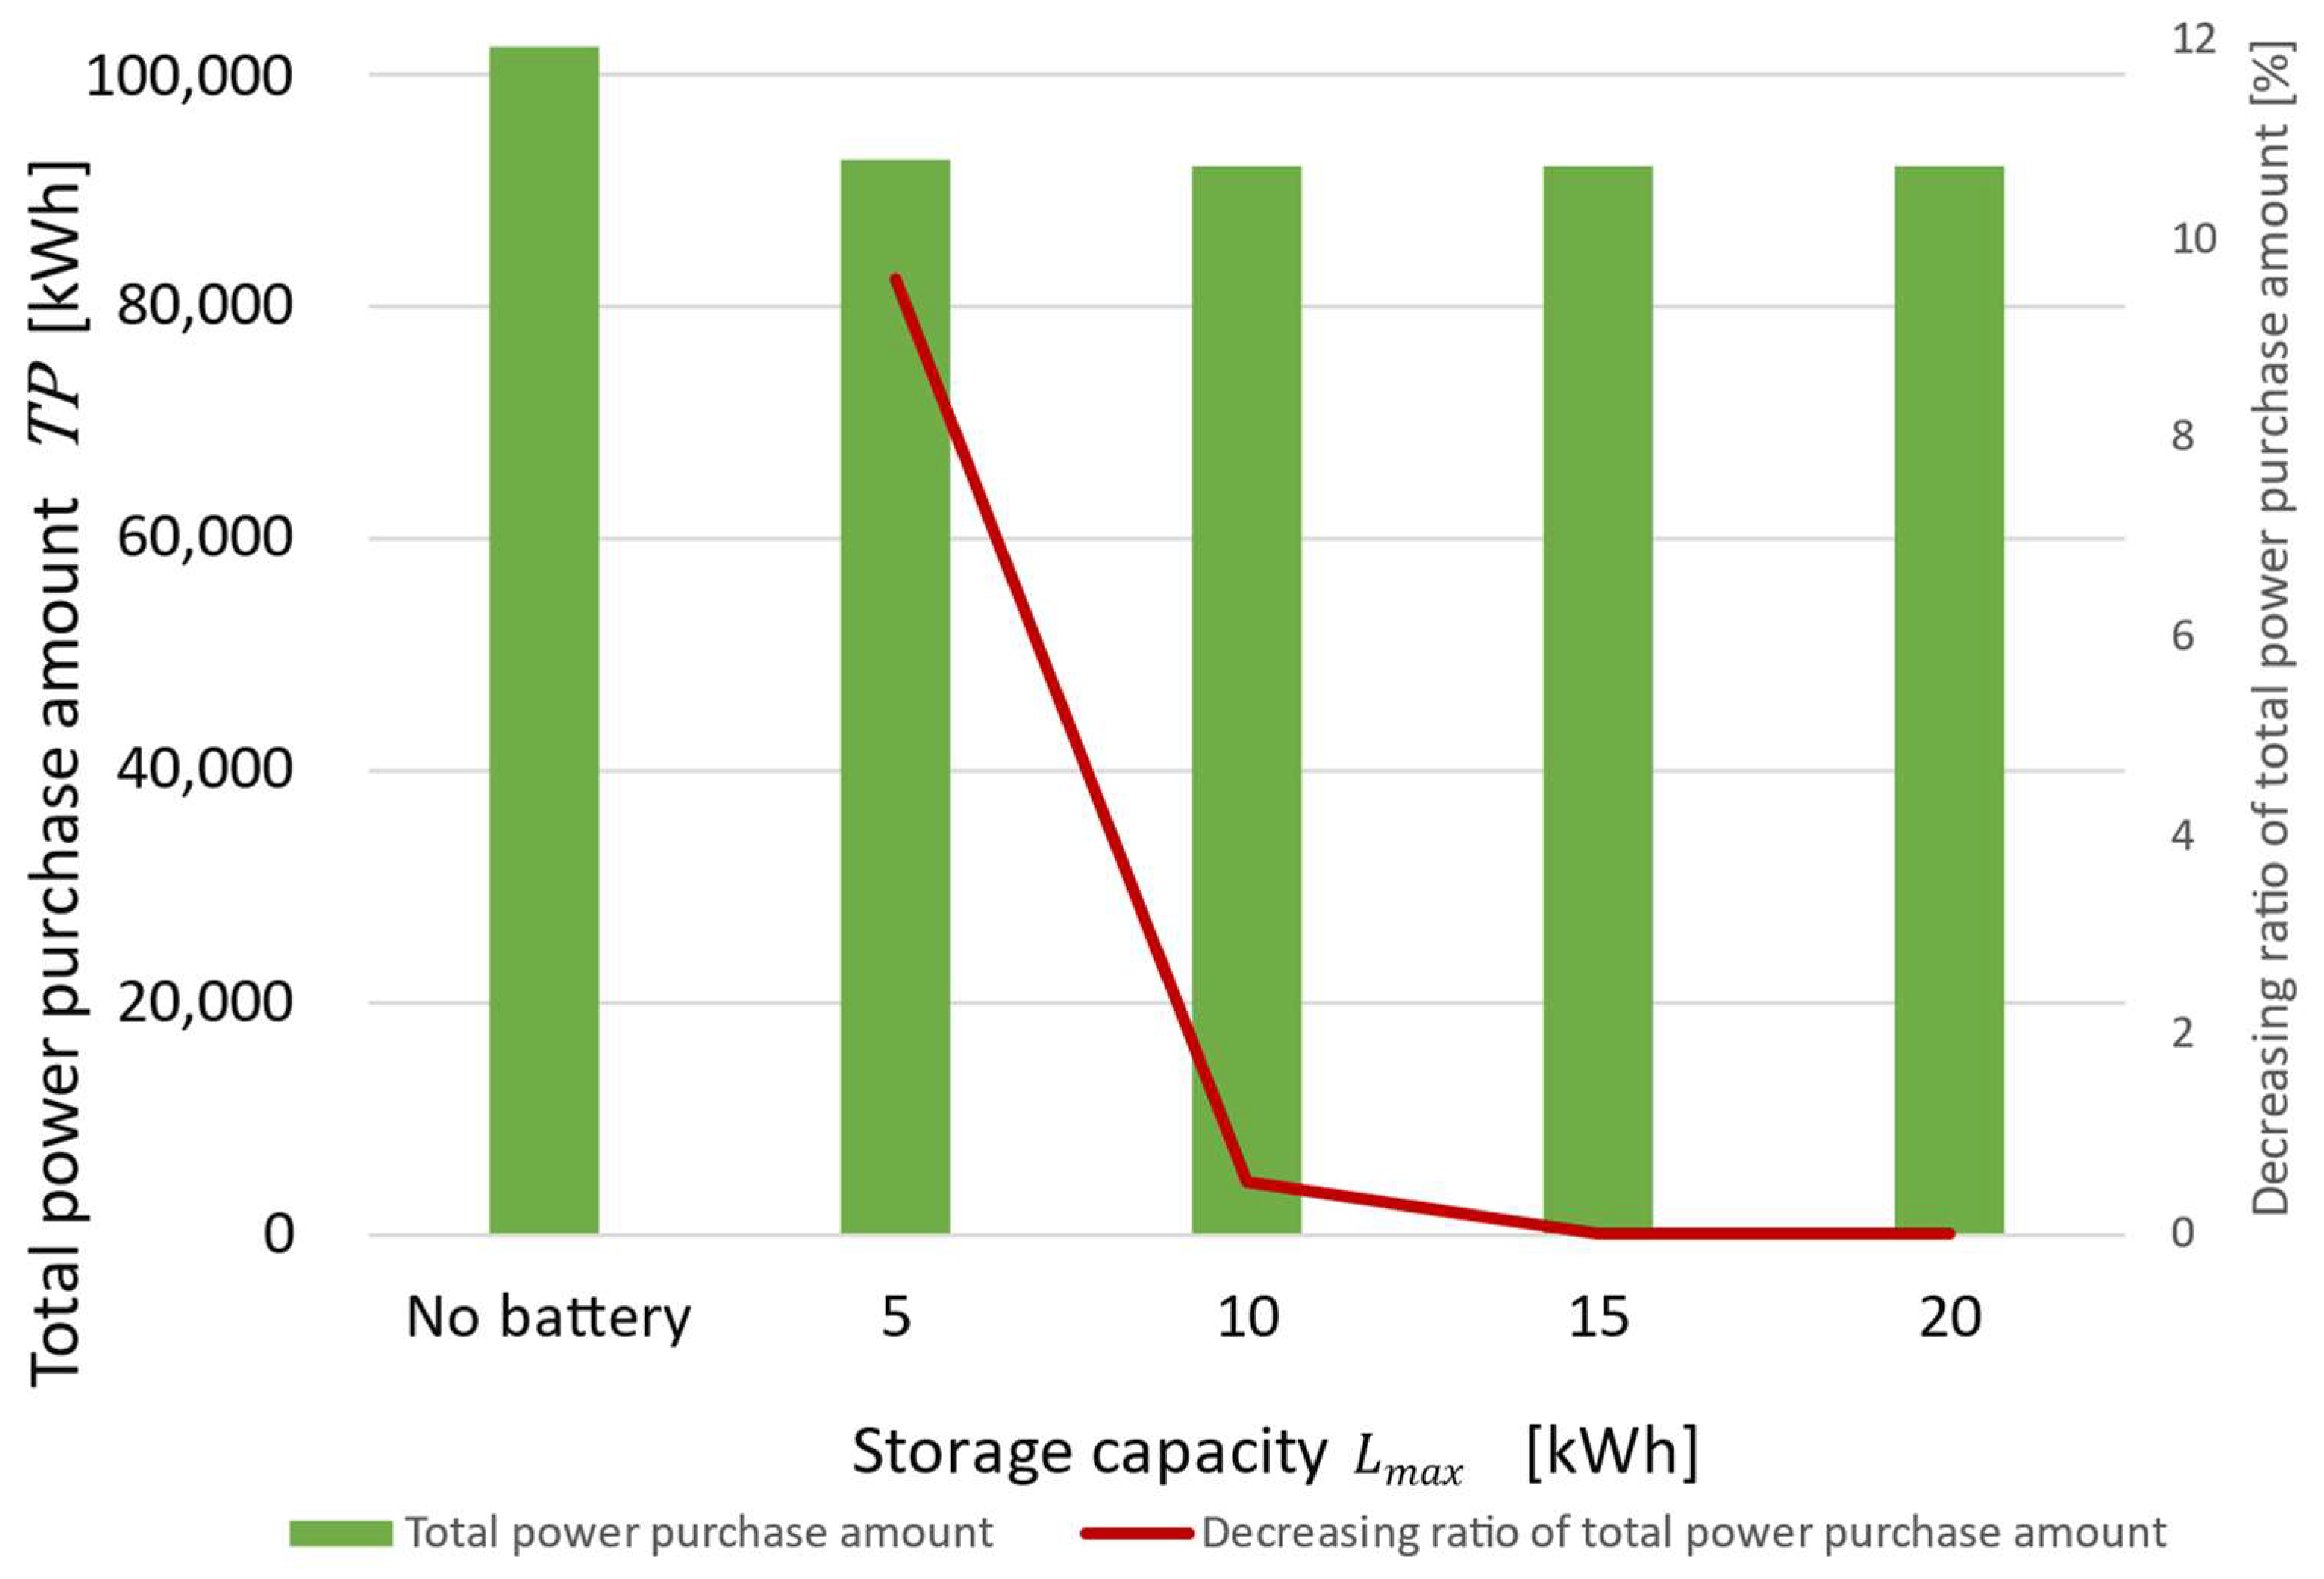
4.4. Sensitivity Analysis of Total Purchased Power with the Storage Capacity of the Storage Battery (RQ2)
5. Capacity Planning for Solar Power Generation and Storage Battery
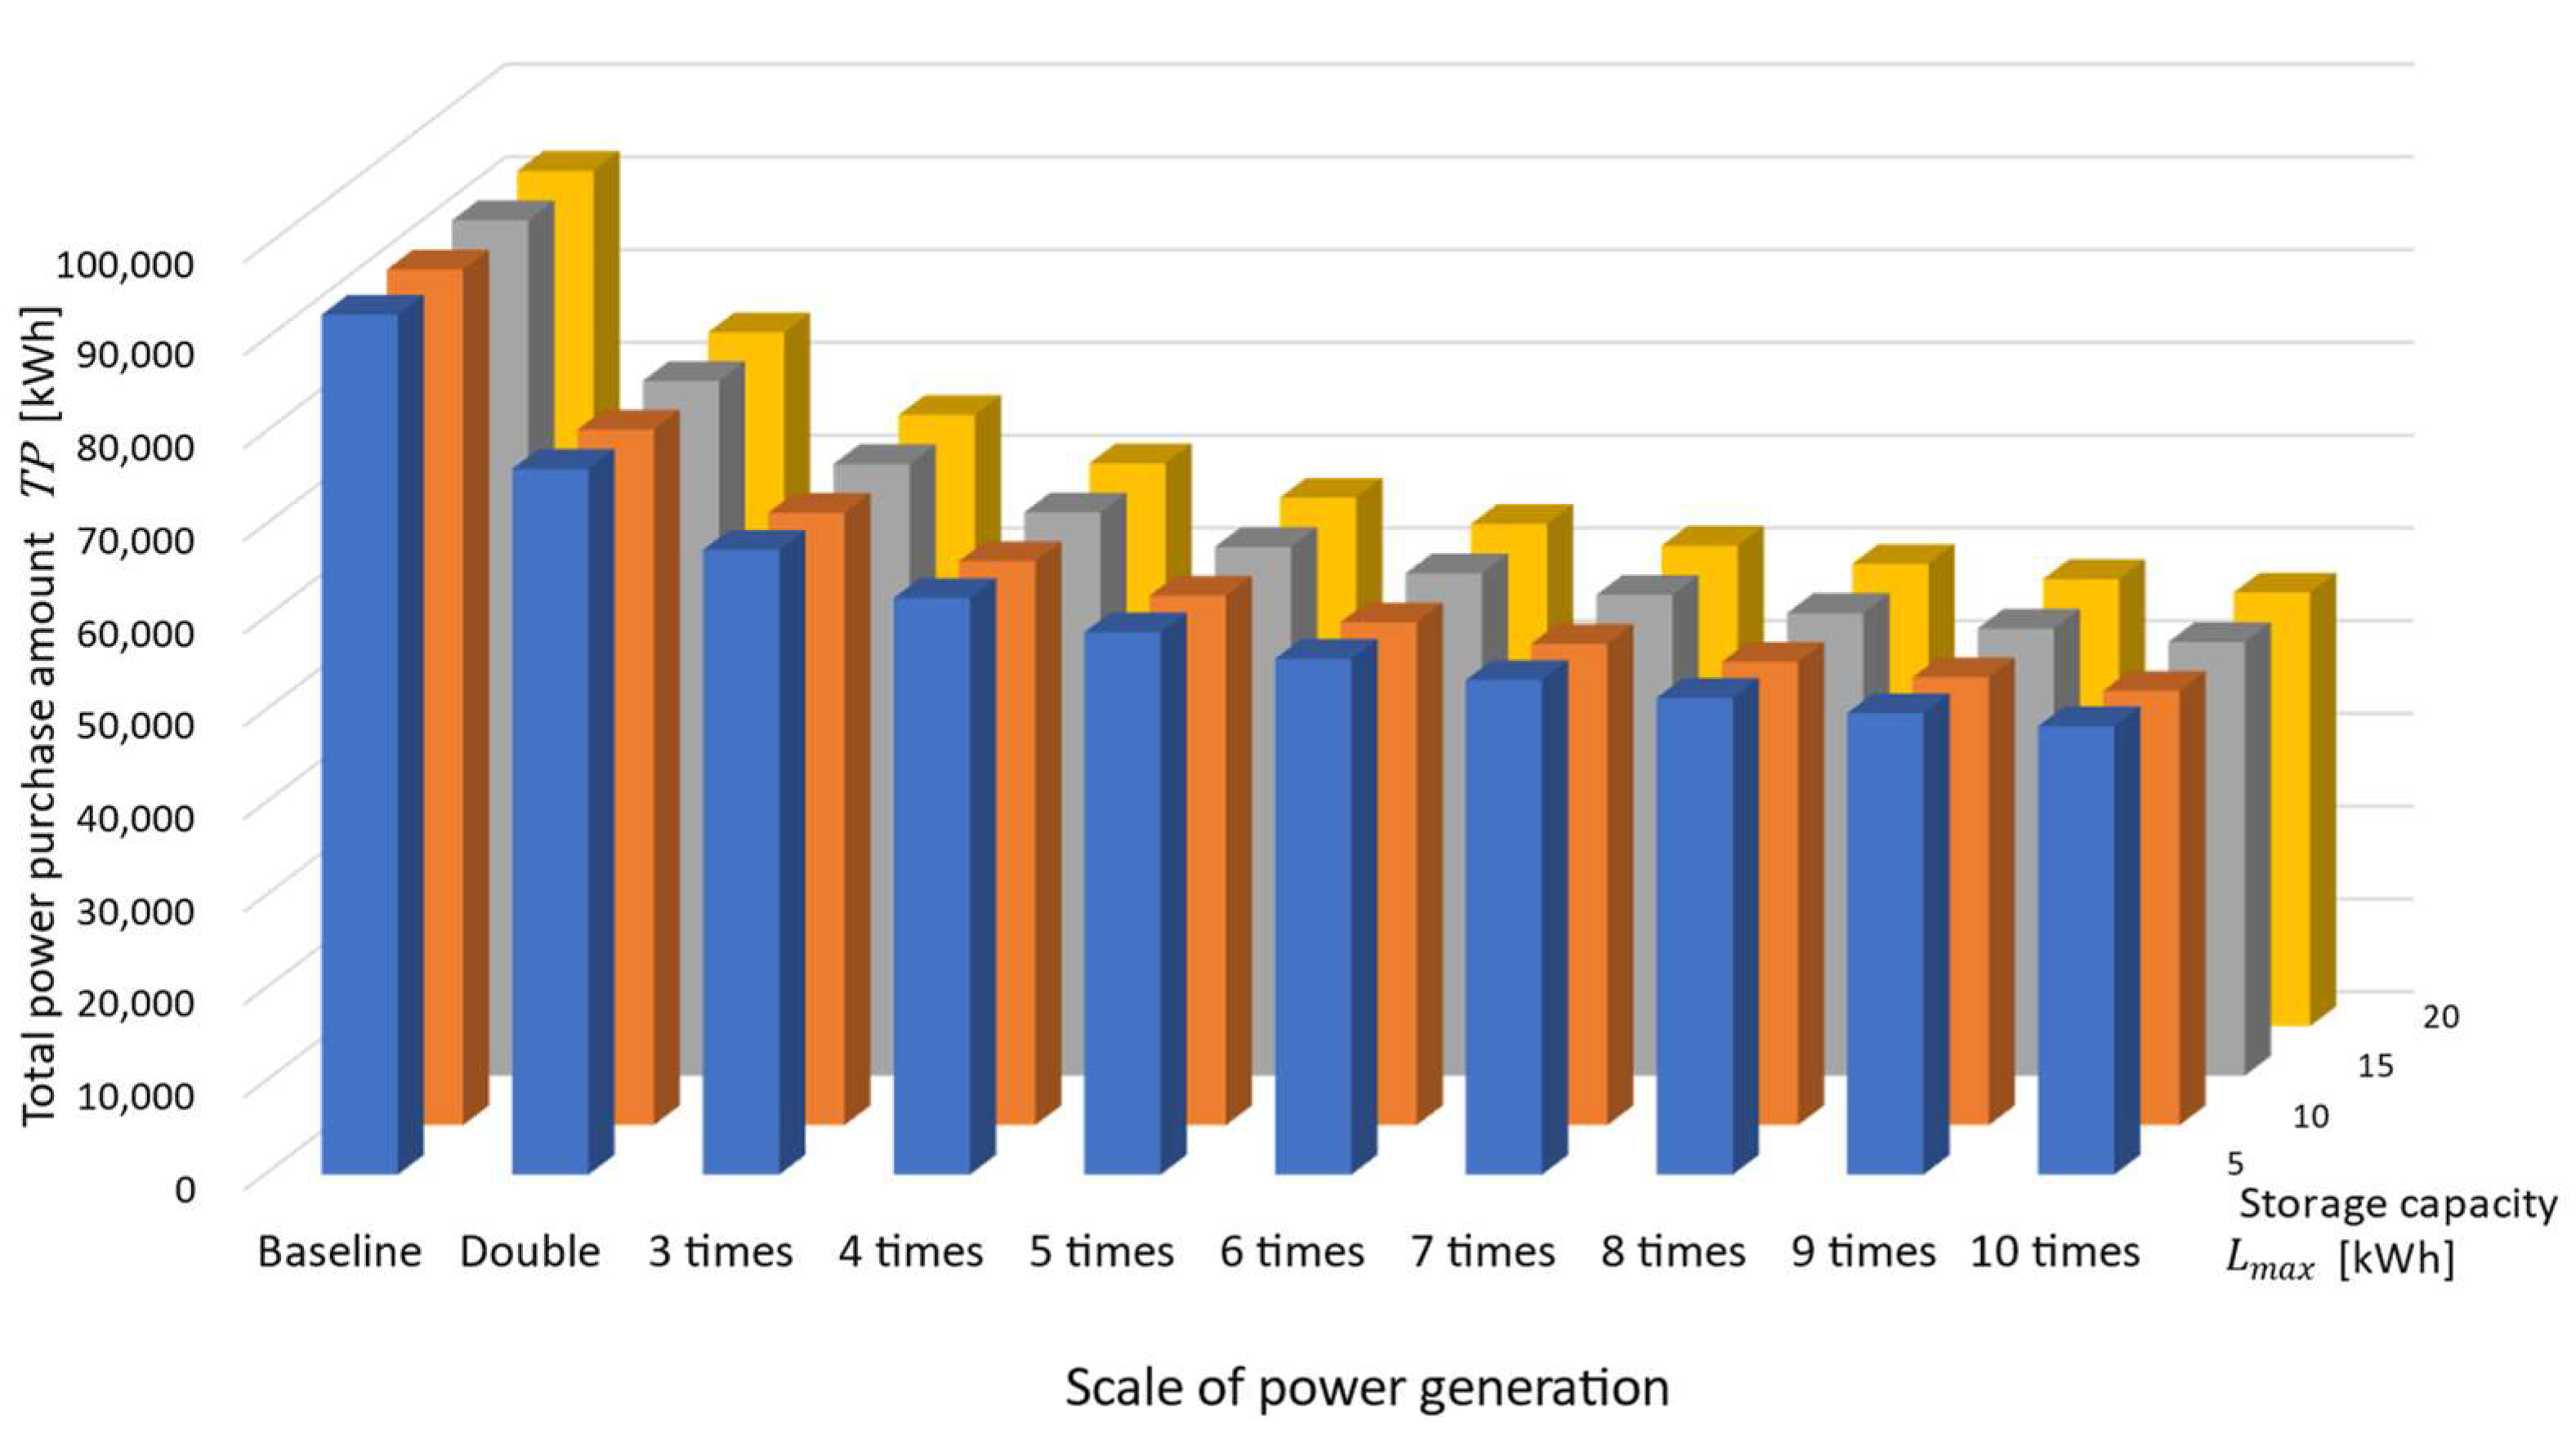
5.1. Sensitivity Analysis of Total Purchased Power with the Scale of Solar Power Generation (RQ2)
5.2. Sensitivity Analysis of the Total Power Purchase Amount with Respect to the Scale of Power Generation and Storage Capacity (RQ3)
5.3. Comparison of Proposed Demand-to-Supply Management Method and Conventional Purchasing Method for the Supply Shortage (RQ4)
6. Discussion
- RQ1. How much are differences between the amount of power generation and power consumption monthly or seasonally?
- RQ2. How much does the total power purchase amount change when the scale of power generation or storage capacity are increased?
- RQ3. How much the solar power generation scale and the storage capacity are required to reduce the total power purchase amount through solar energy demand-to-supply management that makes it economical and effective?
- RQ4. What are the advantages of the proposed method compared to the conventional purchasing method for the supply shortage in terms of the total power purchase amount?
7. Conclusions and Future Studies
Author Contributions
Funding
Institutional Review Board Statement
Informed Consent Statement
Data Availability Statement
Acknowledgments
Conflicts of Interest
Appendix A
Appendix A.1. Calculation of the Power Purchase Amount in Period , Using Conventional Purchasing Method for the Supply Shortage in Section 5.3
Appendix A.2. Feedback
- We received a comment regarding the decision to install batteries for a company. They described that “The decision on whether or not to install batteries is made first, and then the storage capacity is considered in a company. Therefore, a company will be more willing to install batteries if the effectiveness of the proposed method can be demonstrated in case which the amount of solar power generation is larger than that of power consumption at many times”.
- We also received a positive opinion regarding the application of the on-demand cumulative control method and conducting solar power dynamic demand-to-supply management. They evaluated that “The case of conducting solar power dynamic demand-to-supply management for each time by using proposed method is not widely used. However, the cost of electricity has been more expensive, and the view of rising the cost of electricity becomes more severe for companies.” This feedback means that the method proposed in this study is useful and solar power dynamic demand-to-supply management has the potential to be helpful in actual workspaces in the future.
References
- Gao, L.; Hiruta, Y.; Ashina, S. Promoting renewable energy through willingness to pay for transition to a low carbon society in Japan. Renew. Energy 2020, 162, 818–830. [Google Scholar] [CrossRef]
- Agyekun, E.B.; PraveenKumar, S.; Alwan, N.T.; Velkin, V.I.; Adebayo, T.S. Experimental study on performance enhancement of a photovoltaic module using a combination of phase change material and aluminum fins-Exergy, Energy and Economic (3E) Analysis. Inventions 2021, 6, 69. [Google Scholar] [CrossRef]
- Kasagi, H. Renewable Energy and Environmental Issues: Being Tested the Power of Local Communities; Local Government Research Inc.: Tokyo, Japan, 2021. (In Japanese) [Google Scholar]
- Ministry of the Environment and National Institute for Environmental Studies, Japan’s National Greenhouse Gas Emissions and Removals in Fiscal Year 2021 (Final Figures). Available online: https://www.nies.go.jp/whatsnew/2023/20230421-attachment01.pdf (accessed on 6 September 2023). (In Japanese).
- Baker, E.; Fowlie, M.; Lemoine, D.; Reynolds, S.S. The Economics of Solar Electricity. Annu. Rev. Resour. Econ. 2013, 5, 387–426. [Google Scholar] [CrossRef]
- Trappey, A.J.C.; Trappey, C.V.; Liu, P.H.Y.; Lin, L.; Ou, J.J.R. A hierarchical cost learning model for net-zero energy operations. Int. J. Prod. Econ. 2013, 146, 386–391. [Google Scholar] [CrossRef]
- Pham, A.; Jin, T.; Novoa, C.; Qin, J. A multi-site production and microgrid planning model for net-zero energy operations. Int. J. Prod. Econ. 2019, 218, 260–274. [Google Scholar] [CrossRef]
- Behzadi, A.; Thorin, E.; Duwig, C.; Sadrizadeh, S. Supply-demand side management of building energy system driven by solar and biomass in Stockholm: A smart integration with minimal cost and emission. Energy Convers. Manag. 2023, 292, 117420. [Google Scholar] [CrossRef]
- Huy, T.H.B.; Dinh, H.T.; Kim, D. Multi-objective framework for a home energy management system with the integration of solar energy and an electric vehicle using an augmented ε-constraint method and lexicographic optimization. Sustain. Cities Soc. 2023, 88, 104289. [Google Scholar] [CrossRef]
- Gelchu, M.A.; Ehnberg, J.; Shiferaw, D.; Ahlgren, E.O. Impact of demand-side management on the sizing of autonomous solar PV-based mini-grids. Energy 2023, 278, 127884. [Google Scholar] [CrossRef]
- Al-Habaibeh, A.; Bashar Moh’d, B.A.; Massoud, H.; Nweke, O.B.; Takrouri, M.A.; Badr, B.E. Solar energy in Jordan: Investigating challenges and opportunities of using domestic solar energy systems. World Dev. Sustain. 2023, 3, 100077. [Google Scholar] [CrossRef]
- Biazetto, P.H.F.; de Andrade, G.A.; Normey-Rico, J.E. Development of an Optimal Control Strategy for Temperature Regulation and Thermal Storage Operation of a Solar Power Plant Based on Fresnel Collectors. IEEE Trans. Control Syst. Technol. 2023, 31, 1149–1164. [Google Scholar] [CrossRef]
- Shi, Z.; Wang, W.; Huang, Y.; Li, P.; Dong, L. Simultaneous Optimization of Renewable Energy and Energy Storage Capacity with the Hierarchical Control. CSEE J. Power Energy Syst. 2022, 8, 95–104. [Google Scholar] [CrossRef]
- Mohebi, P.; Roshandel, R. Optimal design and operation of solar energy system with heat storage for agricultural greenhouse heating. Energy Convers. Manag. X 2023, 18, 100353. [Google Scholar] [CrossRef]
- Romero-Ramos, J.A.; Gil, J.D.; Gardemil, J.M.; Escobar, R.A.; Arias, I.; Perez-Garcia, M. A GIS-AHP approach for determining the potential of solar energy to meet the thermal demand in southeastern Spain productive enclaves. Renew. Sustain. Energy Rev. 2023, 176, 113205. [Google Scholar] [CrossRef]
- Rentizelas, A.A.; Tolis, A.I.; Tatsiopoulos, I.P. Investment planning in electricity production under CO2 price uncertainty. Int. J. Prod. Econ. 2012, 140, 622–629. [Google Scholar] [CrossRef]
- Ledmaoui, Y.; Maghraoui, A.E.; Aroussi, M.E.; Saadane, R.; Chebak, A.; Chehri, A. Forecasting solar energy production: A comparative study of machine learning algorithms. Energy Rep. 2023, 10, 1004–1012. [Google Scholar] [CrossRef]
- Zhang, N.; Sun, Q.; Yang, L.; Li, Y. Event-Triggered Distributed Hybrid Control Scheme for the Integrated Energy System. IEEE Trans. Ind. Inform. 2022, 18, 835–846. [Google Scholar] [CrossRef]
- Yang, L.; Li, X.; Sun, M.; Sun, C. Hybrid Policy-Based Reinforcement Learning of Adaptive Energy Management for the Energy Transmission-Constrained Island Group. IEEE Trans. Ind. Inform. 2023, 19, 10751–10762. [Google Scholar] [CrossRef]
- Ijuin, H.; Yamada, S.; Yamada, T.; Takanokura, M.; Matsui, M. Solar Energy Demand-to-Supply Management by the On-Demand Cumulative-Control Method: Case of a Childcare Facility in Tokyo. Energies 2022, 15, 4608. [Google Scholar] [CrossRef]
- Matsui, M.; Uchiyama, H.; Hujikawa, H. Progressive-curve-based control of nventory fluctuation under on-demand SCM. Jpn. Ind. Manag. Assoc. 2005, 56, 139–145. (In Japanese) [Google Scholar] [CrossRef]
- Kato, T.; Ijuin, H.; Yamada, T.; Takanokura, M.; Matsui, M. A Case Study on Power Purchase and Charge Switching Using a Storage Battery in Solar Power Generation. J. Soc. Plant Eng. Jpn. 2022. submitted (In Japanese) [Google Scholar]
- Ecolomy Co., Ltd. Website. Available online: https://www.ecolomy.co.jp (accessed on 6 November 2022). (In Japanese).
- New Energy and Industrial Technology Development Organization (NEDO), Solar Radiation Database. Available online: https://appww2.infoc.nedo.go.jp/appww/index.html (accessed on 6 December 2022). (In Japanese).
- Kurokawa, K.; Tanaka, R.; Ito, M. Medium and Large Scale of Solar Power Generation Systems—Foundation, Planning, Design, Construction, Operation Management, Maintenance, and Inspection; Ohmsha, Inc.: Tokyo, Japan, 2016. (In Japanese) [Google Scholar]
- Asada, K.; Iwasaki, T.; Aoyama, Y. An Introduction to Demand Forecasting for Inventory Management; Toyo Keizai Inc.: Tokyo, Japan, 2004. (In Japanese) [Google Scholar]
- Matsui, M.; Hujikawa, H.; Ishi, N. Supply Chain Management Towards Post ERP/SCM; Asakura Publishing Co., Ltd.: Tokyo, Japan, 2009. (In Japanese) [Google Scholar]


Disclaimer/Publisher’s Note: The statements, opinions and data contained in all publications are solely those of the individual author(s) and contributor(s) and not of MDPI and/or the editor(s). MDPI and/or the editor(s) disclaim responsibility for any injury to people or property resulting from any ideas, methods, instructions or products referred to in the content. |
© 2023 by the authors. Licensee MDPI, Basel, Switzerland. This article is an open access article distributed under the terms and conditions of the Creative Commons Attribution (CC BY) license (https://creativecommons.org/licenses/by/4.0/).
Share and Cite
Takada, A.; Ijuin, H.; Matsui, M.; Yamada, T. Seasonal Analysis and Capacity Planning of Solar Energy Demand-to-Supply Management: Case Study of a Logistics Distribution Center. Energies 2024, 17, 191. https://doi.org/10.3390/en17010191
Takada A, Ijuin H, Matsui M, Yamada T. Seasonal Analysis and Capacity Planning of Solar Energy Demand-to-Supply Management: Case Study of a Logistics Distribution Center. Energies. 2024; 17(1):191. https://doi.org/10.3390/en17010191
Chicago/Turabian StyleTakada, Akihiko, Hiromasa Ijuin, Masayuki Matsui, and Tetsuo Yamada. 2024. "Seasonal Analysis and Capacity Planning of Solar Energy Demand-to-Supply Management: Case Study of a Logistics Distribution Center" Energies 17, no. 1: 191. https://doi.org/10.3390/en17010191