Article

Agricultural Research and Development Center Design with Building Integrated Photovoltaics in Fiji

1
Department of Industrial and Systems Engineering, Dongguk University-Seoul, Seoul 04620, Republic of Korea
2
Department of Environmental Horticulture & Landscape Architecture, College of Life Science & Biotechnology, Dankook University, Cheonan-si 31116, Republic of Korea
*
Author to whom correspondence should be addressed.
Energies 2024, 17(1), 207; https://doi.org/10.3390/en17010207
Submission received: 13 November 2023 / Revised: 14 December 2023 / Accepted: 29 December 2023 / Published: 30 December 2023
(This article belongs to the Special Issue Building Integrated Photovoltaics: Present and Future)

Abstract

:
Building-integrated photovoltaics (BIPVs) entail the use of photovoltaics as building materials, such as windows, roofs, and walls. Owing to their electricity-generation ability, BIPVs have become popular building materials for green buildings. This study involves an economic feasibility analysis of BIPVs for an agricultural research and development center in Fiji. The computerized relative allocation of facilities technique (CRAFT) is extended for cost-efficient facility design, and the levelized cost of electricity (LCOE) of BIPVs is evaluated to identify feasible alternatives from among three options, namely roof-integrated, window, and rooftop BIPVs. From the experiments, the LCOE values of the roof-integrated, window, and rooftop BIPVs were USD 0.13/kWh, 0.17/kWh, and 0.09/kWh, respectively. Moreover, the profit for the window BIPV was negative when the discount rate was greater than 0.08 due to its inefficient productivity. Contrarily, the roof-integrated BIPV showed a reasonable LCOE even though it required the highest investment cost. Nevertheless, further efforts are needed to reduce the cost of BIPVs for practical implementation.

1. Introduction

In recent years, photovoltaic (PV) modules have been widely used to generate electricity from solar energy, which is one of the best renewable energy sources, to reduce greenhouse gas (GHG) emissions [1]. The solar energy production cost via PV modules was USD 126/MWh in 2020, which was not competitive with those of existing energy sources such as coal (USD 88/MWh), natural gas (USD 71/MWh), and nuclear materials (USD 69/MWh) [2]. However, owing to its popularity and the global attention on renewable energy usage, there were significant efforts to reduce electricity production costs via PV modules. Renewable energy policies like the solar investment tax credit (ITC) in the US and solar energy strategy in Europe are good examples of such efforts [3]. Therefore, in 2021, the global weighted-average levelized cost of electricity (LCOE) from utility-scale PV facilities decreased to 48/MWh, allowing them to become competitive electricity generation resources [4].
Meanwhile, the price reduction in PV modules presented another opportunity to use them as a building material. Although PV modules are installed on rooftops (i.e., as rooftop PV systems) for building energy cost reductions, they can also be used as roof-integrated PVs, skylights, outer walls, and atria, which are known as building-integrated photovoltaics (BIPVs) [5]. In addition to achieving the basic functions of building materials, BIPVs can produce renewable energy [6]. Given that buildings typically account for about 30% of global energy consumption [7], BIPVs provide an opportunity to resolve the energy consumption issue. Moreover, BIPVs can protect indoor spaces from strong solar radiation entry through windows, thereby reducing air conditioning usage during summer [8]. BIPV use offers multiple benefits, such as an innovative design, sunscreen effect, power generation, a reduction in the carbon footprint of the building, thermal insulation, acoustic insulation for increased comfort, building value increases, environmental friendliness, and sustainability [9]. Accordingly, BIPVs have become one of the fastest growing markets, with an expected compounded annual growth rate of approximately 21% between 2023 and 2030, given that the size of the global BIPV market was 19.82 billion US dollars in 2022 [10].
This study involved implementing a BIPV system in the design of an agricultural research and development center in Ovalau, Fiji. An economic feasibility analysis was conducted using the incremental cost–benefit quantitative assessment approach to evaluate three different BIPV systems, namely roof-integrated, window, and rooftop BIPVs. In the analysis, the generated electricity amounts from the BIPVs were estimated via polynomial regression using the empirical solar radiation data for Fiji, and the construction and maintenance costs of the target building were computed. Moreover, to identify the best building layout, the computerized relative allocation of facilities technique (CRAFT) [11] was extended herein, with eight design stages. The proposed design framework consists of input data and activity collection, activity relationship analysis, space requirement analysis, alternative layout design, layout evaluation, final layout determination, a feasibility analysis for BIPV installation, and building materials’ determination. Thus, the proposed framework is expected to assist engineers in utilizing BIPVs as building materials, which, in turn, can help to reduce GHG emissions.
The remainder of this paper is organized as follows. Section 2 summarizes the existing studies on facility design. Section 3 presents the design framework for the agricultural research and development center in Fiji, where the eight design stages are explained in detail. Section 4 presents the economic feasibility analysis using the incremental cost–benefit quantitative assessment approach for different BIPVs. Finally, Section 5 lists the findings and conclusions of this study.

2. Literature Review of Facility Design Approaches

Facility design is a component of facility planning that determines the means used to achieve an organizational (or business) goal [12]. For example, a manufacturing facility is designed to support its production activity; an airport is built as an interface between passengers and airlines; a hospital is designed to provide medical services to patients efficiently [13]. On average, about 8% of the gross national income is spent on new facility design each year in the US [14], which is one of the core areas of the economy. Facility design typically involves three categories: (1) facility system design, involving heating, ventilation, and air conditioning (HVAC), as well as plumbing, electrical, mechanical, and other systems, for the operation of a facility [15]; (2) layout design for arranging different spaces within the facility to achieve the desired production results [16]; and (3) handling system design by considering the movement, protection, storage, and control of the materials and products at the facility [17]. Although all of these topics are important when aiming to achieve a cost-efficient building, layout design is prioritized because facility and handling system designs are usually conducted after layout design [12].
Layout design consists of seven tools: (1) affinity diagram to gather ideas and issues identifying key design items [18]; (2) interrelationship digraph to analyze the relationships between the design items [19]; (3) tree diagram to illustrate actions to realize the identified design items [12]; (4) prioritization matrix to determine the relative importance of the design evaluation criteria [20]; (5) contingency diagram to map conceivable events and contingencies occurring during the implementation of a facility design [21]; (6) matrix diagram to delegate tasks and organize key project information [12]; (7) activity network diagram to develop a work schedule for facility design implementation [22]. Using these seven tools simultaneously, an appropriate initial layout of a facility can be designed. However, there are algorithmic approaches to constructing the optimum layout in terms of the internal transportation costs between different spaces within a facility. For example, the graph-based method enables the rapid design of an initial layout of the facility based on a formalized procedure with an adjacency score [23]. To achieve this end, a block layout, a relationship diagram, and the space requirements are used. Equation (1) represents the expression used to calculate the adjacency score in the graph-based method:
max z = i = 1 m 1 j = 1 m f i j x i j
where x i j is a binary adjacency score whose value is one when spaces i and j are adjacent; f i j is a relationship weight between spaces i and j. In addition, the pairwise exchange method was devised to identify the optimum facility layout in terms of the minimum total cost of transporting materials between the spaces in the facility; unlike the seven tools and graph-based method, this is an analytical approach to designing a facility. Nevertheless, it requires excessive computations for the facility design, so CRAFT [11] was developed to achieve the optimum facility layout with fewer computations for the agricultural research and development center design. Although CRAFT generally only finds the local optimum solution, it is flexible with respect to the department shapes and helps to easily identify the initial layout with reasonable accuracy; hence, it is a popular approach for facility layout design [12]. Therefore, CRAFT was adopted in this study to design the agricultural research and development center in Ovalau, Fiji.

3. Agricultural Research and Development Center Design

This study aimed to design an agricultural research and development center equipped with BIPVs, whose overall facility design framework is as shown in Figure 1. Once the input data and activities of the facility are collected, both the activity relationships between areas and space requirements are analyzed to generate design alternatives. As mentioned in Section 2, although there are multiple layout design approaches, this study adopts CRAFT [11] as it mitigates transportation costs between the spaces in the facility with reasonable computational effort. After determining the final layout, a feasibility analysis is conducted for the installation of BIPVs. The following sections describe the major steps shown in Figure 1 in detail.

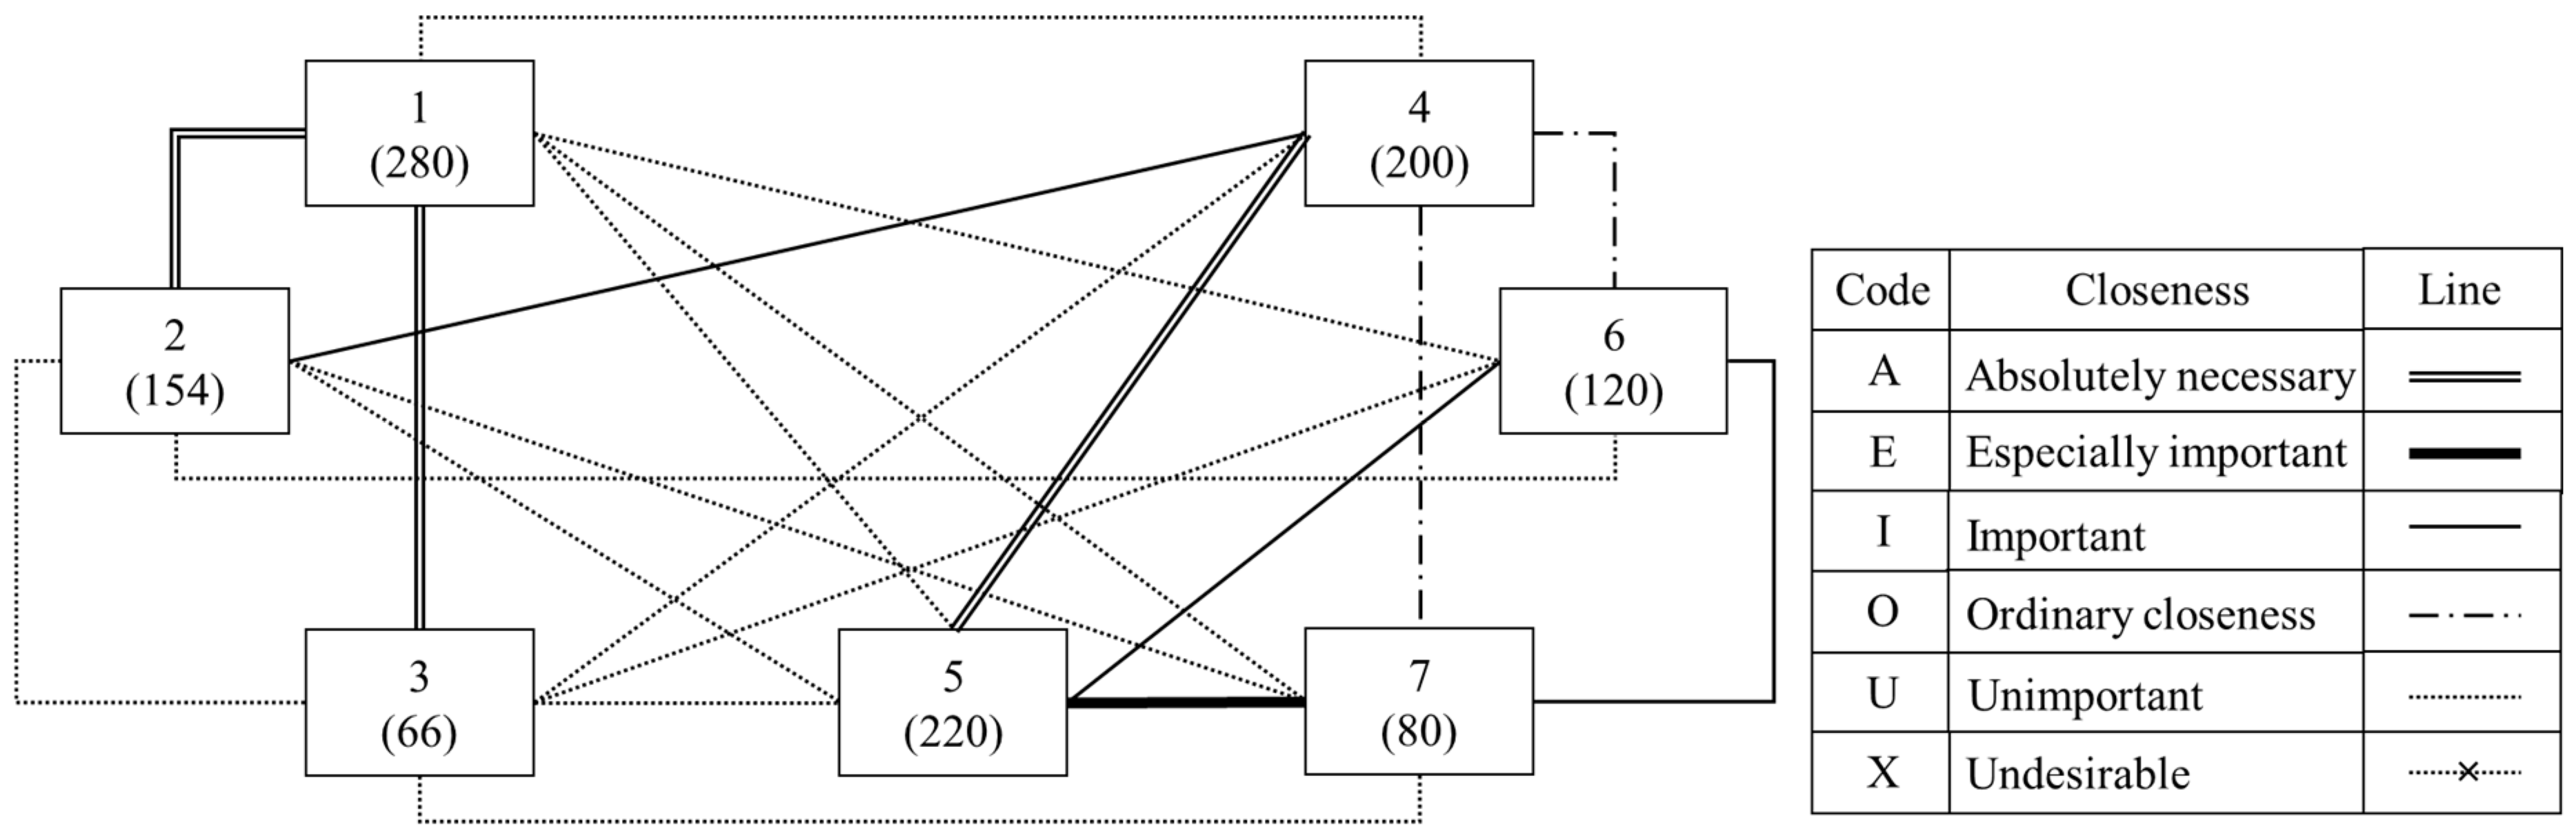
3.1. Activity Relationship Analysis

The activity relationship analysis results in a relationship diagram illustrating material flows between the areas. According to a previous work [24], activity relationships are classified into six categories: absolutely necessary (A), especially important (E), important (I), ordinary closeness (O), unimportant (U), and undesirable (X). Table 1 describes the daily material flows between various areas of the agricultural research and development center in Ovalau, Fiji.
Based on the material flows illustrated in Table 1, the activity relationships between spaces and their relationship diagram are illustrated in Figure 2. For example, the machinery storage space has absolutely necessary (A) relationships with the crop processing and part storage spaces for reasons such as convenience (C), same personnel use (S), and flow of materials (F). The laboratory space has an absolutely necessary (A) relationship with the office space for material flow. In the relationship diagram, the different styles of the bidirectional lines between the areas reflect the importance of the corresponding relationships.

3.2. Space Requirement Analysis

Table 2 describes the space requirements of the areas in the agricultural research and development building. The total size of the building is 1120 m2 (56 m × 20 m), of which machinery storage requires the largest space because of the need to park tractors, trailers, and trucks.
According to the space requirements, Figure 2 can be reconfigured into a space relationship diagram that also includes the relationship information. Figure 3 shows the space a relationship diagram of the designed facility; this diagram is used to define an initial facility layout at the alternative layout design stage.

3.3. Alternative Layout Design

The diagram in Figure 3 can be converted to a feasible alternative block layout. Since the proposed framework identifies the best layout via CRAFT (Section 3.4), an initial block layout is devised using the space relationship diagram based on the judgment and experience of an expert. Figure 4 represents the initial proposed block layout.

3.4. Layout Evaluation

Layout evaluation intends to minimize the distance-based score (z), as shown in Equation (2):
min z = i = 1 m j = 1 m f i j c i j d i j
where m is the number of spaces (or departments); f i j indicates material flow from spaces i to j; c i j is the cost of moving from space i to space j; d i j is the distance between spaces i and j. Note that the distance is calculated as the rectilinear distance between the centroids of the spaces. Table 3 describes the distance matrix of the initial block layout shown in Figure 4.
If we assume that c i j is a unit cost of USD 1, the total cost of the initial layout is USD 24,127 (see Table 4 for more details). According to the rules of CRAFT, spaces with the maximum costs are considered the most significant relationships [12]. Therefore, the utility room has to be placed next to the conference room and laboratory to reduce the total layout cost. Similarly, it is better to move the crop processing space next to the office. However, in this case, because of the shape of the building, part storage needs to be relocated with the crop processing space.

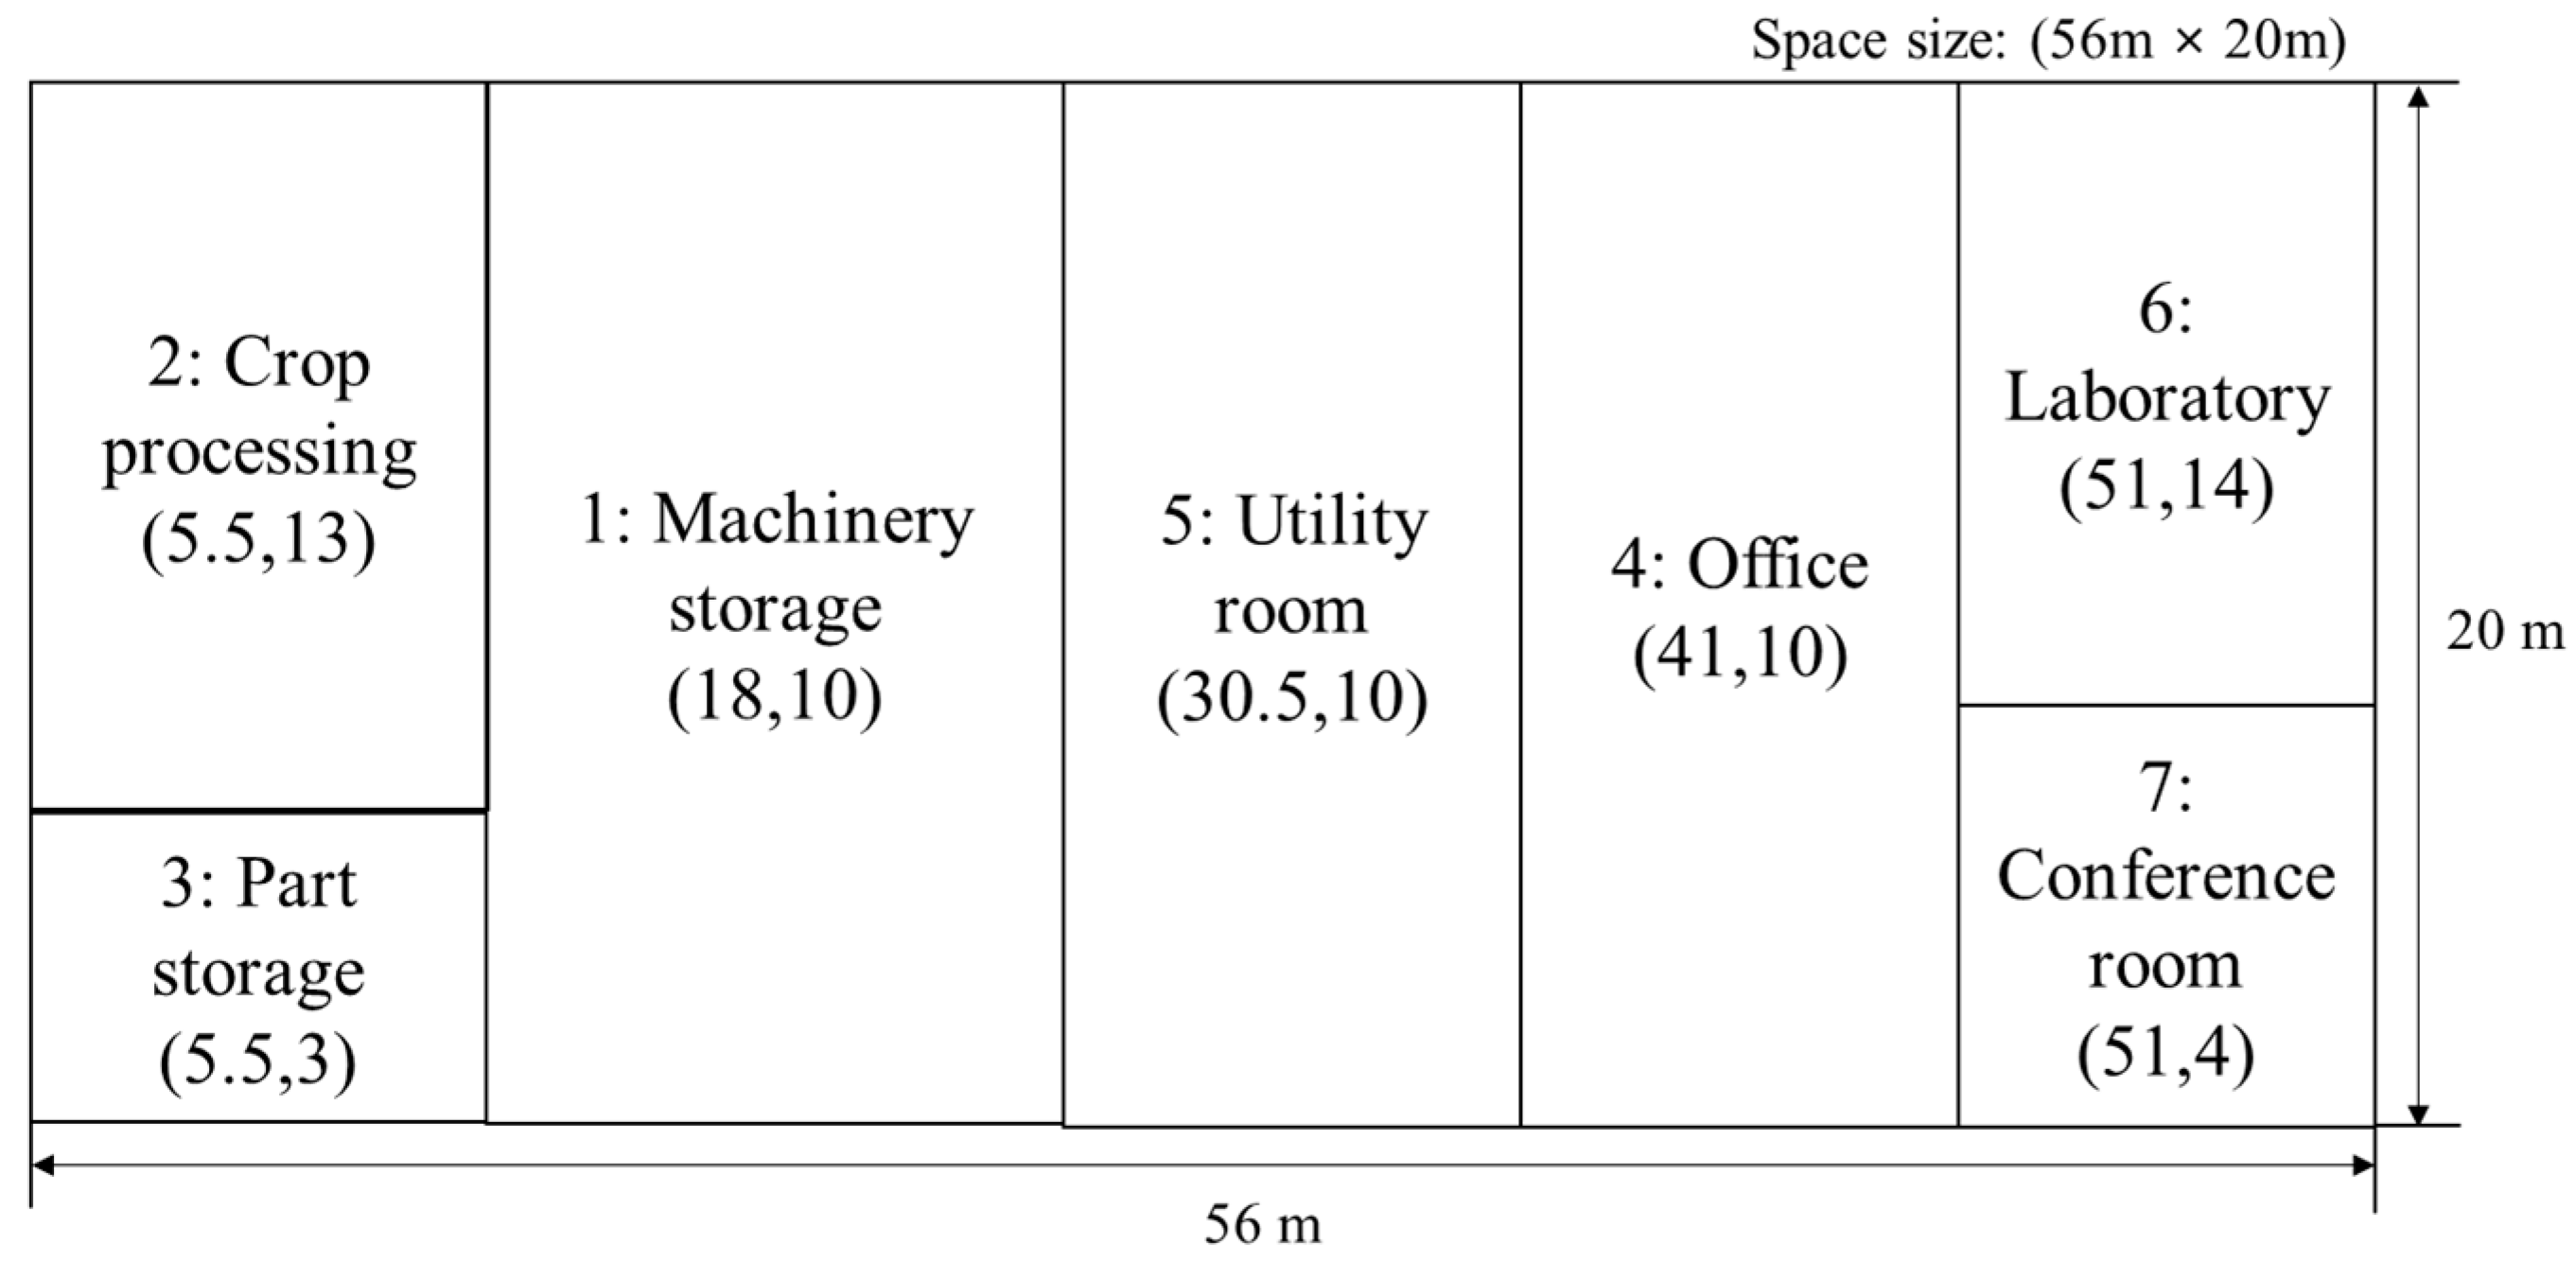
3.5. Final Layout Determination

Using CRAFT, the final layout is selected as shown in Figure 5. The total layout cost is USD 21,247, which is the minimum total cost among multiple alternative layouts. This layout lowers the total cost by USD 2880 compared to that of the initial layout in Figure 4.
The detailed cost information between spaces is described in Table 5, which shows that most spaces with high costs are appropriately located. Although there is a possibility of moving the office space next to the laboratory and conference room by switching it with the utility room (see Table 5), this results in an increased total cost of USD 22,731. Therefore, the layout optimization is terminated because no significant cost reduction is obtained by further reorganizing the spaces.

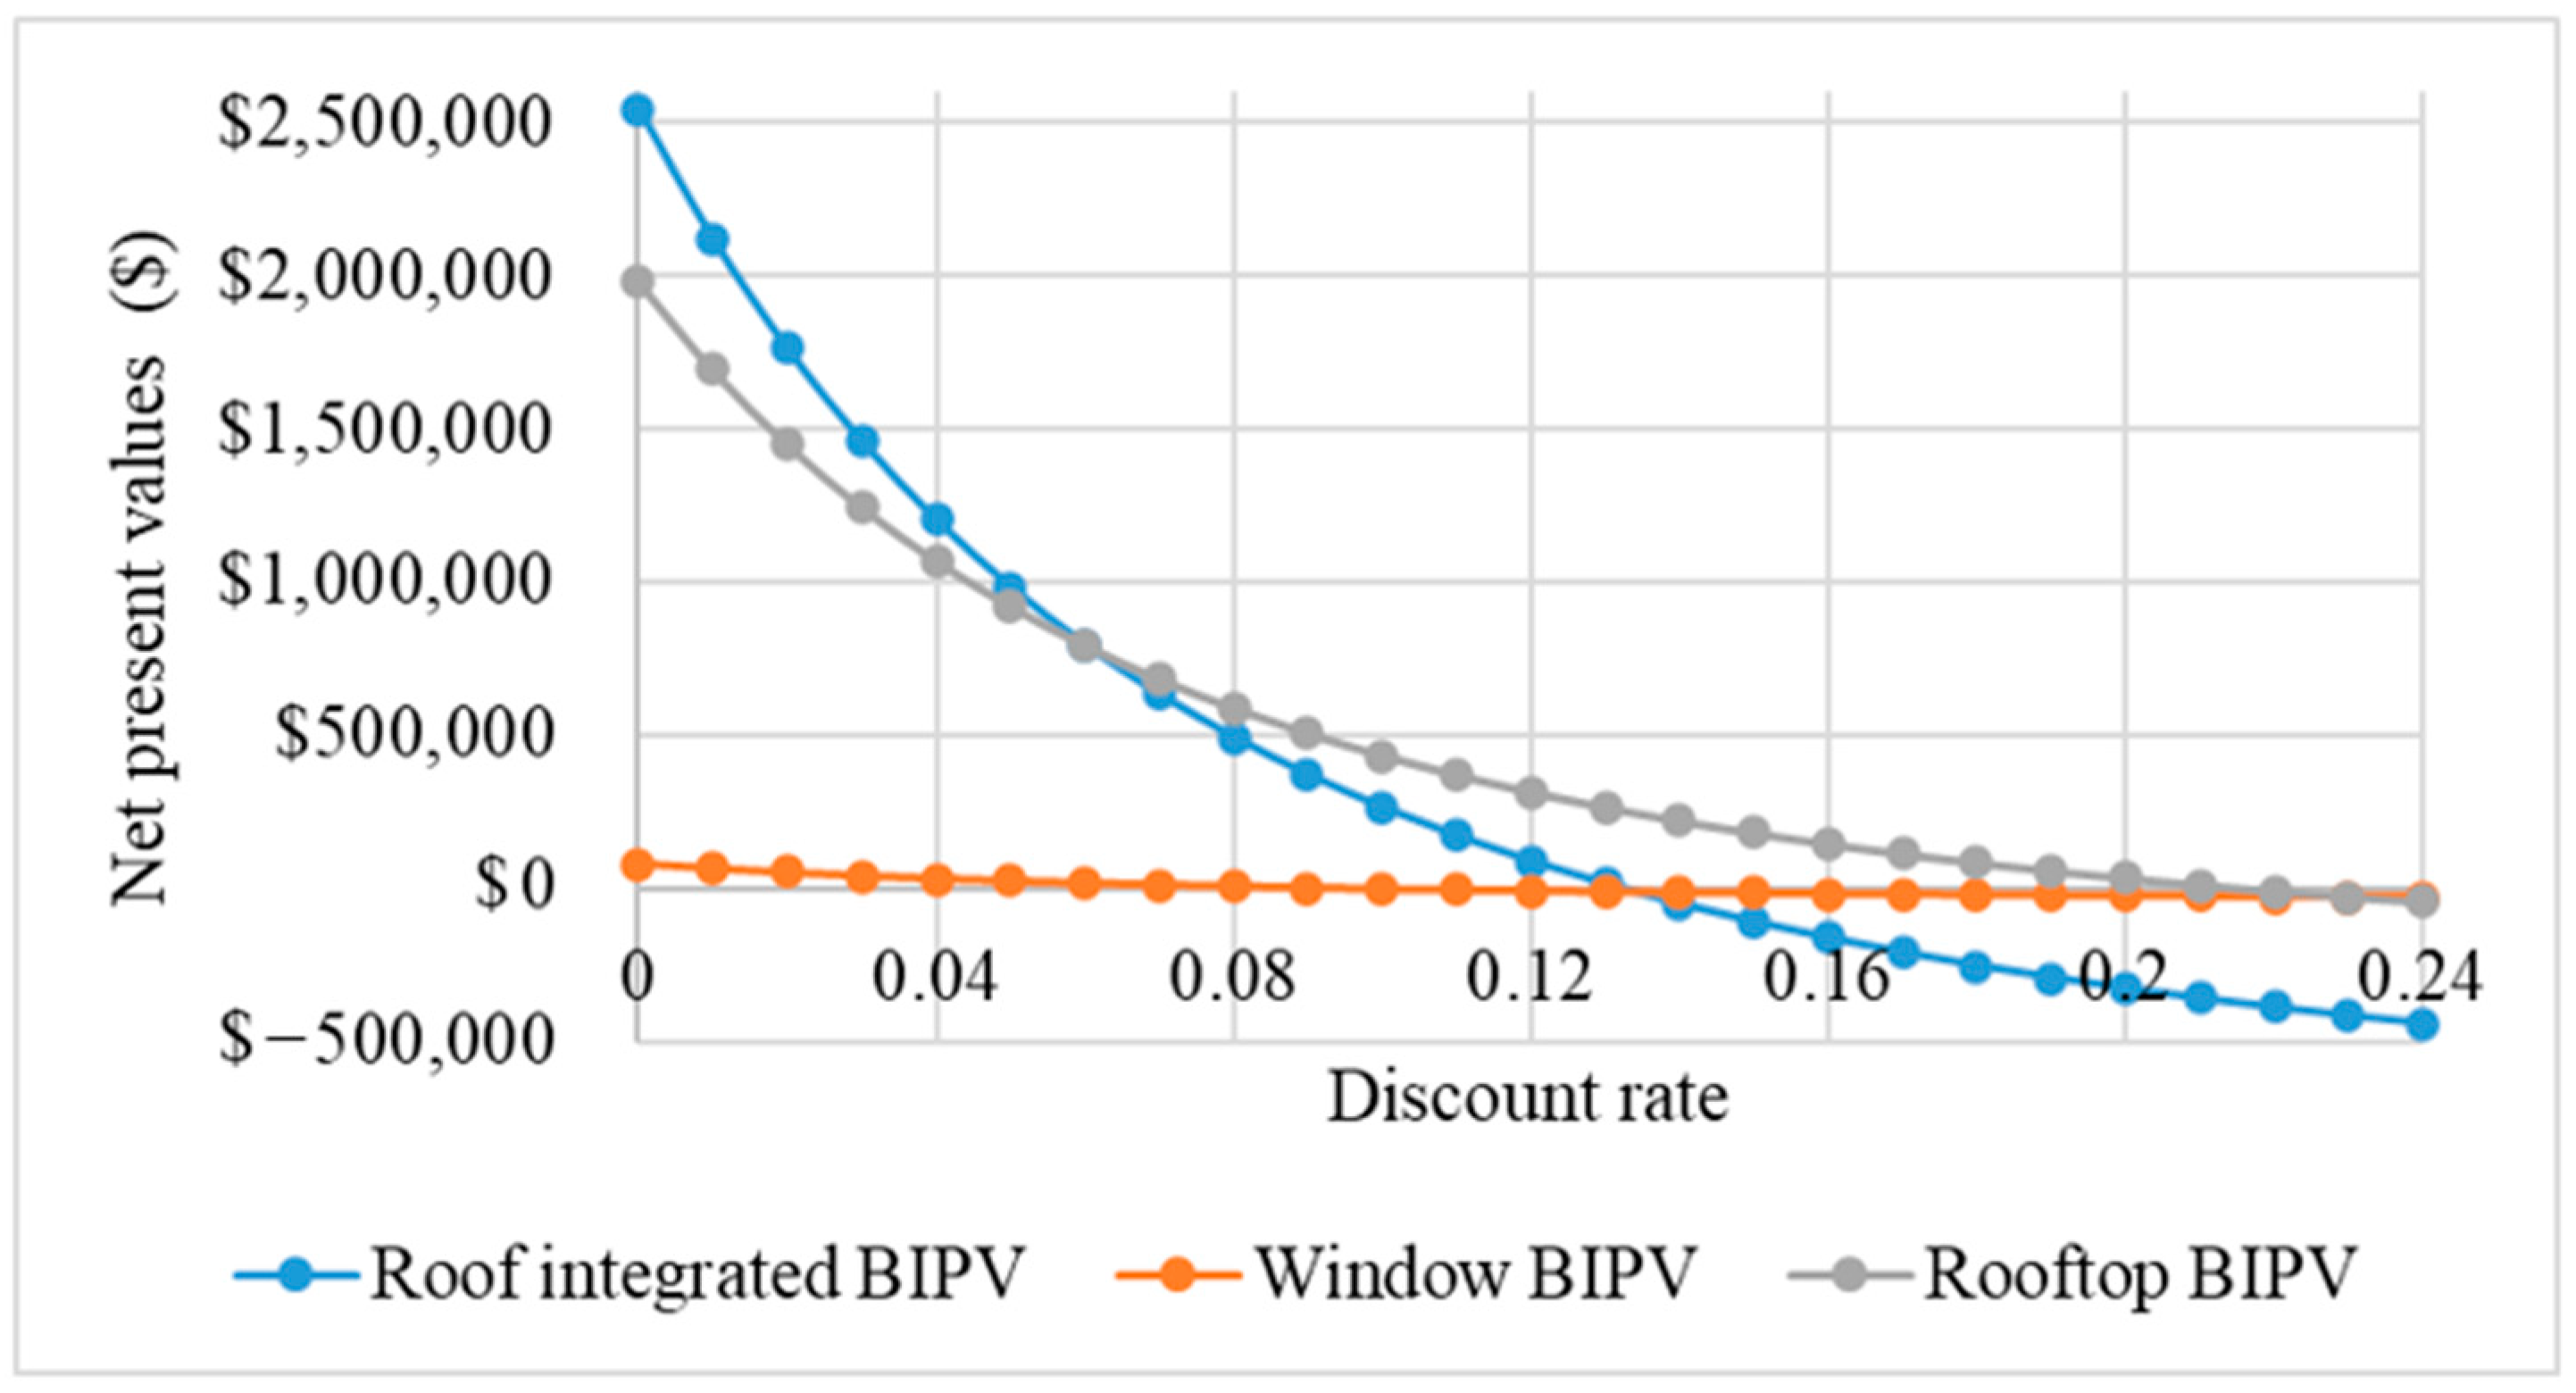
3.6. Feasibility Analysis for BIPV Installation

At this stage, the potential revenue at time t ( R e l e c t r i c i t y , t , $/day) from electricity generation with the BIPV system is estimated using Equation (3) [25]:
R e l e c t r i c i t y , t = α t E B I P V , t = α t E t X t × A × k B I P V
E t X t = 4.8777 2.8589 X t + 0.6554 X t 2 0.0476 X t 3 0
where E B I P V , t is the quantity of electricity generated (kWh/day) by the BIPV system at time t; α t is the unit price of electricity at time t ($/kWh); X t is the solar radiation per unit area at time t (kWh/m2/day); E B I P V X t is the quantity of electricity generated (kWh/m2/day) by a regular PV system at time t; A is the size of the BIPV system (m2); k is a constant reference to the electricity generation efficiency of the BIPV system ( 0 k B I P V 1 ). To estimate the performance of the BIPV system, models are developed to estimate the quantities of electricity generated using solar radiation data from 1991 to 2007 extracted by PVsyst [26] and monthly electricity generation data of monofacial PV modules, as given in [27]. Equation (4) represents the polynomial regression (PR) estimation model of the electricity generation quantity (kWh/m2/day). In fact, PR is a well-known modeling technique providing a high prediction accuracy using various polynomial functions, such as quadratic, cubic, and quartic, to accurately capture the non-linear relationship between variables [28]. It has also been applied to the electricity generation estimation of PV modules [29]. The major advantage of PR is that it can indicate the significance of a predictor via its coefficient value [30]. The coefficient of determination (R2) of Equation (4) is 0.9267, so that it can accurately estimate the performance of the BIPV system.
For comparisons between the different BIPV options, the LCOE for BIPV is utilized. Equation (5) represents the LCOE (USD/kWh) that measures the cost (USD) of the BIPV over the quantity of energy generated during its lifetime [31,32].
L C O E = t = 0 T C t t = 0 T Q t
where C t is the cost (USD) of the BIPV at time t; Q t is the quantity of energy generated at time t; T is the lifetime of the BIPV.
Further, the net present value (NPV) of cash flow can be computed using Equation (6):
N P V = R e l e c t r i c i t y , t C t 1 + r t
where r is the discount rate (%).

4. Feasibility Analysis of Building Materials

This section presents a feasibility analysis of semitransparent BIPV systems involving roof-integrated, window, and rooftop BIPVs. Figure 6 shows the structure of a semitransparent BIPV module [33]. Unlike regular PV modules, transparent materials such as resin and glass are placed between PV cells. In addition, the potential revenues and costs of electricity generation from the BIPV systems are estimated using Equation (3). After revenue estimation, the LCOE and NPV are estimated via Equations (5) and (6) to select the appropriate option for the agricultural research and development center in Fiji.
In the feasibility analysis, it is assumed that the roof-integrated PVs are installed on a colorbond steel roof, which is the most popular roofing material used in Fiji [34]. The total area of the roof of the research center is 1160 m2, with a 15° tilt.
As shown in Figure 7b, glass windows are generally used in the buildings in Fiji. According to Lee et al. [35], windows are classified based on three areas, namely daylighting, vision, and fan-coil areas, so it is possible to replace some of the windows in the vision area with semitransparent BIPVs. This study assumes that regular PV panels are used to substitute the glass windows of the research center. The total area of window installation is 112 m2 (10% of the building size), of which 50% will be replaced with semitransparent BIPVs.
In addition, rooftop PVs can be installed on a horizontal roof so that its area is 784 m2; unlike the roof-integrated BIPV, this case involves a flat roof with a 0° tilt. Although this installation size is less than that of the roof-integrated BIPV, it enables a reduction in the cost of the roofing materials. Table 6 describes the estimated costs of the installation, operation, and maintenance of the three alternatives. Note that both the roof-integrated and window BIPVs use semitransparent BIPV modules, which are 1.46 times as expensive as regular PV modules owing to their customized designs [33,36]. The concept of mass production cannot be applied to the customized design BIPVs so that they have a high production cost. The operation and maintenance costs were estimated from a previous work [37].
Table 7 illustrates the estimated electricity generated based on Equation (4) for the historical solar radiation data of Fiji from 1984 to 2019 [39]. The annual average daily solar radiation is 5.24 kWh/m2/day, with a standard deviation of 0.85 kWh/m2/day. The climate of Fiji is classified as tropical rainforest climate (Af), so it has a hot and humid tropical climate with consistent temperatures above 18 °C [40]. The roof-integrated, window, and rooftop BIPVs have different tilt angles of 15°, 90°, and 0°, respectively. Thus, the electricity generation efficiencies ( k B I P V ) of the roof-integrated BIPV (0.8526), window BIPV (0.6524), and rooftop PV (0.8553) are considered according to [27].
On average, the annual quantities of electricity generated with roof-integrated, window, and rooftop BIPVs are 307.85 kWh/m2/year, 235.56 kWh/m2/year, and 308.82 kWh/m2/year, respectively. With respect to the electricity sale price ( α t ) of USD 0.41/kWh in Fiji [41], the revenues from the three cases are USD 146,413/year, USD 5409/year, and USD 99,268/year. The LCOE values of the roof-integrated, window, and rooftop BIPVs are USD 0.13/kWh, USD 0.17/kWh, and USD 0.09/kWh, respectively.
Figure 8 shows the NPVs of the cash flows for the three cases during a lifetime of 25 years. Among the three cases, the roof-integrated BIPV is the most sensitive to discounted rates owing to its high investment cost (i.e., installation cost), and its profit becomes negative when the discount rate is greater than 0.13. Similarly, the profits from the window BIPV are negative when the discount rate exceeds 0.08; however, as the window BIPV has a small area of 56 m2, its profit is least sensitive to the discount rate. Profits from the rooftop BIPV system are negative when the discount rate exceeds 0.22, so this is the most preferable option for the target building. This result also supports the popularity of the rooftop BIPV system among the semitransparent BIPVs [42].

5. Discussion

Section 3 described the optimum layout of the agricultural research and development center in Ovalau, Fiji, under the proposed framework. CRAFT with a distance-based score was used for layout optimization such that the proposed framework enabled transportation cost reductions from USD 24,127 to USD 21,247 within the facility. In addition, material flow between the machinery and part storage spaces was the most critical for reducing the distance-based score. Because agricultural equipment and machines in the machinery storage are frequently used for farming a 5 ha space near the facility, the flow between the machinery and part storage spaces has the highest transportation cost of USD 2808.
Section 4 presents the calculated LCOE values of the roof-integrated, window, and rooftop BIPVs as USD 0.13/kWh, USD 0.17/kWh, and USD 0.09/kWh, respectively. According to [43], the range of LCOE values for a rooftop PV is between USD 0.0491/kWh and USD 0.0605/kWh; other studies have also shown LCOE values of from USD 0.039/kWh to USD 0.0680/kWh [44,45]. However, the LCOE of the proposed rooftop BIPV is slightly higher than those of rooftop PVs in other countries. Note that the rooftop BPIV is used as the basis for comparisons with other traditional PV systems. In fact, over 50% of the total imports of Fiji involving fuel, vehicles, food, and electronics are from Singapore and other countries [46], so Fiji has high installation and operation costs for PV systems. This cost issue makes it difficult to establish solar energy use in Fiji even though their government is attempting to produce about 167 GWh of solar energy by 2030, which would result in the reduction of about 148,000 metric tons of carbon dioxide (CO2) emissions [47]. Nevertheless, all of the above options provide positive profits if the discount rate is less than or equal to 0.08. In particular, the LCOE of the rooftop BIPV hs the highest productivity of the three BIPV options; this is why about 80% of BIPV products are based on rooftop PV modules even when other types of BIPVs are available (e.g., curtain wall and window BIPVs) [5]. In addition, given enough budget for investment, integrated BIPVs are good alternatives as their LCOE is only 44% higher than that of the rooftop BIPV. It is noted that there are nonmonetary values of BIPVs, such as an innovative design, sunscreen effect, a reduction in the carbon footprint of the building, thermal insulation, acoustic insulation for increased comfort, environmental friendliness, and sustainability [9]. If these values are considered, then BIPV usage is a good alternative as a building material.

6. Conclusions

In this study, the agricultural research and development center in Fiji was designed by the proposed design framework consisting of input data and activity collection, activity relationship analysis, space requirement analysis, alternative layout design, layout evaluation, final layout determination, feasibility analysis for BIPV installation, and building materials’ determination. In the framework, the optimum facility layout was identified via CRAFT by considering the minimum transportation cost within the facility. The CRAFT enabled a reduction in the total cost of an initial layout from USD 24,127 to USD 21,247. Under the identified design, three alternative BIPVs, namely, roof-integrated, window, and rooftop BIPVs, were considered as the facility materials. Note that the rooftop BIPV was used as the basis for the other two systems when using semitransparent BIPVs. From the feasibility analysis, the LCOE values of the roof-integrated, window, and rooftop BIPVs were USD 0.13/kWh, USD 0.17/kWh, and USD 0.09/kWh, respectively. These results imply that there should be further efforts to reduce the costs of BIPVs for practical implementation. In particular, owing to the inefficient productivity of the window BIPV, its profit was negative when the discount rate exceeded 0.08. However, the roof-integrated BIPV showed a reasonable LCOE even though it required the highest investment cost; for a discount rate less than or equal to 0.13, the roof-integrated BIPV would have positive profits. BIPV usage also affords other advantages, such as innovative design, sunscreen effect, power generation, a reduced carbon footprint of the building, thermal insulation, acoustic insulation for increased comfort, an increase in building value, environmental friendliness, and sustainability, which are good alternatives for renewable energy production as well as the implementation of green buildings for the future survival of mankind. As a result, the proposed framework would be expected to assist engineers in utilizing BIPVs as building materials in future.
Although this study involved a feasibility analysis of three BIPV alternatives, the feasibilities of other types of BIPVs, such as skylight, atria, shading, cladding, and curtain wall types, need to be investigated for various building construction cases. This will help identify the major factors in the practical deployment of BIPVs. Moreover, such efforts can contribute to increased renewable energy use in the future.

Author Contributions

Conceptualization, S.K. (Sojung Kim); methodology, S.K. (Sojung Kim); software, S.K. (Sojung Kim); validation, S.K. (Sojung Kim), S.K. (Sumin Kim); resources, S.K. (Sumin Kim); writing—original draft preparation, S.K. (Sojung Kim), S.K. (Sumin Kim); writing—review and editing, S.K. (Sojung Kim), S.K. (Sumin Kim); visualization, S.K. (Sojung Kim), S.K. (Sumin Kim); project administration, S.K. (Sumin Kim); funding acquisition, S.K. (Sojung Kim), S.K. (Sumin Kim). All authors have read and agreed to the published version of the manuscript.

Funding

This work was supported by a National Research Foundation of Korea (NRF) grant, funded by the Korea government (MSIT) (No. 2021R1F1A1045855). Also, it was also supported by the Korea International Cooperation Agency (KOICA) (No. P2022-00015-1) under the project entitled the project management consultant (PMC) service for Fiji agrophotovoltaic programme (GCF: green climate fund).

Institutional Review Board Statement

Not applicable.

Informed Consent Statement

Not applicable.

Data Availability Statement

Data are contained within the article.

Acknowledgments

The authors gratefully acknowledge the support of the National Research Foundation of Korea (NRF) of Korea and the Korea International Cooperation Agency (KOICA). The views expressed in this paper are solely those of the authors and do not represent the opinions of the funding agency.

Conflicts of Interest

The authors declare no conflicts of interest.

References

  1. Izam, N.S.M.N.; Itam, Z.; Sing, W.L.; Syamsir, A. Sustainable development perspectives of solar energy technologies with focus on solar Photovoltaic—A review. Energies 2022, 15, 2790. [Google Scholar] [CrossRef]
  2. IEA. Projected Costs of Generating Electricity 2020. Available online: https://www.iea.org/reports/projected-costs-of-generating-electricity-2020 (accessed on 12 August 2023).
  3. Comello, S.; Reichelstein, S. The US investment tax credit for solar energy: Alternatives to the anticipated 2017 step-down. Renew. Sustain. Energy Rev. 2016, 55, 591–602. [Google Scholar] [CrossRef]
  4. International Renewable Energy Agency. Renewable Power Generation Costs in 2021. Available online: https://www.irena.org/publications/2022/Jul/Renewable-Power-Generation-Costs-in-2021 (accessed on 19 May 2023).
  5. Shukla, A.K.; Sudhakar, K.; Baredar, P. Recent advancement in BIPV product technologies: A review. Energy Build. 2017, 140, 188–195. [Google Scholar] [CrossRef]
  6. Enkvist, P.A.; Dinkel, J.; Lin, C. Impact of the Financial Crisis on Carbon Economics: Version 2.1 of the Global Greenhouse Gas Abatement Cost Curve; McKinsey Co.: New York, NY, USA, 2010; p. 374. [Google Scholar]
  7. Yang, T.; Athienitis, A.K. A review of research and developments of building-integrated photovoltaic/thermal (BIPV/T) systems. Renew. Sustain. Energy Rev. 2016, 66, 886–912. [Google Scholar] [CrossRef]
  8. Yu, G.; Yang, H.; Luo, D.; Cheng, X.; Ansah, M.K. A review on developments and researches of building integrated photovoltaic (BIPV) windows and shading blinds. Renew. Sustain. Energy Rev. 2021, 149, 111355. [Google Scholar] [CrossRef]
  9. Debbarma, M.; Sudhakar, K.; Baredar, P. Comparison of BIPV and BIPVT: A review. Resour.-Effic. Technol. 2017, 3, 263–271. [Google Scholar] [CrossRef]
  10. Grand View Research. Building Integrated Photovoltaics Market Size Report, 2030. 2023. Available online: https://www.grandviewresearch.com/industry-analysis/building-integrated-photovoltaics-bipv-market (accessed on 2 April 2023).
  11. Prasad, N.H.; Rajyalakshmi, G.; Reddy, A.S. A typical manufacturing plant layout design using CRAFT algorithm. Procedia Eng. 2014, 97, 1808–1814. [Google Scholar] [CrossRef]
  12. Tompkins, J.A.; White, J.A.; Bozer, Y.A.; Tanchoco, J.M.A. Facilities Planning; Wiley: Hoboken, NJ, USA, 2010. [Google Scholar]
  13. Singh, S.P.; Sharma, R.R. A review of different approaches to the facility layout problems. Int. J. Adv. Manuf. Technol. 2006, 30, 425–433. [Google Scholar] [CrossRef]
  14. Melachrinoudis, E.; Min, H. Redesigning a warehouse network. Eur. J. Oper. Res. 2007, 176, 210–229. [Google Scholar] [CrossRef]
  15. Joppolo, C.M.; Romano, F. HVAC system design in healthcare facilities and control of aerosol contaminants: Issues, tools, and experiments. Indoor Air Qual. Healthc. Facil. 2017, 83–94. [Google Scholar] [CrossRef]
  16. Kovács, G. Combination of Lean value-oriented conception and facility layout design for even more significant efficiency improvement and cost reduction. Int. J. Prod. Res. 2020, 58, 2916–2936. [Google Scholar] [CrossRef]
  17. Leng, J.; Wang, D.; Shen, W.; Li, X.; Liu, Q.; Chen, X. Digital twins-based smart manufacturing system design in Industry 4.0: A review. J. Manuf. Syst. 2021, 60, 119–137. [Google Scholar] [CrossRef]
  18. Helmold, M.; Helmold, M. Seven Management Tools (M7). In Successful Management Strategies and Tools: Industry Insights, Case Studies and Best Practices; Springer: Cham, Switzerland, 2021; pp. 65–70. [Google Scholar] [CrossRef]
  19. Parmar, N.J.; James, A.T. Development of a framework for safety performance measurement of belt conveyor systems. Int. J. Product. Perform. Manag. 2023, 72, 1001–1024. [Google Scholar] [CrossRef]
  20. Xie, Y.; Gao, G.; Chen, X.A. Outlining the design space of explainable intelligent systems for medical diagnosis. arXiv 2019, arXiv:1902.06019. [Google Scholar]
  21. Kembro, J.H.; Norrman, A. Which future path to pick? A contingency approach to omnichannel warehouse configuration. Int. J. Phys. Distrib. Logist. Manag. 2021, 51, 48–75. [Google Scholar] [CrossRef]
  22. Kumanan, S.; Jegan Jose, G.; Raja, K. Multi-project scheduling using an heuristic and a genetic algorithm. Int. J. Adv. Manuf. Technol. 2006, 31, 360–366. [Google Scholar] [CrossRef]
  23. Nagy, D.; Villaggi, L.; Stoddart, J.; Benjamin, D. The buzz metric: A graph-based method for quantifying productive congestion in generative space planning for architecture. Technol. Archit. Des. 2017, 1, 186–195. [Google Scholar] [CrossRef]
  24. Hossain, M.R.; Rasel, M.K.; Talapatra, S. Increasing productivity through facility layout improvement using systematic layout planning pattern theory. Glob. J. Res. Eng. 2014, 14, 70–75. [Google Scholar]
  25. Ayvazoğluyüksel, Ö.; Filik, Ü.B. Estimation methods of global solar radiation, cell temperature and solar power forecasting: A review and case study in Eskişehir. Renew. Sustain. Energy Rev. 2018, 91, 639–653. [Google Scholar] [CrossRef]
  26. Mermoud, A. Pvsyst Version 7.1; PVsyst SA: Satigny, Switzerland, 2020. [Google Scholar]
  27. Prasad, M.; Prasad, R. Bifacial vs monofacial grid-connected solar photovoltaic for small islands: A case study of Fiji. Renew. Energy 2023, 203, 686–702. [Google Scholar] [CrossRef]
  28. Kim, S.; Meng, C.; Son, Y.J. Simulation-based machine shop operations scheduling system for energy cost reduction. Simul. Model. Pract. Theory 2017, 77, 68–83. [Google Scholar] [CrossRef]
  29. Mellit, A.; Sağlam, S.; Kalogirou, S.A. Artificial neural network-based model for estimating the produced power of a photovoltaic module. Renew. Energy 2013, 60, 71–78. [Google Scholar] [CrossRef]
  30. Kim, S.; Kim, S.; Cho, J.; Park, S.; Jarrín Perez, F.X.; Kiniry, J.R. Simulated biomass, climate change impacts, and nitrogen management to achieve switchgrass biofuel production at diverse sites in US. Agronomy 2020, 10, 503. [Google Scholar] [CrossRef]
  31. Darling, S.B.; You, F.; Veselka, T.; Velosa, A. Assumptions and the levelized cost of energy for photovoltaics. Energy Environ. Sci. 2011, 4, 3133–3139. [Google Scholar] [CrossRef]
  32. Kim, S.; Kim, S. Economic Feasibility Comparison between Building-Integrated Photovoltaics and Green Systems in Northeast Texas. Energies 2023, 16, 4672. [Google Scholar] [CrossRef]
  33. Kim, S.; Kim, S. Design of an Agrivoltaic System with Building Integrated Photovoltaic. Agronomy 2023, 13, 2140. [Google Scholar] [CrossRef]
  34. Metframe. Roofing Iron. Available online: http://www.metframe.com.fj/product_category/roofing-iron/ (accessed on 20 June 2023).
  35. Lee, H.M.; Yoon, J.H.; Kim, S.C.; Shin, U.C. Operational power performance of south-facing vertical BIPV window system applied in office building. Sol. Energy 2017, 145, 66–77. [Google Scholar] [CrossRef]
  36. WEUP Power Co., Ltd. Products. Available online: https://www.weuppower.com/ (accessed on 20 June 2023).
  37. Wiser, R.H.; Bolinger, M.; Seel, J. Benchmarking Utility-Scale PV Operational Expenses and Project Lifetimes: Results from a Survey of US Solar Industry Professionals; Lawrence Berkeley National Lab. (LBNL): Berkeley, CA, USA, 2020. [Google Scholar] [CrossRef]
  38. LG Solar Solutions. Solar Panel. Available online: https://www.lg.com/us/business/solar-panels/lg-lg405n2w-v5 (accessed on 12 August 2023).
  39. Oyewola, O.M.; Ismail, O.S.; Olasinde, M.O.; Ajide, O.O. Mapping of solar energy potential in Fiji using an artificial neural network approach. Heliyon 2022, 8, e09961. [Google Scholar] [CrossRef]
  40. Fiji Meteorological Service. The Climate of Fiji. Available online: https://www.met.gov.fj/ClimateofFiji.pdf (accessed on 12 August 2023).
  41. Energy Fiji Limited. Small Business Tariffs. Available online: https://efl.com.fj/your-business/electricity-tariffs-and-rates/small-business-tariffs/ (accessed on 12 August 2023).
  42. Frontini, F.; Bonomo, P.; Chatzipanagi, A.; Verberne, G.; van den Donker, M.; Sinapis, K.; Folkerts, W. BIPV Product Overview for Solar Facades and Roofs; Delft University of Technology: Delft, Netherlands, 2015. [Google Scholar]
  43. APEC Economic and Life Cycle Analysis of Photovoltaic System in APEC Region. Available online: https://www.apec.org/Publications/2019/04/Life-Cycle-Assessment-of-Photovoltaic-Systems-in-the-APEC-Region (accessed on 3 April 2023).
  44. Jones-Albertus, R.; Feldman, D.; Fu, R.; Horowitz, K.; Woodhouse, M. Technology advances needed for photovoltaics to achieve widespread grid price parity. Prog. Photovolt. Res. Appl. 2016, 24, 1272–1283. [Google Scholar] [CrossRef]
  45. Fu, R.; Feldman, D.J.; Margolis, R.M. US Solar Photovoltaic System Cost Benchmark: Q1 2018; National Renewable Energy Lab. (NREL): Golden, CO, USA, 2018. [CrossRef]
  46. The Cove. Fiji—Economics. Available online: https://cove.army.gov.au/article/kyr-fiji-economy (accessed on 12 August 2023).
  47. Prasad, R.D.; Raturi, A. Solar energy for power generation in Fiji: History, barriers and potentials. In Translating the Paris Agreement into Action in the Pacific; Springer: Cham, Switzerland, 2020; pp. 177–199. [Google Scholar] [CrossRef]
Figure 1. Proposed design framework of the agricultural research and development center.
Energies 17 00207 g001
Figure 2. Activity relationships and their diagram.
Energies 17 00207 g002
Figure 3. Space relationship diagram.
Energies 17 00207 g003
Figure 4. Proposed initial block layout.
Energies 17 00207 g004
Figure 5. Final block layout.
Energies 17 00207 g005
Figure 6. Semitransparent building-integrated photovoltaics (BPIVs): (a) side view; (b) top view.
Energies 17 00207 g006
Figure 7. Building materials used in Fiji: (a) colorbond steel roofs; (b) glass windows.
Energies 17 00207 g007
Figure 8. Comparisons between solar radiation and solar energy generation quantities.
Energies 17 00207 g008
Table 1. Daily material flows between areas.
OriginDestination
Machinery StorageCrop
Processing
Part StorageOfficeUtility RoomLaboratoryConference Room
Machinery storage12014426321212
Crop processing3672362424
Part storage36151212
Office1444753
Utility room82122
Laboratory68
Conference room
Table 2. Space requirements of different areas.
Area Identifier1234567
Area nameMachinery storageCrop
processing
Part storageOfficeUtility roomLaboratoryConference room
Size (m2)2801546620022012080
Table 3. Distance matrix of the initial block layout.
OriginDestination
Machinery StorageCrop
Processing
Part StorageOfficeUtility RoomLaboratoryConference Room
Machinery storage15.519.523.012.537.039.0
Crop processing15.510.038.528.046.554.5
Part storage19.510.016.532.056.546.5
Office23.038.516.510.514.016.0
Utility room12.528.032.010.524.526.5
Laboratory37.046.556.514.024.510.0
Conference room39.054.546.516.026.510.0
Table 4. Cost matrix of the initial block layout.
OriginDestination
Machinery StorageCrop
Processing
Part StorageOfficeUtility RoomLaboratoryConference Room
Machinery storage18602808598400444468
Crop processing3602772100811161308
Part storage594480678558
Office1512658848
Utility room20092968
Laboratory680
Conference room
Table 5. Cost matrix of the final layout.
OriginDestination
Machinery StorageCrop
Processing
Part StorageOfficeUtility RoomLaboratoryConference Room
Machinery storage18602808598400444468
Crop processing3602772100811161308
Part storage594480678558
Office1512658848
Utility room20092968
Laboratory680
Conference room
Table 6. Installation, operation, and maintenance costs of the BIPV options.
CategoryBIPV Installation Alternatives
Roof-Integrated BIPV 3Window BIPV 3Rooftop BIPV 4
Size (m2)116056784
Capacity (kWp)22711153
Installation cost1,184,78257,196548,458
Operations (USD/year) 11791861210
Maintenance (USD/year) 2120158812
1 Values include operation and other (e.g., ancillary services) costs [37]; 2 values include preventive and corrective maintenance costs [37]; 3 semitransparent BIPVs are considered [36]; 4 regular PVs are considered [38].
Table 7. Historical solar radiation data of Fiji from 1984 to 2019.
MonthSolar Radiation (kWh/m2/day)Electricity Generated (kWh/m2/day)
MaxMinAvgStdRoof-Integrated BIPVWindow BIPVRooftop BIPV
Jan.6.625.676.170.360.860.330.83
Feb6.345.365.890.360.890.340.87
Mar.5.714.995.450.260.900.350.87
Apr.5.094.404.780.230.840.320.82
May4.634.004.260.210.780.300.75
Jun.4.343.703.940.230.750.290.72
Jul.4.613.914.170.250.770.300.74
Aug.5.114.324.670.270.830.320.80
Sep.5.704.895.280.270.890.340.86
Oct.6.265.425.890.290.890.340.87
Nov.6.495.616.140.340.860.330.84
Dec.6.705.726.240.380.840.330.82
Disclaimer/Publisher’s Note: The statements, opinions and data contained in all publications are solely those of the individual author(s) and contributor(s) and not of MDPI and/or the editor(s). MDPI and/or the editor(s) disclaim responsibility for any injury to people or property resulting from any ideas, methods, instructions or products referred to in the content.

